Article

Evaluation of Acceptance Capacity of Distributed Generation in Distribution Network Considering Carbon Emission

1
Xiamen Power Supply Company, State Grid Fujian Electric Power Co., Ltd., Xiamen 361004, China
2
Fuzhou Power Supply Company, State Grid Fujian Electric Power Co., Ltd., Fuzhou 350009, China
3
School of Electrical Engineering, Zhejiang University, Hangzhou 310027, China
*
Author to whom correspondence should be addressed.
Energies 2022, 15(12), 4406; https://doi.org/10.3390/en15124406
Submission received: 11 May 2022 / Revised: 9 June 2022 / Accepted: 15 June 2022 / Published: 16 June 2022
(This article belongs to the Special Issue Optimal Operation and Control of Energy System and Power System)

Abstract

:
Under the background of renewable-dominated electric power system construction, the penetration rate of low-carbon and renewable distributed generation (DG) in distribution network is increasing, which has changed the form and operation mode of the distribution network. To deal with the output fluctuation of high penetration DG in the distribution network operations, it is necessary to evaluate the acceptance capacity of DG. The correct evaluation can realize the secure, economic and low-carbon configuration of DG. In this paper, an evaluation method of acceptance capacity of DG in the distribution network considering the carbon emission is proposed. Firstly, a multi-objective evaluation model of acceptance capacity of DG is constructed with the objectives of minimizing carbon emission in the full life cycle, minimizing node voltage deviation and maximizing line capacity margin. Secondly, the improved non-dominated sorting genetic algorithm II (NSGA-II) is employed to solve the model to determine the Pareto optimal solutions of DG configuration. Then, the comprehensive index of acceptance capacity evaluation is obtained based on entropy weight method to decide the optimal compromise solution. Finally, an actual 55-bus distribution network in China is used to verify the effectiveness of the proposed method. The simulation results show that the proposed evaluation method can comprehensively obtain the optimal compromise solution considering the reliability, economy and carbon emission benefits of distribution network operation, which guides the DG configuration in the distribution network.

1. Introduction

With the increase of carbon dioxide emissions, the earth’s average temperature is rising and the environment is deteriorating. In order to curb climate deterioration, it is urgent for all countries to alleviate the greenhouse effect by reducing carbon dioxide emissions [1]. In 2019, China’s carbon emission is 11.3 billion tons, 86.7% of which came from the energy sector. The carbon emission of the power industry is 4.2 billion tons, accounting for 37.2% of the national carbon emission. At the Climate Ambition Summit on 12 December 2020, China proposed to achieve the goal of carbon peaking by 2030 and carbon neutrality by 2060, which further promotes China’s carbon emission reduction [2]. The low-carbon transformation of the power industry has provided an important force for the completion of the carbon peak and carbon neutrality revolution.
The traditional power system development mainly considers the two dimensions of security and economy [3,4]. Under the requirements of the carbon emission reduction, the construction of renewable-dominated electric power systems needs to take low carbon emission into account in each key link [5]. The power system should change from a high-carbon one to a low-carbon or even a zero-carbon one on the premise of meeting the requirements of economic development. At present, many research works have combined the construction of renewable-dominated electric power systems with carbon emission evaluation [6], carbon trading market [7], carbon footprint [8] and other research to promote the low-carbon level in all links of the power system. In [9], the impacts of carbon tax on the demand side and supply side participants of the power system are analyzed, which provides guidance for the formulation of carbon emission policy. In [10], four specific indicators based on the concept of carbon emission flow are proposed to realize the quantitative analysis of carbon emission in the process of power transmission. In [11], a low-carbon economic dispatching model considering power to gas (P2G) and carbon capture technology is presented, which effectively reduces the carbon emission of the distribution network. In [12], the carbon emission cost of the substation is introduced into the objective function of a two-stage stochastic expansion planning model for the distribution network, which decides the configuration scheme of line, substation, DG and electric vehicle charging stations. The above research provides important references for research on low-carbon planning of power systems. However, references [6,7,8,9,10,11,12] mainly focus on the carbon emission of the power system in the operation stage and do not consider the comprehensive carbon emission of power equipment in the full life cycle of manufacturing, installation, production, operation, maintenance and recycling [13]. To solve this problem, [14] represents the evaluation method of carbon emission benefits of wind power generation and energy storage systems (ESS) in the full life cycle and analyzes the impacts of wind power generation and ESS on the low-carbon planning of distribution network. Nevertheless, ref. [14] only discusses wind power generation without considering photovoltaics in the distribution network. In [15], an evaluation method of carbon emission flow in the full life cycle of the distribution network considering network loss is proposed, and the directed graph of carbon emission footprint is drawn for a more intuitive display. However, ref. [15] only considers the evaluation of carbon emission, while the application of carbon emission in distribution network planning is not presented.
Renewable energy, such as solar energy and wind energy, is a kind of environment-friendly energy that can support social and economic development [16,17]. By the end of 2020, the total installed capacity of renewable energy power generation in China has reached 930 million kW, accounting for 42.4% of the total installed capacity of power generation [18]. In the future, renewable energy will replace traditional fossil energy to provide basic power and promote the low-carbon process of the power industry. Renewable energy is mainly connected to the distribution network in the form of distributed photovoltaic generation and distributed wind generation. Before planning, it is necessary to evaluate the acceptance capacity of the regional distribution network for distributed photovoltaic generation and distributed wind generation, which provides guidance for the access of DG in the distribution network. References [19,20] analyze the acceptance capacity of DG in the active distribution network under DG output scenarios with different probability distributions based on the Monte Carlo simulation method. In [21], the point estimation method and inverse Nataf transformation are used to investigate the impact of correlated uncertainties of wind speeds and load on the acceptance capacity of DG. In [22], an evaluation model of acceptance capacity of DG in the distribution network considering the active adjustment through a static VAr compensator (SVC) and on-load tap changer (OLTC) is proposed. In [23], the acceptance capacity of DG in the distribution network is calculated, considering the phase mutual inductance and the line losses, which avoids steady-state voltage and current violations. In [24], a robust optimization model of acceptance capacity evaluation of DG is proposed, considering three-phase power flow in the distribution network. The maximum penetration level and the planning scheme of DG is obtained through solving the robust model with a three-step optimization algorithm, which enhances the accuracy of DG capacity assessment results. The models proposed in references [19,20,21,22,23,24] are optimization models with the maximum DG acceptance capacity as the objective function. The voltage deviation, voltage fluctuation and other operation requirements of the distribution network are reflected in the constraints of the models. Aimed at minimizing network loss, minimizing voltage deviation and maximizing voltage stability index [25,26], respectively, use I-DBEA and an improved Harris Hawks algorithm to solve the multi-objective planning model to evaluate the acceptance capacity of DG. The studies [19,20,21,22,23,24,25,26] mainly focus on the acceptance capacity evaluation of DG, while the impact of distributed photovoltaic generation and distributed wind generation on the carbon emission of the distribution network is not discussed.
In order to promote the low-carbon transformation, an evaluation method of acceptance capacity of DG in the distribution network considering carbon emission is presented in this paper. Firstly, a multi-objective evaluation model of the acceptance capacity of DG is built. Secondly, the model is solved with the improved NSGA-II and the CPLEX Optimizer. The improved NSGA-II is used to find the Pareto frontier solution set of the maximum DG access scheme. The CPLEX Optimizer is used to solve the optimal power flow (OPF) problems under each operation scenario for calculating the particle fitness. Then, based on the distribution of Pareto frontier solutions, the weight of each sub-objective function is obtained through the entropy weight method. By calculating the comprehensive index of acceptance capacity evaluation, the optimal DG configuration scheme and the maximum acceptance capacity of the distribution network are decided. Finally, the proposed method is demonstrated in an actual 55-bus system. The main contributions of this paper are as follows:
(1)
The carbon emission is innovatively quantified as one of the sub-objectives of the acceptance capacity evaluation model of DG. The proposed model aims to minimize the carbon emission in the full life cycle, minimize the node voltage deviation and maximize the line capacity margin, which comprehensively considers the reliable, economic and low-carbon operation requirements of the distribution network with high penetration renewable energy access.
(2)
An improved NSGA-II is used to solve the proposed multi-objective optimization model. By selecting the compromise optimal solution from the Pareto optimal solution set, the compromise optimal solution, including the location and capacity decisions of the candidate DG, obtained better performance.

2. Multi-Objective Evaluation Model of Acceptance Capacity of DG in Distribution Network Considering Carbon Emission

2.1. Objective Function

Since the randomness and volatility of DG output increase as the capacity increases, the operation scenarios of distribution networks tend to be diversified, which directly affects the evaluation results [27]. As the traditional capacity evaluation for power system generation only considers the peak scenario in one year and the security and stability of distribution network operation [28], it is necessary to take the multi-type scenarios, which are based on the uncertain load curves and generation output curves into consideration in DG planning [29]. On the one hand, DG access should meet the power quality requirements of the distribution network. Problems, such as harmonic injection, voltage deviation, voltage imbalance, voltage fluctuation and voltage flicker, can be prevented after large-scale DGs are connected to the distribution network [30]. On the other hand, the DG access scheme needs to make sure that the target distribution network has flexible transfer capacity, which means that the distribution network can optimize the operation mode according to the operation demand at any time. In addition, in order to promote the full consumption and efficient utilization of DG, the effect of distributed photovoltaic generation and distributed wind generation access to the distribution network on the low-carbon transformation should be discussed. It is necessary to analyze the carbon emission of the distribution network throughout the full life cycle, which can be reflected in the objective function of the evaluation model.
In this paper, a multi-objective evaluation model of the acceptance capacity of DG in the distribution network is established, aiming at minimizing carbon emissions throughout the full life cycle, minimizing node voltage deviation and maximizing line capacity margins. The operation problems in the distribution network with DG under different operation scenarios are analyzed through optimal power flow (OPF) calculation. The operation problem is solved with CPLEX Optimizer considering the power flow constraints, node voltage constraints, line transmission capacity constraints, DG output constraints and load loss constraints.

2.1.1. Minimizing Carbon Emission in the Full Life Cycle

Compared with fossil fuel power generation, wind power and photovoltaic generation are not supposed to produce carbon emissions in the process of operation. However, they still produce non-negligible carbon emissions in the process of manufacturing and production. Based on the carbon emission coefficient of wind power, photovoltaic and coal-fired power generation, the objective function f1 of carbon emission of power generation in full life cycle is expressed as:
min f 1 = s Ω s p s t T ( m Ω W T R W T P m , t , s W T Δ t + n Ω P V R P V P n , t , s P V Δ t + i Ω G N G R G P i , t , s G Δ t )
where Ωs, T, ΩWT, ΩPV and ΩG are the sets of operation scenario, daily scheduling period, distributed photovoltaic generation, distributed wind generation and power source of the superior power grid, respectively. ps is the probability of the scenario s. RWT, RPV and RG are carbon emission coefficients in the full life cycle of distributed wind generation, distributed photovoltaic generation and coal-fired power generation, respectively. P m , t , s W T , P m , t , s P V and P m , t , s G are the output active power of distributed wind generation, distributed photovoltaic generation and power source of the superior power grid in the scheduling period t of node m under scenario s, respectively. Δt is the length of unit scheduling period.

2.1.2. Minimizing Node Voltage Deviation

After the DG is connected to the distribution network, the traditional distribution network with passive and unidirectional power flow becomes the new distribution network with active and bidirectional power flow. When the output of DG increases, the transmission power decreases. If the access capacity of DG is too large, the power reverse transmission may even occur, and the increase of node voltage will cause overvoltage problems and reduce power quality. Therefore, the objective function f2 of node voltage deviation is expressed as:
min f 2 = s Ω s p s t T m Ω n o d e ( P m , t , s n o d e P m , t , s W T P m , t , s P V I m n , t , s 2 U m , 0 2 )
where Ωnode is the set of nodes. Um,0 is the rated voltage of node m. Imn,t,s is the current flowing through line mn in scheduling period t under scenario s.

2.1.3. Maximizing Line Capacity Margin

Due to the large-scale access of DG to the distribution network and the rapid growth of load, the peak valley difference of the distribution network load increases gradually, which obviously may change the operation mode. It is necessary to ensure that the distribution network has good adaptability in order to meet the flexibility requirements by leaving a certain line capacity margin. Therefore, the objective function f3 of line capacity margin is expressed as:
max f 3 = s Ω s p s t T ( m , n ) Ω n o d e ( I m n , max I m n , t , s I m n , max )
where Imn,max is the maximum allowable transmission current of line mn.

2.2. Constraints

The constraints of the proposed multi-objective evaluation model include power flow constraints, node voltage constraints, line transmission capacity constraints, DG output constraints and load loss constraints.

2.2.1. Power Flow Constraints

The AC power flow constraints of distribution network with DG are expressed as follows:
P m , t , s = U m , t , s n Ω m n o d e U n , t , s ( G m n cos θ m n + B m n sin θ m n )   m Ω n o d e , t T , s Ω s
P m , t , s = P m , t , s G + P m , t , s W T + P m , t , s P V + P m , t , s l o s s P m , t , s n o d e   m Ω n o d e , t T , s Ω s
Q m , t , s = U m , t , s n Ω m n o d e U n , t , s ( G m n cos θ m n B m n sin θ m n )   m Ω n o d e , t T , s Ω s
Q m , t , s = Q m , t , s G + Q m , t , s W T + Q m , t , s P V + Q m , t , s l o s s Q m , t , s n o d e   m Ω n o d e , t T , s Ω s
where Ω m n o d e is the node set connected to node m. P m , t , s n o d e and P m , t , s l o s s are the active power of load and energy not supply at node m in scheduling period t, respectively. Q m , t , s W T , Q m , t , s P V , Q m , t , s G , Q m , t , s n o d e and Q m , t , s l o s s are the reactive power of distributed wind generation, distributed photovoltaic generation, power source of the superior power grid, load and energy not supplied in the scheduling period t of node m under scenario s, respectively. Um,t,s and Un,t,s are the voltage of node m and n in scheduling period t under scenario s, respectively. Gmn and Bmn are the conductance and susceptance of line mn, respectively. θmn is the voltage phase difference between node m and node n.

2.2.2. Node Voltage Constraints

The node voltage amplitude at any time should meet the constraints of upper and lower voltage limits for the secure operation, which is expressed as:
U m , min U m , t , s U m , max   m Ω n o d e , t T , s Ω s
where Um,max and Um,min are the upper and lower voltage limits of node n, respectively.

2.2.3. Line Transmission Capacity Constraints

In order to avoid line overload, the active power flowing through the line should not exceed the transmission capacity of the line, which is represented as:
P m n , t , s min P m n , t , s P m n , t , s max   m Ω n o d e , n Ω m n o d e , t T , s Ω s
where P m n , t , s min and P m n , t , s max are the upper and lower limits of the active power flowing through line mn in the scheduling period t under scenario s, respectively.

2.2.4. DG Output Constraints

The actual output of DG is constrained by the installed capacity and the maximum allowable wind power and photovoltaic abandonment rate, which are represented as:
( 1 α P V ) P max , m , t , s P V P m , t , s P V P max , m , t , s P V   m Ω n o d e , t T , s Ω s
( 1 α W T ) P max , m , t , s W T P m , t , s W T P max , m , t , s W T   m Ω n o d e , t T , s Ω s
Q min , m , t , s P V Q m , t , s P V Q max , m , t , s P V   m Ω n o d e , t T , s Ω s
Q min , m , t , s W T Q m , t , s W T Q max , m , t , s W T   m Ω n o d e , t T , s Ω s
where αPV and αWT are the maximum allowable abandonment rate of wind power and photovoltaic, respectively.

2.2.5. Load Loss Constraints

To ensure the reliability of power supply, the energy not supplied should not exceed the limit value, which is expressed as:
0 P m , t , s l o s s β P m , t , s n o d e   m Ω n o d e , t T , s Ω s
where β is the maximum energy not supplied rate.

3. Solving Process of Acceptance Capacity Evaluation of DG in Distribution Network Based on Improved NSGA-II

The solving process of the proposed evaluation model consists of two successive phases. First, the Pareto frontier solution set of the acceptance capacity is obtained by the proposed improved non-dominated sorting genetic algorithm II (NSGA-II). Then, the entropy weight method is used to obtain the comprehensive index value of the acceptance capacity. After sorting all Pareto frontier solutions according to the comprehensive index value, the compromise optimal solution is obtained, which can be used to determine the maximum acceptance capacity of DG.

3.1. Phase I: The Acquirement of the Pareto Frontier Solution Set with NSGA-II for Acceptance Capacity Evaluation of DG

The acceptance capacity evaluation of DG in the distribution network presented in this paper belongs to a multi-objective optimization problem. Under different distribution network scenarios, the importance of each objective changes dynamically. Different objectives may have conflicts in the optimization process. The improved NSGA-II is used to solve the proposed model, which cannot be solved by the traditional single-objective optimization method. According to the improved NSGA-II based on the Pareto optimal concept, the individuals are layered and sorted according to the dominant relationship before selecting genetic operators. The congestion comparison operator and the elite strategy are introduced to obtain new offspring by selecting the operator with high congestion and competing with the offspring and parents. The improved NSGA-II has the advantages of fast solution speed and good population diversity. At the same time, in order to prevent the optimal solution generated in the process of evolution from being destroyed by crossover and mutation, the proposed algorithm sets up a Pareto optimal solution set to store the Pareto optimal solution and uses the solution to find the optimal compromise solution. Based on the improved NSGA-II, the solving process for the Pareto frontier solution set of the evaluation of the acceptance capacity of DG in distribution network is as follows:
  • Input the distribution network topology information and parameters and set k = 1;
  • Initialize the parent population of DG access scheme;
  • Calculate the carbon emission in the full life cycle, the node voltage deviation and the line capacity margin of each parent population;
  • Use NSGA-II to sort the parent population;
  • Use the tournament method to screen the parent population;
  • Cross and mutate the screened parent population to obtain the offspring population;
  • Calculate the carbon emissions of the full life cycle (f1), the node voltage deviation (f2) and the line capacity margin (f3) of the k-th generation population of DG access scheme;
  • Merge the parent and offspring populations of the k-th generation DG access scheme;
  • Use the improved NSGA-II and congestion calculation to sort the merged k-th generation DG access scheme;
  • Screen the merged k-th generation DG access scheme with the elite strategy to obtain the k+1-th generation population and set k = k + 1;
  • Update the Pareto optimal solution set according to the dominant relationship between the corresponding objective function values of each particle in the population;
  • If k reaches the maximum number of iterations, output the Pareto optimal solution set of the acceptance capacity evaluation of DG; otherwise, turn to Step 6.

3.2. Phase II: The Determination of the Optimal Compromise Solution with the Entropy Weight Method for the Acceptance Capacity Evaluation of DG

In order to determine the optimal compromise solution from multiple solutions, the entropy weight method is employed in this section. Since the sub-objectives proposed in this paper are evaluation indexes with different dimensions, the objective functions of the Pareto frontier solution set need to be standardized. On the one hand, the carbon emissions throughout the full life cycle and the node voltage deviation belong to the cost objective function. The smaller the value of the objective function, the better the corresponding index. On the other hand, the line capacity margin belongs to the benefit objective function. The larger the objective function, the better the corresponding index. Therefore, the presented three sub-objectives need different standardization according to their types. For the r-th Pareto optimal solution, the standardization formula of cost and benefit objective functions gr are presented as:
g r = { f max f r f max f min f r f min f max f min
In order to obtain the Pareto optimal solution for the acceptance capacity evaluation of DG, it is necessary to calculate the comprehensive index of the three sub-objectives. The entropy weight method is used to determine the weight of each sub-objective in the comprehensive index: the greater the dispersion of the value of the sub-objective, the greater the entropy of the sub-objective, which means that the impact of the index on the comprehensive evaluation is greater. The entropy weight method can adaptively distinguish the importance of each sub-target, which makes the weighting more objective. For the Pareto optimal solution set with Y objective functions and R solutions, the entropy of the y-th objective function Ψ y can be obtained by Equation (16), which is expressed as:
Ψ y = { 1 ln R j = 1 N ( ψ r y ln ψ r y ) ψ r y 0 0 ψ r y = 0
where ψ r y = g r y / r = 1 R g r y .
The Pareto frontier solution with the maximum comprehensive index value Gr is the optimal compromise solution for DG access. The maximum comprehensive index value Gr is expressed as:
G r = i = 1 M Π y g r y
The optimal compromise solution comprehensively considers the requirements of secure operation, good flexibility and low carbon emission of the distribution network. The total capacity of the connected DG is the maximum capacity for DG of the regional distribution network.

3.3. Model Solving Process

The flowchart of the proposed evaluation model of acceptance capacity of DG is shown in Figure 1.

4. Case Study

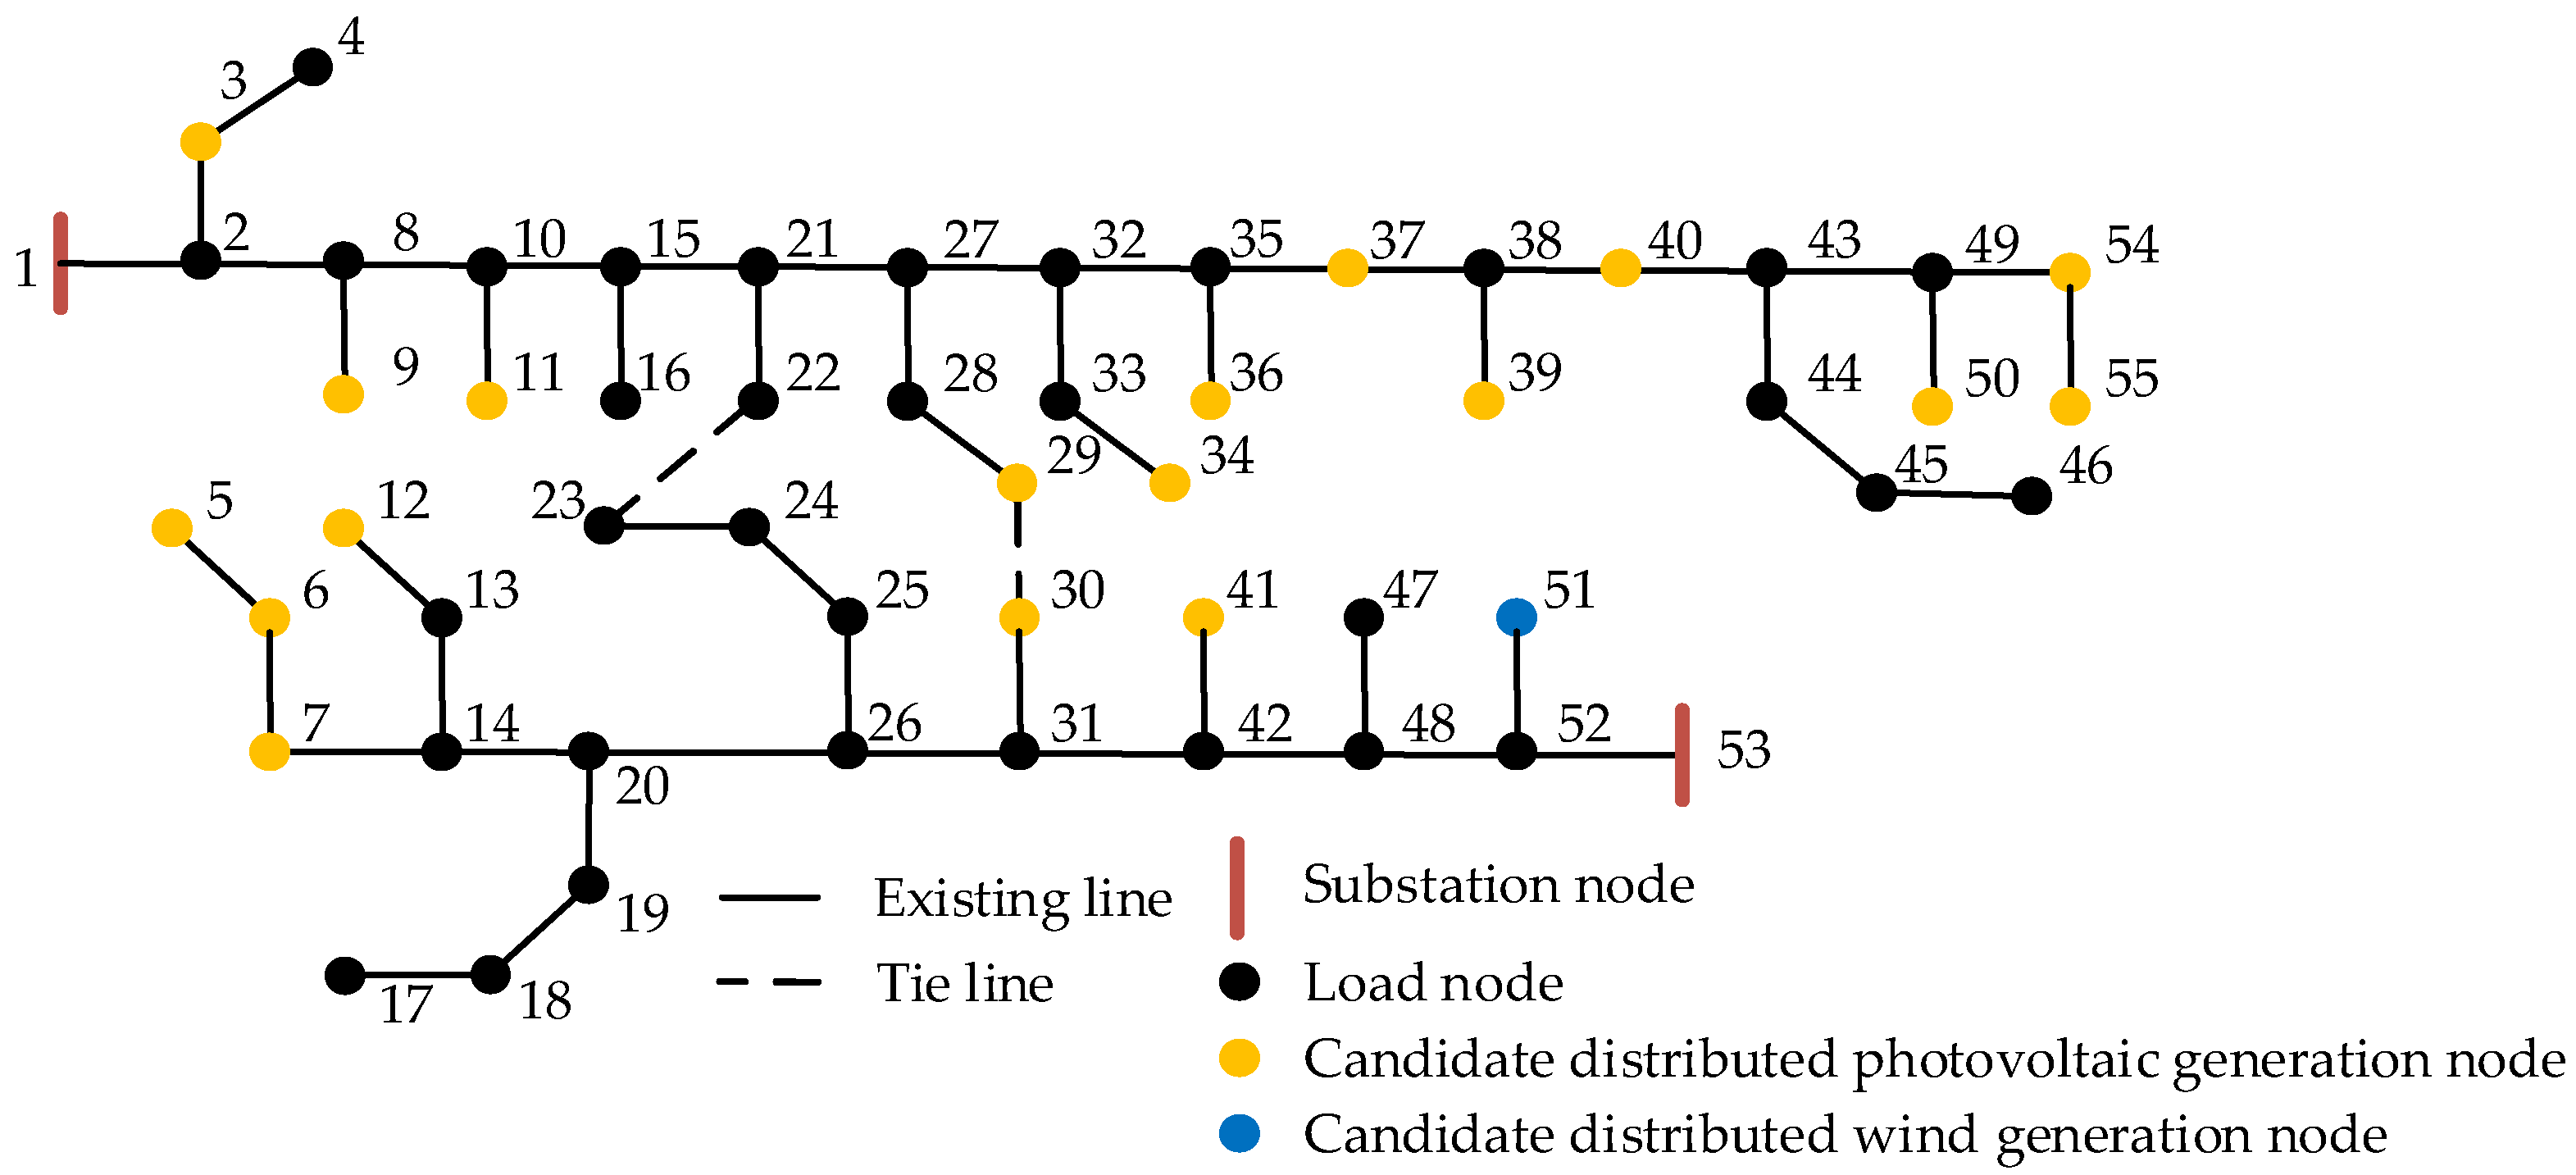
An actual 20 kV 55-bus distribution network is used to illustrate the effectiveness of the proposed model. The topology of the distribution network is shown in Figure 2, including 2 substation nodes, 53 load nodes and 53 lines. The candidate nodes for distributed photovoltaic generation configuration consist of nodes 3, 5–7, 9, 11, 12, 29, 30, 34, 36, 37, 39–41, 50, 54 and 55. The candidate node for the distributed wind generation configuration is node 51.
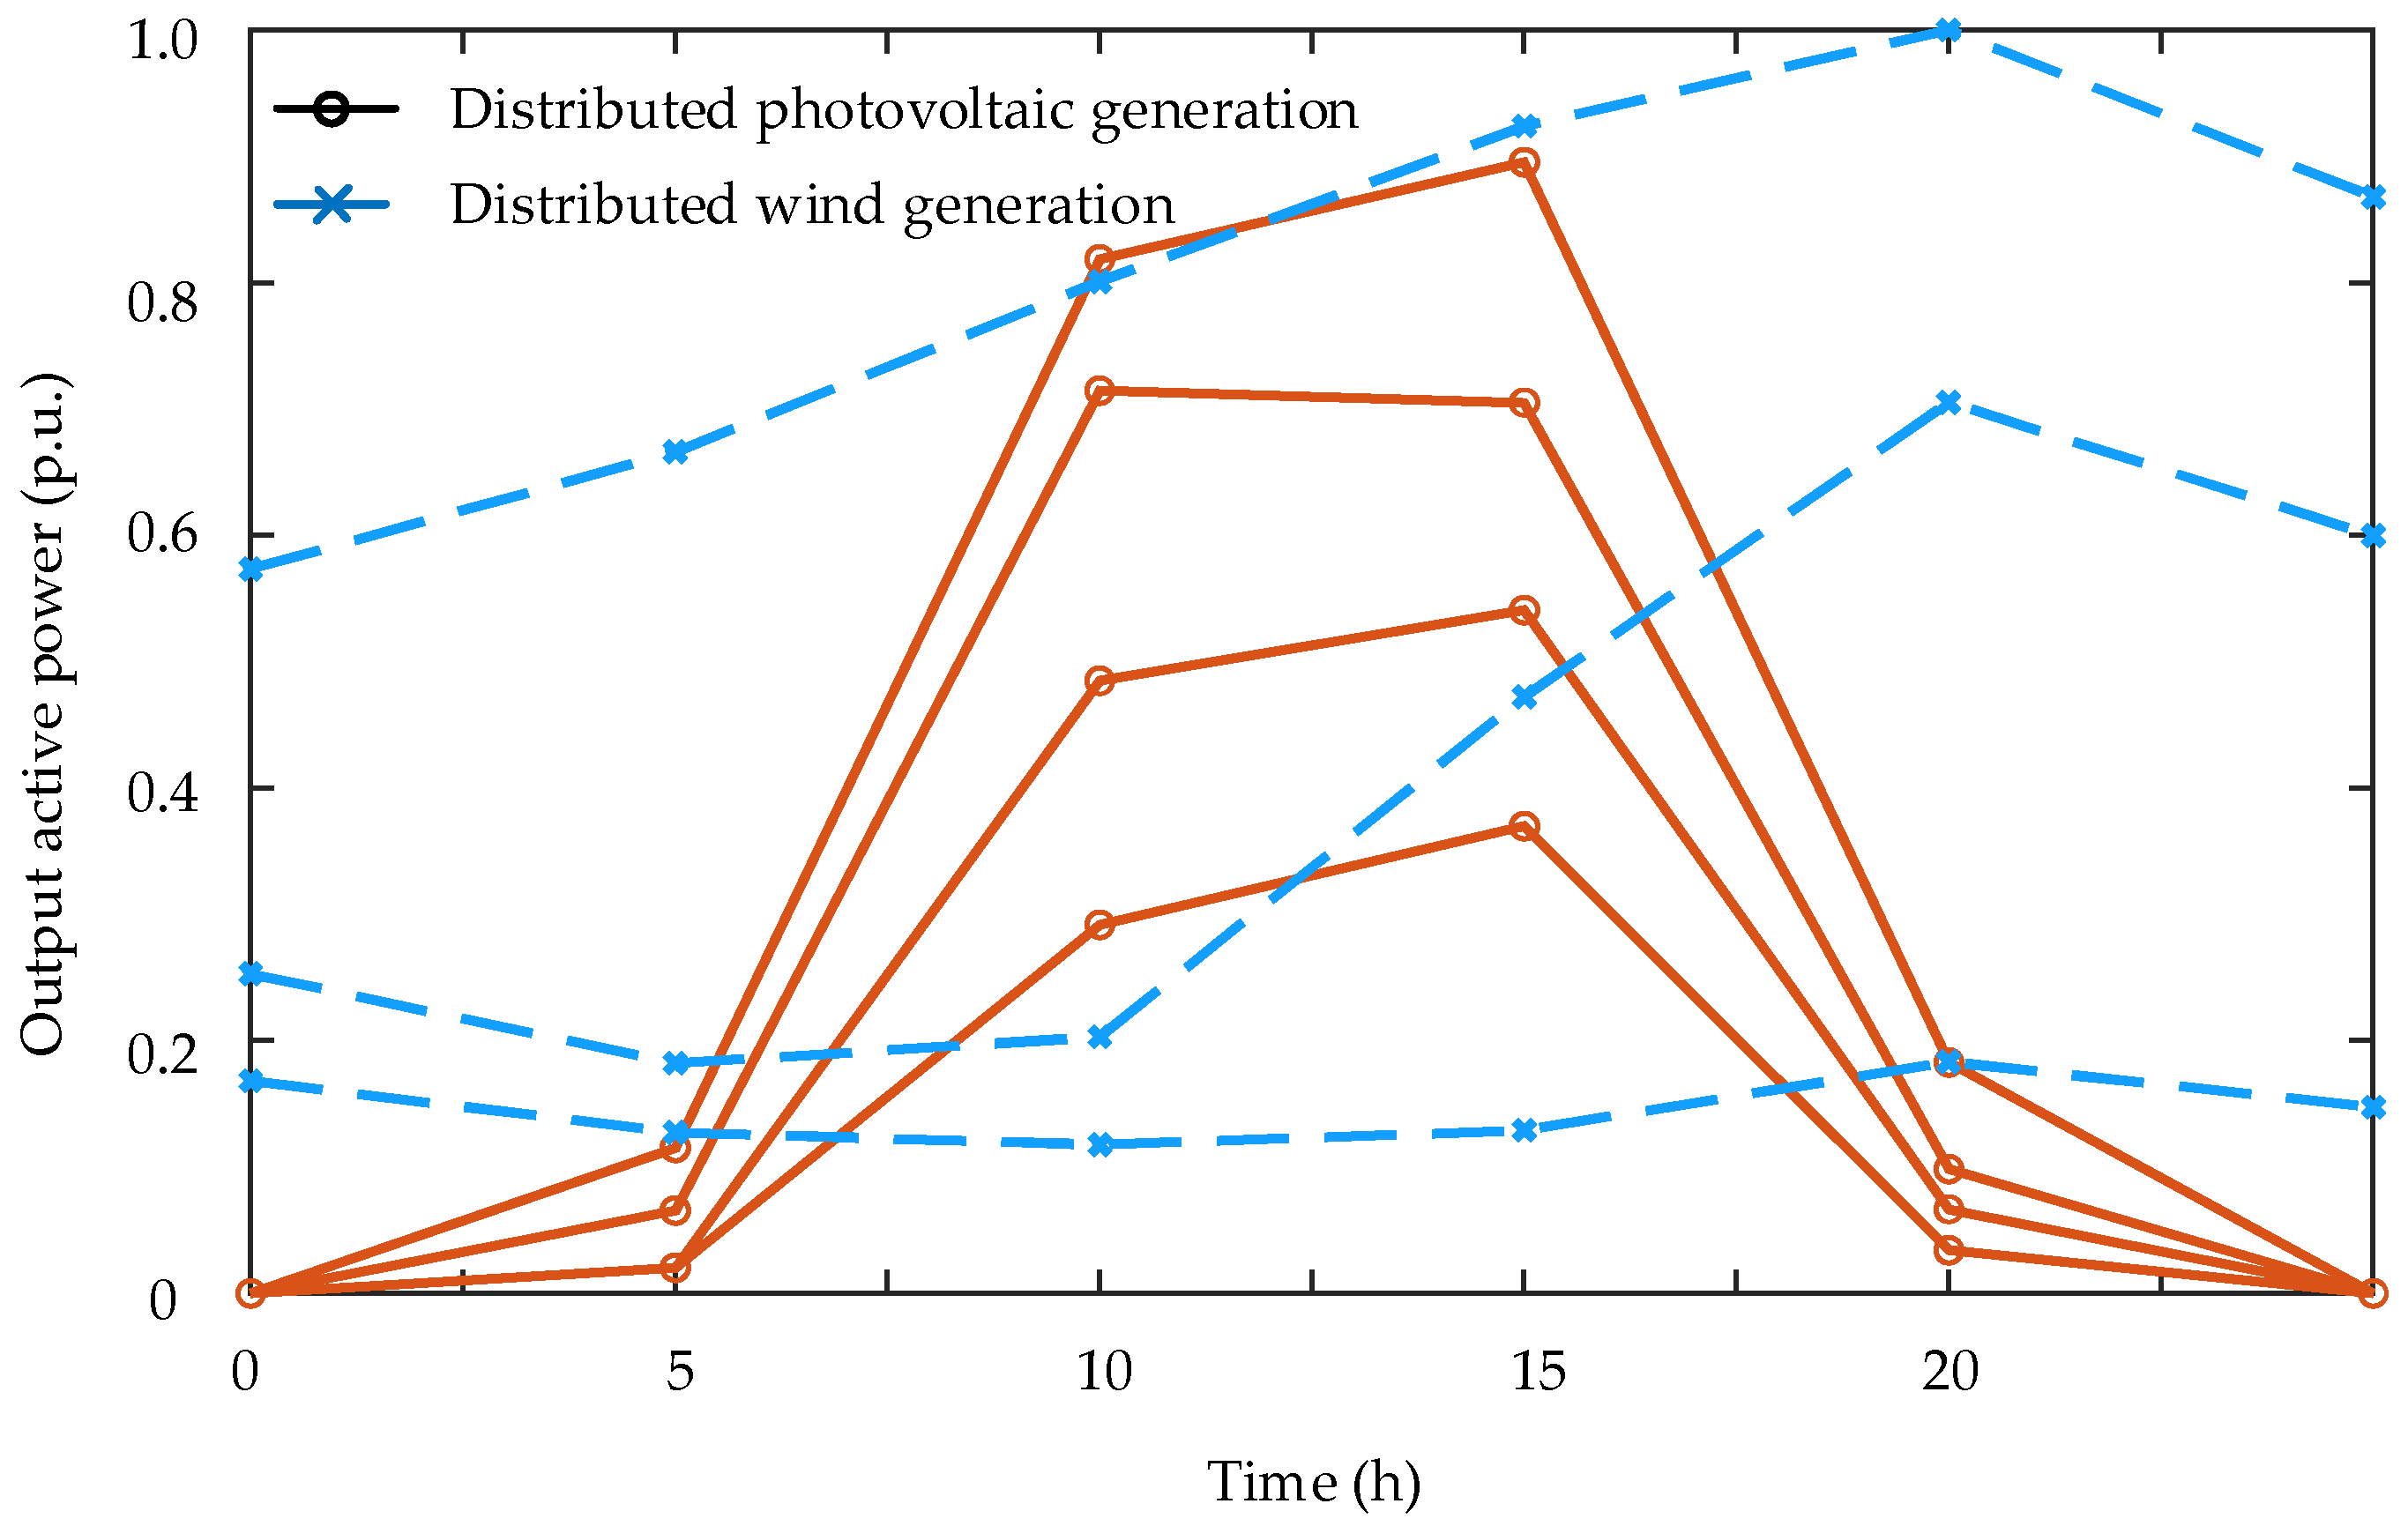
The evaluation model takes the actual distributed photovoltaic generation, distributed wind generation output and load curves of the region into consideration. Based on three distributed wind generation output curves and four distributed photovoltaic generation output curves, 12 daily operation scenarios are formed. Each daily operation scenario includes six scheduling periods. The output curves after standardization are shown in Figure 3.
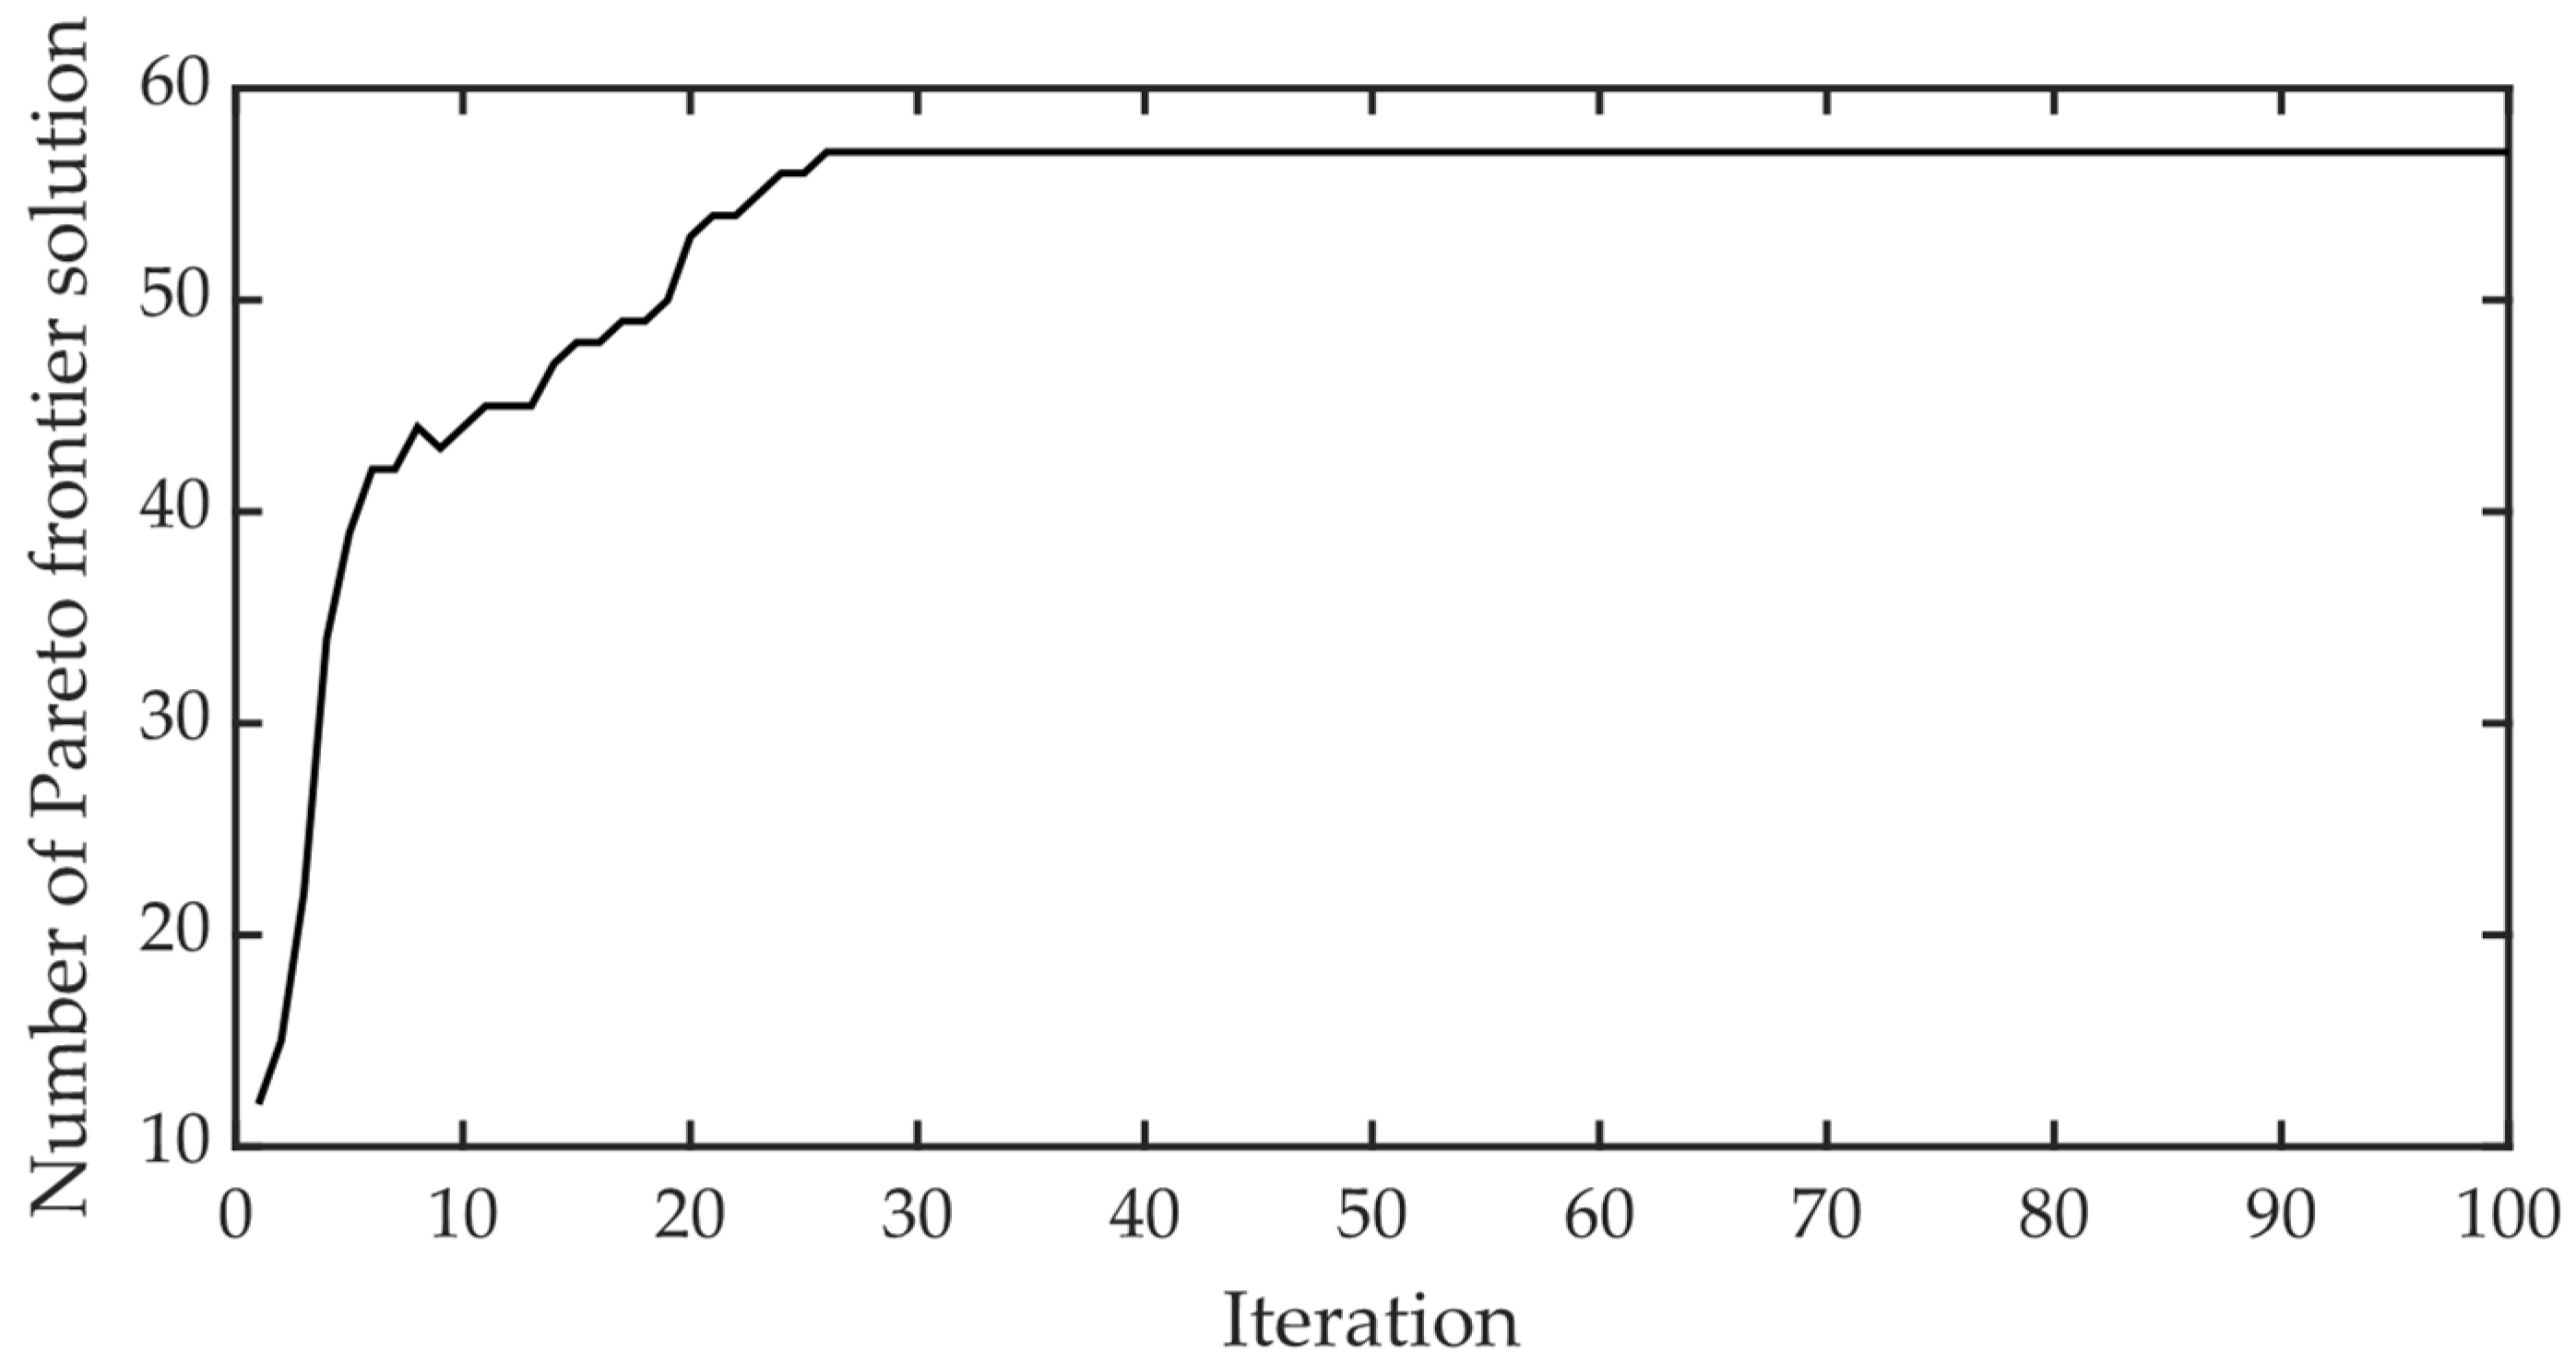
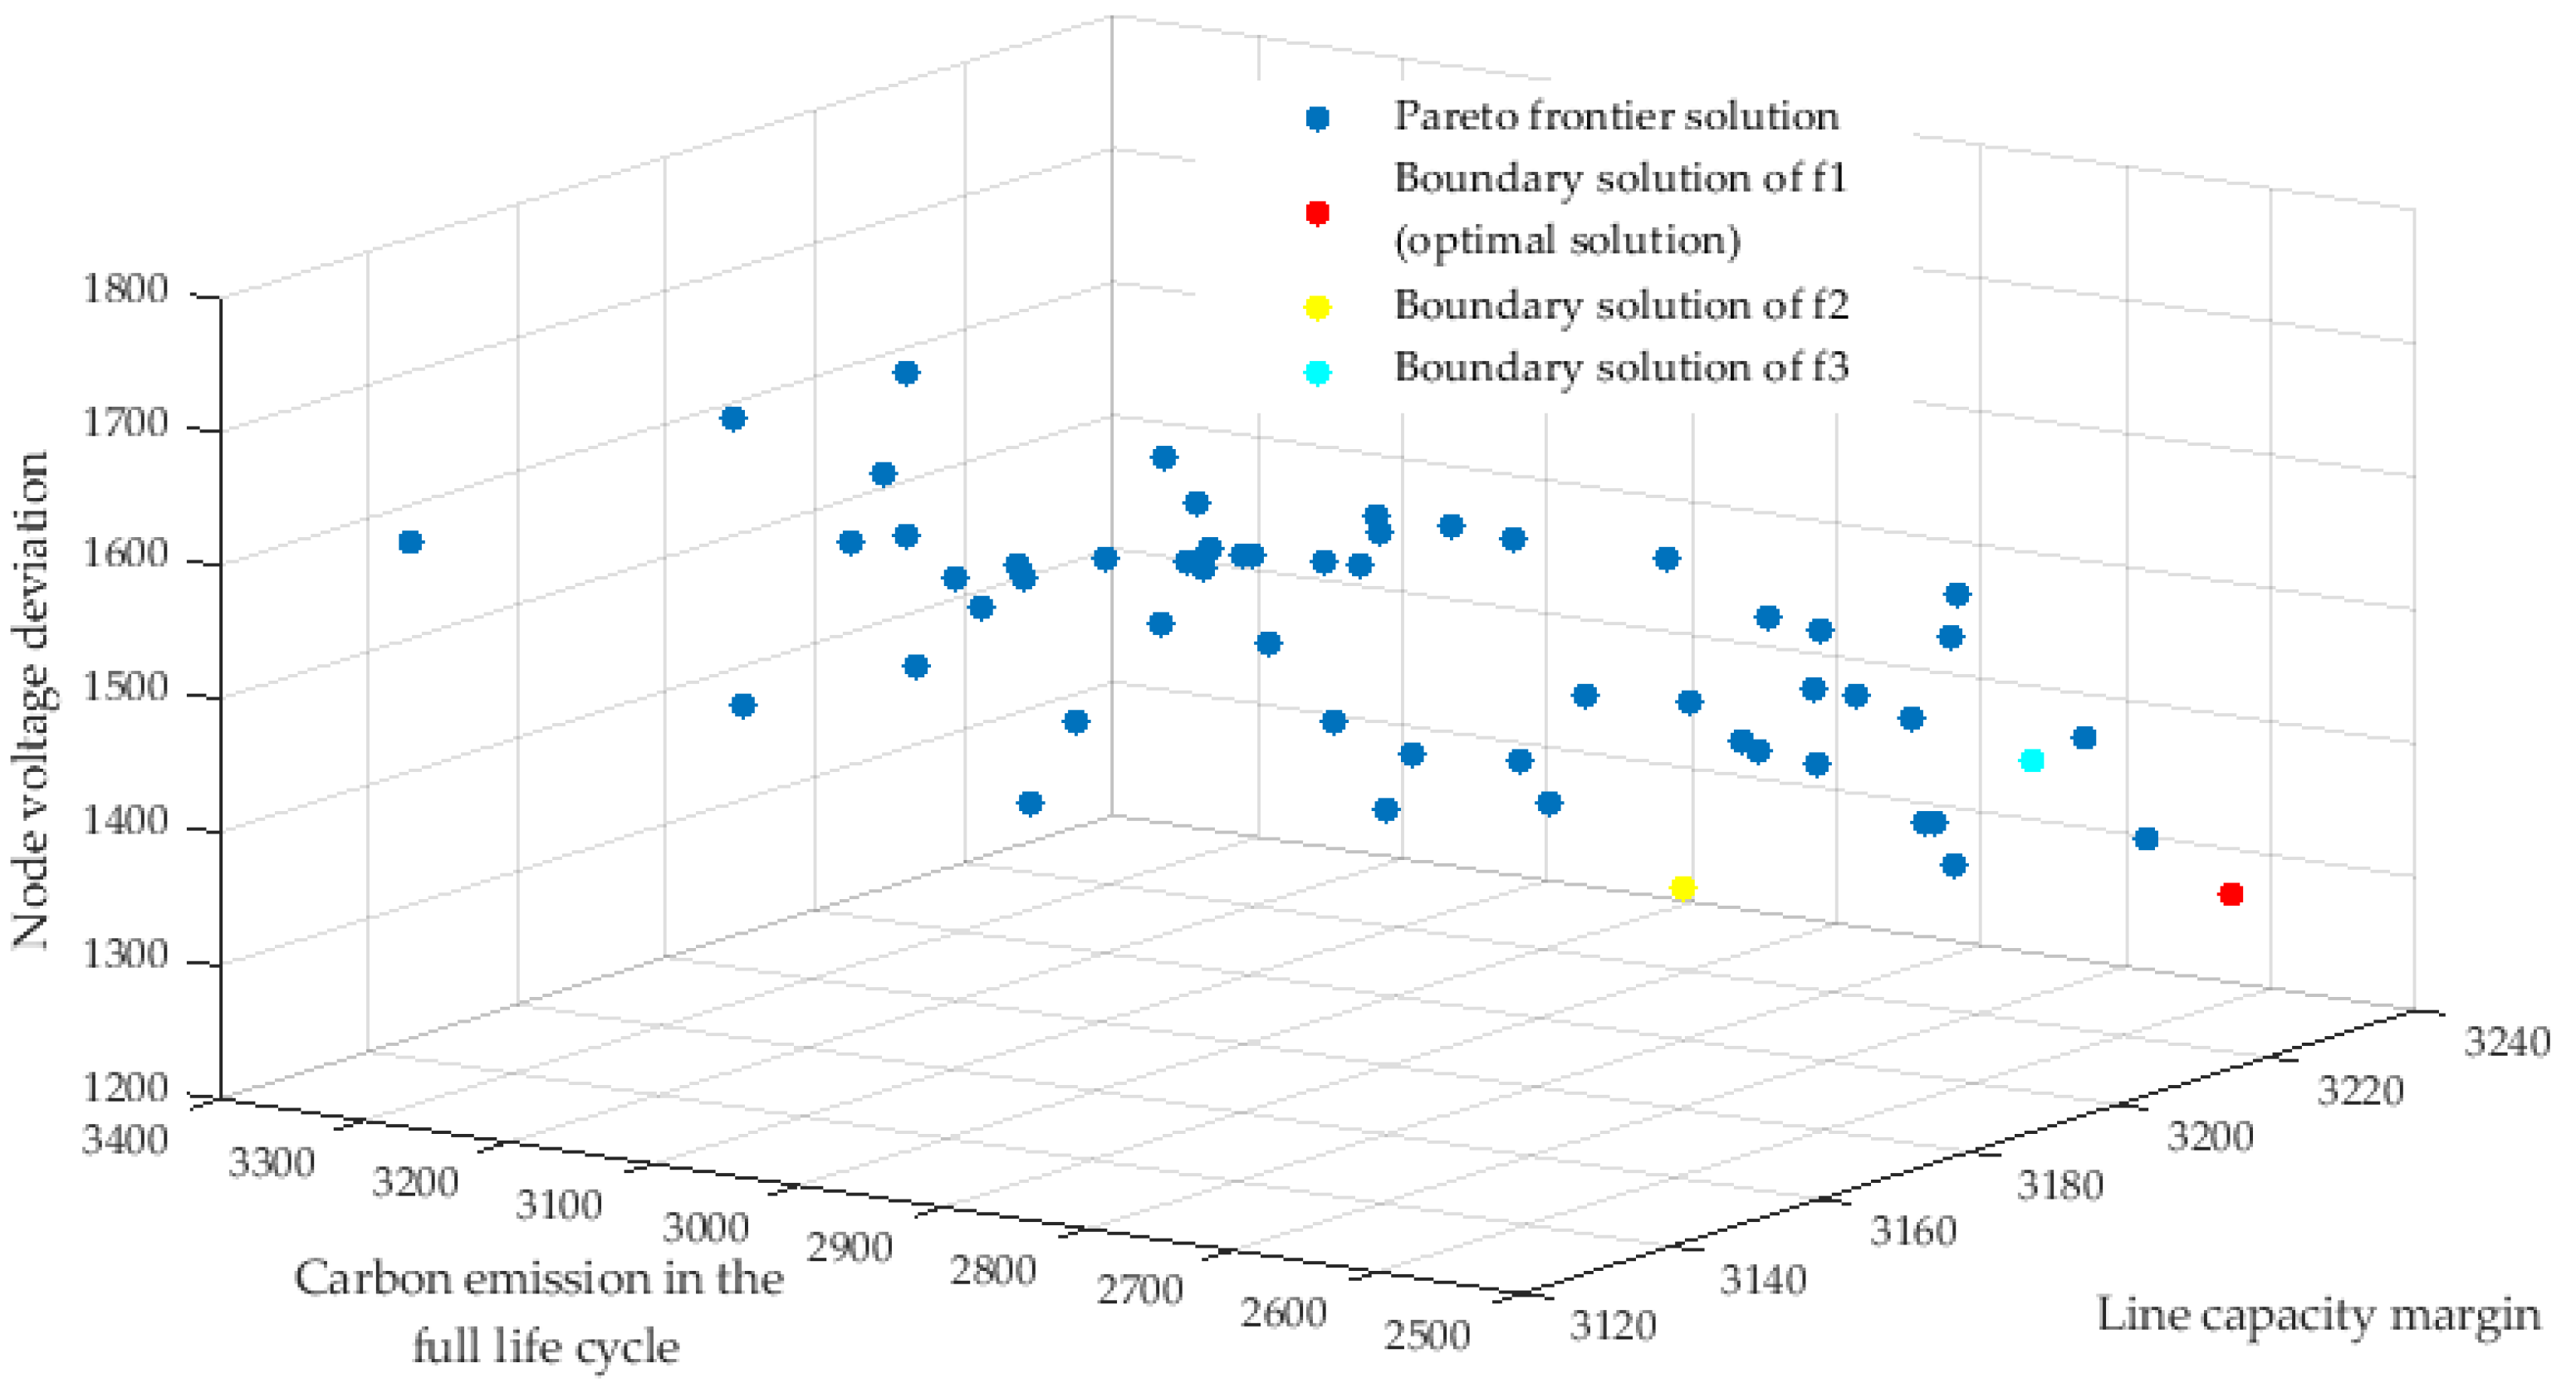
The population size of improved NSGA-II is set to 100, the number of iterations to 100, the crossover probability to 0.7 and the mutation probability to 0.3. The change in the number of Pareto frontier solutions with the number of iterations is shown in Figure 4. It can be seen from Figure 4 that the improved NSGA-II can converge when iterating 26 times. The Pareto frontier solution set of the acceptance capacity of DG is solved and shown in Figure 5.
In Figure 5, the Pareto solutions are scattered in the Pareto front of the three-dimensional objective function space. All points represent a non-dominated DG access scheme with low congestion and good distribution. The red point represents the optimal compromise solution (scheme 31), which is obtained after calculating the comprehensive index value through the entropy weight method. The corresponding DG access scheme is shown in Table 1. The red point also represents the single objective optimal solution (i.e., boundary solution) of the minimum carbon emissions of the full life cycle. Compared with the two boundary solutions of the minimum node voltage deviation and maximum line capacity margin, the objective function value of the node voltage deviation f2 in the optimal solution is 1.5% higher than the optimal value (i.e., the minimum value) in all Pareto frontier solutions, and the objective function value of line capacity margin f3 in the optimal solution is 0.1% lower than the optimal value (i.e., the maximum value) in all Pareto frontier solutions. This indicates that the optimal compromise solution not only takes into account the security and economy of distribution network operation but also has the lowest carbon emission from the perspective of the full life cycle.
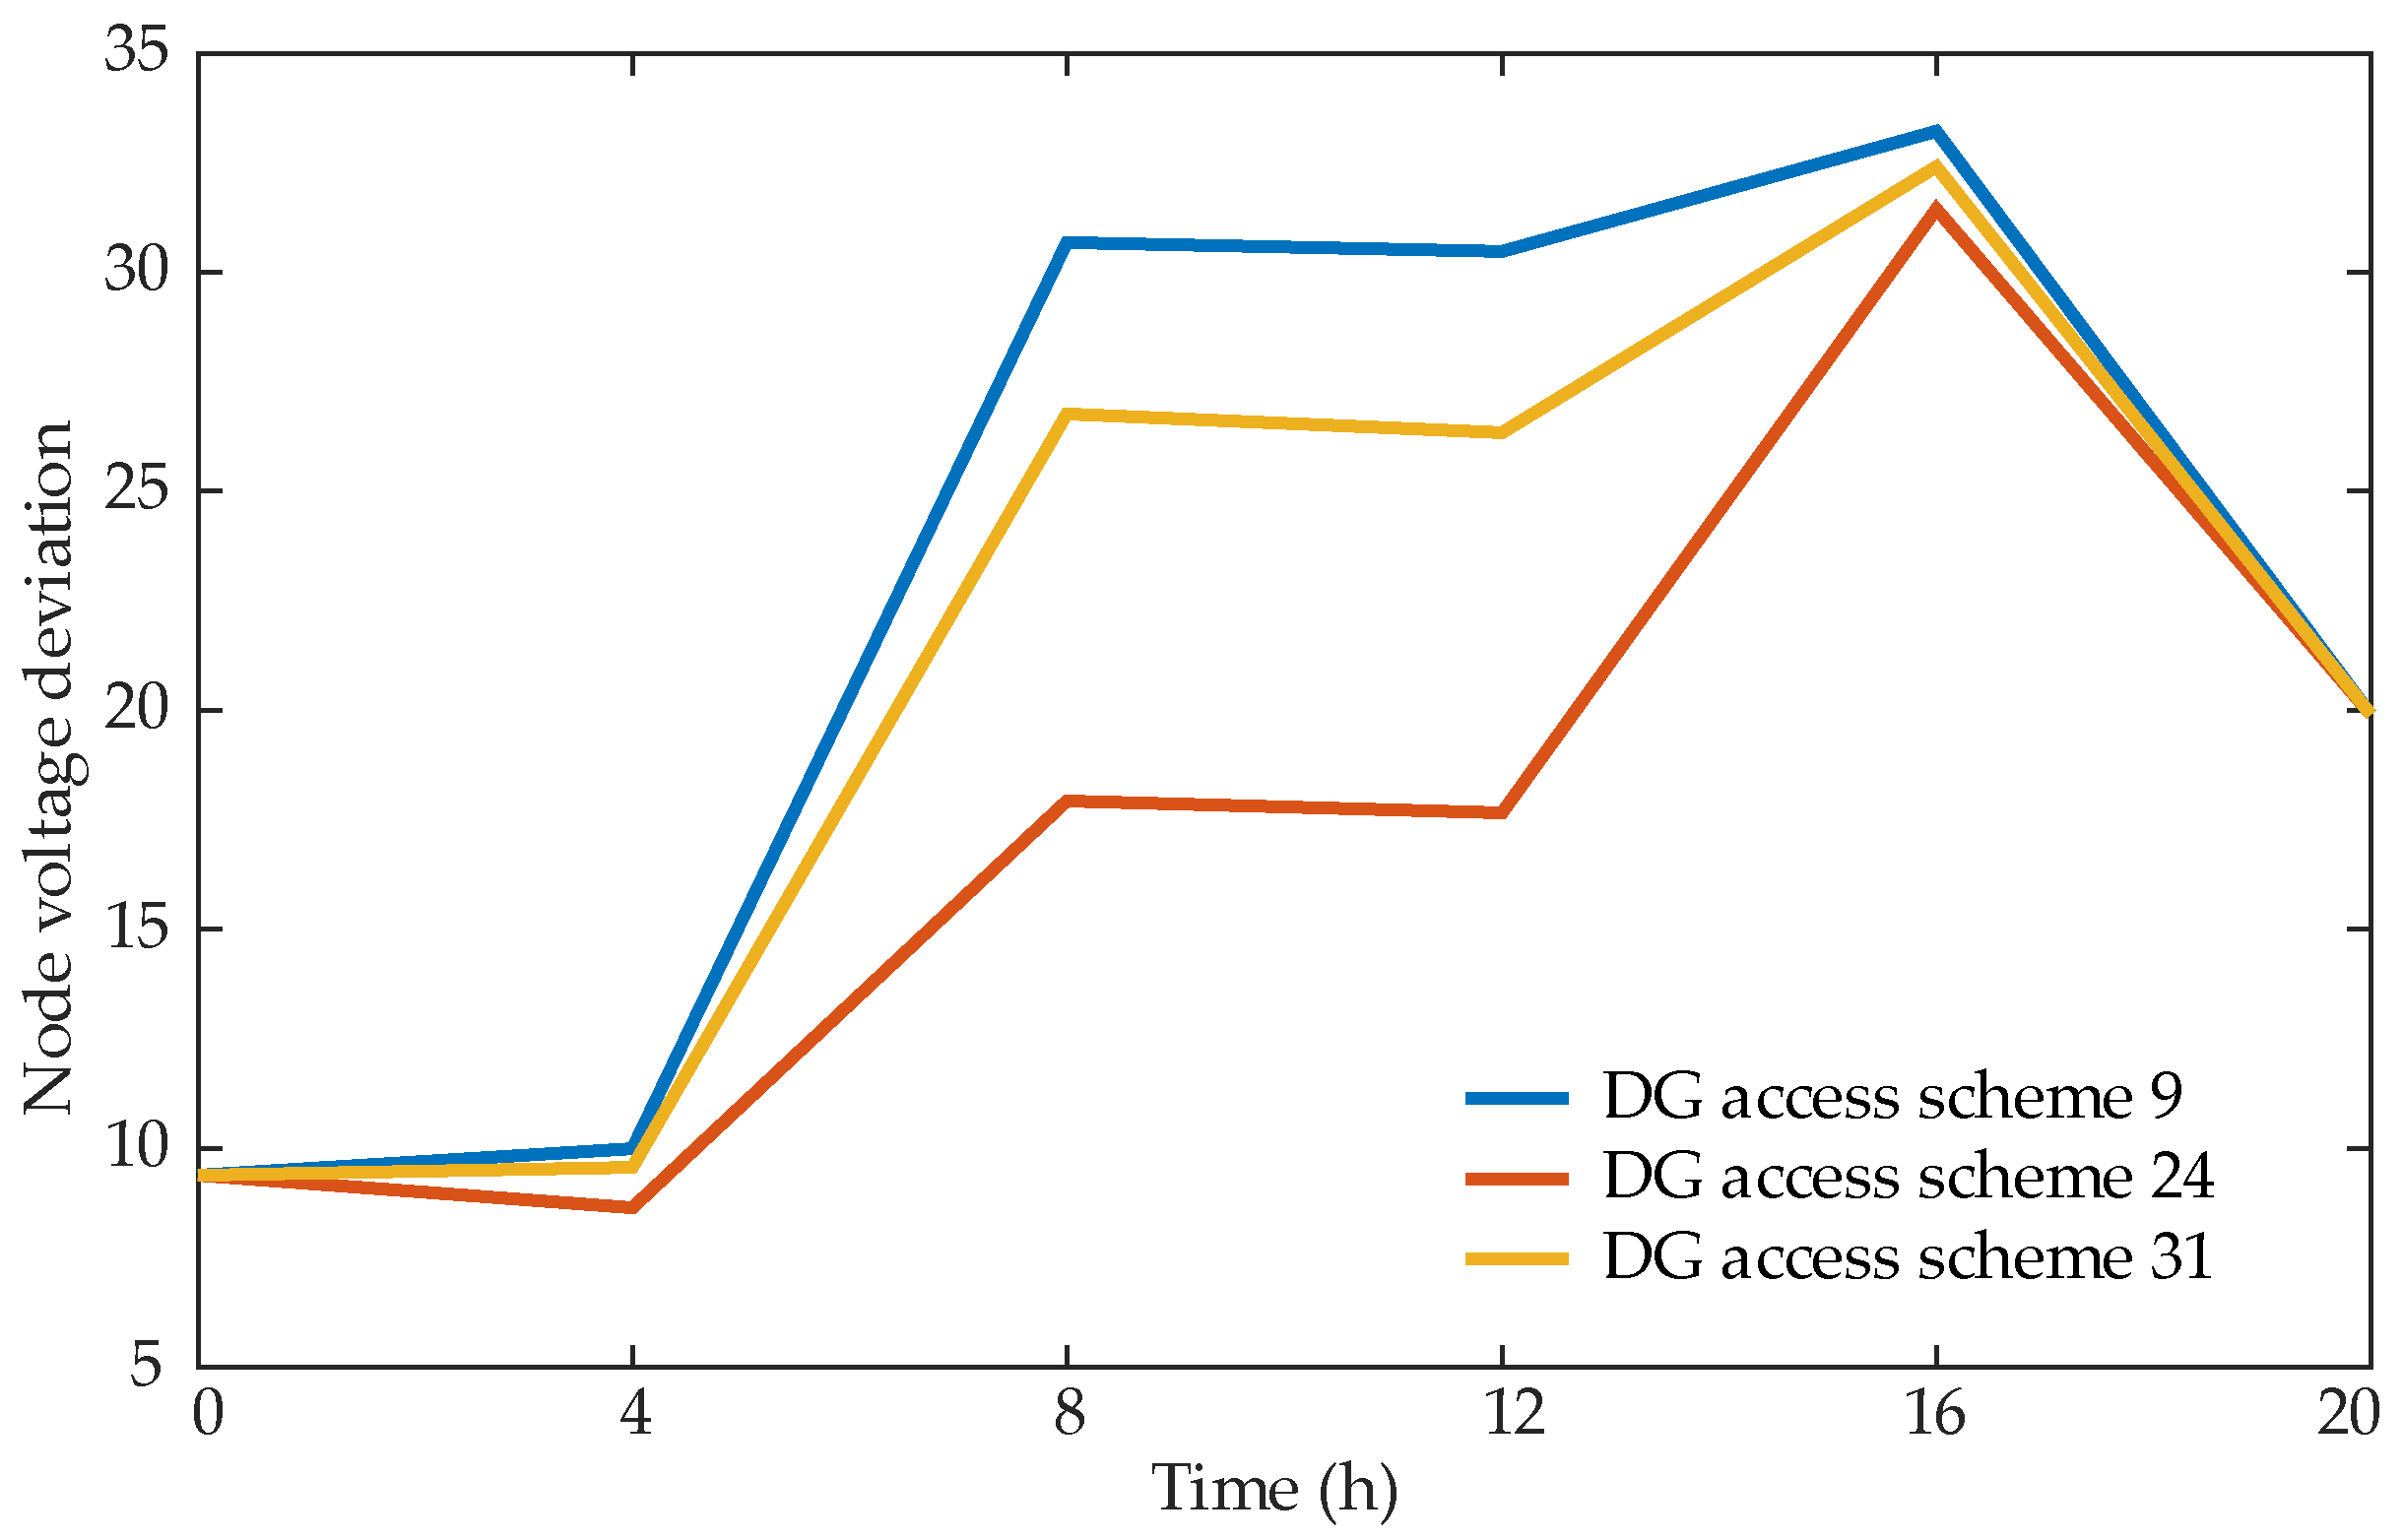
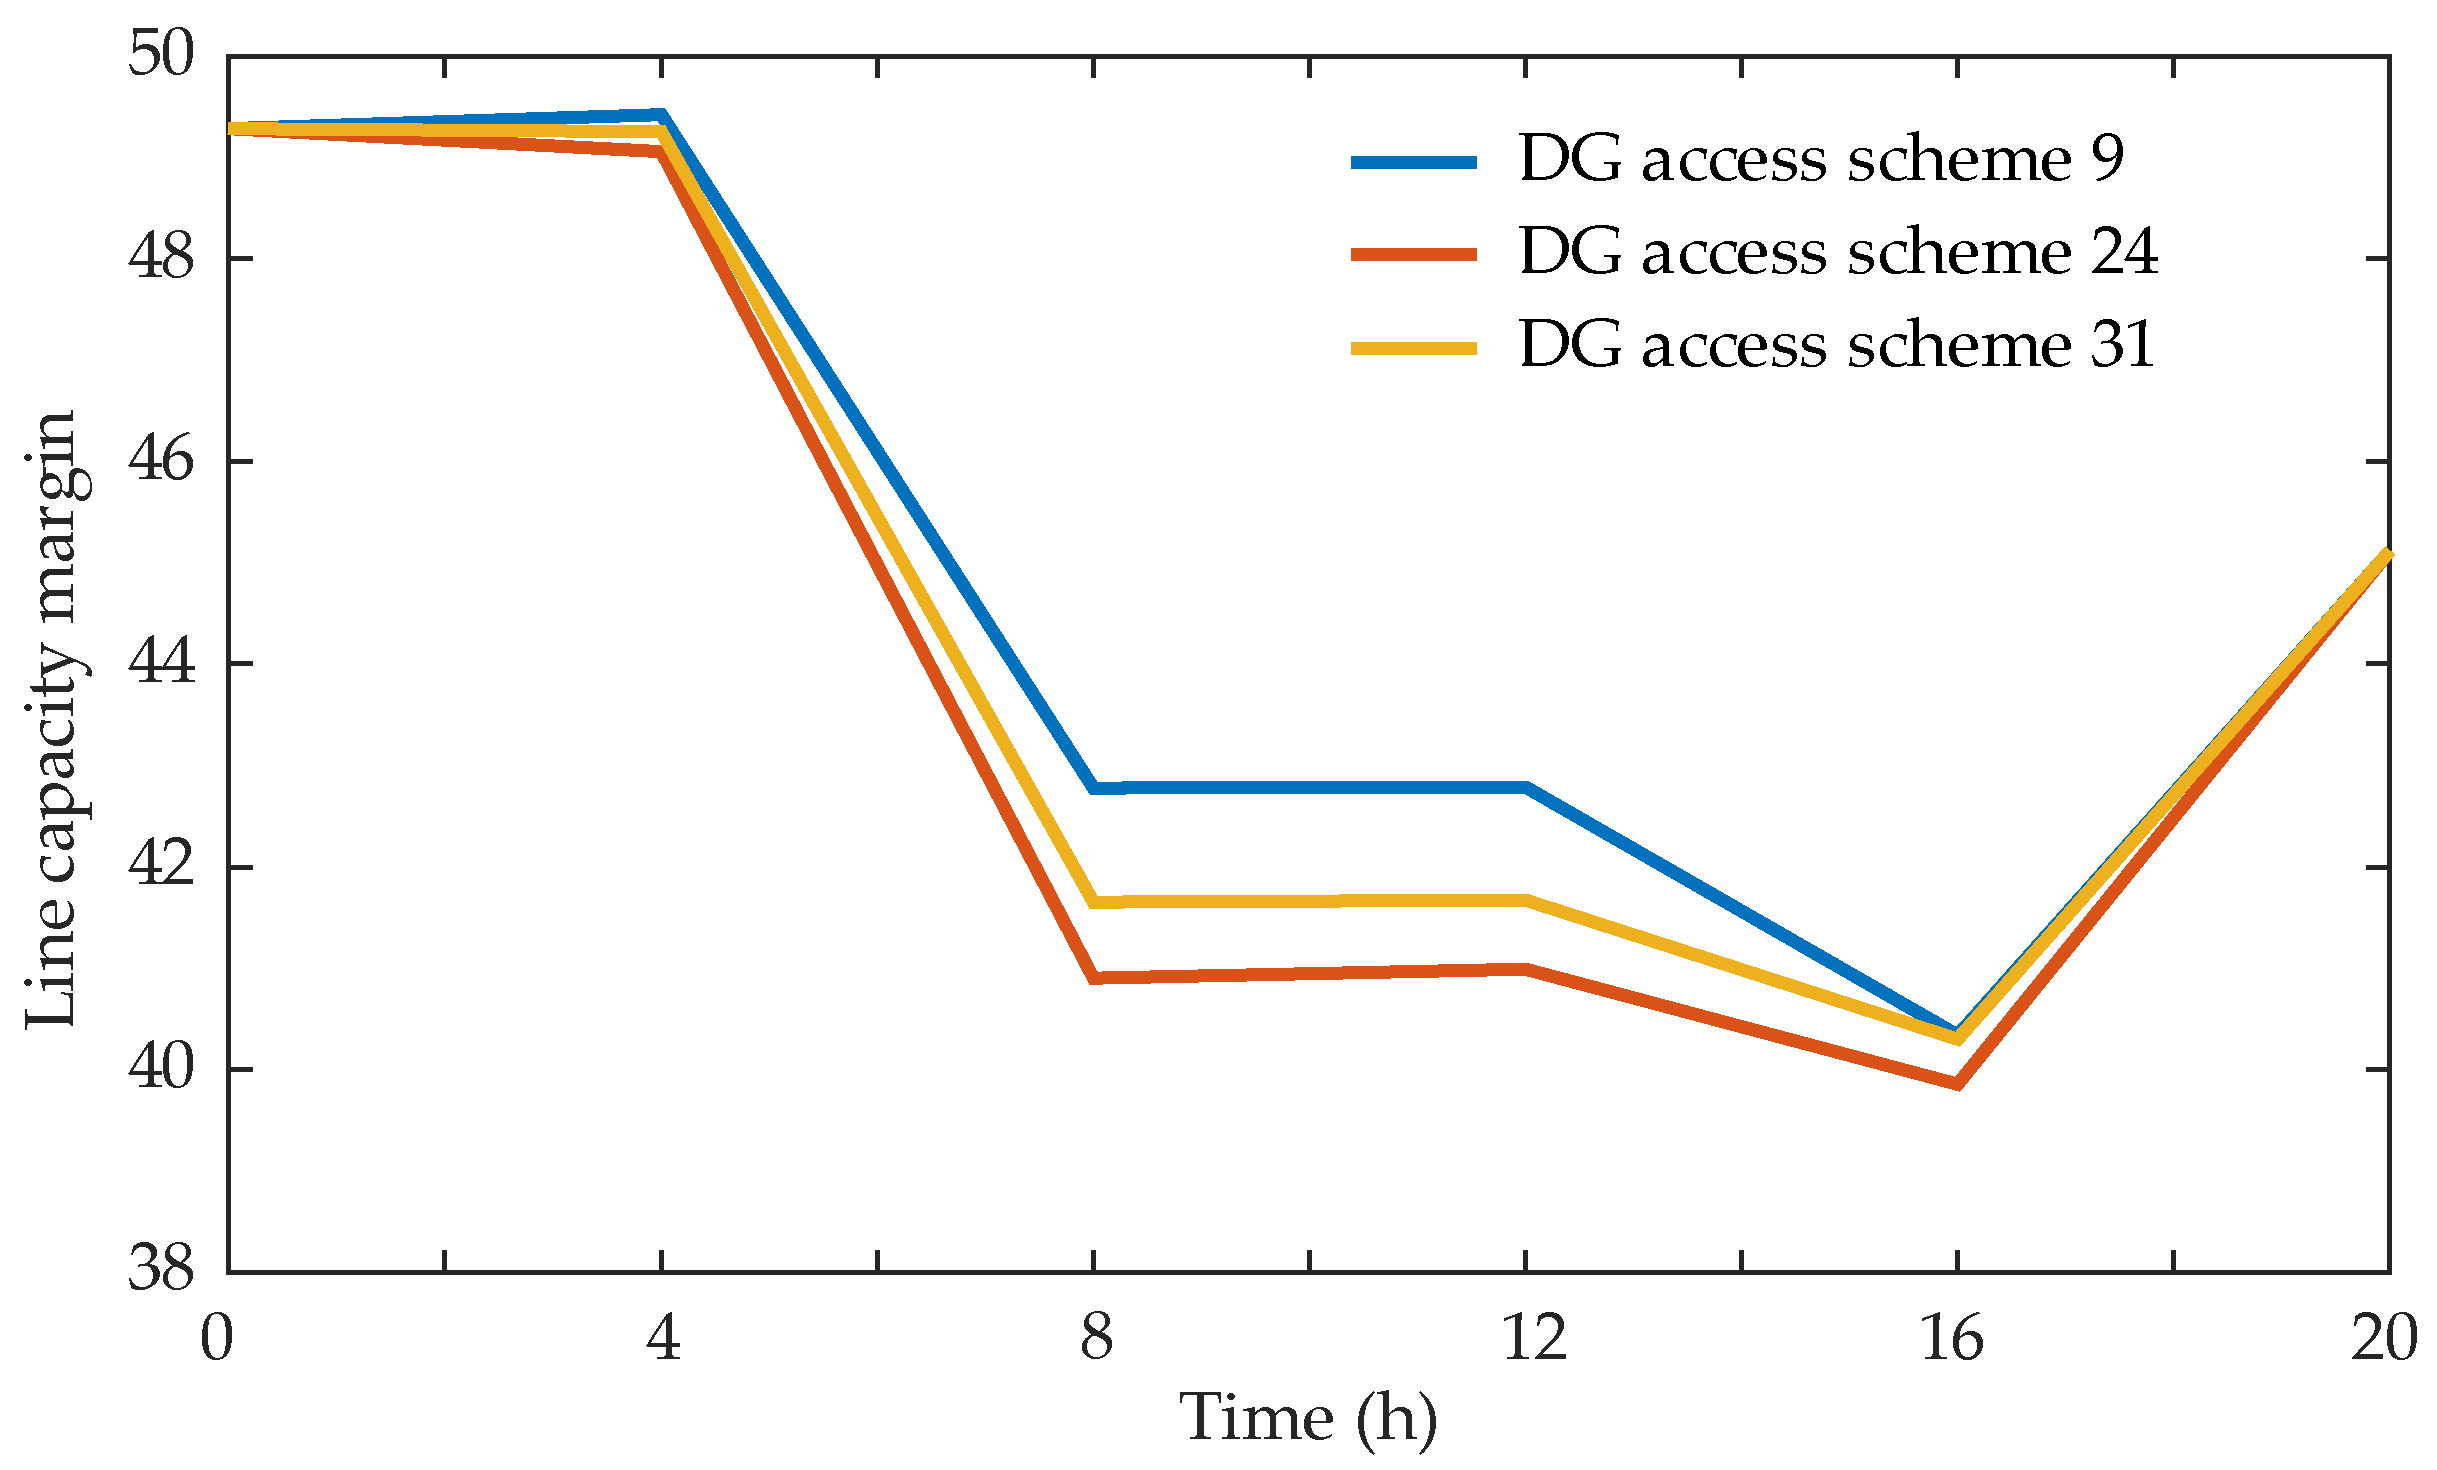
Figure 6, Figure 7 and Figure 8 compare the three sub-objectives of each boundary solution under scenario 5. It can be seen from Figure 6, Figure 7 and Figure 8 that the fitness of the corresponding optimal sub-objective of each boundary solution is better than that of the other two boundary solutions in each scheduling period. Scheme 9 is the boundary solution of the line capacity margin. In each scheduling period, the line capacity margin of scheme 9 (i.e., f 3 9 ) is greater than that of schemes 24 and 31 (i.e., f 3 24 and f 3 31 ). In scheduling period 4 with more DG output, f 3 9 is 4.4% and 2.7% higher than f 3 24 and f 3 31 , respectively. Scheme 24 is the boundary solution of node voltage deviation. In each scheduling period, the node voltage deviation of scheme 24 (i.e., f 2 24 ) is less than that of schemes 9 and 31 (i.e., f 2 9 and f 2 31 ). In scheduling period 4, f 2 24 is 42.0% and 32.9% lower than f 2 9 and f 2 31 , respectively.
The total amount of DG access of each Pareto frontier solution is shown in Figure 9. In Figure 9, the total acceptance capacity of DG in schemes 9, 24 and 31 are 109.7 MW, 84.0 MW and 105.0 MW, respectively. It can be seen from Figure 7, Figure 8 and Figure 9 that the larger the acceptance capacity of DG, the greater the impact of DG on the distribution network. The increase of line capacity margin means the improvement of line load transfer capacity and the node voltage deviation means the power quality degradation.
In Figure 9, the total amount of DG access in schemes 41 and 48 are 119.4 MW and 70.0 MW, which are the schemes with the largest and smallest DG access among the Pareto frontier solutions. The penetration rates of DG in schemes 31 (i.e., the optimal compromise solution), 41 and 48 are 77.0%, 87.6% and 51.4%, respectively. It can be seen that the distribution network system used in this case study has a good acceptance capacity of DG.
Using the entropy weight method, the weights of the three objective functions for calculating the comprehensive index are 0.42, 0.30 and 0.28 respectively. It can be seen that in the Pareto optimal solution set, the dispersion of the objective function of the carbon emission level throughout the full life cycle is greater than that of node voltage deviation and line capacity margin, which indicates higher weight. The dispersion of the objective function of the node voltage deviation is equivalent to that of the line capacity margin. It illustrates that when evaluating the acceptance capacity of DG, the importance of the two objective functions and the weight obtained are similar. The optimal compromise solution not only takes into account the requirements of the distribution network operation economy and reliability but also meets the needs of low-carbon development of distribution network.
The function values of the optimal compromise solutions obtained by the traditional NSGA-II and the proposed improved NSGA-II are compared in Table 2. The f1 and f2 of Case 1 are 2.9% and 4.9% less than that of Case 2, respectively. The f3 of Case 1 is 0.1% more than that of Case 2. This demonstrates that the performance of the improved NSGA-II in finding the optimal solution is better than that of the traditional NSGA-II. In addition, the total acceptance capacity of DG of Case 2 is 97.9 MW, which is 6.8% less than that of Case 1, which indicates that according to the proposed improved NSGA-II, more DGs can be configured in the distribution network.

5. Conclusions

In this paper, an evaluation model of acceptance capacity of DG in distribution network considering carbon emission is established. The model comprehensively considers the security, economy and low-carbon requirements of distribution network operation against the background of the rapid development of DG, including reducing the carbon emissions of the full life cycle, reducing the node voltage deviation and improving the line capacity margin. To guide the planning and configuration of DG more accurately, the proposed evaluation model fully considers the operation optimization problem of the distribution network under different wind and photovoltaic output scenarios. Considering that the model is a multi-objective optimization problem, an improved NSGA-II is proposed in this paper. The entropy weight method is used to quantitatively analyze the importance of each sub-objective in the Pareto solution set. Through calculating the comprehensive index value of acceptance capacity, the optimal compromise solution is obtained. The simulation results illustrate that a large amount of DG access will aggravate the voltage fluctuation and improve the line capacity margin of the distribution network, which shows the necessity of the scientific evaluation of DG acceptance capacity. The acceptance capacity evaluation proposed in this paper can effectively evaluate the maximum acceptance capacity of DG and provides guidance for DG configuration in the distribution network.
In addition, because the output of DG has the characteristics of uncertainty and fluctuation, the charging and discharging function of energy storage systems (ESSs) play an important role in improving the utilization rate of sustainable energy. It is meaningful to consider the coordinated configuration of DG and ESSs when evaluating the acceptance capacity of DG in the distribution network. The operation and the benefit of carbon emissions throughout the full life cycle of ESSs will be the focus of further research on the acceptance capacity evaluation model of DG in the distribution network.

Author Contributions

Conceptualization, Y.X. and L.Z.; methodology, Y.H.; software, Y.H. and W.Q.; validation, Y.X., J.G. and Y.Y.; formal analysis, Y.H.; investigation, T.W.; resources, L.Z. and Y.X.; data curation, J.G.; writing—original draft preparation, Y.H.; writing—review and editing, Y.H. and Y.Y.; visualization, W.Q.; supervision, Y.X.; project administration, Y.H.; funding acquisition, Z.L. All authors have read and agreed to the published version of the manuscript.

Funding

This research was funded by the Joint Fund of National Natural Science Foundation of China, grant number U2166206.

Institutional Review Board Statement

Not applicable.

Informed Consent Statement

Not applicable.

Data Availability Statement

Not applicable.

Conflicts of Interest

The authors declare no conflict of interest.

References

  1. Rafiee, A.; Karimi, M.; Safari, A.; Abbasi Talabari, F. The Future Impact of Carbon Tax on Electricity Flow between Great Britain and Its Neighbors until 2030. Appl. Sci. 2021, 11, 10460. [Google Scholar] [CrossRef]
  2. Remarks by Chinese President Xi Jinping at Leaders Summit on Climate. Available online: http://www.china.org.cn/world/2021-04/23/content_77432607.htm (accessed on 30 March 2022).
  3. Ghiasi, M.; Niknam, T.; Dehghani, M.; Siano, P.; Haes Alhelou, H.; Al-Hinai, A. Optimal Multi-Operation Energy Management in Smart Microgrids in the Presence of RESs Based on Multi-Objective Improved DE Algorithm: Cost-Emission Based Optimization. Appl. Sci. 2021, 11, 3661. [Google Scholar] [CrossRef]
  4. Liu, S.; You, S.; Lin, Z.; Zeng, C.; Li, H.; Wang, W.; Hu, X.; Liu, Y. Data-driven Event Identification in the US Power Systems Based on 2D-OLPP and RUSBoosted Trees. IEEE Trans. Power Syst. 2022, 1, 94–105. [Google Scholar] [CrossRef]
  5. Wang, H.; Shen, X.; Liu, J. Planning of New Distribution Network Considering Green Power Certificate Trading and Carbon Emissions Trading. Energies 2022, 15, 2435. [Google Scholar] [CrossRef]
  6. Tian, G.; Yu, S.; Wu, Z.; Xia, Q. Study on the Emission Reduction Effect and Spatial Difference of Carbon Emission Trading Policy in China. Energies 2022, 15, 1921. [Google Scholar] [CrossRef]
  7. Zhou, Q.; Shahidehpour, M.; Sun, T.; Feng, D.; Yan, M. Cooperative Game for Carbon Obligation Allocation Among Distribution System Operators to Incentivize the Proliferation of Renewable Energy. IEEE Trans. Smart Grid 2019, 10, 6355–6365. [Google Scholar] [CrossRef]
  8. Pourakbari-Kasmaei, M.; Lehtonen, M.; Contreras, J.; Mantovani, J.R.S. Carbon Footprint Management: A Pathway toward Smart Emission Abatement. IEEE Trans. Ind. Inform. 2020, 16, 935–948. [Google Scholar] [CrossRef] [Green Version]
  9. Han, X.; Qiu, J.; Sun, L.; Shen, W.; Ma, Y.; Yuan, D. Low-Carbon Energy Policy Analysis Based on Power Energy System Modeling. Energy Convers. Econ. 2020, 1, 34–44. [Google Scholar] [CrossRef]
  10. Kang, C.; Zhou, T.; Chen, Q.; Wang, J.; Sun, Y.; Xia, Q.; Yan, H. Carbon Emission Flow from Generation to Demand: A Network-Based Model. IEEE Trans. Smart Grid 2015, 6, 2386–2394. [Google Scholar] [CrossRef]
  11. Ren, S.; Wang, J.; Gong, X.; Gong, L.; Peng, X.; Ao, J. Low-Carbon Economic Dispatching for Integrated Energy System Based on Coordinated Optimization of Power to Gas and Carbon Capture Power Plant. In Proceedings of the 2019 IEEE 3rd Conference on Energy Internet and Energy System Integration (EI2), Changsha, China, 8–10 November 2019. [Google Scholar]
  12. Fan, V.H.; Meng, K.; Qiu, J.; Dong, Z. Stochastic Distribution Expansion Planning with Wind Power Generation and Electric Vehicles Considering Carbon Emissions. In Proceedings of the 2020 4th International Conference on Green Energy and Applications (ICGEA), Singapore, 7–9 March 2020. [Google Scholar]
  13. Guo, L.; Liu, W.; Jiao, B.; Hong, B.; Wang, C. Multi-Objective Stochastic Optimal Planning Method for Stand-Alone Microgrid System. IET Gener. Transm. Distrib. 2014, 8, 1263–1273. [Google Scholar] [CrossRef]
  14. Zhang, T.; Luo, F.; Hu, S.; Yang, X. Evaluation Model and Method on Life-Cycle Comprehensive Low-Carbon Benefits of Large-Scale Energy Storage System from the Distribution Network Planning Perspective. In Proceedings of the 2020 IEEE 4th Conference on Energy Internet and Energy System Integration (EI2), Wuhan, China, 30 October–1 November 2020. [Google Scholar]
  15. Yue, G.; Hongbin, Z.; Kai, C. Life-Cycle Low Carbon Simulation of Smart Distribution Network Considering Power Loss. In Proceedings of the 2018 2nd IEEE Conference on Energy Internet and Energy System Integration (EI2), Beijing, China, 20–22 October 2018. [Google Scholar]
  16. Xu, Y.; Liu, Z.; Wen, F.; Palu, I. Receding-Horizon Based Optimal Dispatch of Virtual Power Plant Considering Stochastic Dynamic of Photovoltaic Generation. Energy Convers. Econ. 2021, 2, 45–53. [Google Scholar] [CrossRef]
  17. Li, Z.; Su, S.; Zhao, Y.; Jin, X.; Chen, H.; Li, Y.; Zhang, R. Energy Management Strategy of Active Distribution Network with Integrated Distributed Wind Power and Smart Buildings. IET Renew. Power Gener. 2020, 14, 2255–2267. [Google Scholar] [CrossRef]
  18. The State Council Information Office Held a Press Conference on China’s Renewable Energy Development. Available online: http://www.nea.gov.cn/2021-03/30/c_139846095.htm (accessed on 30 March 2022).
  19. Wang, X.; Gao, C.; Wu, W.; Chang, X.; Gao, S. Stochastic DG Capacity Assessment for Active Distribution Networks Considering the Optimal Reactive DG Outputs and OLTC Operation. In Proceedings of the 2017 IEEE Conference on Energy Internet and Energy System Integration (EI2), Beijing, China, 26–28 November 2017. [Google Scholar]
  20. Lu, Q.; Lin, Z.; Liu, S.; Zhu, Y.; Yang, Y.; Cai, Q. DG Capacity Assessment in Distribution Network Considering Uncertainties Using Multi-Parametric Programming. In Proceedings of the 2018 2nd IEEE Conference on Energy Internet and Energy System Integration (EI2), Beijing, China, 20–22 October 2018. [Google Scholar]
  21. Solat, S.; Aminifar, F.; Shayanfar, H. Distributed Generation Hosting Capacity in Electric Distribution Network in the Presence of Correlated Uncertainties. IET Gener. Transm. Distrib. 2021, 15, 836–848. [Google Scholar] [CrossRef]
  22. Wang, S.; Chen, S.; Ge, L.; Wu, L. Distributed Generation Hosting Capacity Evaluation for Distribution Systems Considering the Robust Optimal Operation of OLTC and SVC. IEEE Trans. Sustain. Energy 2016, 7, 1111–1123. [Google Scholar] [CrossRef]
  23. Fan, S.; Li, C.; Wei, Z.; Pu, T.; Liu, X. Method to Determine the Maximum Generation Capacity of Distribution Generation in Low-Voltage Distribution Feeders. J. Eng. 2017, 2017, 944–948. [Google Scholar] [CrossRef]
  24. Chen, X.; Wu, W.; Zhang, B. Robust Capacity Assessment of Distributed Generation in Unbalanced Distribution Networks Incorporating ANM Techniques. IEEE Trans. Sustain. Energy 2018, 9, 651–663. [Google Scholar] [CrossRef] [Green Version]
  25. Ali, A.; Keerio, M.U.; Laghari, J.A. Optimal Site and Size of Distributed Generation Allocation in Radial Distribution Network Using Multi-Objective Optimization. J. Mod. Power Syst. Clean Energy 2021, 9, 404–415. [Google Scholar] [CrossRef]
  26. Selim, A.; Kamel, S.; Alghamdi, A.S.; Jurado, F. Optimal Placement of DGs in Distribution System Using an Improved Harris Hawks Optimizer Based on Single- and Multi-Objective Approaches. IEEE Access 2020, 8, 52815–52829. [Google Scholar] [CrossRef]
  27. Hou, H.; Liu, P.; Xiao, Z.; Deng, X.; Huang, L.; Zhang, R.; Xie, C. Capacity Configuration Optimization of Standalone Multi-Energy Hub Considering Electricity, Heat and Hydrogen Uncertainty. Energy Convers. Econ. 2021, 2, 122–132. [Google Scholar] [CrossRef]
  28. Li, W.; Wang, Q. Stochastic Production Simulation for Generating Capacity Reliability Evaluation in Power Systems with High Renewable Penetration. Energy Convers. Econ. 2020, 1, 210–220. [Google Scholar] [CrossRef]
  29. Huang, Y.; Lin, Z.; Liu, X.; Yang, L.; Dan, Y.; Zhu, Y.; Ding, Y.; Wang, Q. Bi-Level Coordinated Planning of Active Distribution Network Considering Demand Response Resources and Severely Restricted Scenarios. J. Mod. Power Syst. Clean Energy 2021, 9, 1088–1100. [Google Scholar] [CrossRef]
  30. Bilgundi, S.K.; Sachin, R.; Pradeepa, H.; Nagesh, H.B.; Likith Kumar, M.V. Grid Power Quality Enhancement Using an ANFIS Optimized PI Controller for DG. Prot. Control Mod. Power Syst. 2022, 7, 3. [Google Scholar] [CrossRef]
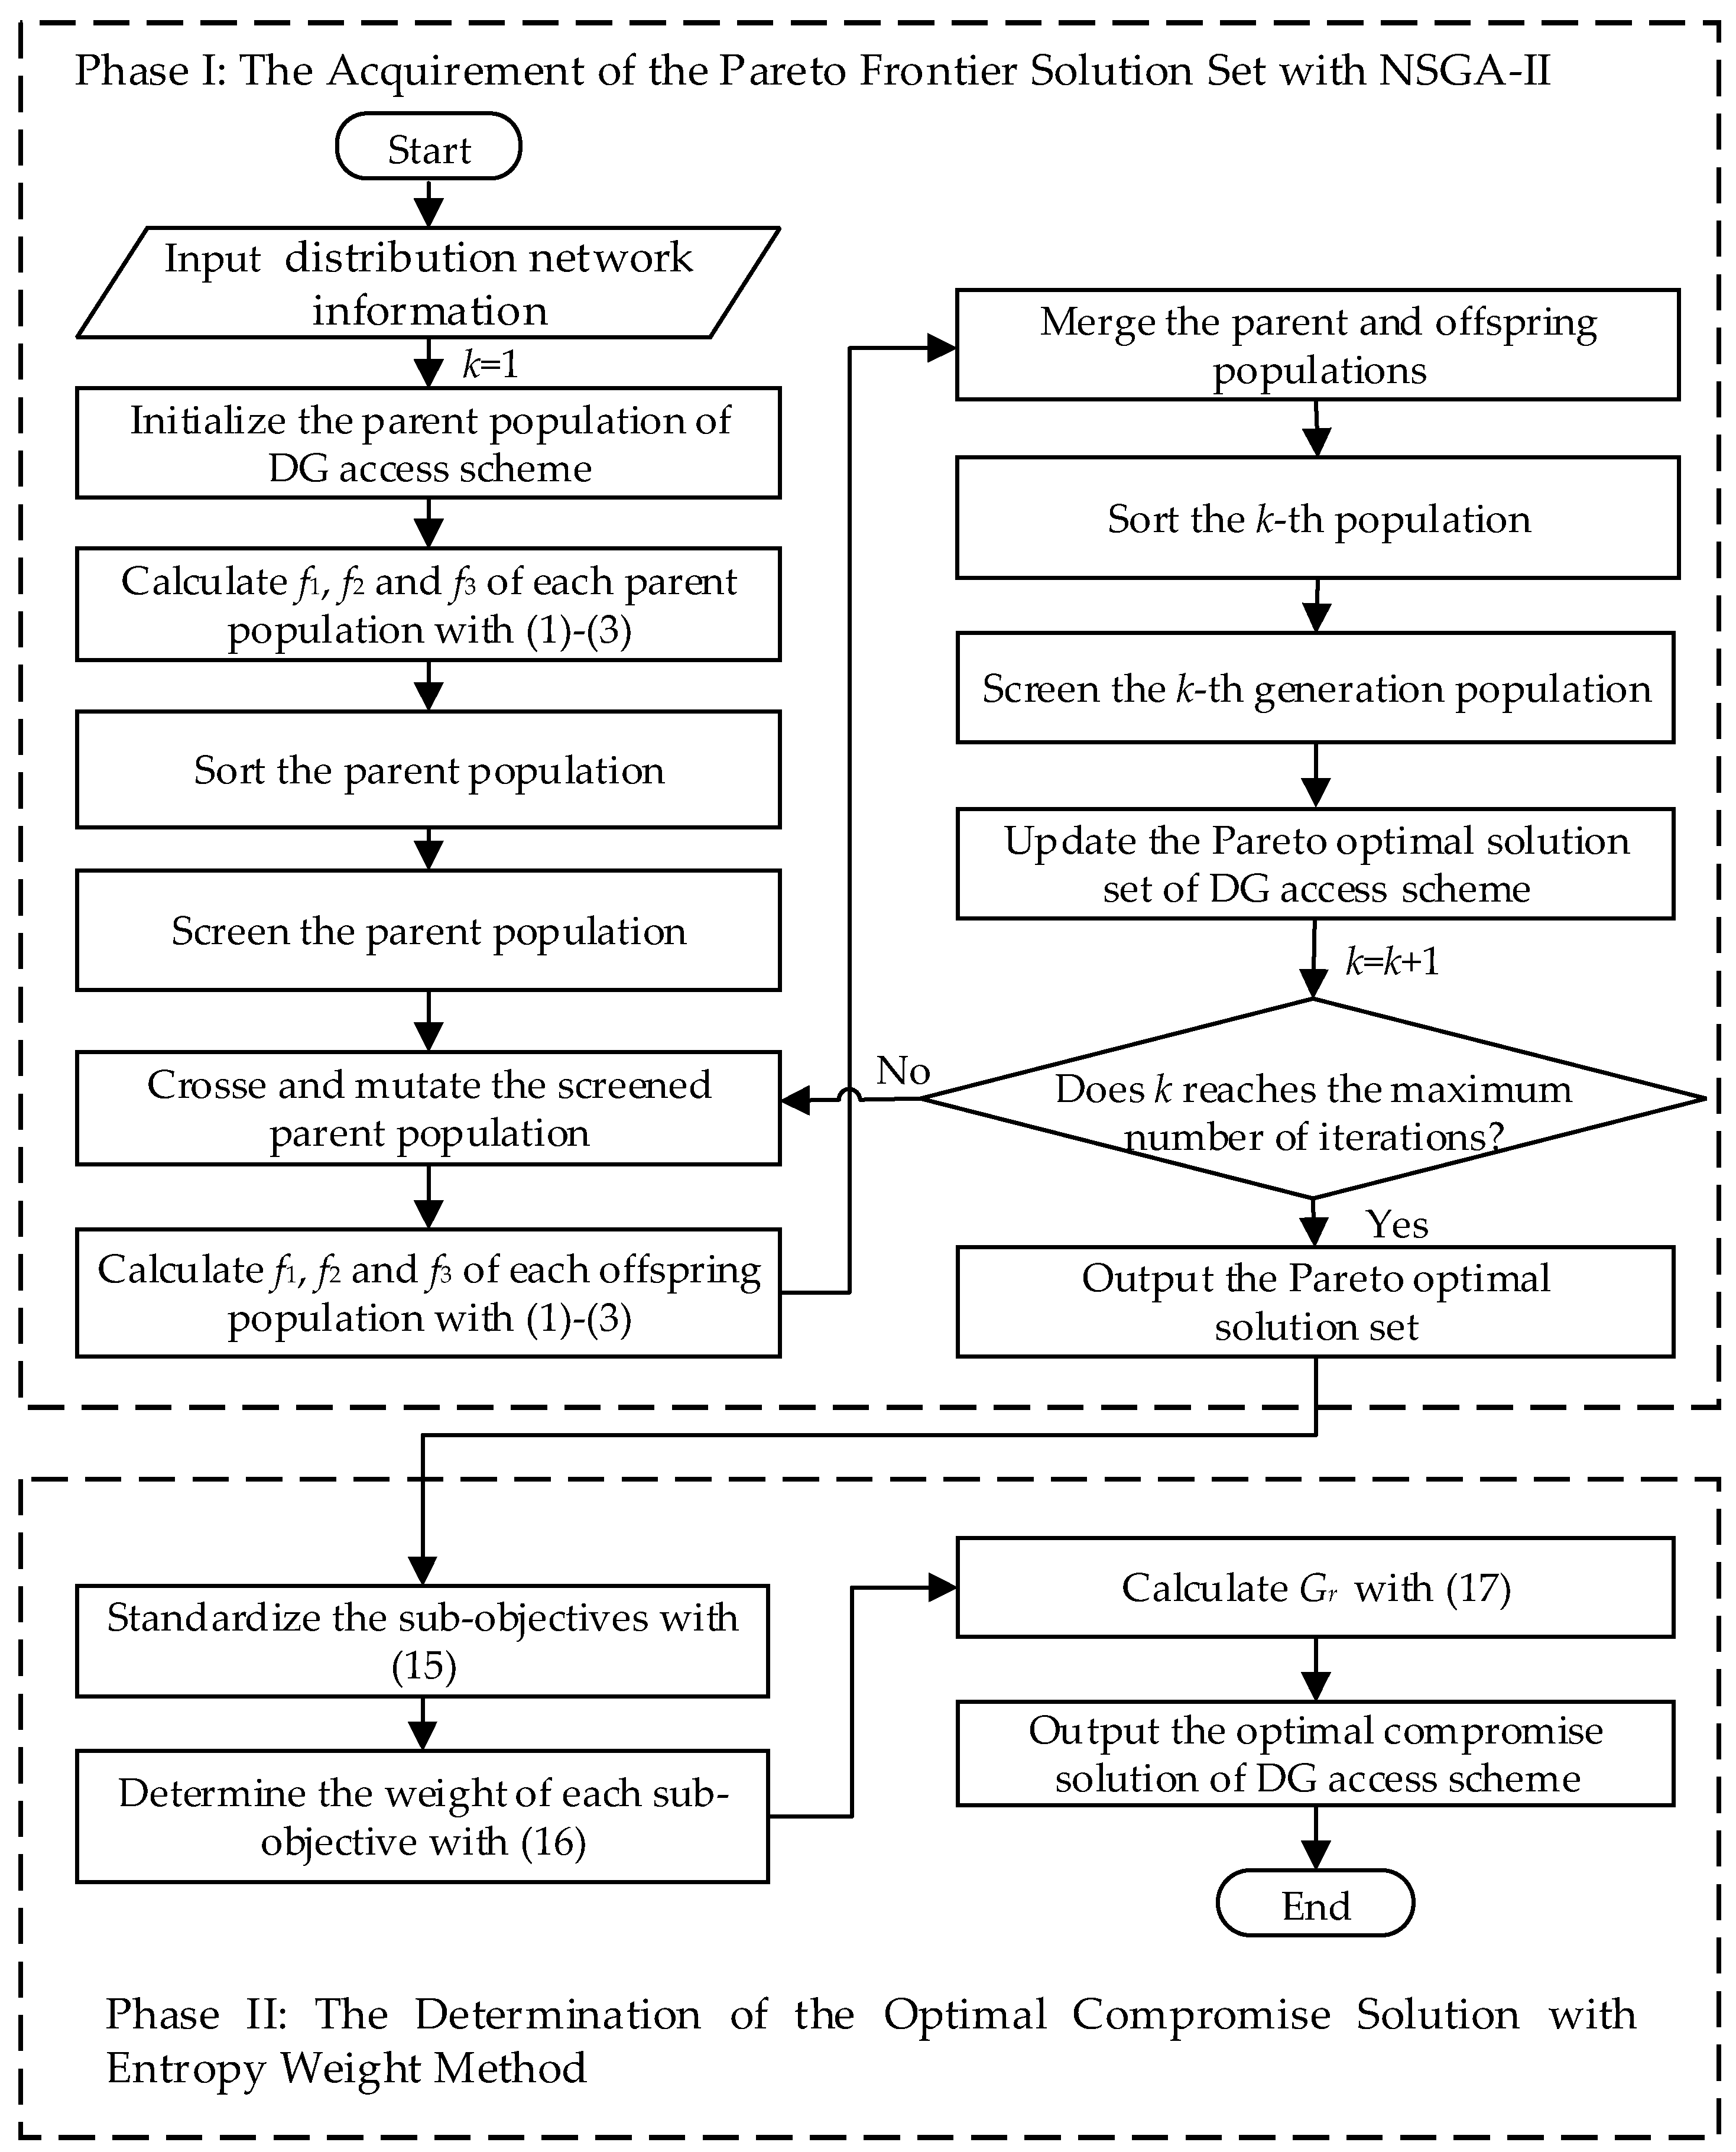
Figure 1. Flowchart of the proposed evaluation model for the acceptance capacity of DG in distribution networks.
Energies 15 04406 g001
Figure 2. The topology of an actual 20 kV distribution network.
Energies 15 04406 g002
Figure 3. The output curves of distributed photovoltaic generation and distributed wind generation.
Energies 15 04406 g003
Figure 4. Changes in the number of Pareto frontier solutions.
Energies 15 04406 g004
Figure 5. The Pareto frontier solution set of the acceptance capacity of DG.
Energies 15 04406 g005
Figure 6. The carbon emission in the full life cycle of schemes 9, 24 and 31 under scenario 5.
Energies 15 04406 g006
Figure 7. The node voltage deviation of schemes 9, 24 and 31 under scenario 5.
Energies 15 04406 g007
Figure 8. The line capacity margin of schemes 9, 24 and 31 under scenario 5.
Energies 15 04406 g008
Figure 9. The total amount of DG access of each Pareto frontier solution.
Energies 15 04406 g009
Table 1. The DG access scheme of the optimal compromise solution (scheme 31).
Number of NodeCapacity of DG (MW)Number of NodeCapacity of DG (MW)
33.4366.3
53.5377.7
65.2391.6
77.2409.7
98.3419.5
118.5505.2
127.7518.0
296.5540.9
301.3553.8
340.6
Table 2. Comparison of objective function values between different algorithms.
CaseAlgorithmMinimum Carbon Emission of the Full Life Cycle
(f1)
Minimum Node Voltage Deviation
(f2)
Maximum Line Capacity Margin
(f3)
1Improved NSGA-II2536.581251.983224.30
2NSGA-II2609.221313.363222.40
Publisher’s Note: MDPI stays neutral with regard to jurisdictional claims in published maps and institutional affiliations.