
International Natural Gas Price Trends Prediction with Historical Prices and Related News


Abstract
:1. Introduction
2. Related Work
3. Materials and Methods
3.1. Dataset
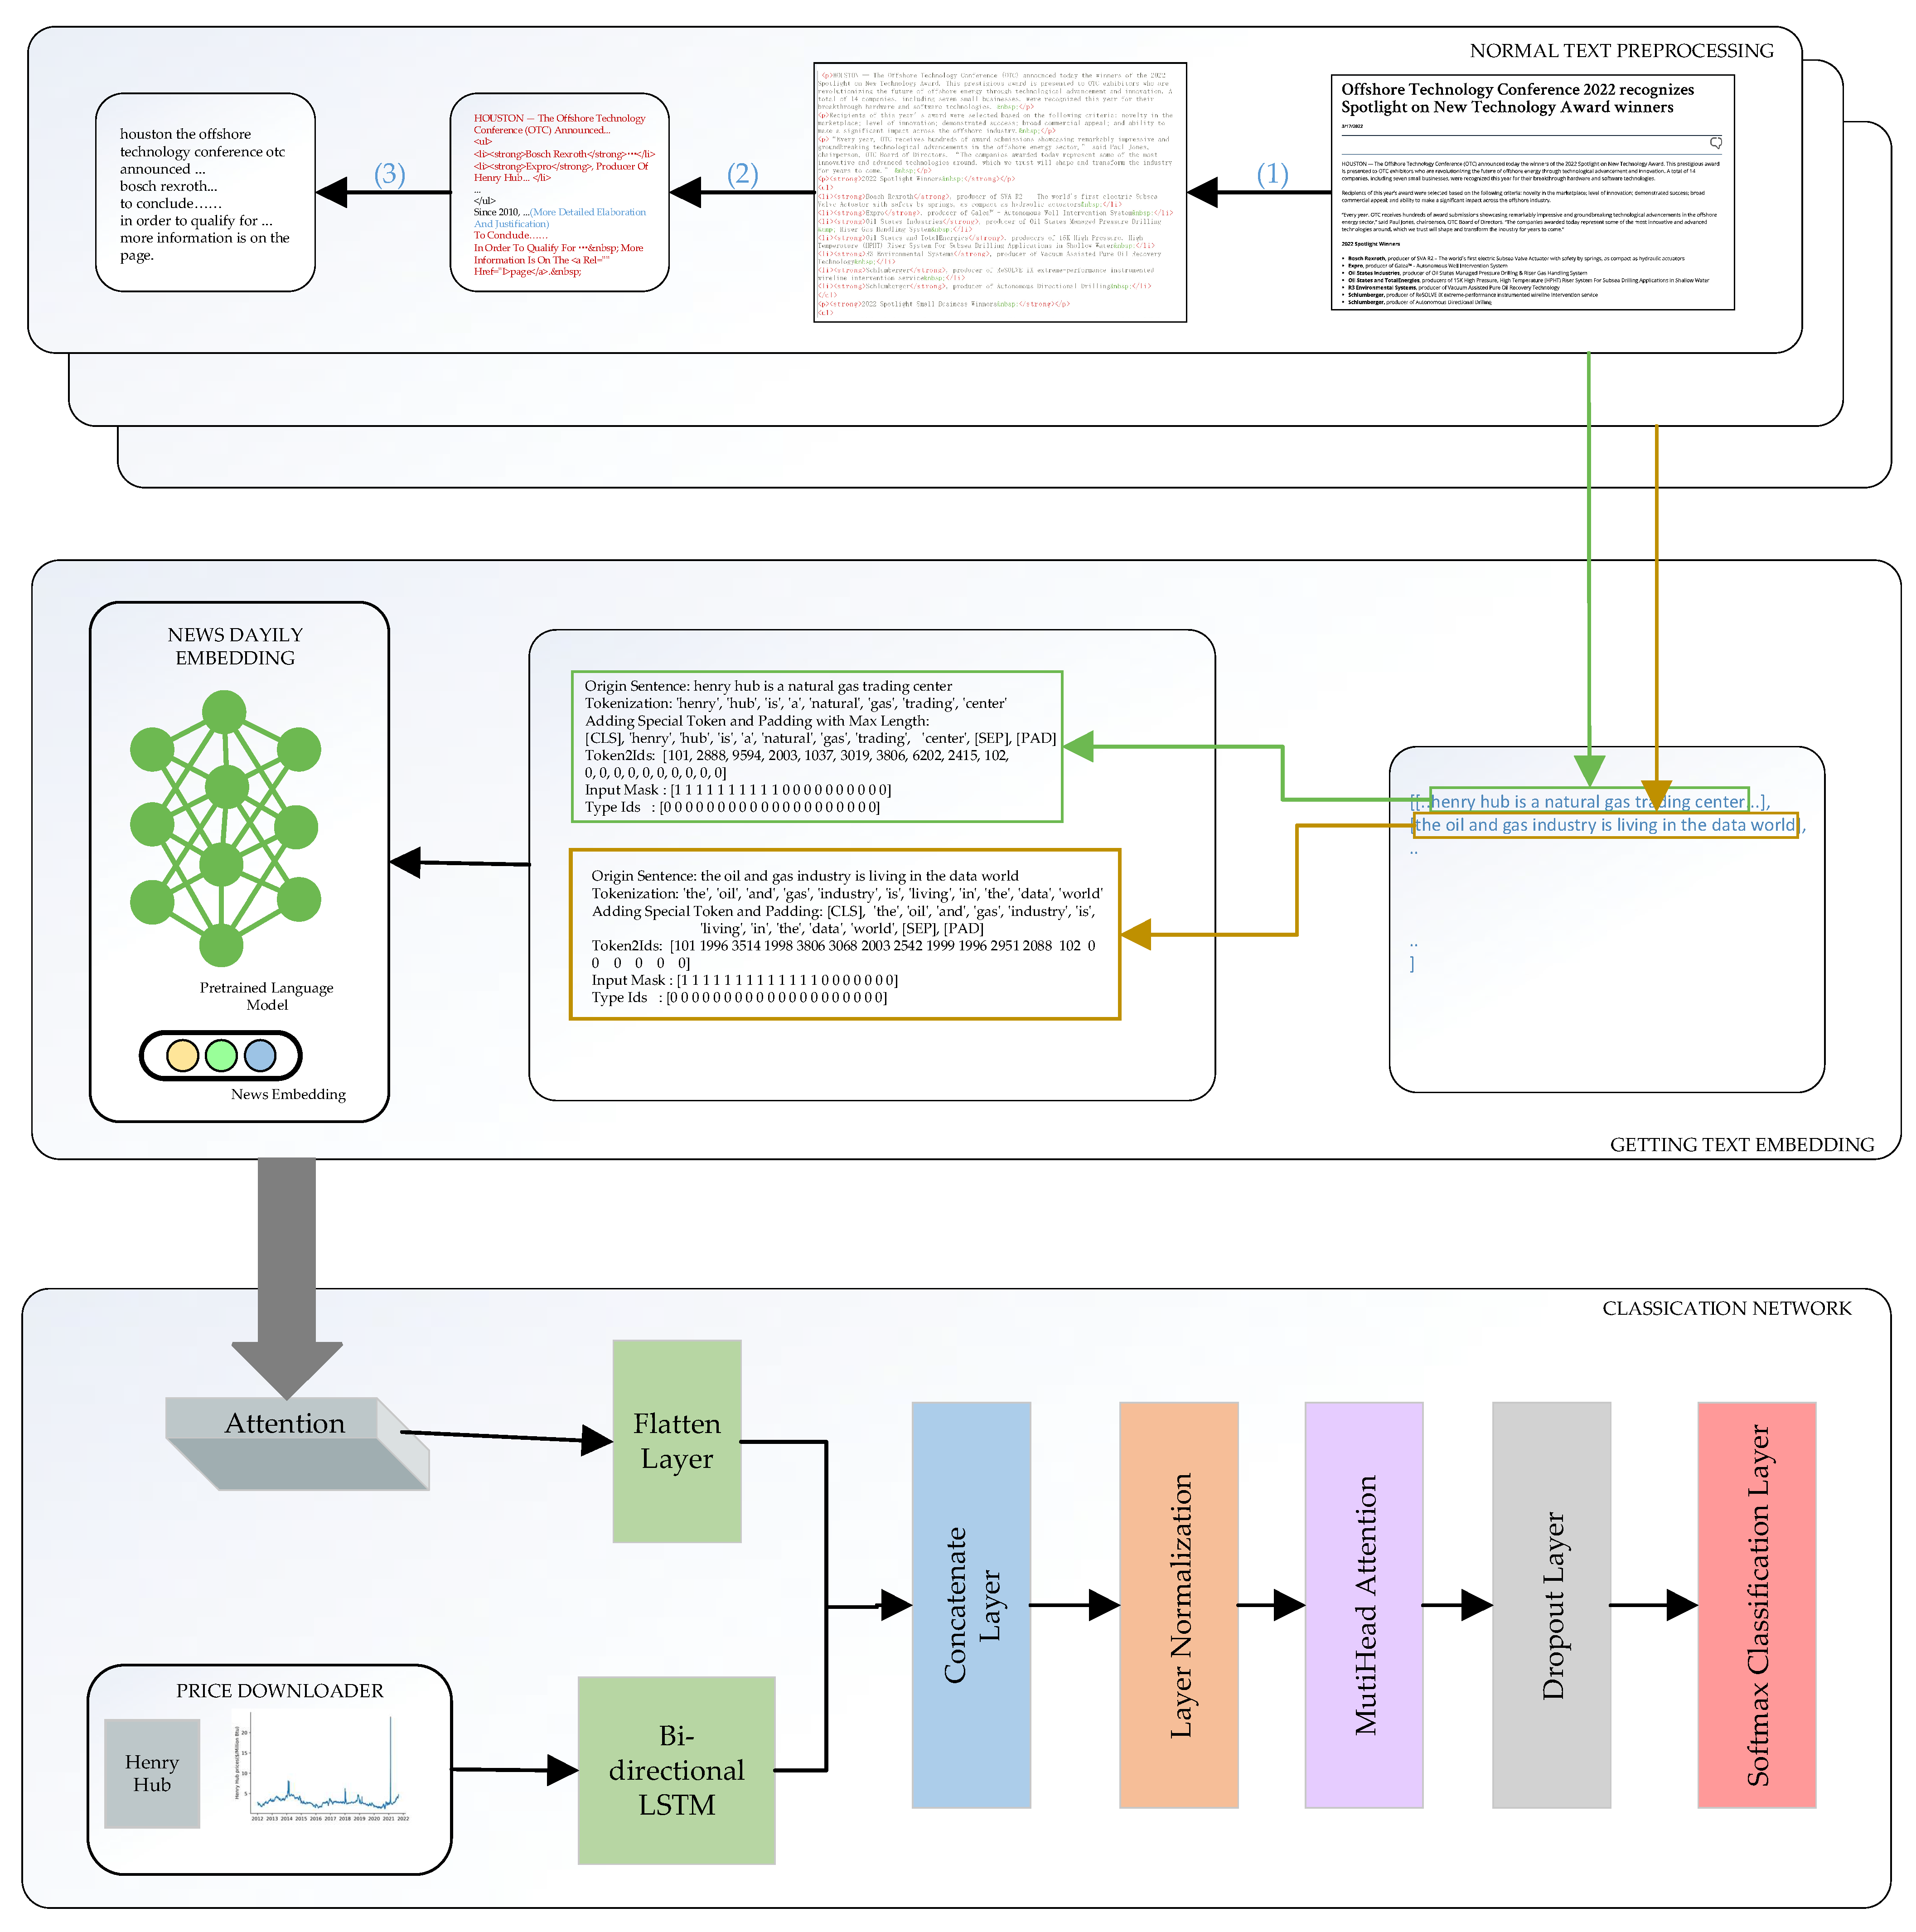
3.2. Materials Preprocessing
3.3. Summary of Methods
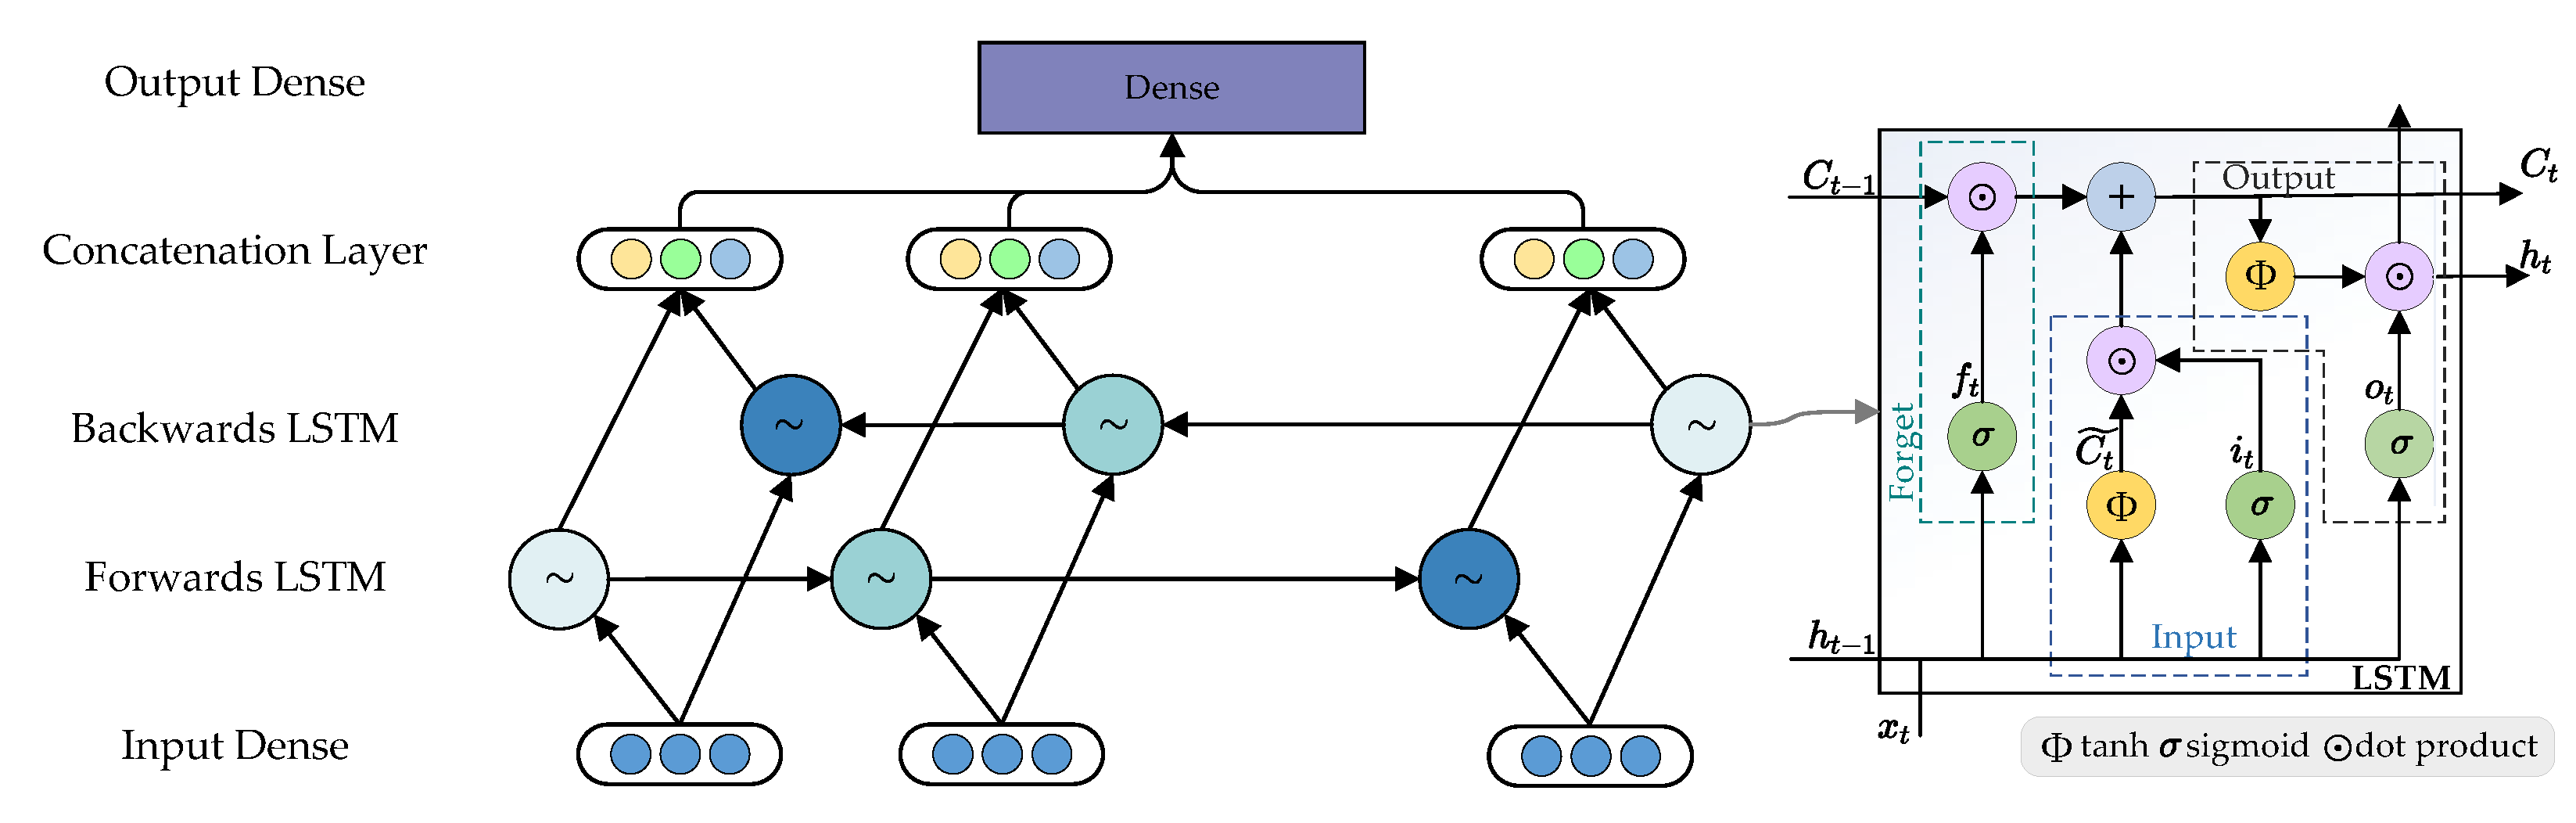
3.3.1. Price Module
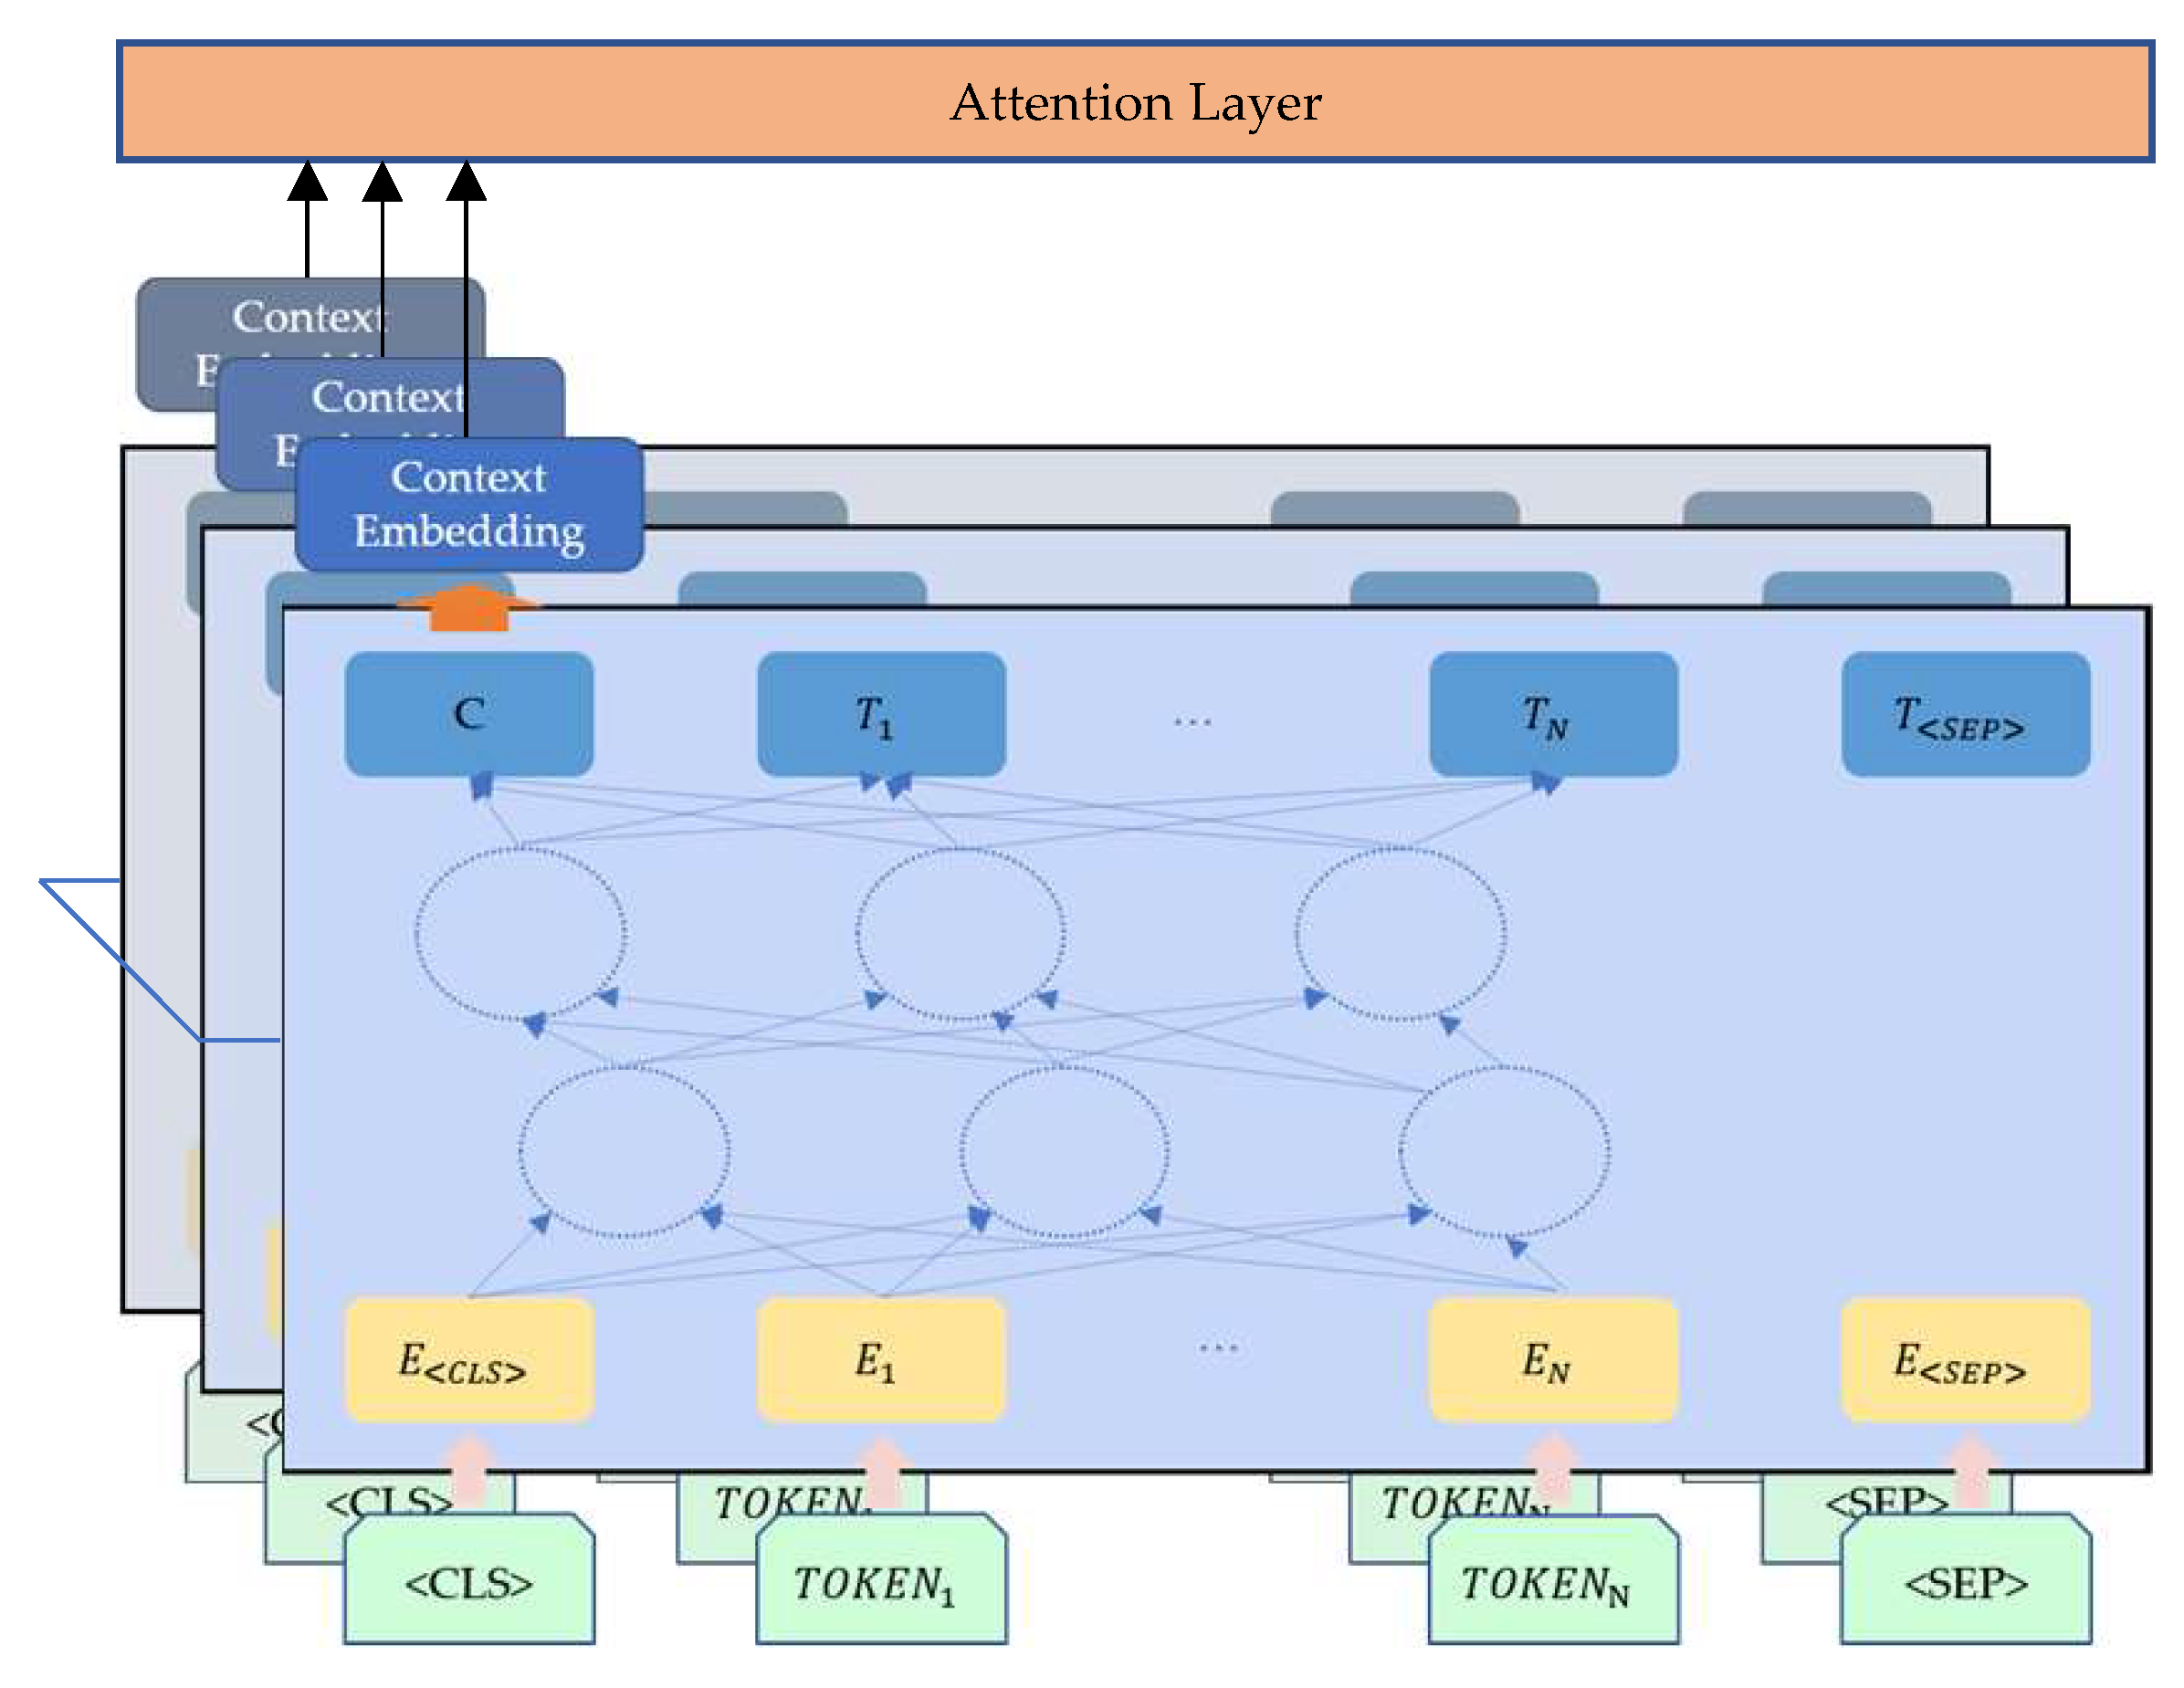
3.3.2. News Module
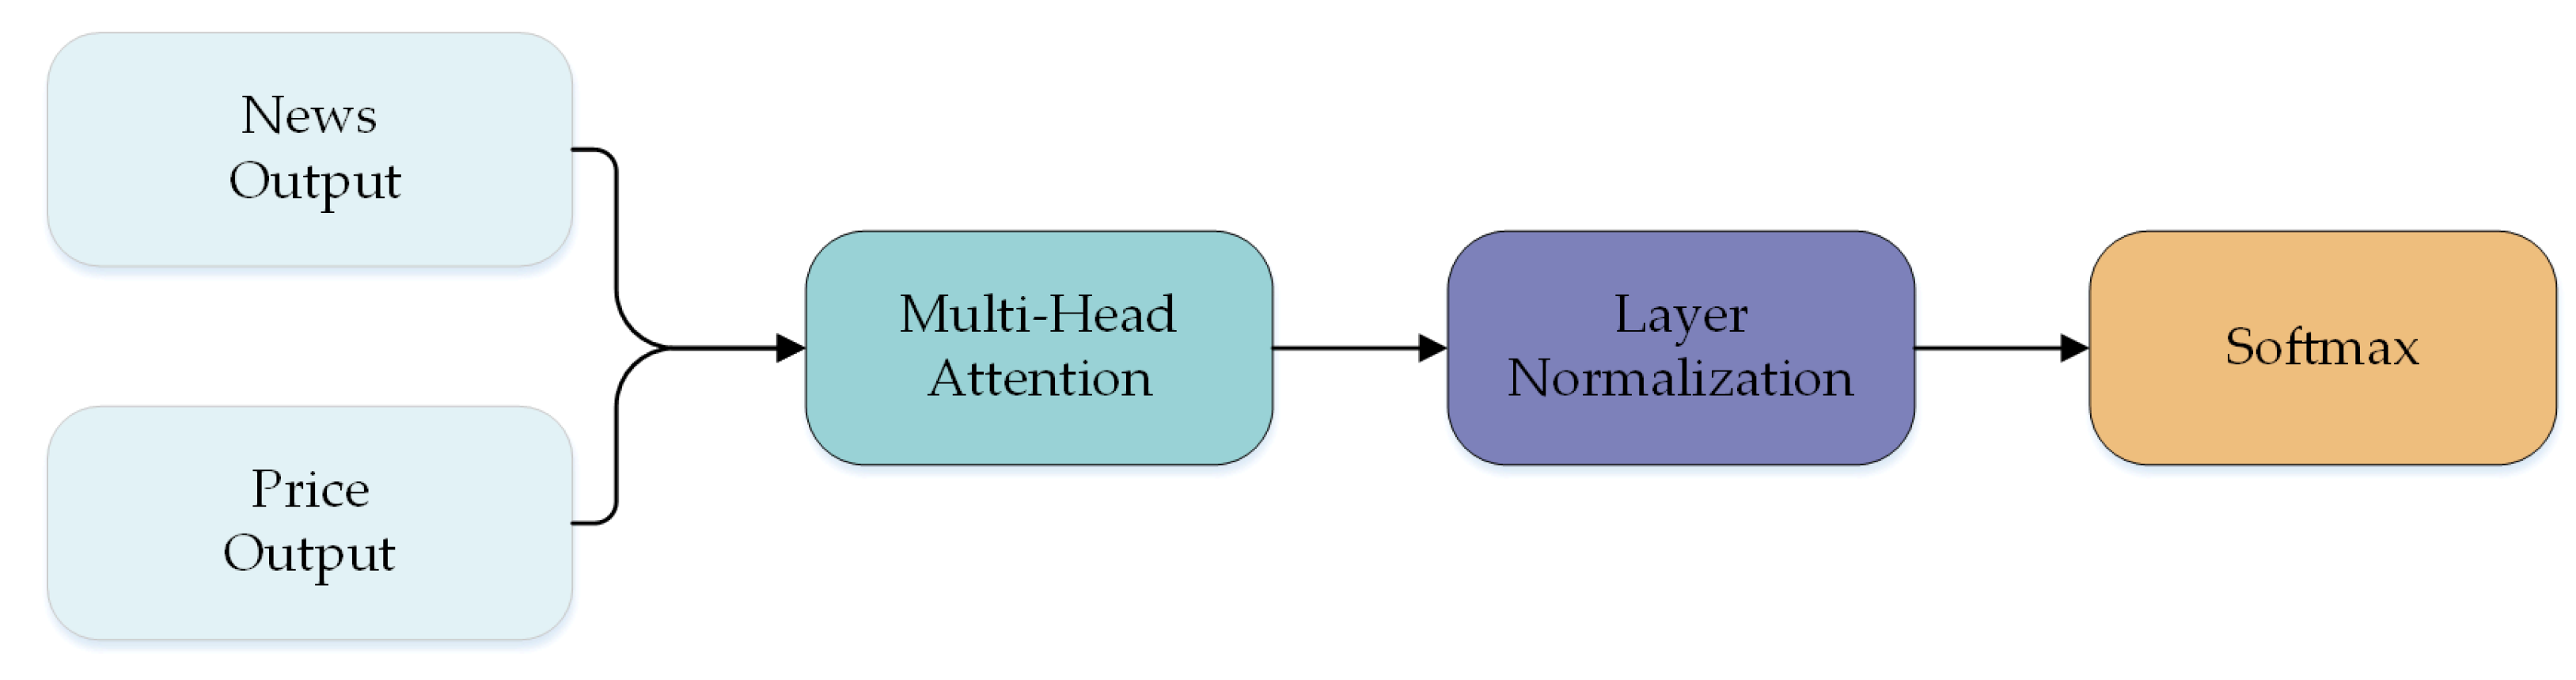
3.3.3. Merged Module
3.4. Evaluation of Results
4. Results
4.1. Experimental Setup
4.2. Comparison Benchmarks
- Price Prediction Measure
- ARIMA: Autoregressive integrated moving average model. It combines three methods: auto-regression, I-for integrated, moving average. Non-stationary data are made stable by subtracting y to achieve the purpose of accurate prediction. ARIMA is often used for regression. We get the classification result by subtracting ARIMA regression result and real value.
- Text Prediction Measure
- FASTTEXT: It superimposes and averages the word embedding presented by the word-level n-gram algorithm to get the document’s vector. Then, a hierarchical SoftMax is used for multi-classification.
- News-Price Prediction Measure
- LSTM: Long Short-Term Memory is an advanced RNN that can store more information.
- TCN: Temporal Convolutional Network uses dilated causal convolution and padding layers to catch temporal series.
- k-NN: k-Nearest Neighbor. The method uses Euclidean Distance to measure similarity in different time series by mapping each point in the time series as a feature. In order to achieve better scores, we range k from 1 to 31 and take the best accuracy as the final result.
- RANDFOREST: Random Forest classifier. The random forest uses 100 decision tree classifiers to estimate the accuracy of dataset, while the whole dataset is used to build each tree.
4.3. Results
- BERT model provides an informative embedding of whole news content.
- Attention in text module catches better hierarchical structure and semantic information.
- Progressive temporal message is passed to the network through LSTM and transformer in different levels.
4.4. Model Component Ablation Study
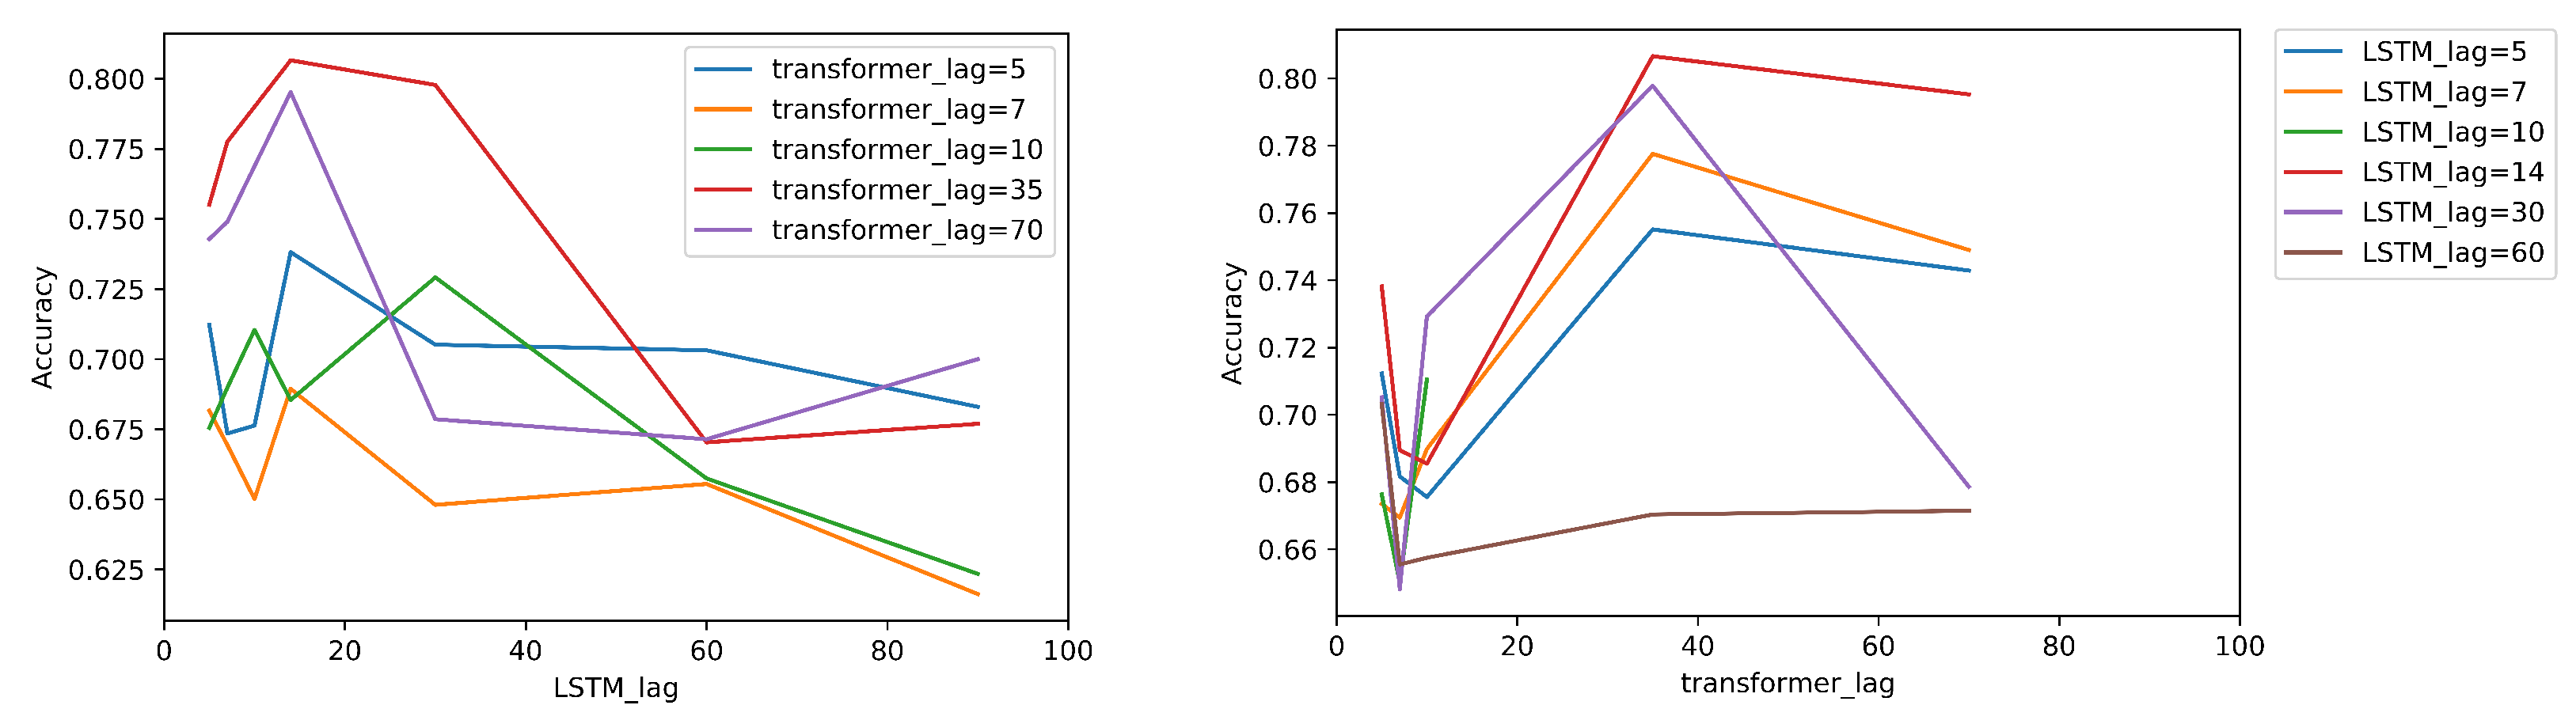
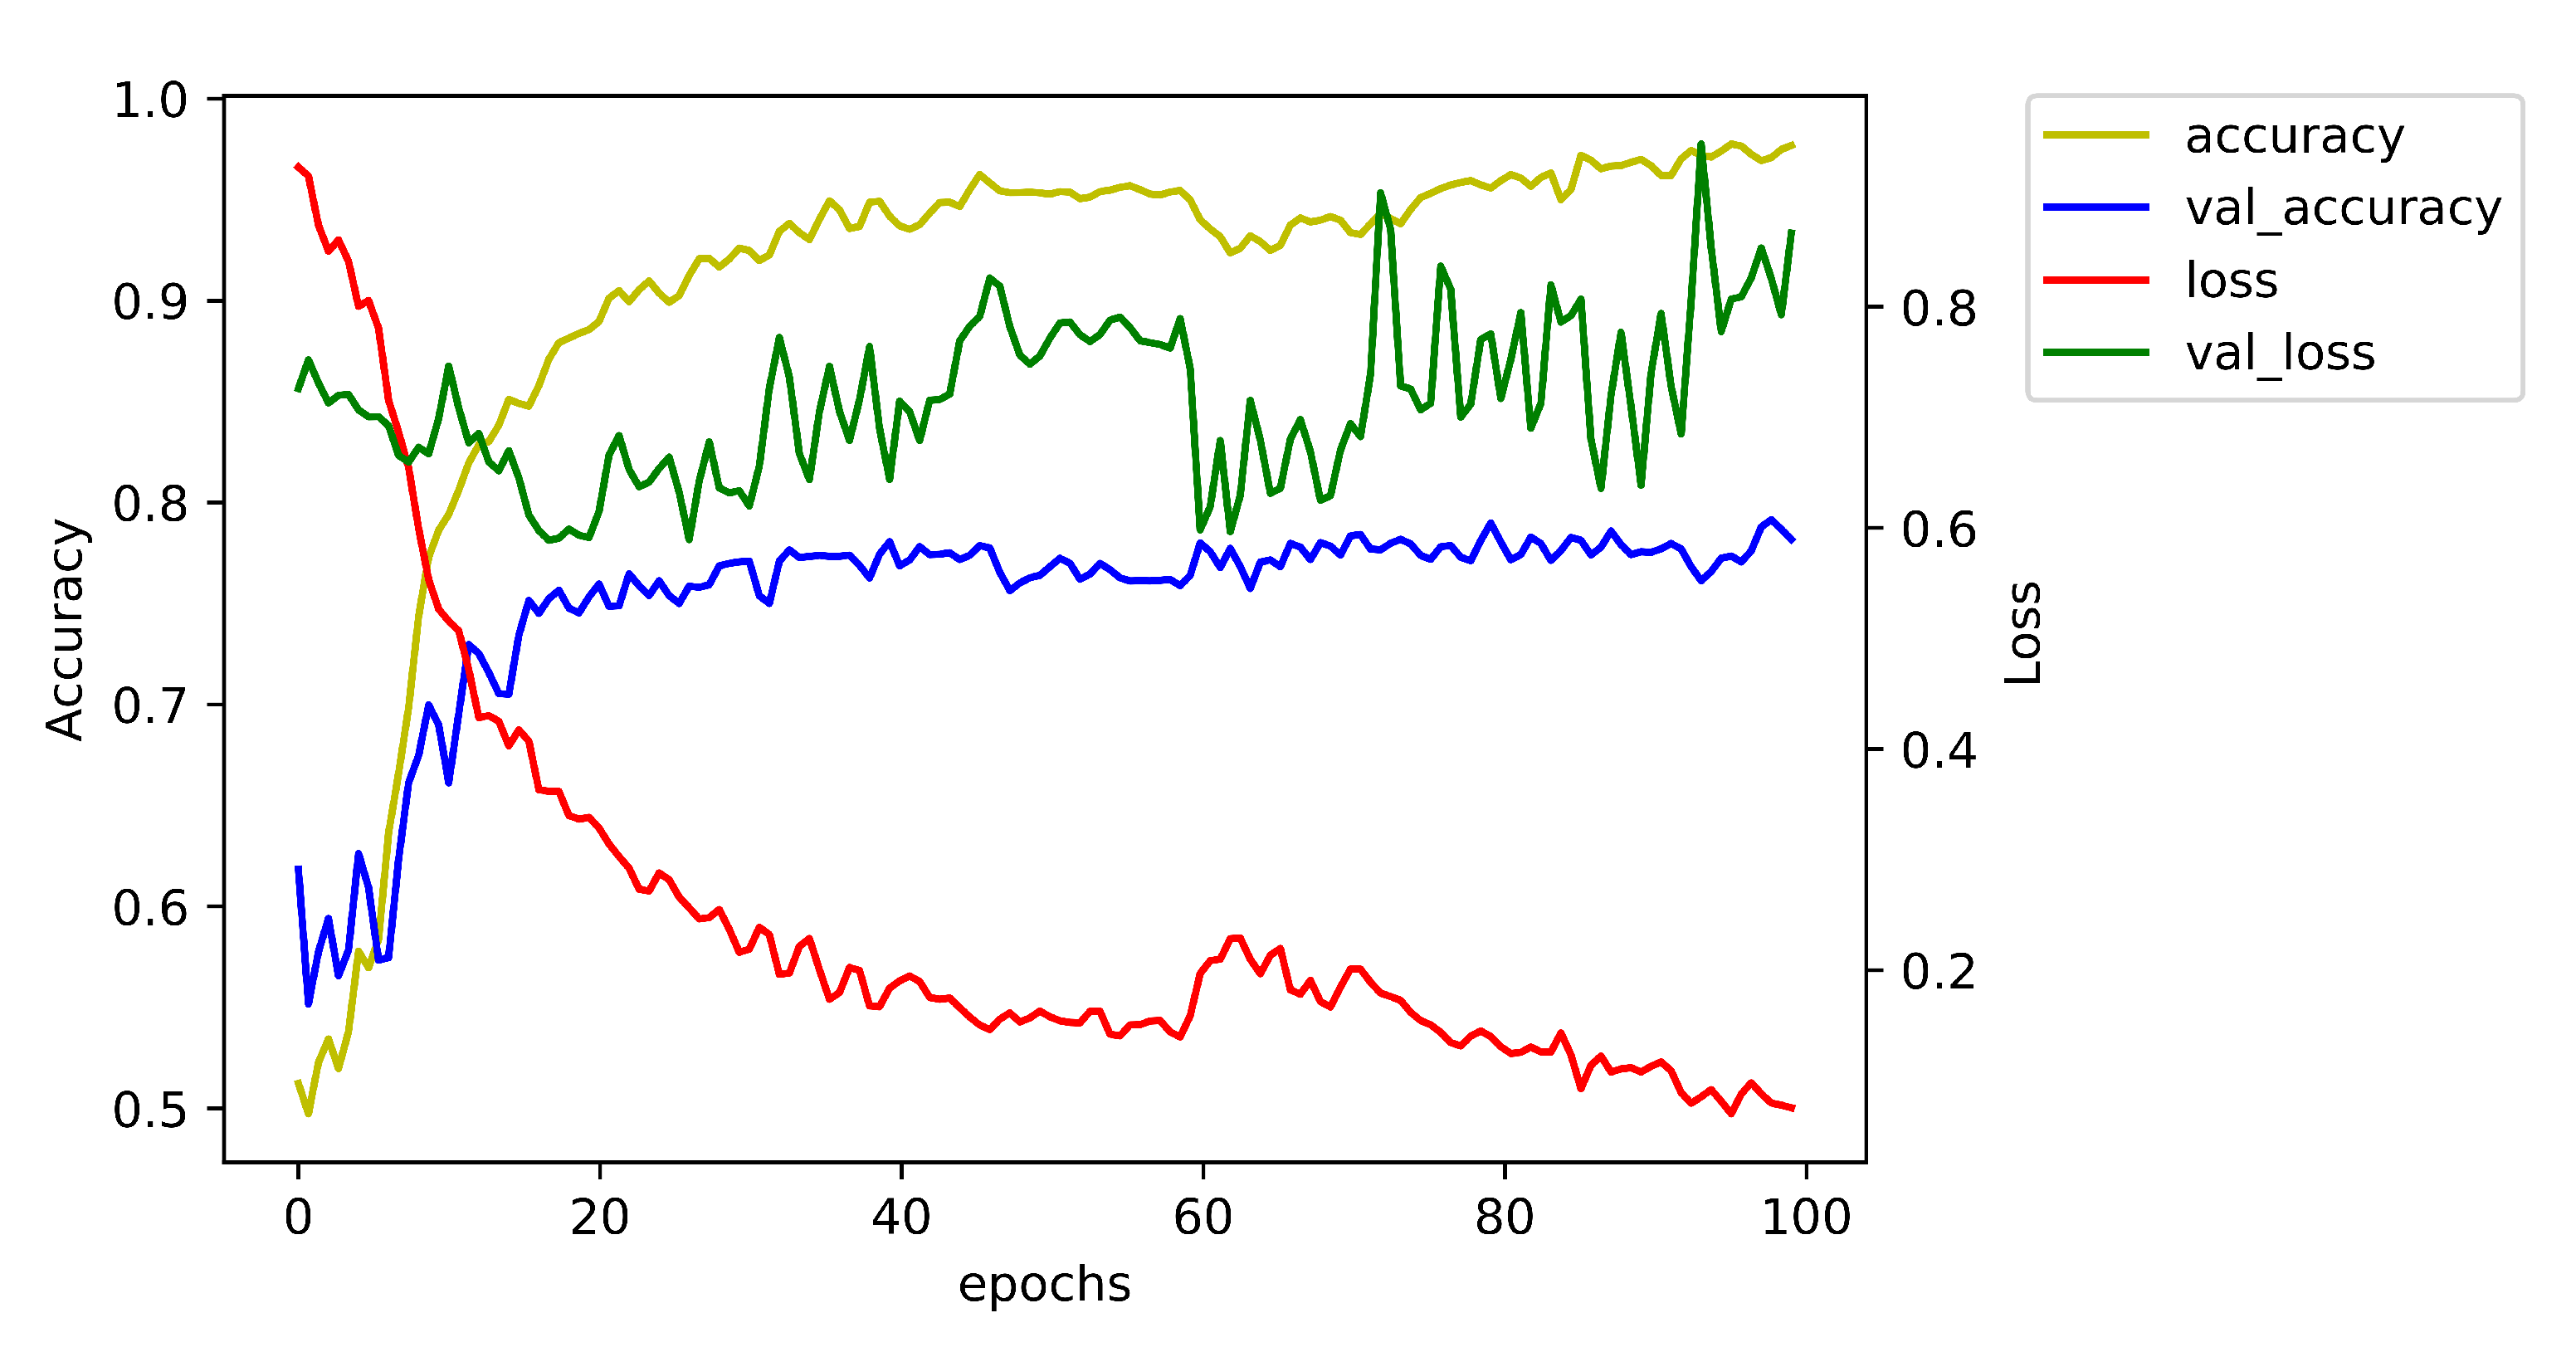
4.5. Parameter Analysis: Probing Sensitivity Evaluation of Results
5. Conclusions
- We combine the related news and historical prices of natural gas prices to obtain event and trends information in our model.
- We use a BERT-attention model for text embedding to retrieve more semantic information. BERT model generates an informative embedding of news content in document level. Text attention offers a weighted matrix given to multiple articles on the same day in multi-document level. In this way, the everyday news embedding is of better hierarchical structure and semantic information.
- We use two time-related modules. It is important to master the temporal scale. We can abandon useless messages and keep vital information from the past. Meanwhile, we can gain more recent situations and further trend in different time modules.
Author Contributions
Funding
Institutional Review Board Statement
Informed Consent Statement
Data Availability Statement
Conflicts of Interest
Abbreviations
| RNN | Recurrent Neural Network |
| GRU | Gated Recurrent Unit |
| CNN | Convolutional Neural Network |
| LSTM | Long Short-Term Memory |
| TCN | Temporal Convolutional Network |
| TF-IDF | term frequency-inverse document frequency |
| BOW | Bag-of-Words |
| SVM | Support Vector Machines |
| MLP | Multi-Layer Perceptron |
| LR | Logistic Regression |
| WTI | West Texas Intermediate |
| ARIMA | Autoregressive Integrated Moving Average model |
| FNN | Fuzzy Neural Network |
| NYMEX | New York Commodity Exchange Incorporation |
| HMTL | HyperText Markup Language |
| BERT | Bidirectional Encoder Representation from Transformers |
| GPU | Graphics Processing Unit |
Appendix A

| Network Component Name | Output Dim |
|---|---|
| Price Input | (1, 35, 30) |
| Price Reshape | (1, 35, 30, 1) |
| LSTM1 | (35, 30, 32) |
| LSTM2 | (35, 30, 32) |
| LSTM Bidirectional | (35, 30, 64) |
| LSTM Concatenation | (35, 1920) |
| Text Price | (1, 35, 33, 512) |
| Head × Text Attention | (35, 33, 512) |
| Head × Text Attention Flatten | (35, 16,896) |
| Text Dropout | (35, 16,896) |
| Text Expand Dim | (1, 35, 16,896) |
| Text Concatenation | (1, 35, 16,896) |
| Text Price Concatenation | (1, 35, 18,816) |
| TransformerHead × Text Price Dense | (1, 35, 32) |
| TransformerHead × Transformer Attention | (1, 35, 32) |
| TransformerHead × Layer Normalization1 | (1, 35, 32) |
| TransformerHead × Transformer Dense | (1, 35, 32) |
| TransformerHead × Transformer Dropout | (1, 35, 32) |
| TransformerHead × Layer Normalization2 | (1, 35, 32) |
| Overall Dense | (1, 35, 128) |
| Overall Dropout | (1, 35, 128) |
| SoftMax Layer | (1, 35, 2) |
References
- U.S. Energy Information Administration (EIA). Total Energy Monthly Data. Available online: https://www.eia.gov/totalenergy/data/monthly/index.php (accessed on 4 April 2022).
- U.S. Energy Information Administration (EIA). Natural Gas and the Environment. Available online: https://www.eia.gov/energyexplained/natural-gas/natural-gas-and-the-environment.php (accessed on 4 April 2022).
- Zhang, D.; Paltsev, S. The future of natural gas in China: Effects of pricing reform and climate policy. Clim. Chang. Econ. 2016, 7, 1650012. [Google Scholar] [CrossRef] [Green Version]
- Herberg, M.E. Asia’s Uncertain LNG Future; The National Bureau of Asian Research: Seattle, WA, USA; Washington, DC, USA, 2013. [Google Scholar]
- Li, Z.; Huang, Z.; Failler, P. Dynamic Correlation between Crude Oil Price and Investor Sentiment in China: Heterogeneous and Asymmetric Effect. Energies 2022, 15, 687. [Google Scholar] [CrossRef]
- Gupta, R.; Pierdzioch, C.; Wong, W.K. A Note on Forecasting the Historical Realized Variance of Oil-Price Movements: The Role of Gold-to-Silver and Gold-to-Platinum Price Ratios. Energies 2021, 14, 6775. [Google Scholar] [CrossRef]
- Kirikkaleli, D.; Darbaz, I. The Causal Linkage between Energy Price and Food Price. Energies 2021, 14, 4182. [Google Scholar] [CrossRef]
- Tarczyński, W.; Mentel, U.; Mentel, G.; Shahzad, U. The Influence of Investors’ Mood on the Stock Prices: Evidence from Energy Firms in Warsaw Stock Exchange, Poland. Energies 2021, 14, 7396. [Google Scholar] [CrossRef]
- Nuryyev, G.; Korol, T.; Tetin, I. Hold-Up Problems in International Gas Trade: A Case Study. Energies 2021, 14, 4984. [Google Scholar] [CrossRef]
- Orzeszko, W. Nonlinear Causality between Crude Oil Prices and Exchange Rates: Evidence and Forecasting. Energies 2021, 14, 6043. [Google Scholar] [CrossRef]
- Szturo, M.; Włodarczyk, B.; Miciuła, I.; Szturo, K. The Essence of Relationships between the Crude Oil Market and Foreign Currencies Market Based on a Study of Key Currencies. Energies 2021, 14, 7978. [Google Scholar] [CrossRef]
- Candila, V.; Maximov, D.; Mikhaylov, A.; Moiseev, N.; Senjyu, T.; Tryndina, N. On the Relationship between Oil and Exchange Rates of Oil-Exporting and Oil-Importing Countries: From the Great Recession Period to the COVID-19 Era. Energies 2021, 14, 8046. [Google Scholar] [CrossRef]
- Peng, J.; Li, Z.; Drakeford, B.M. Dynamic Characteristics of Crude Oil Price Fluctuation—From the Perspective of Crude Oil Price Influence Mechanism. Energies 2020, 13, 4465. [Google Scholar] [CrossRef]
- Chatfield, C. The Holt-winters forecasting procedure. J. R. Stat. Soc. Ser. C (Appl. Stat.) 1978, 27, 264–279. [Google Scholar] [CrossRef]
- Heschel, A.J. The Prophets; Harper Torchbooks: New York, NY, USA, 1962; Volume 2. [Google Scholar]
- Graves, A. Long Short-Term Memory. In Supervised Sequence Labelling with Recurrent Neural Networks; Springer: Berlin/Heidelberg, Germany, 2012; pp. 37–45. [Google Scholar] [CrossRef]
- Chung, J.; Gulcehre, C.; Cho, K.; Bengio, Y. Empirical evaluation of gated recurrent neural networks on sequence modeling. In Proceedings of the NIPS 2014 Workshop on Deep Learning, Montreal, QC, Canada, 12–13 December 2014. [Google Scholar]
- Graves, A.; Mohamed, A.; Hinton, G.E. Speech recognition with deep recurrent neural networks. In Proceedings of the IEEE International Conference on Acoustics, Speech and Signal Processing, ICASSP 2013, Vancouver, BC, Canada, 26–31 May 2013; IEEE: Hoboken, NJ, USA, 2013; pp. 6645–6649. [Google Scholar] [CrossRef] [Green Version]
- Bai, S.; Kolter, J.Z.; Koltun, V. An Empirical Evaluation of Generic Convolutional and Recurrent Networks for Sequence Modeling. arXiv 2018, arXiv:1803.01271. [Google Scholar]
- Burges, C.J.C. A Tutorial on Support Vector Machines for Pattern Recognition. Data Min. Knowl. Discov. 1998, 2, 121–167. [Google Scholar] [CrossRef]
- Smola, A.J.; Schölkopf, B. On a Kernel-Based Method for Pattern Recognition, Regression, Approximation, and Operator Inversion. Algorithmica 1998, 22, 211–231. [Google Scholar] [CrossRef]
- Chen, Z.; Cao, S.; Mao, Z. Remaining useful life estimation of aircraft engines using a modified similarity and supporting vector machine (SVM) approach. Energies 2018, 11, 28. [Google Scholar] [CrossRef] [Green Version]
- Zhou, Y.; Wu, J.; Yu, Z.; Ji, L.; Hao, L. A hierarchical method for transient stability prediction of power systems using the confidence of a SVM-based ensemble classifier. Energies 2016, 9, 778. [Google Scholar] [CrossRef] [Green Version]
- Mendonça de Paiva, G.; Pires Pimentel, S.; Pinheiro Alvarenga, B.; Gonçalves Marra, E.; Mussetta, M.; Leva, S. Multiple site intraday solar irradiance forecasting by machine learning algorithms: MGGP and MLP neural networks. Energies 2020, 13, 3005. [Google Scholar] [CrossRef]
- Wang, F.; Yu, Y.; Wang, X.; Ren, H.; Shafie-Khah, M.; Catal ao, J.P. Residential electricity consumption level impact factor analysis based on wrapper feature selection and multinomial logistic regression. Energies 2018, 11, 1180. [Google Scholar] [CrossRef] [Green Version]
- Manoharan, H.; Teekaraman, Y.; Kirpichnikova, I.; Kuppusamy, R.; Nikolovski, S.; Baghaee, H.R. Smart Grid Monitoring by Wireless Sensors Using Binary Logistic Regression. Energies 2020, 13, 3974. [Google Scholar] [CrossRef]
- Joulin, A.; Grave, E.; Bojanowski, P.; Mikolov, T. Bag of Tricks for Efficient Text Classification. In Proceedings of the 15th Conference of the European Chapter of the Association for Computational Linguistics, EACL 2017, Valencia, Spain, 3–7 April 2017; Volume 2: Short Papers. Lapata, M., Blunsom, P., Koller, A., Eds.; Association for Computational Linguistics: Stroudsburg, PA, USA, 2017; pp. 427–431. [Google Scholar] [CrossRef]
- Vaswani, A.; Shazeer, N.; Parmar, N.; Uszkoreit, J.; Jones, L.; Gomez, A.N.; Kaiser, L.; Polosukhin, I. Attention is All you Need. In Advances in Neural Information Processing Systems 30: Annual Conference on Neural Information Processing Systems 2017, Long Beach, CA, USA, 4–9 December 2017; Guyon, I., von Luxburg, U., Bengio, S., Wallach, H.M., Fergus, R., Vishwanathan, S.V.N., Garnett, R., Eds.; Curran Associates Inc.: Red Hook, NY, USA, 2017; pp. 5998–6008. [Google Scholar]
- Salazar, J.; Liang, D.; Nguyen, T.Q.; Kirchhoff, K. Masked Language Model Scoring. In Proceedings of the 58th Annual Meeting of the Association for Computational Linguistics, ACL 2020, Online, 5–10 July 2020; Jurafsky, D., Chai, J., Schluter, N., Tetreault, J.R., Eds.; Association for Computational Linguistics: Stroudsburg, PA, USA, 2020; pp. 2699–2712. [Google Scholar] [CrossRef]
- Puka, R.; Łamasz, B.; Michalski, M. Effectiveness of Artificial Neural Networks in Hedging against WTI Crude Oil Price Risk. Energies 2021, 14, 3308. [Google Scholar] [CrossRef]
- Mouchtaris, D.; Sofianos, E.; Gogas, P.; Papadimitriou, T. Forecasting Natural Gas Spot Prices with Machine Learning. Energies 2021, 14, 5782. [Google Scholar] [CrossRef]
- Manowska, A.; Rybak, A.; Dylong, A.; Pielot, J. Forecasting of Natural Gas Consumption in Poland Based on ARIMA-LSTM Hybrid Model. Energies 2021, 14, 8597. [Google Scholar] [CrossRef]
- Hu, Z. Crude oil price prediction using CEEMDAN and LSTM-attention with news sentiment index. Oil Gas Sci. Technol.-D’IFP Energies Nouv. 2021, 76, 28. [Google Scholar] [CrossRef]
- Witten, I.H.; Paynter, G.W.; Frank, E.; Gutwin, C.; Nevill-Manning, C.G. Kea: Practical automated keyphrase extraction. In Design and Usability of Digital Libraries: Case Studies in the Asia Pacific; IGI Global: Hershey, PA, USA, 2005; pp. 129–152. [Google Scholar]
- Pinto, M.V.; Asnani, K. Stock price prediction using quotes and financial news. Int. J. Soft Comput. Eng. 2011, 1, 266–269. [Google Scholar]
- Wu, B.; Wang, L.; Lv, S.X.; Zeng, Y.R. Effective crude oil price forecasting using new text-based and big-data-driven model. Measurement 2021, 168, 108468. [Google Scholar] [CrossRef]
- Wang, D.; Fang, T. Forecasting Crude Oil Prices with a WT-FNN Model. Energies 2022, 15, 1955. [Google Scholar] [CrossRef]
- Li, T.; Han, X.; Wang, A.; Li, H.; Liu, G.; Pei, Y. News-Based Research on Forecast of International Natural Gas Price Trend. In Fuzzy Systems and Data Mining VI—Proceedings of FSDM 2020, Virtual Event, 13–16 November 2020; Tallón-Ballesteros, A.J., Ed.; Frontiers in Artificial Intelligence and Applications/IOS Press: Amsterdam, The Netherlands, 2020; Volume 331, pp. 194–200. [Google Scholar] [CrossRef]
- Wang, G.; Cao, L.; Zhao, H.; Liu, Q.; Chen, E. Coupling Macro-Sector-Micro Financial Indicators for Learning Stock Representations with Less Uncertainty. In Proceedings of the Thirty-Fifth AAAI Conference on Artificial Intelligence, AAAI 2021, Thirty-Third Conference on Innovative Applications of Artificial Intelligence, IAAI 2021, The Eleventh Symposium on Educational Advances in Artificial Intelligence, EAAI 2021, Virtual Event, 2–9 February 2021; AAAI Press: Palo Alto, CA, USA, 2021; pp. 4418–4426. [Google Scholar]
- Sun, C.; Qiu, X.; Xu, Y.; Huang, X. How to fine-tune bert for text classification? In Proceedings of the China National Conference on Chinese Computational Linguistics, Kunming, China, 18–20 October 2019; Springer: Berlin/Heidelberg, Germany, 2019; pp. 194–206. [Google Scholar]
- Khattab, O.; Zaharia, M. Colbert: Efficient and effective passage search via contextualized late interaction over bert. In Proceedings of the 43rd International ACM SIGIR Conference on Research and Development in Information Retrieval, Virtual Event, 25–30 July 2020; pp. 39–48. [Google Scholar]
- Abadi, M.; Agarwal, A.; Barham, P.; Brevdo, E.; Chen, Z.; Citro, C.; Corrado, G.S.; Davis, A.; Dean, J.; Devin, M.; et al. TensorFlow: Large-Scale Machine Learning on Heterogeneous Distributed Systems. CoRR 2016, arXiv:1603.04467. [Google Scholar]
- Kingma, D.P.; Ba, J. Adam: A Method for Stochastic Optimization. In Proceedings of the 3rd International Conference on Learning Representations, ICLR 2015, San Diego, CA, USA, 7–9 May 2015; Conference Track Proceedings. Bengio, Y., LeCun, Y., Eds.; OpenReview.net, 2015. [Google Scholar]
- Glorot, X.; Bordes, A.; Bengio, Y. Deep Sparse Rectifier Neural Networks. In Proceedings of the Fourteenth International Conference on Artificial Intelligence and Statistics, AISTATS 2011, Fort Lauderdale, FL, USA, 11–13 April 2011; Gordon, G.J., Dunson, D.B., Dudík, M., Eds.; JMLR.org: Cambridge, MA, USA, 2011; Volume 15, pp. 315–323. [Google Scholar]
- He, K.; Zhang, X.; Ren, S.; Sun, J. Delving Deep into Rectifiers: Surpassing Human-Level Performance on ImageNet Classification. In Proceedings of the 2015 IEEE International Conference on Computer Vision, ICCV 2015, Santiago, Chile, 7–13 December 2015; IEEE Computer Society: Washington, DC, USA, 2015; pp. 1026–1034. [Google Scholar] [CrossRef] [Green Version]


| Price Statistics | News Statistics | Word Statistics | |||||||
|---|---|---|---|---|---|---|---|---|---|
| Raise. | Decline. | Unch. | Off. | Avg. | Min. | Max. | Avg. | Min. | Max. |
| 1046 | 1022 | 388 | 778 | 8.885 | 1 | 33 | 352.2 | 5 | 5495 |
| Accuracy | Precision | F1-Score | Recall | |
|---|---|---|---|---|
| TCN_PRICE | 0.6099 | 0.5088 | 0.1593 | 0.2427 |
| TCN_TEXT | 0.6358 | 0.5333 | 0.5714 | 0.5517 |
| TCN | 0.5194 | 0.4255 | 0.6429 | 0.5120 |
| KNN_PRICE | 0.5151 | 0.3675 | 0.3370 | 0.3516 |
| KNN_TEXT | 0.5302 | 0.3943 | 0.3812 | 0.3876 |
| KNN | 0.5043 | 0.3828 | 0.4420 | 0.4103 |
| LSTM_PRICE | 0.4418 | 0.3746 | 0.6319 | 0.4703 |
| LSTM_TEXT | 0.5690 | 0.4625 | 0.6099 | 0.5261 |
| LSTM | 0.5453 | 0.3876 | 0.2747 | 0.3215 |
| ARIMA_PRICE | 0.5558 | 0.0 | 0.0 | 0.0 |
| Fasttext_TEXT | 0.5690 | 0.5000 | 0.0005 | 0.0010 |
| RANDFOREST_PRICE | 0.5431 | 0.3176 | 0.1492 | 0.2030 |
| RANDFOREST_TEXT | 0.5259 | 0.3946 | 0.4033 | 0.3989 |
| RANDFOREST | 0.5259 | 0.3934 | 0.3978 | 0.3956 |
| Our Model | 0.7978 | 0.8483 | 0.6373 | 0.7278 |
| Validation Data | Test Data | |
|---|---|---|
| w/o text attention | 0.7061 | 0.7367 |
| w/o text attention & transformer | 0.6918 | 0.7306 |
| w/o text attention & transformer & BiLSTM | 0.6469 | 0.6102 |
| Our Model | 0.8126 | 0.7924 |
Publisher’s Note: MDPI stays neutral with regard to jurisdictional claims in published maps and institutional affiliations. |
© 2022 by the authors. Licensee MDPI, Basel, Switzerland. This article is an open access article distributed under the terms and conditions of the Creative Commons Attribution (CC BY) license (https://creativecommons.org/licenses/by/4.0/).
Share and Cite
Guan, R.; Wang, A.; Liang, Y.; Fu, J.; Han, X. International Natural Gas Price Trends Prediction with Historical Prices and Related News. Energies 2022, 15, 3573. https://doi.org/10.3390/en15103573
Guan R, Wang A, Liang Y, Fu J, Han X. International Natural Gas Price Trends Prediction with Historical Prices and Related News. Energies. 2022; 15(10):3573. https://doi.org/10.3390/en15103573
Chicago/Turabian StyleGuan, Renchu, Aoqing Wang, Yanchun Liang, Jiasheng Fu, and Xiaosong Han. 2022. "International Natural Gas Price Trends Prediction with Historical Prices and Related News" Energies 15, no. 10: 3573. https://doi.org/10.3390/en15103573
APA StyleGuan, R., Wang, A., Liang, Y., Fu, J., & Han, X. (2022). International Natural Gas Price Trends Prediction with Historical Prices and Related News. Energies, 15(10), 3573. https://doi.org/10.3390/en15103573