
Optimal Balance between Heating, Cooling and Environmental Impacts: A Method for Appropriate Assessment of Building Envelope’s U-Value

 ,
, 
 ,
,  and
and 
Abstract
:1. Introduction
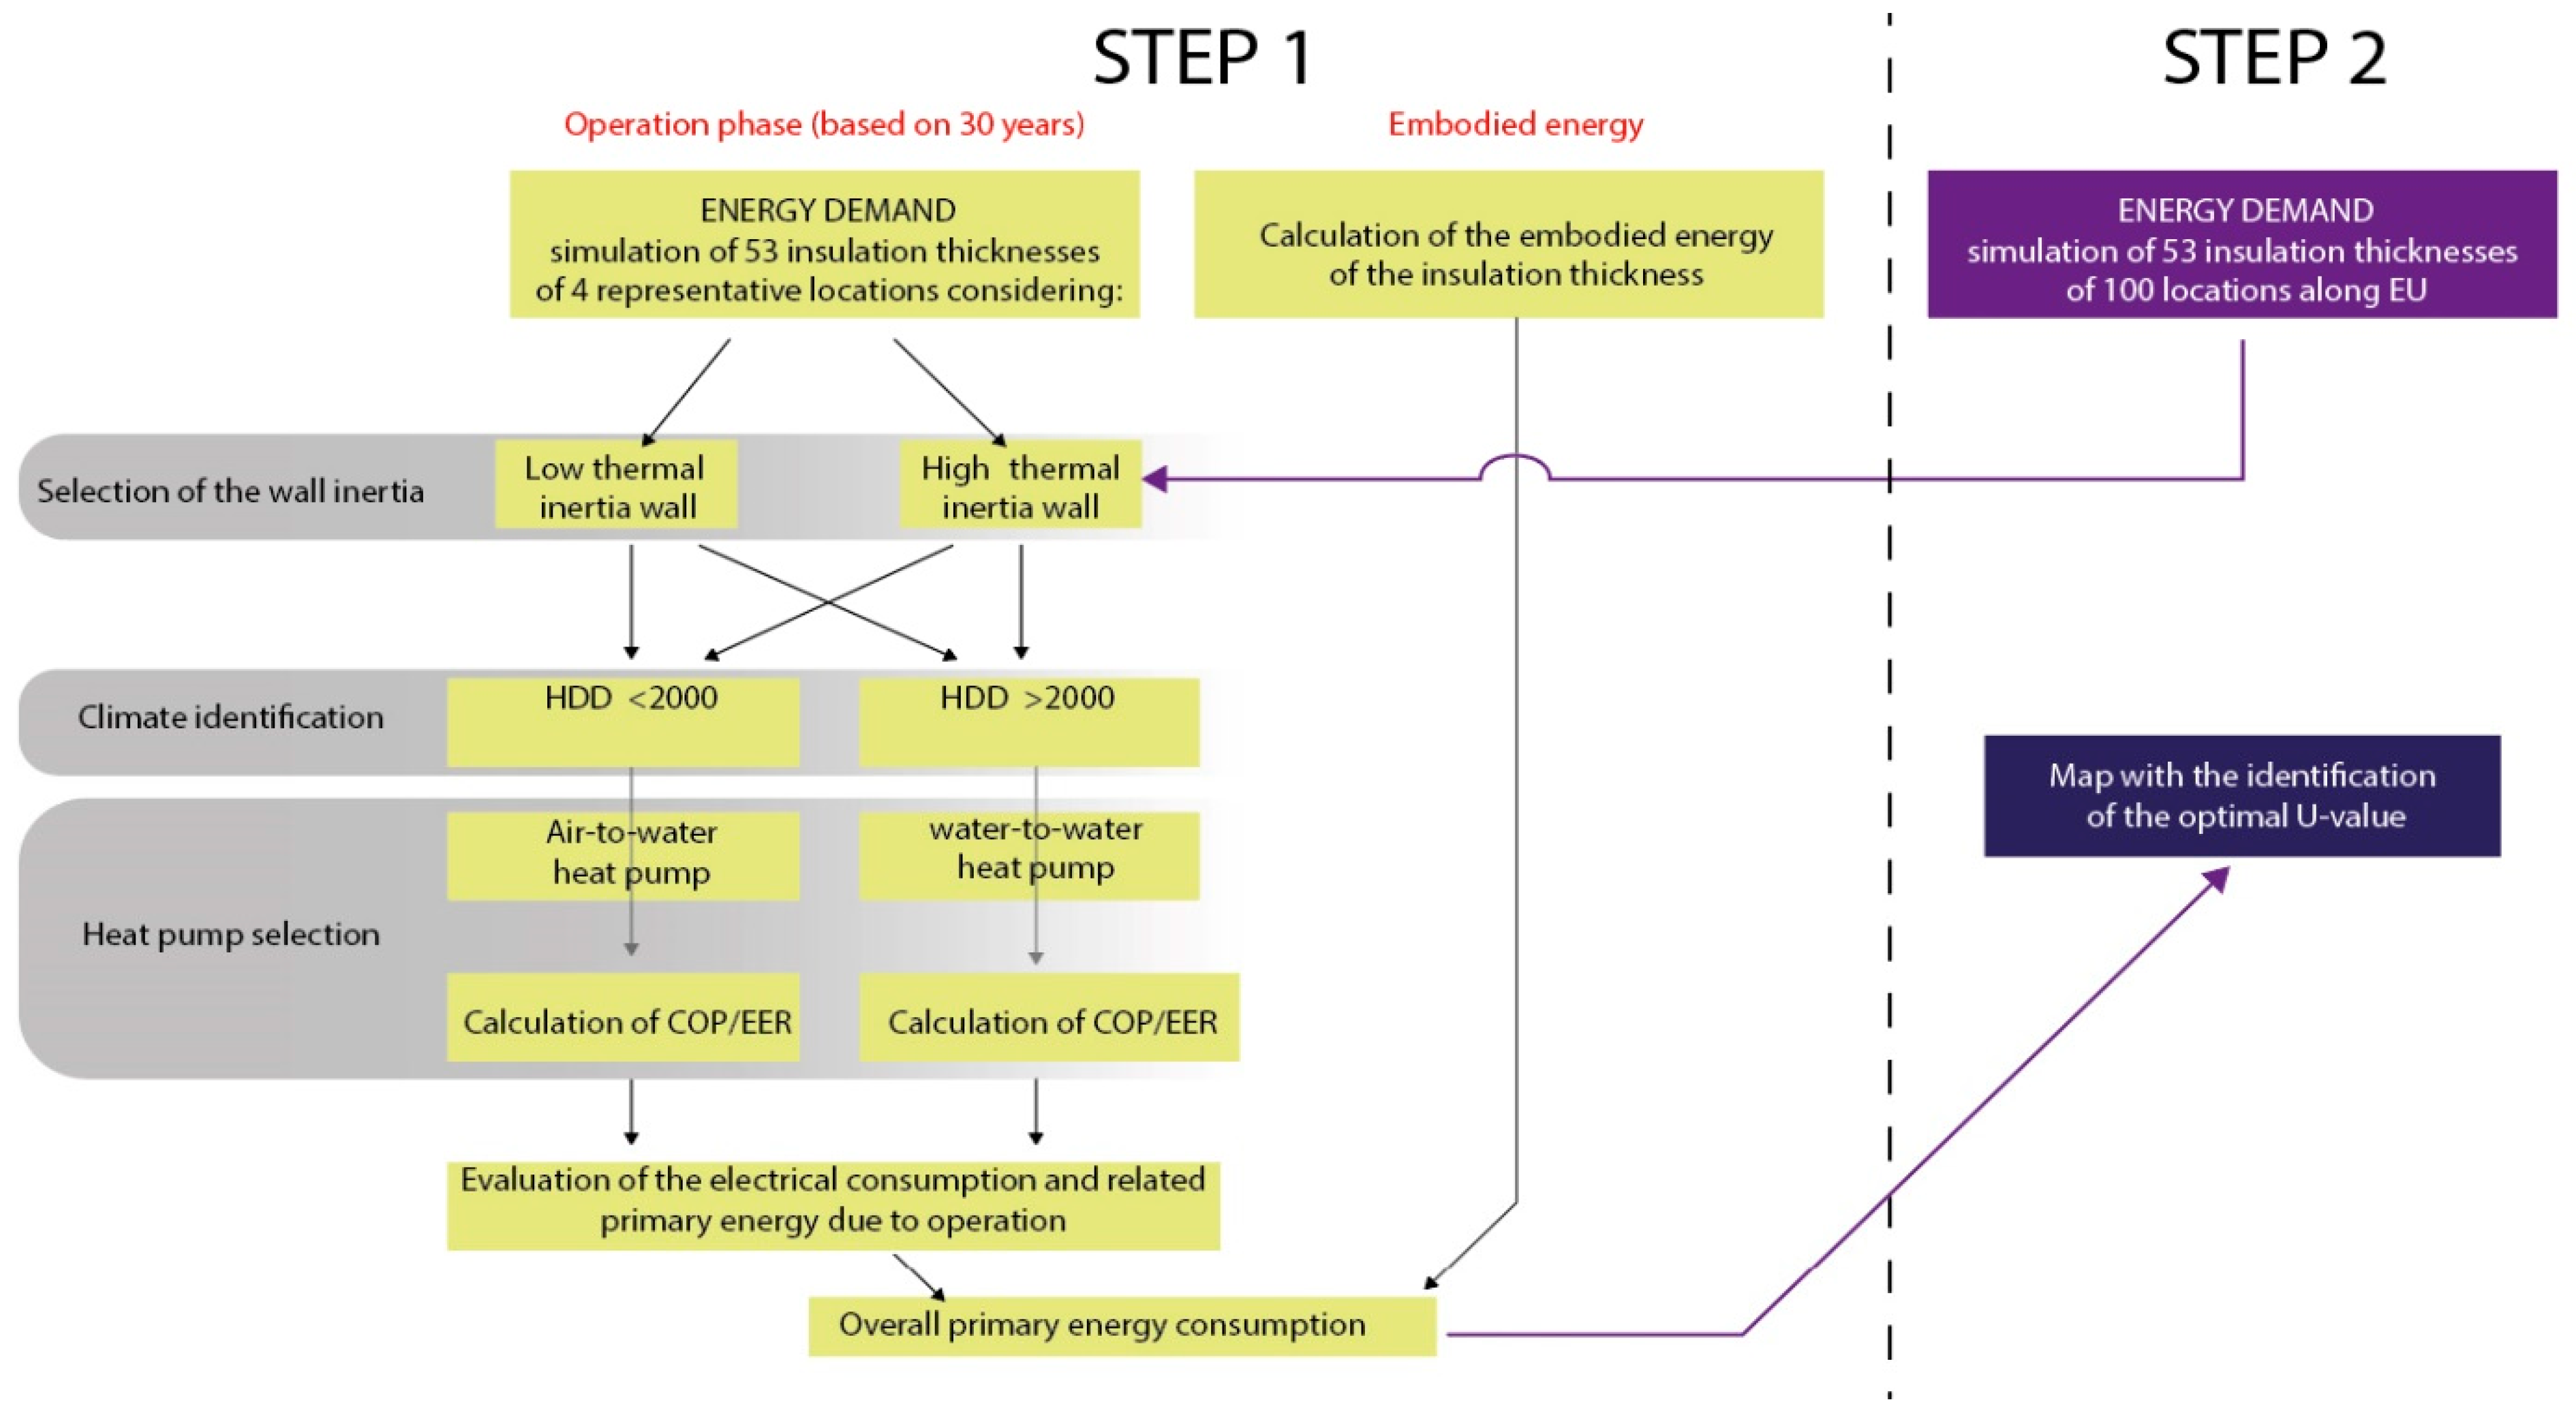
2. Research Methodology
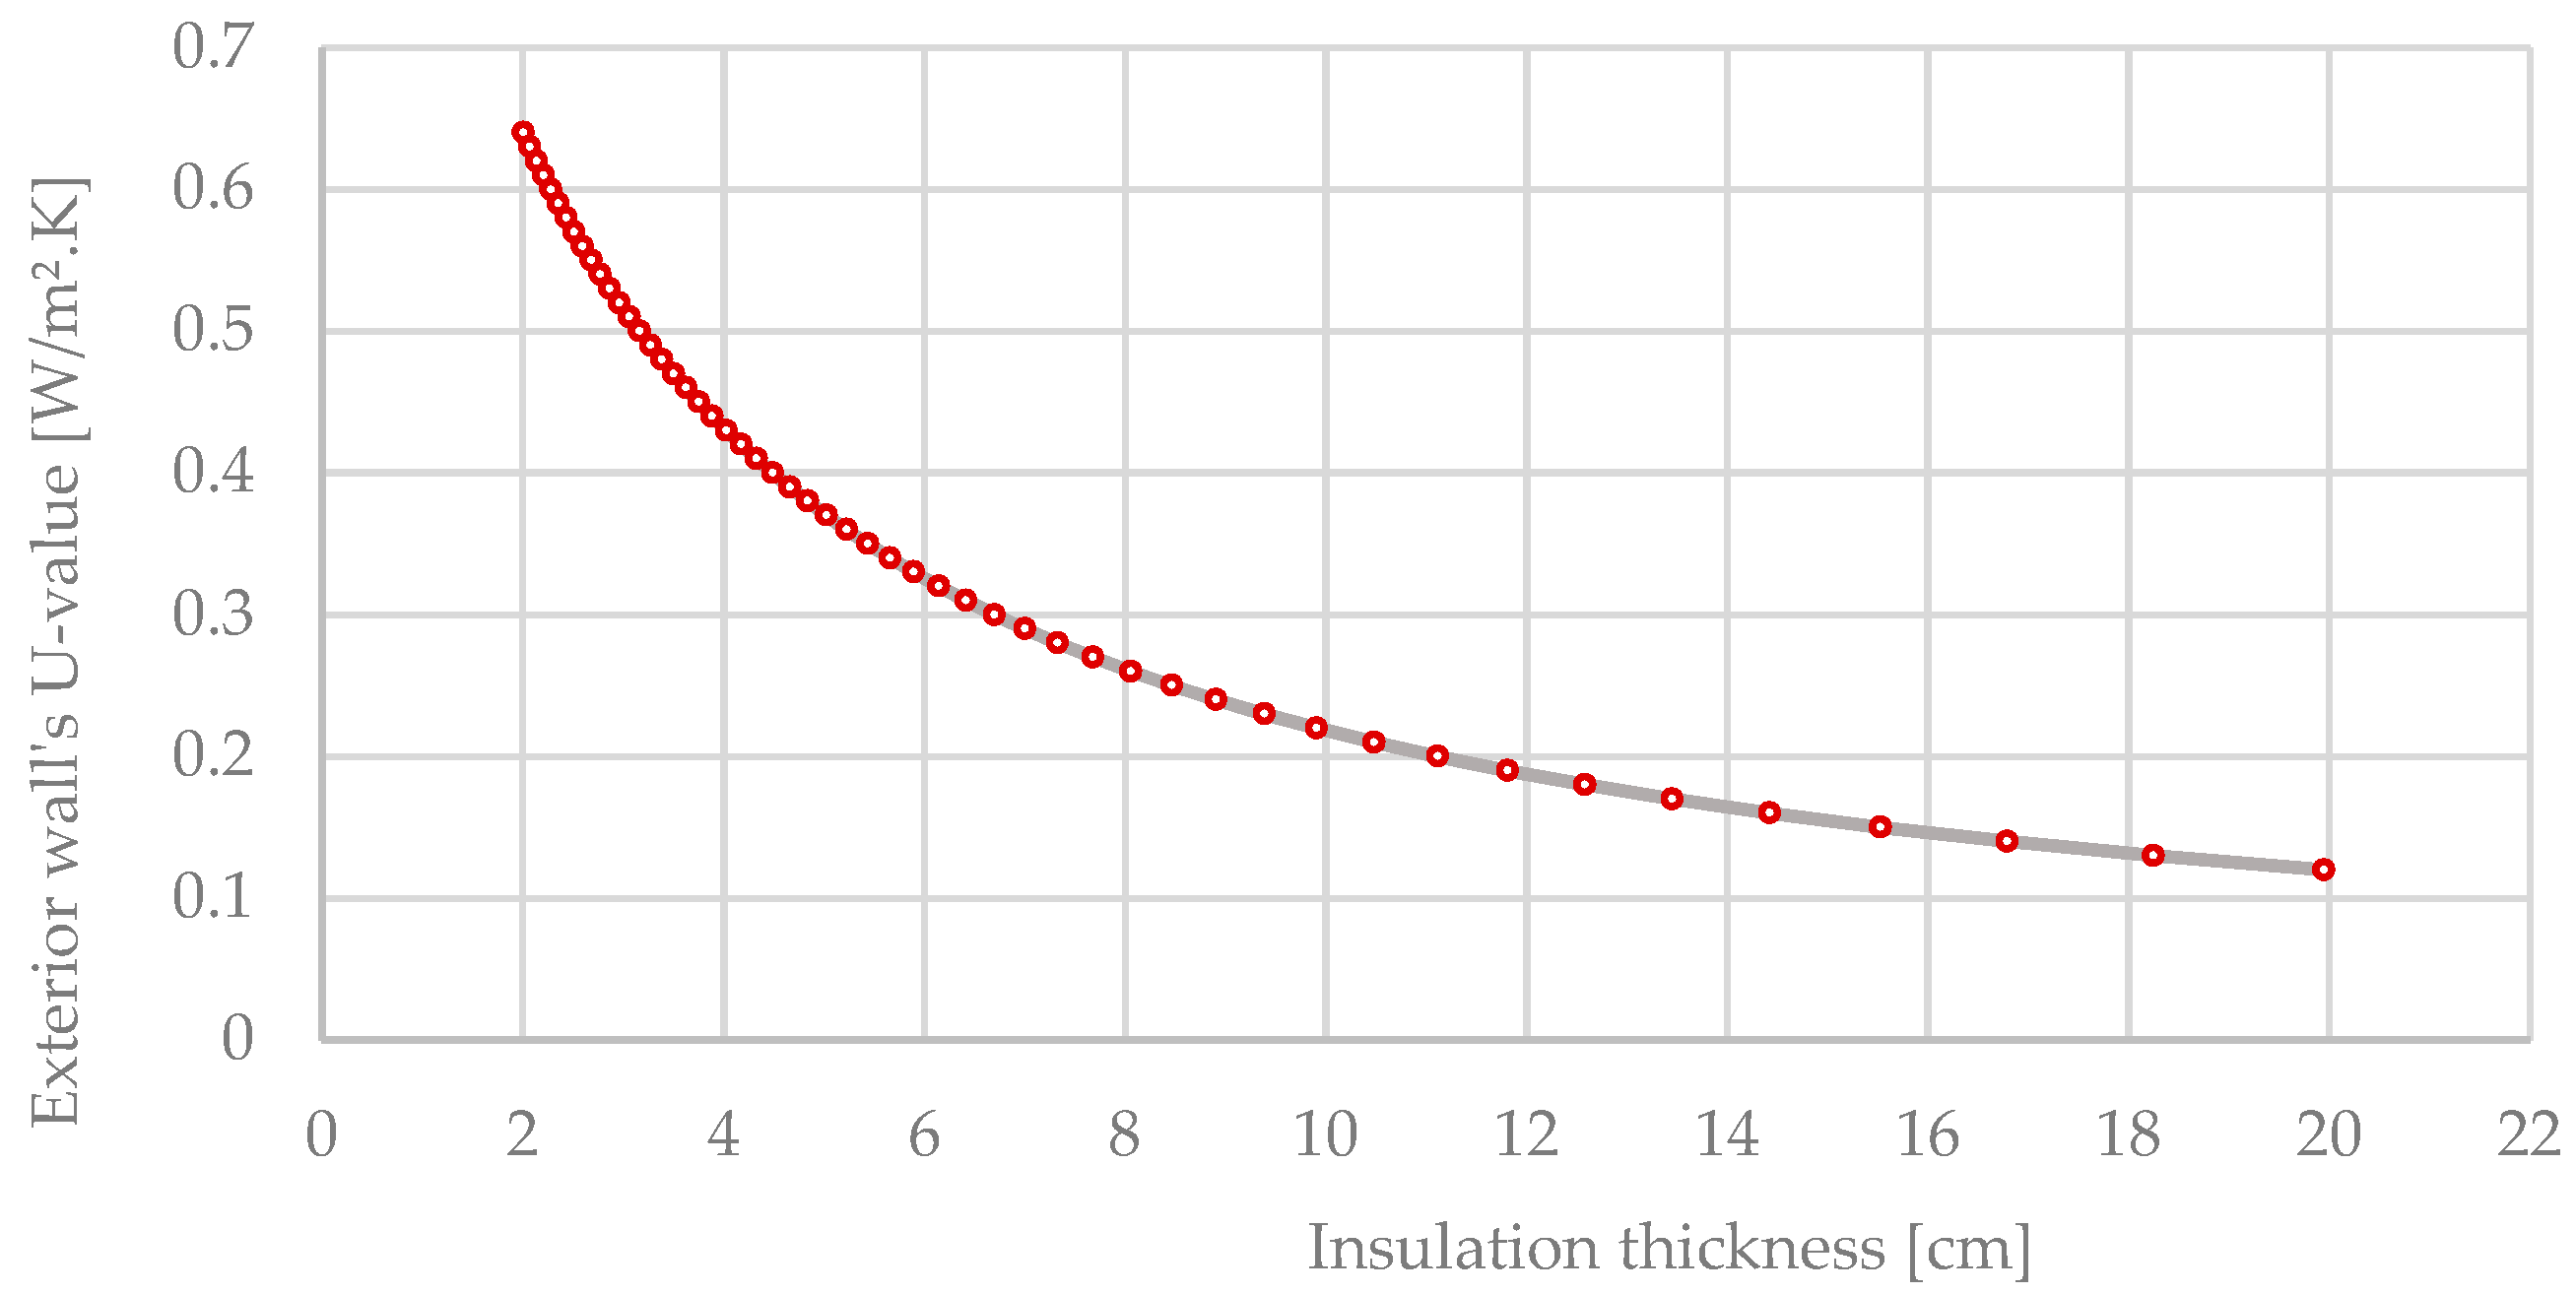
- Step 1: 53 options in terms of insulation thickness (ranging from 2 to 20 cm, with a decrement of 0.01 W/m2K between each option) have been performed adopting two possible construction solutions, with low and high thermal mass, respectively, in order to identify the impact of thermal inertia; the evaluation was carried out for 4 selected locations, representative of Continental, oceanic temperate, Mediterranean, and hot, semi-arid climate, respectively.
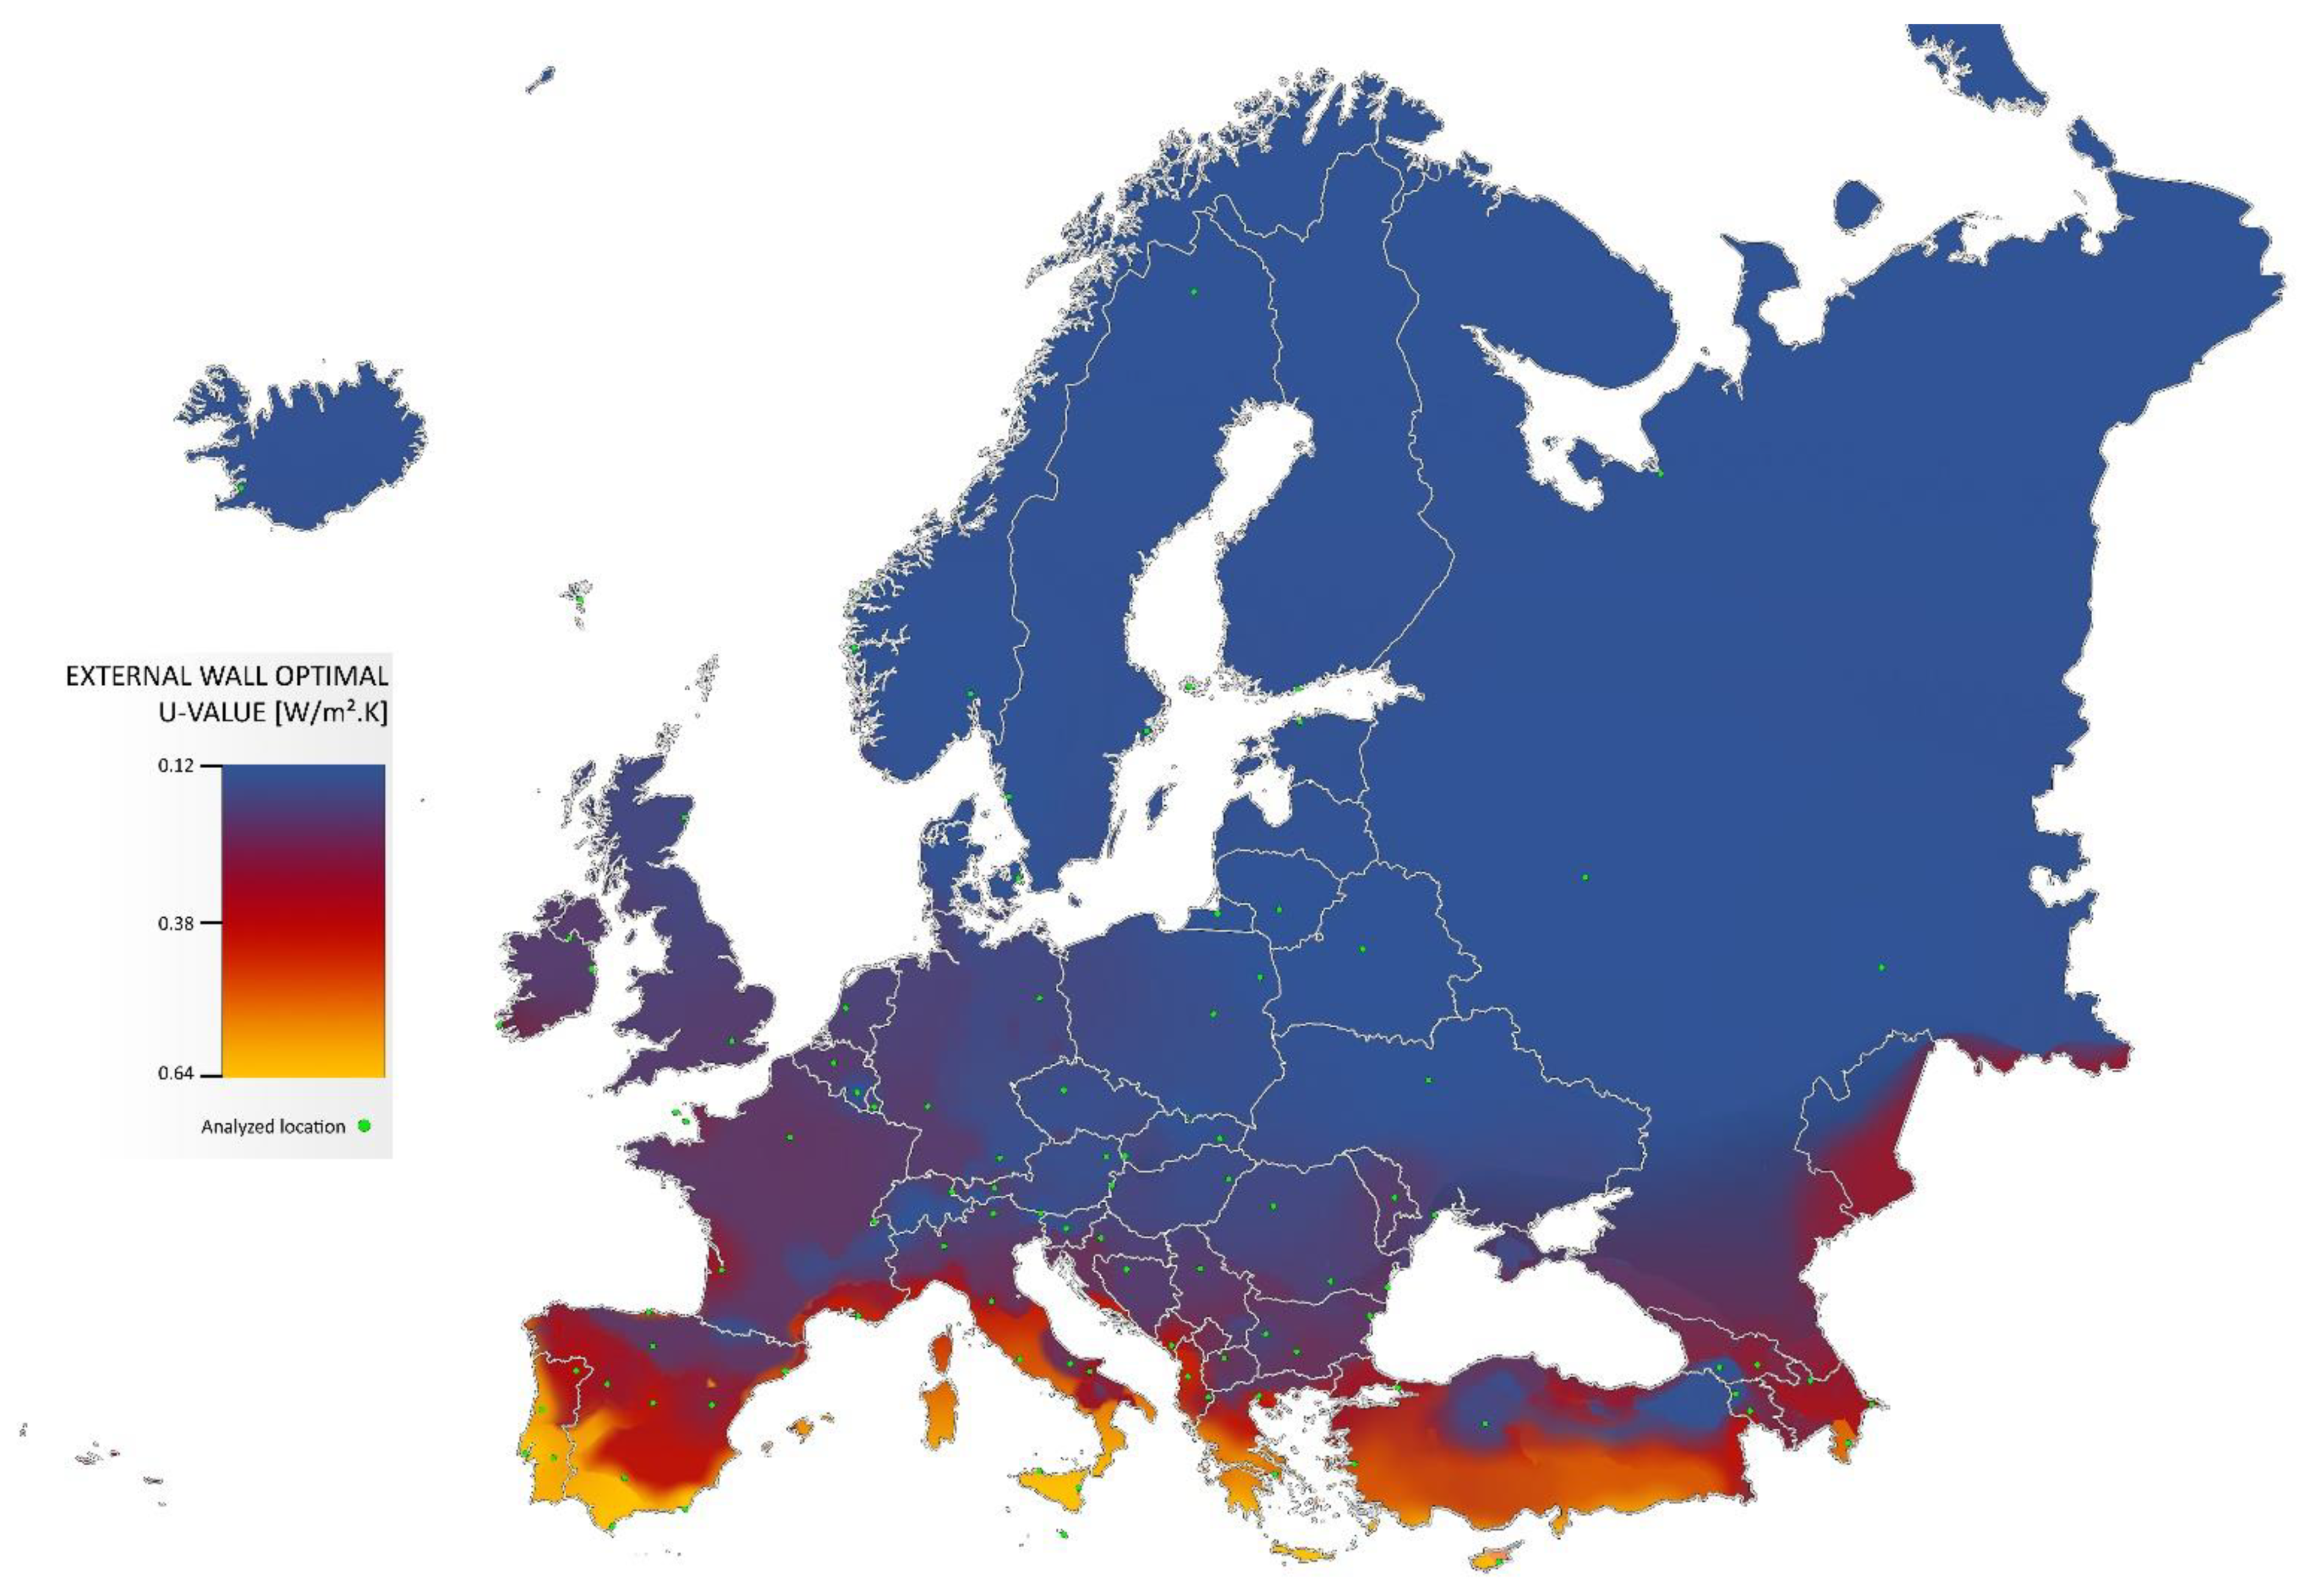
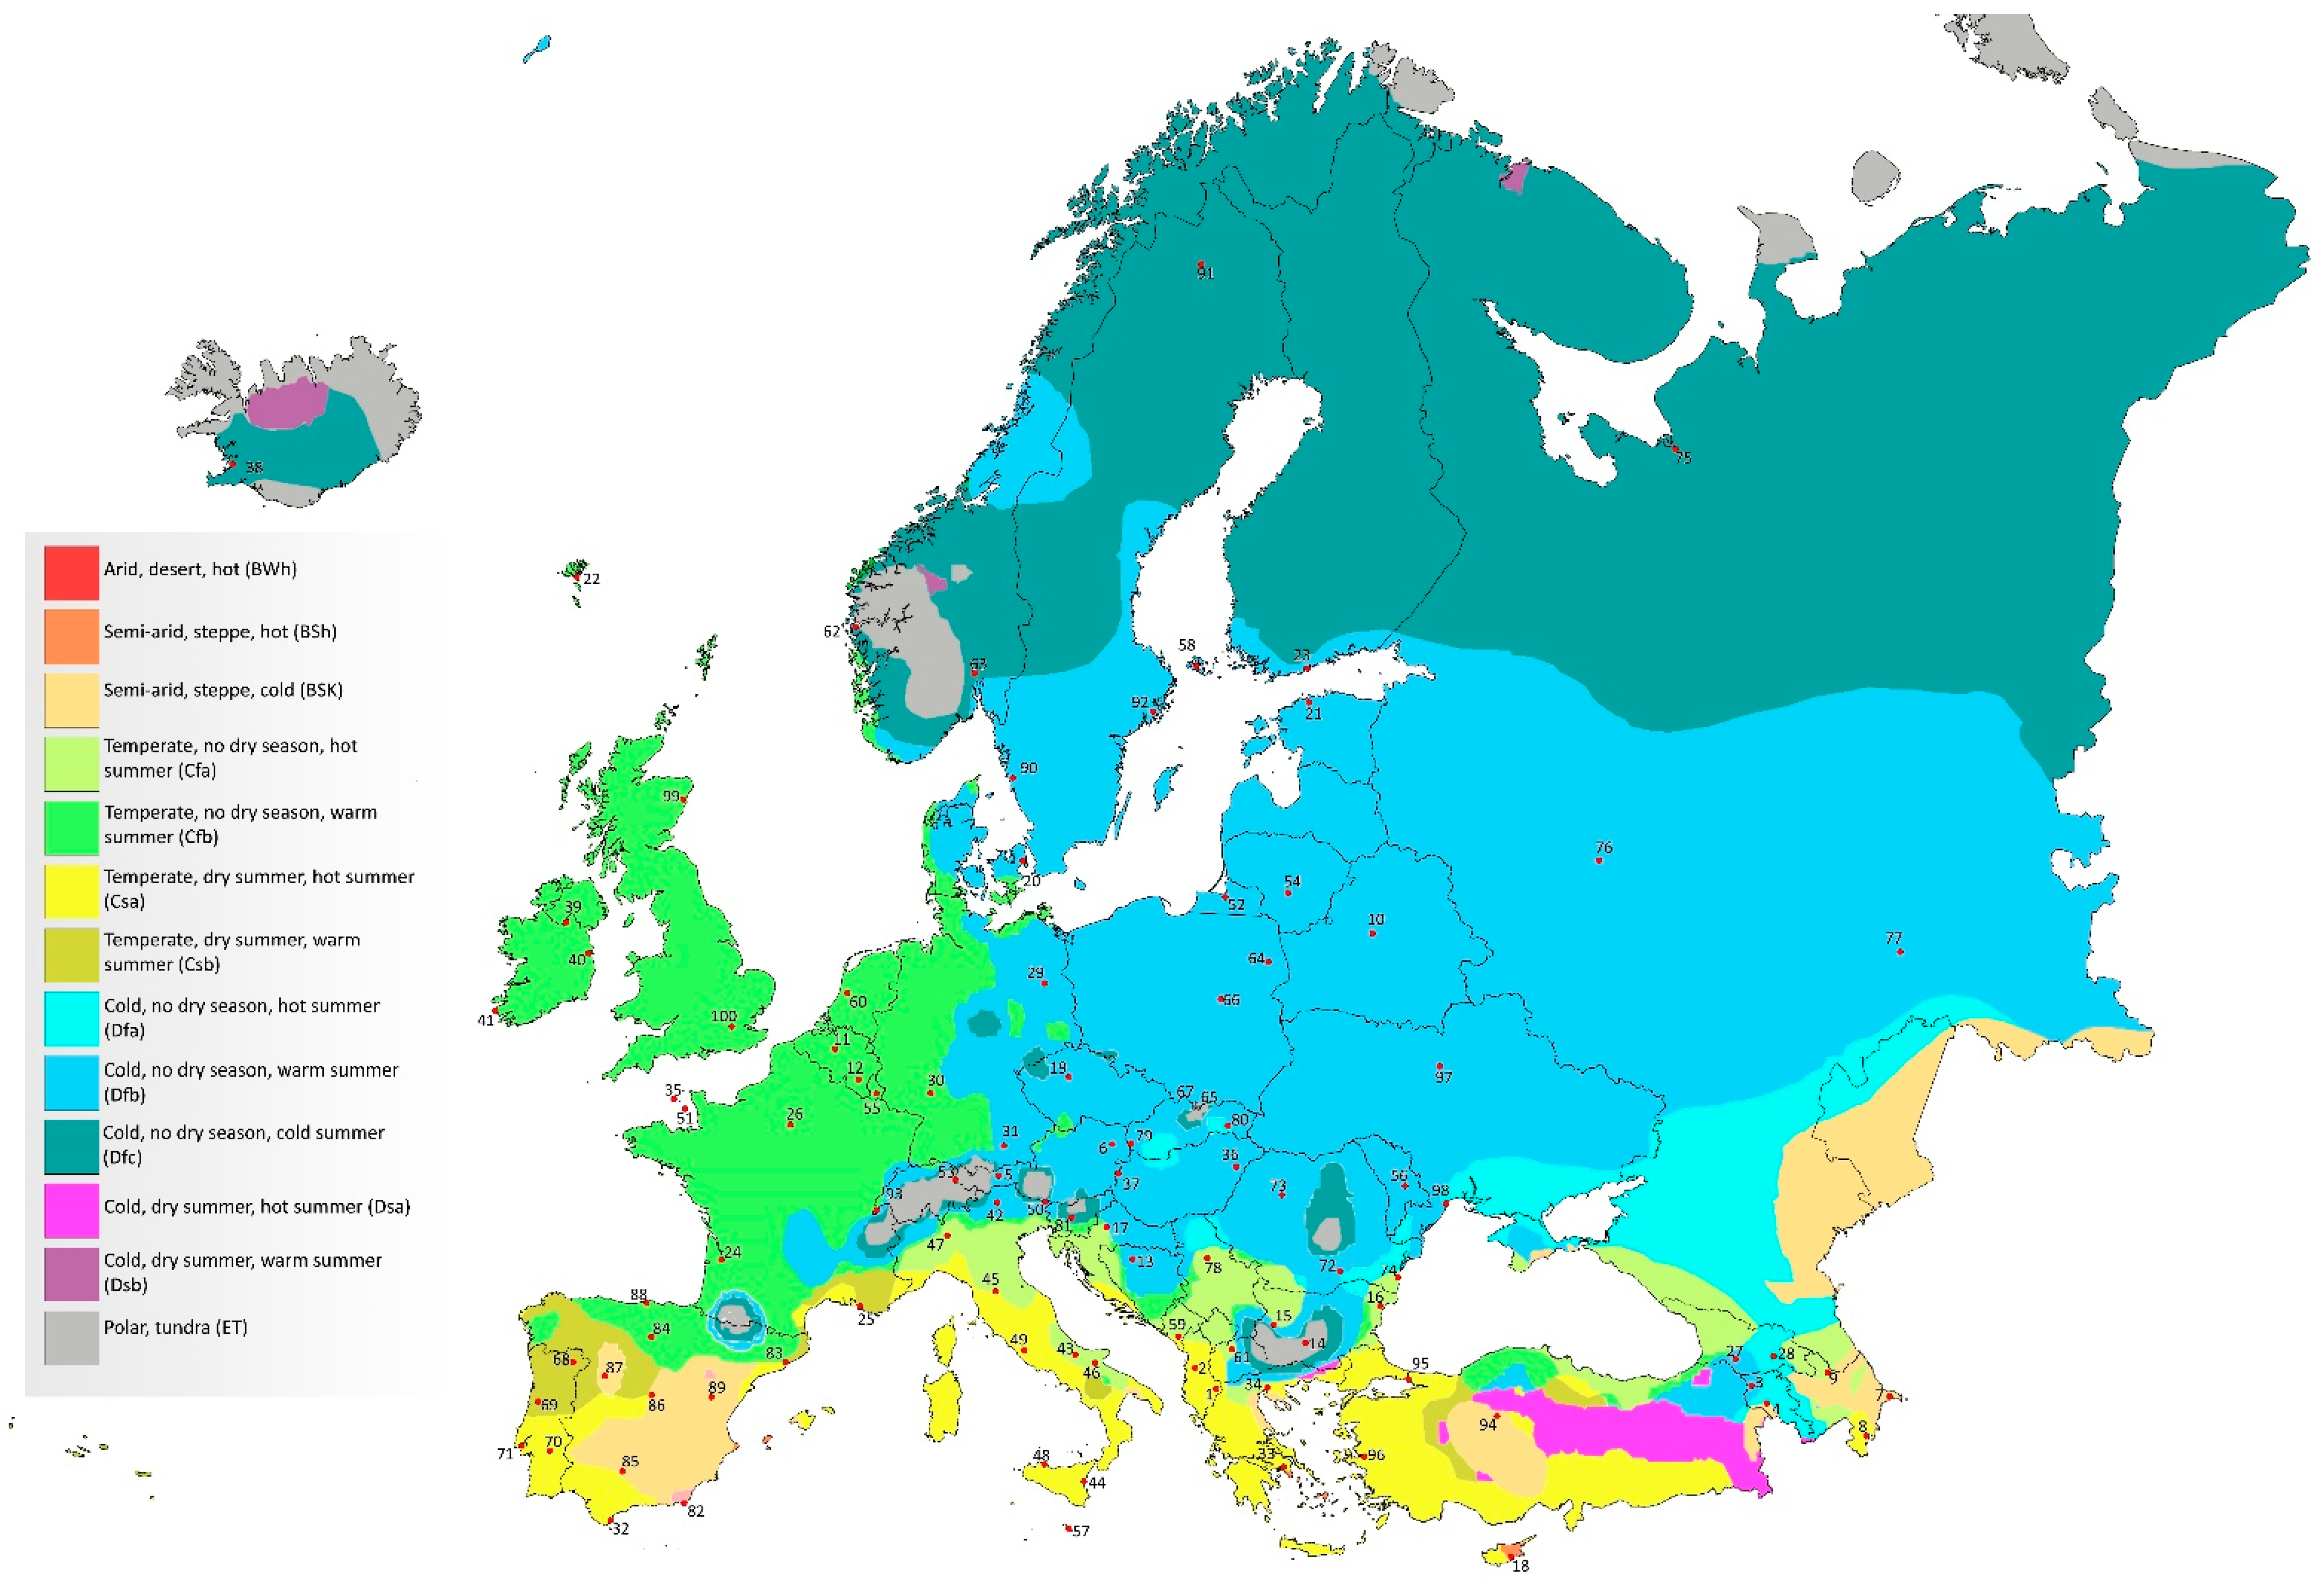
- Step 2: in the second step, since the residential building stock in Europe is predominately characterized by masonry walls with medium–high thermal mass [28], a total of 5300 simulations, i.e., 53 predefined insulation thicknesses for 100 representative locations in the whole Europe, have been performed only considering the heavyweight solution. Then, the optimal U-values for external walls, as verified by analysis, were reported on a map of Europe to provide guidance about optimal solutions according to different contexts.
2.1. Contextual Definition
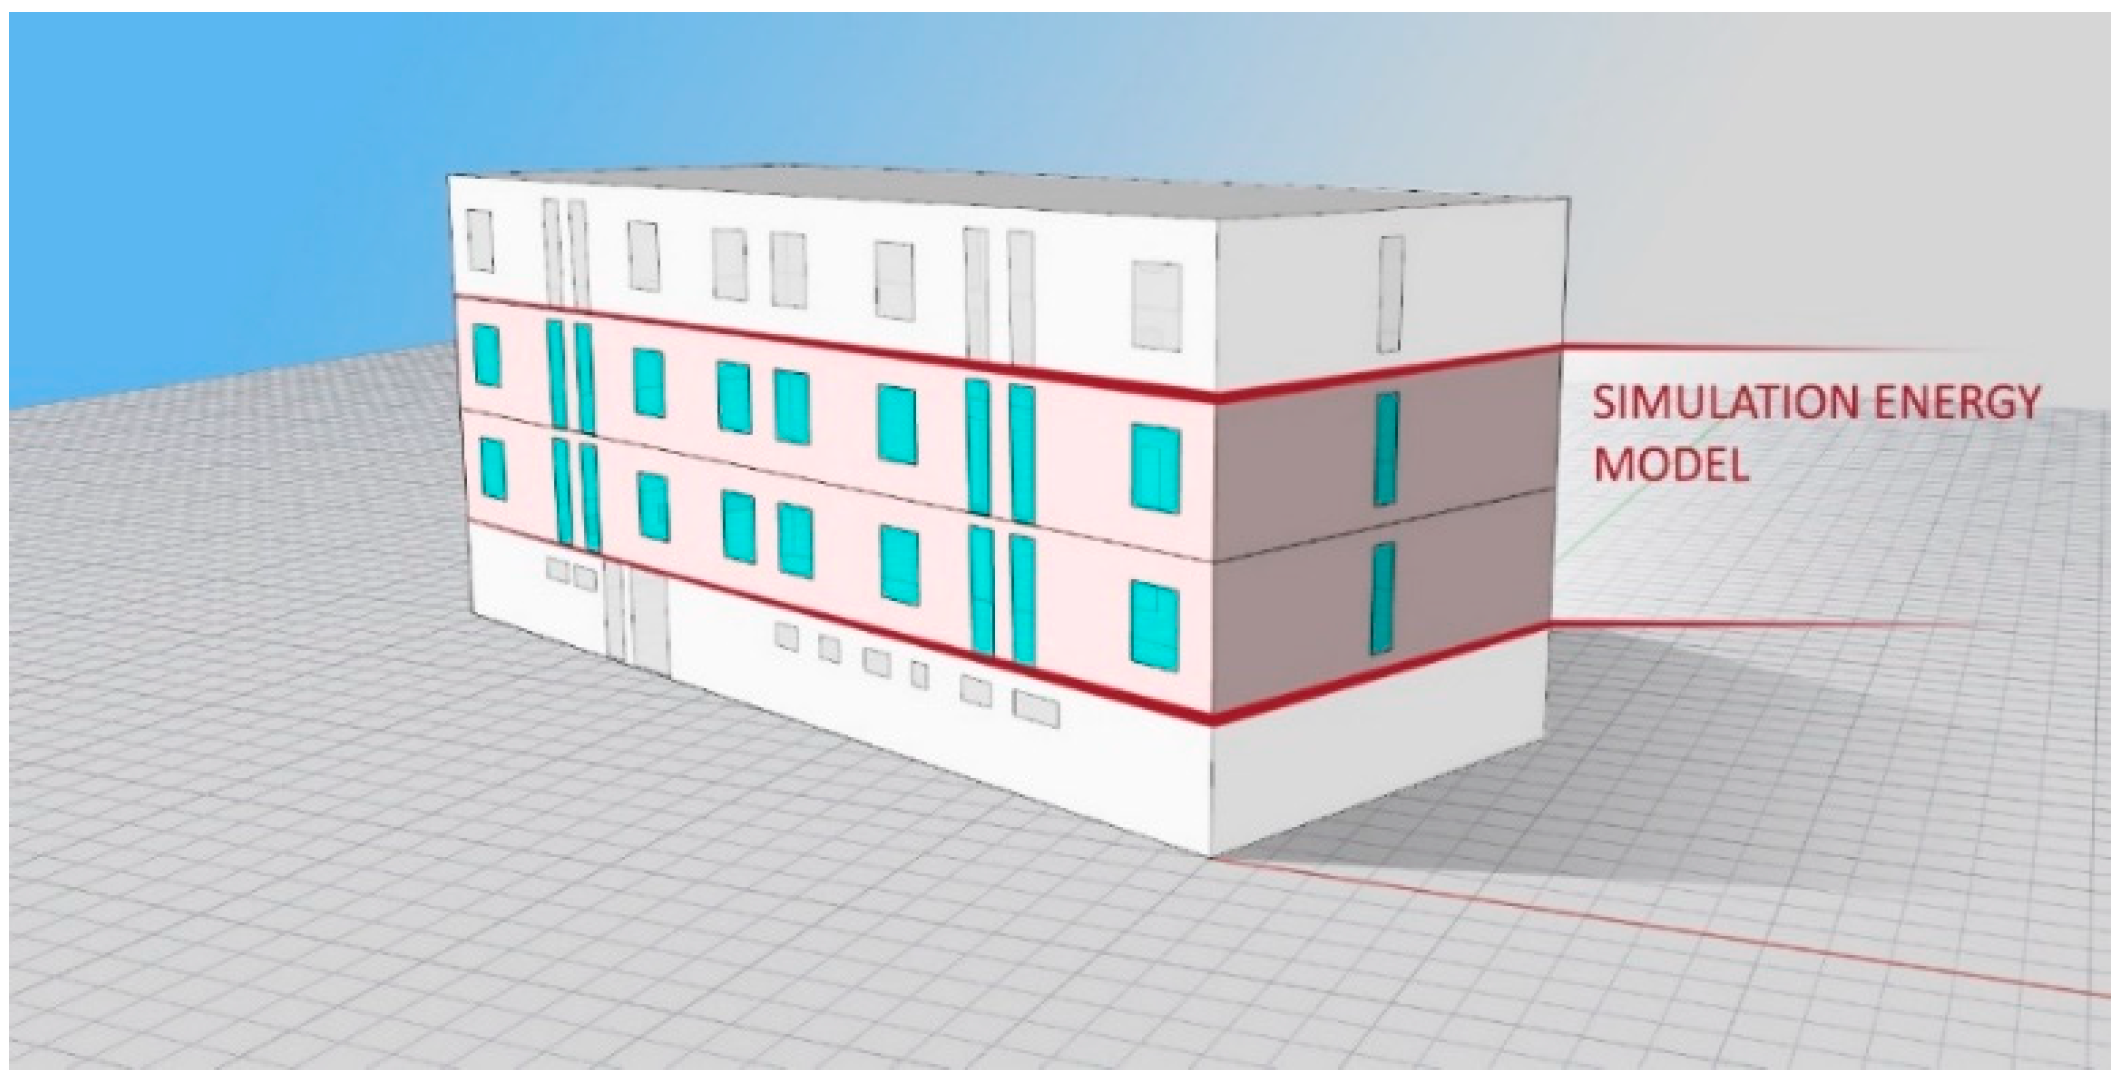
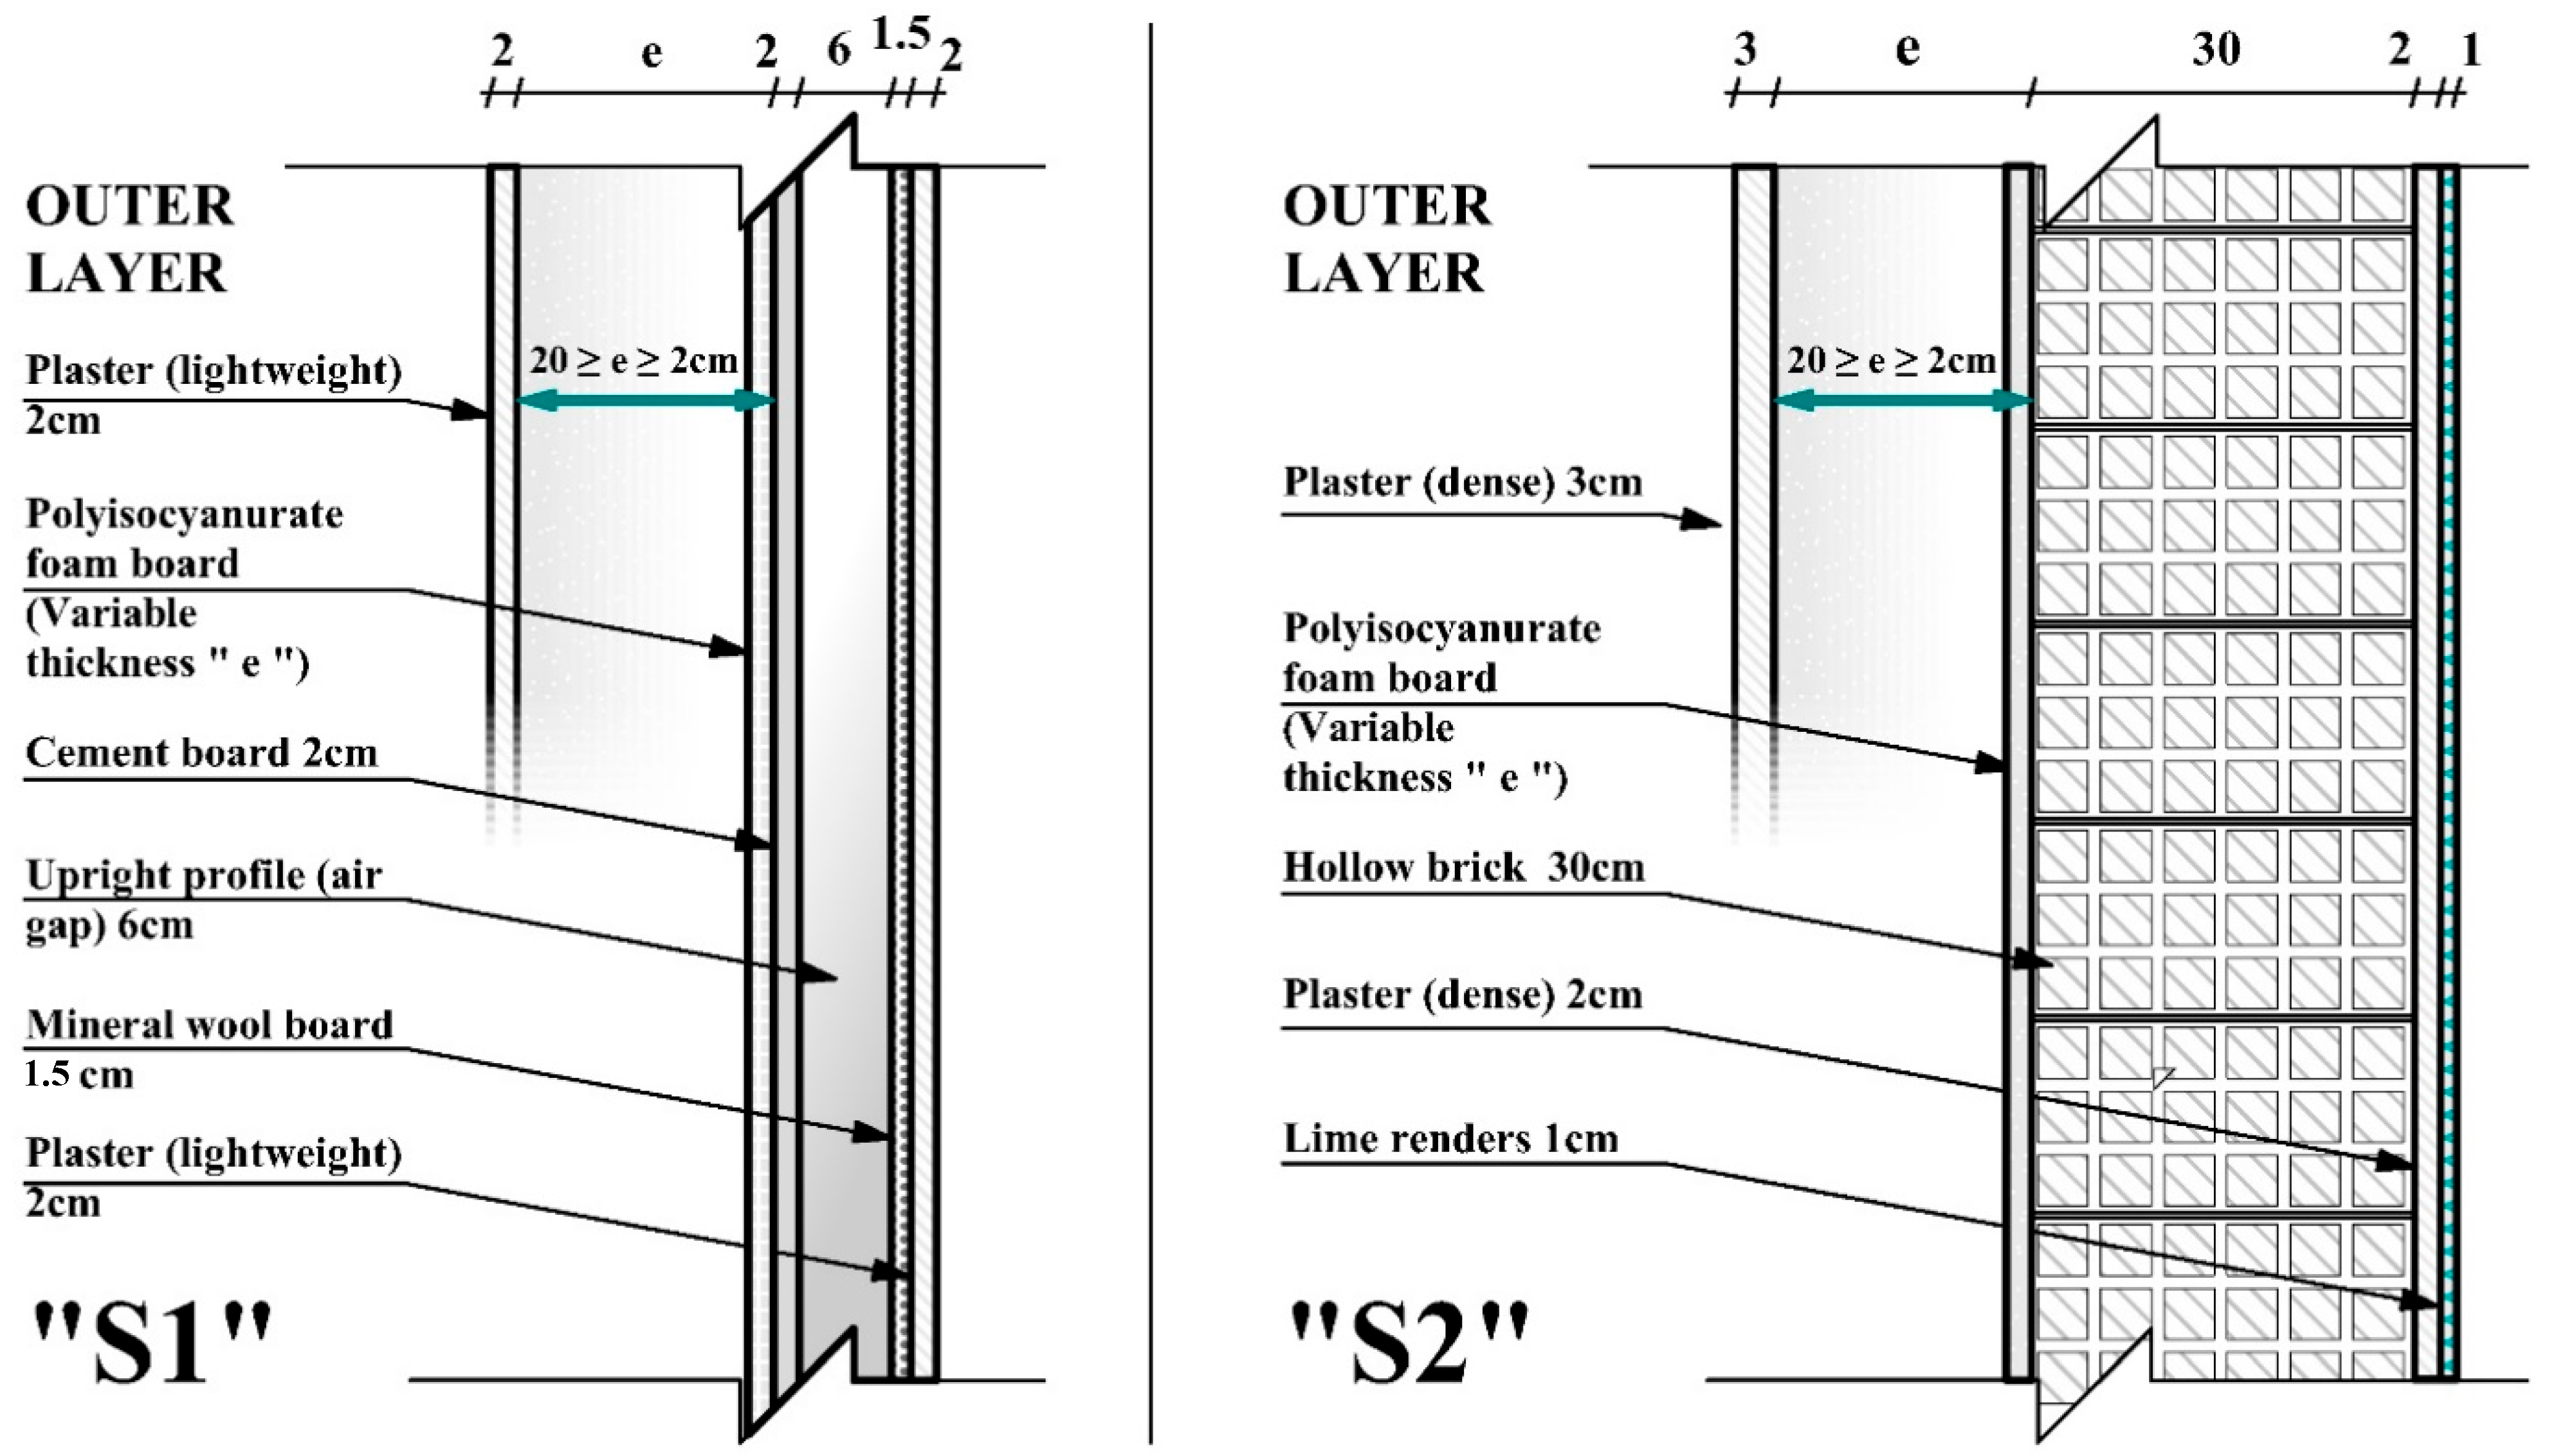
2.2. Reference Building Model
- Uext: is the thermal transmittance of the external wall (W/m2K);
- Rsi and Rse: are the interior and exterior wall superficial resistances (m2K/W);
- Rsx: is the thermal resistance (m2K/W) of the non-insulated walls (S1, S2) presented in Figure 6;
- Rins: is the insulation layer’s thermal resistance (m2K/W) equals to: Rins = e/λ.
3. Energy Analysis
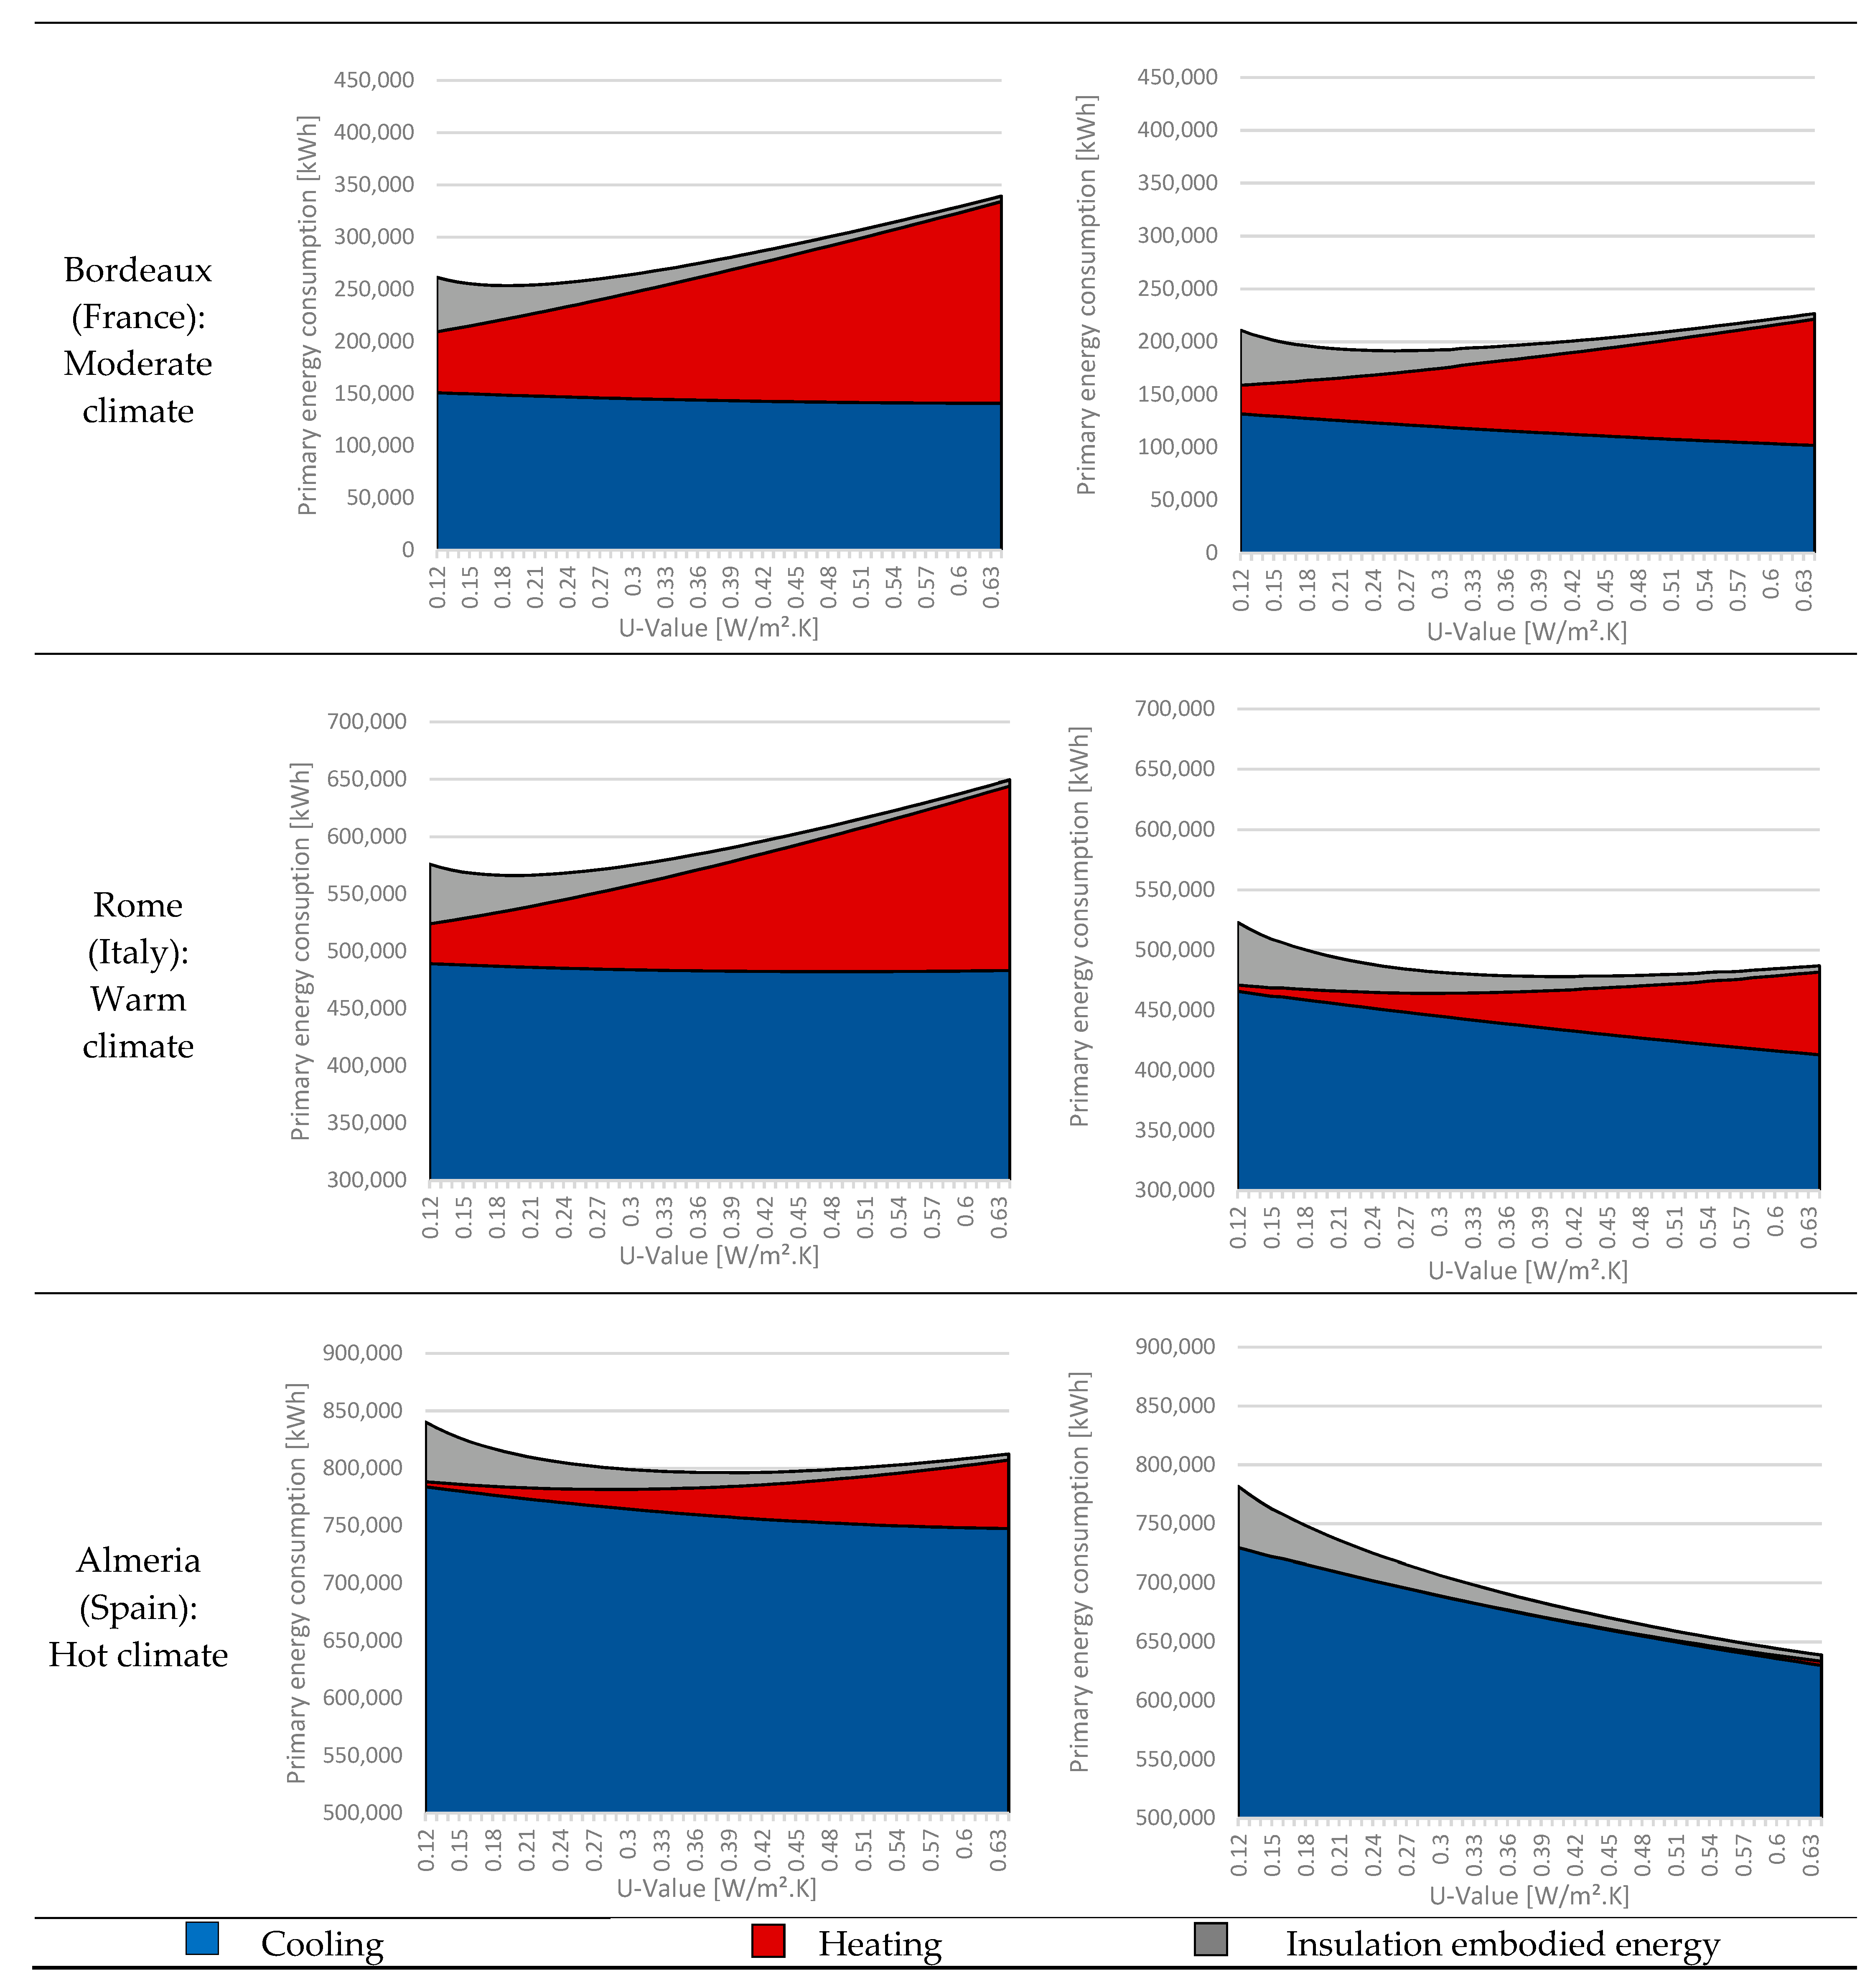
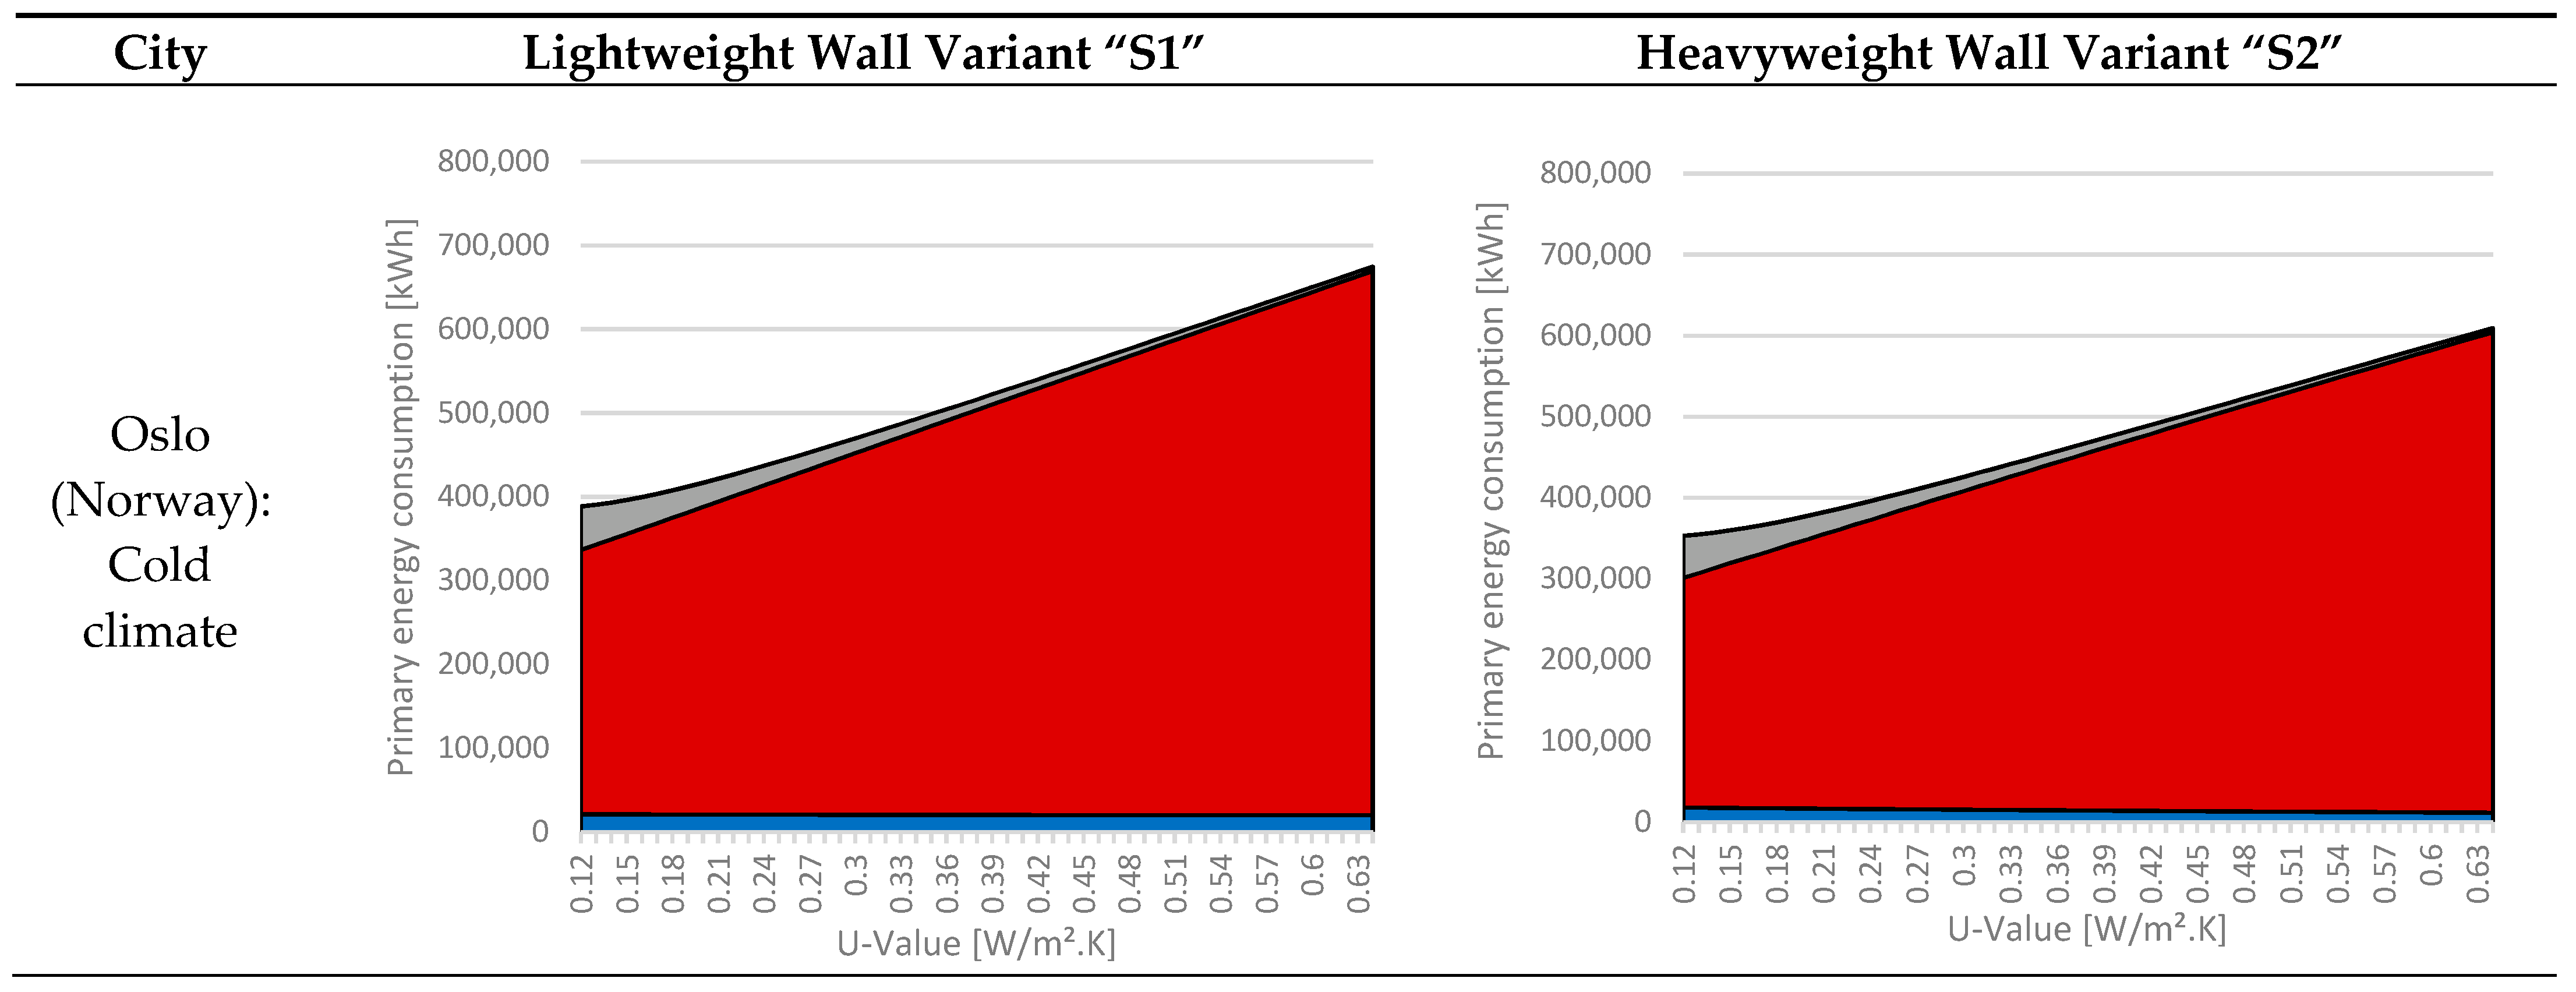
3.1. Step 1: Simulation in Respect of 4 Representative Climate
- Results for Oslo
- Results for Bordeaux
- Results for Rome
- Results for Almeria
3.2. Step 2: Simulation on the 100 Representative Cities of Europe
3.3. Step 3: Elaboration of the Optimal U-Value Map
4. Conclusions
- the building is a prototype adopted to represent mid-rise multifamily residential buildings along Europe. Its model is isolated (there are no obstruction in respect to the sky dome or the surrounding context) with a fixed orientation and does not consider a shading system for transparent surfaces;
- one single building operation and internal gains profile was considered;
- the weather data files used for the HDD and CDD calculation and the energy simulation are based on historical data, some of which present outdated information (e.g., for Italy, IGDG weather data collection is based on a 1951–1970 period of records);
- the optimal solution was calculated based on the overall energy consumption obtained from the massive wall variant only; hence, different results can be obtained by changing the wall’s stratification settings;
- the polyisocyanurate foam board was adopted as a reference insulant, and an average embodied energy across Europe was considered. Alternative insulation solutions with a different embodied impact would lead to slightly different results.
Author Contributions
Funding
Data Availability Statement
Conflicts of Interest
References
- United Nations Environment Programme. 2021 Global Status Report for Buildings and Construction: Towards a Zero-Emission, Efficient and Resilient Buildings and Construction Sector. 2021. Nairobi. Available online: https://globalabc.org/sites/default/files/2021-10/GABC_Buildings-GSR-2021_BOOK.pdf (accessed on 26 April 2022).
- European Commission. Joint Research Centre. Institute for Energy and Transport Heat and Cooling Demand and Market Perspective. LU: Publications Office. 2012. Available online: https://data.europa.eu/doi/10.2790/56592 (accessed on 12 March 2022).
- European Environment Agency. Climate Change, Impacts and Vulnerability in Europe 2012: An Indicator Based Report. LU: Publications Office. 2012. Available online: https://data.europa.eu/doi/10.2800/66071 (accessed on 12 March 2022).
- Castellari, S.; Venturini, S.; Ballarin Denti, A.; Bigano, A.; Bindi, M.; Bosello, F.; Carrera, L.; Chiriacò, M.V.; Danovaro, R.; Desiato, F.; et al. Rapporto Sullo Stato delle Conoscenze Scientifiche su Impatti, Vulnerabilità ed Adattamento ai Cambiamenti Climatici in Italia; Ministero dell’Ambiente e della Tutela del Territorio e del Mare: Roma, Italy, 2014; p. 878. [Google Scholar]
- Energy Technology Perspectives 2020—Analysis. IEA. Available online: https://www.iea.org/reports/energy-technology-perspectives-2020 (accessed on 1 April 2022).
- European Climate Foundation. Roadmap 2050: A Practical Guide to a Prosperous Low Carbon Europe; European Climate Foundation: The Hague, The Netherlands, 2010. [Google Scholar]
- Action de l’UE Pour le Climat et Pacte Vert Pour l’Europe. Available online: https://ec.europa.eu/clima/eu-action/european-green-deal_fr (accessed on 12 March 2022).
- Economidou, M.; Atanasiu, B.; Despret, C.; Maio, J.; Nolte, I.; Rapf, O.; Laustsen, J.; Ruyssevelt, P.; Staniaszek, D.; Strong, D.; et al. Europe’s Buildings under the Microscope. A Country-by-Country Review of the Energy Performance of Buildings; Buildings Performance Institute Europe BPIE: Brussels, Belgium, 2011. [Google Scholar]
- Silvestre, J.D.; Castelo, A.M.P.; Silva, J.J.B.C.; de Brito, J.M.C.L.; Pinheiro, M.D. Retrofitting a Building’s Envelope: Sustainability Performance of ETICS with ICB or EPS. Appl. Sci. 2019, 9, 1285. [Google Scholar] [CrossRef] [Green Version]
- Rivoire, M.; Casasso, A.; Piga, B.; Sethi, R. Assessment of Energetic, Economic and Environmental Performance of Ground-Coupled Heat Pumps. Energies 2018, 11, 1941. [Google Scholar] [CrossRef] [Green Version]
- D’Agostino, D.; Rossi, F.D.; Marigliano, M.; Marino, C.; Minichiello, F. Evaluation of the optimal thermal insulation thickness for an office building in different climates by means of the basic and modified ‘cost-optimal’ methodology. J. Build. Eng. 2019, 24, 100743. [Google Scholar] [CrossRef]
- Aste, N.; Leonforte, F.; Manfren, M.; Mazzon, M. Thermal inertia and energy efficiency—Parametric simulation assessment on a calibrated case study. Appl. Energy 2015, 145, 111–123. [Google Scholar] [CrossRef]
- Ingrao, C.; Messineo, A.; Beltramo, R.; Yigitcanlar, T.; Ioppolo, G. How can life cycle thinking support sustainability of buildings? Investigating life cycle assessment applications for energy efficiency and environmental performance. J. Clean. Prod. 2018, 201, 556–569. [Google Scholar] [CrossRef]
- Sartori, I.; Hestnes, A.G. Energy use in the life cycle of conventional and low-energy buildings: A review article. Energy Build. 2007, 39, 249–257. [Google Scholar] [CrossRef]
- Kumar, D.; Alam, M.; Zou, P.X.W.; Sanjayan, J.G.; Memon, R.A. Comparative analysis of building insulation material properties and performance. Renew. Sustain. Energy Rev. 2020, 131, 110038. [Google Scholar] [CrossRef]
- Tukhtamisheva, A.; Adilova, D.; Banionis, K.; Levinskytė, A.; Bliudzius, R. Optimization of the Thermal Insulation Level of Residential Buildings in the Almaty Region of Kazakhstan. Energies 2020, 13, 4692. [Google Scholar] [CrossRef]
- Guidelines Accompanying Commission Delegated Regulation (EU) No 244/2012 of 16 January 2012 Supplementing Directive 2010/31/EU of the European Parliament and of the Council on the Energy Performance of Buildings by Establishing a Comparative Methodology Framework for Calculating Cost-Optimal Levels of Minimum Energy Performance Requirements for Buildings and Building Elements; European Commission: Brussels, Belgium, 2012; p. 28.
- Moradibistouni, M.; Vale, B.; Isaacs, N. A life cycle study of insulation in a case study building with a focus on the effect of the national energy profile. J. Build. Eng. 2021, 43, 103178. [Google Scholar] [CrossRef]
- Chen, Z.; Hammad, A.W.A.; Kamardeen, I.; Akbarnezhad, A. Optimising Embodied Energy and Thermal Performance of Thermal Insulation in Building Envelopes via an Automated Building Information Modelling (BIM) Tool. Buildings 2020, 10, 218. [Google Scholar] [CrossRef]
- Raouf, A.M.; Al-Ghamdi, S.G. Effect of R-values changes in the baseline codes: Embodied energy and environmental life cycle impacts of building envelopes. Energy Rep. 2020, 6, 554–560. [Google Scholar] [CrossRef]
- Cusenza, M.A.; Gulotta, T.M.; Mistretta, M.; Cellura, M. Life Cycle Energy and Environmental Assessment of the Thermal Insulation Improvement in Residential Buildings. Energies 2021, 14, 3452. [Google Scholar] [CrossRef]
- Sierra-Pérez, J.; Rodríguez-Soria, B.; Boschmonart-Rives, J.; Gabarrell, X. Integrated life cycle assessment and thermodynamic simulation of a public building’s envelope renovation: Conventional vs. Passivhaus proposal. Appl. Energy 2018, 212, 1510–1521. [Google Scholar] [CrossRef] [Green Version]
- Bojić, M.; Miletić, M.; Bojić, L. Optimization of thermal insulation to achieve energy savings in low energy house (refurbishment). Energy Convers. Manag. 2014, 84, 681–690. [Google Scholar] [CrossRef]
- Ramesh, T.; Prakash, R.; Shukla, K.K. Life cycle energy analysis of a residential building with different envelopes and climates in Indian context. Appl. Energy 2012, 89, 193–202. [Google Scholar] [CrossRef]
- Shadram, F.; Bhattacharjee, S.; Lidelöw, S.; Mukkavaara, J.; Olofsson, T. Exploring the trade-off in life cycle energy of building retrofit through optimization. Appl. Energy 2020, 269, 115083. [Google Scholar] [CrossRef]
- Roudsari, M.S.; Pak, M. Ladybug: A parametric environmental plugin for grasshopper to help designers create an environmentally-conscious design. In Proceedings of the 13th International IBPSA Conference, Lyon, France, 26–28 August 2013; pp. 3128–3135. [Google Scholar]
- Sousa, J. Energy Simulation Software for Buildings: Review and Comparison; Faculdade de Engenharia da Universidade do Porto: Porto, Portugal, 2012. [Google Scholar]
- Landolfo, R.; Formisano, A.; di Lorenzo, G.; di Filippo, A. Classification of european building stock in technological and typological classes. J. Build. Eng. 2022, 45, 103482. [Google Scholar] [CrossRef]
- A Forward Looking Primary Energy Factor for a Greener European Future. Available online: https://www.eurelectric.org/media/2382/2018_industry_association_position_on_pef_revision-2018-030-0114-01-e-h-216CBE01.pdf (accessed on 1 April 2022).
- EnergyPlus. Available online: https://energyplus.net/weather (accessed on 1 April 2022).
- Meteonorm Software; Meteotest SA: Berne, Switzerland, 2020.
- Peel, M.C.; Finlayson, B.L.; McMahon, T.A. Updated world map of the Köppen-Geiger climate classification. Hydrol. Earth Syst. Sci. 2007, 11, 1633–1644. [Google Scholar] [CrossRef] [Green Version]
- Loga, T.; Diefenbach, N. Use of Building Typologies for Energy Performance Assessment of National Building Stocks. Existent Experiences in European Countries and Common Approach; Institut Wohnen und Umwelt: Darmstadt, Germany, 2010. [Google Scholar]
- Zangheri, P.; Armani, R.; Pietrobon, M.; Pagliano, L.; Boneta, M.F.; Müller, A. Heating and Cooling Energy Demand and Loads for Building Types in Different Countries of the EU; Intelligent Energy Europe Programme of the European Union: Brussels, Belgium, 2014. [Google Scholar]
- Smolinski, F. Renovating the Existing Building Stock across Europe—BSRIA Webinar and Building Stock Analysis. iNSPiRe. Available online: https://inspire-fp7.eu/renovating-the-existing-building-stock-across-europe-bsria-webinar-and-building-stock-analysis/ (accessed on 12 March 2022).
- Manfren, M.; Aste, N.; Leonforte, F.; Del Pero, C.; Buzzetti, M.; Adhikari, R.S.; Zhixing, L. Parametric energy performance analysis and monitoring of buildings—HEART project platform case study. Sustain. Cities Soc. 2020, 61, 102296. [Google Scholar] [CrossRef]
- Pohoryles, D.A.; Maduta, C.; Bournas, D.A.; Kouris, L.A. Energy performance of existing residential buildings in Europe: A novel approach combining energy with seismic retrofitting. Energy Build. 2020, 223, 110024. [Google Scholar] [CrossRef]
- SIA Merkblatt 2024, Raumnutzungsbedingungen für die Energie- und Gebäudetechnik; Schweizerischer Ingenieur- und Architektenverein: Zürich, Switzerland, 2015.
- Nazaroff, W. Residential air-change rates: A critical review. Indoor Air 2021, 31, 282–313. [Google Scholar] [CrossRef] [PubMed]
- EN 15251:2007—Indoor Environmental Input Parameters for Design and Assessment of Energy Performance of Buildings Addressing Indoor Air Quality, Thermal Environment, Lighting and Acoustics. iTeh Standards Store. Available online: https://standards.iteh.ai/catalog/standards/cen/92485123-bf64-40e3-9387-9724a642eae8/en-15251-2007 (accessed on 1 April 2022).
- European Commission. Joint Research Centre. Competitive Landscape of the EU’s Insulation Materials Industry for Energy-Efficient Buildings: Revised Edition. LU: Publications Office. 2018. Available online: https://data.europa.eu/doi/10.2760/750646 (accessed on 12 March 2022).


| Country | Location | ID | Sub-Climate | HDD20 | CDD24 | Yearly Average T (°C) | Country | Location | ID | Sub-Climate | HDD20 | CDD24 | Yearly Average T (°C) |
|---|---|---|---|---|---|---|---|---|---|---|---|---|---|
| Albania | Korca | 1 | Csb | 3140 | 108 | 12.1 | Jersey | Jersey | 51 | Cfb | 3231 | 3 | 11.2 |
| Tirana | 2 | Csa | 2030 | 253 | 15.8 | Latvia | Riga | 52 | Dfb | 4581 | 10 | 7.7 | |
| Armenia | Gyumri | 3 | Dfb | 5195 | 39 | 6.2 | Liechtenstein | Vaduz | 53 | Cfb | 3391 | 54 | 11.0 |
| Yerevan | 4 | Dfa | 3251 | 402 | 13.0 | Lithuania | Kaunas | 54 | Dfb | 4906 | 14 | 6.9 | |
| Austria | Innsbruck | 5 | Dfc | 4012 | 38 | 9.0 | Luxemburg | Luxemburg | 55 | Cfb | 3684 | 31 | 10.2 |
| Vienna | 6 | Cfb | 3864 | 52 | 10.0 | Moldova | Chisinau | 56 | Dfb | 3504 | 149 | 11.5 | |
| Azerbaijan | Baku | 7 | Bsk | 2409 | 321 | 15.2 | Malta | Valetta | 57 | Csa | 1101 | 283 | 19.0 |
| Lankaran | 8 | Csa | 2343 | 253 | 15.4 | Man Island | Castletown | 58 | Cfb | 3463 | 0 | 10.6 | |
| Sheki | 9 | Dfb | 2913 | 7975 | 13.0 | Montenegro | Podgorica | 59 | Cfa | 2318 | 240 | 15.1 | |
| Belarus | Minsk | 10 | Dfb | 5120 | 10 | 6.3 | The Netherlands | Amsterdam | 60 | Cfb | 3751 | 15 | 10.0 |
| Belgium | Brussels | 11 | Cfb | 3632 | 24 | 10.3 | North Macedonia | Skopje | 61 | Cfb | 3142 | 263 | 12.7 |
| Saint Hubert | 12 | Cfb | 4547 | 1 | 7.5 | Norway | Bergen | 62 | Cfb | 4756 | 4 | 7.1 | |
| Bosnia and Herzegovina | Banja Luka | 13 | Cfb | 3549 | 92 | 10.8 | Oslo | 63 | Dfb | 4973 | 4 | 6.7 | |
| Bulgaria | Plovdiv | 14 | Cfa | 3059 | 175 | 2.7 | Poland | Bialystok | 64 | Dfb | 4931 | 16 | 6.9 |
| Sofia | 15 | Cfb | 3742 | 64 | 10.2 | Kasprowy W. Mt. | 65 | ET | 7550 | 0 | −0.7 | ||
| Varna | 16 | Cfa | 3121 | 74 | 12.1 | Warsaw | 66 | Cfb | 4367 | 26 | 8.4 | ||
| Croatia | Zagreb | 17 | Cfb | 3293 | 140 | 11.8 | Zakopane | 67 | Dfb | 5381 | 3 | 5.5 | |
| Cyprus | Larnaca | 18 | Csa | 1183 | 379 | 19.4 | Portugal | Braganca | 68 | Csb | 3028 | 112 | 12.4 |
| Czech Republic | Prague | 19 | Cfb | 4462 | 24 | 8.1 | Coimbra | 69 | Csb | 1855 | 123 | 15.3 | |
| Denmark | Copenhagen | 20 | Cfb | 4348 | 3 | 8.3 | Evora | 70 | Csa | 1926 | 208 | 15.8 | |
| Estonia | Tallinn | 21 | Dfb | 4960 | 79 | 6.7 | Lisboa | 71 | Csa | 1601 | 174 | 16.3 | |
| Faroe Islands | Torshavn | 22 | Csc | 4713 | 0 | 7.1 | Romania | Bucharest | 72 | Cfa | 3713 | 148 | 10.8 |
| Finland | Helsinki | 23 | Dfb | 5545 | 8 | 5.2 | Cluj-Napoca | 73 | Cfb | 4288 | 38 | 8.5 | |
| France | Bordeaux | 24 | Cfb | 2683 | 78 | 13.2 | Constanta | 74 | Cfa | 3201 | 62 | 12.0 | |
| Marseille | 25 | Csa | 2274 | 153 | 14.8 | Russia | Arkhangelsk | 75 | Dfb | 6841 | 8 | 1.6 | |
| Paris | 26 | Cfb | 3357 | 29 | 11.1 | Moscow | 76 | Dfb | 5436 | 19 | 5.5 | ||
| Georgia | Akhaltsikhé | 27 | Dfb | 6272 | 3 | 2.8 | Samara | 77 | Dfb | 5806 | 39 | 4.7 | |
| Tbilisi | 28 | Cfa | 2607 | 252 | 14.1 | Serbia | Belgrade | 78 | Cfa | 3445 | 125 | 11.5 | |
| Germany | Berlin | 29 | Cfb | 3852 | 39 | 9.8 | Slovak Republic | Bratislava | 79 | Cfb | 3733 | 70 | 10.4 |
| Mannheim | 30 | Cfb | 3459 | 73 | 11.1 | Kosice | 80 | Dfb | 4157 | 46 | 9.1 | ||
| Munich | 31 | Cfb | 4487 | 31 | 8.0 | Slovenia | Ljubljana | 81 | Cfb | 4046 | 67 | 9.2 | |
| Gibraltar | Gibraltar | 32 | Csa | 1021 | 132 | 18.5 | Spain | Almeria | 82 | BSk | 1069 | 281 | 18.5 |
| Greece | Athens | 33 | Csa | 1552 | 350 | 17.9 | Barcelona | 83 | Csa | 1902 | 86 | 15.7 | |
| Thessaloniki | 34 | Cfa | 2271 | 238 | 15.4 | Burgos | 84 | Csb | 3567 | 52 | 9.9 | ||
| Guernsey | Guernsey | 35 | Cfb | 3103 | 5075 | 11.5 | Cordoba | 85 | Csa | 1531 | 522 | 17.5 | |
| Hungary | Debrecen | 36 | Dfb | 3819 | 84 | 10.2 | Madrid | 86 | Csa | 2592 | 263 | 14.3 | |
| Szombathely | 37 | Dfb | 3829 | 63 | 10.0 | Salamanca | 87 | Csb | 3040 | 120 | 11.7 | ||
| Iceland | Reykjavik | 38 | Cfc | 5670 | 0 | 4.5 | Santander | 88 | Cfb | 1982 | 16 | 14.8 | |
| Ireland | Clones | 39 | Cfb | 3974 | 0 | 9.1 | Teruel | 89 | Cfb | 3060 | 129 | 11.5 | |
| Dublin | 40 | Cfb | 3725 | 0 | 9.8 | Sweden | Gothenburg | 90 | Cfb | 4988 | 3 | 6.5 | |
| Valentia | 41 | Cfb | 3352 | 0 | 11.0 | Kiruna | 91 | Dfc | 7816 | 0 | −1.1 | ||
| Italy | Bolzano | 42 | Dfb | 3515 | 102 | 10.7 | Stockholm | 92 | Dfb | 5037 | 6 | 6.5 | |
| Campobasso | 43 | Cfa | 3296 | 51 | 11.3 | Switzerland | Geneva | 93 | Cfb | 3658 | 53 | 10.4 | |
| Catania | 44 | Csa | 1632 | 211 | 17.1 | Turkey | Ankara | 94 | Csb | 4066 | 99 | 9.6 | |
| Florence | 45 | Csa | 2495 | 172 | 14.2 | Istanbul | 95 | Csa | 2406 | 120 | 14.5 | ||
| Foggia | 46 | Cfa | 2223 | 240 | 15.4 | Izmir | 96 | Csa | 1889 | 350 | 16.7 | ||
| Milan | 47 | Cfb | 3014 | 113 | 12.4 | Ukraine | Kiev | 97 | Dfb | 4529 | 34 | 8.0 | |
| Palermo | 48 | Csa | 1146 | 203 | 18.8 | Odessa | 98 | Cfa | 3923 | 69 | 10.1 | ||
| Rome | 49 | Csa | 1994 | 112 | 15.8 | United Kingdom | Aberdeen | 99 | Cfb | 4267 | 1 | 8.4 | |
| Tarvisio | 50 | Dfb | 4681 | 9 | 7.0 | London | 100 | Cfb | 3683 | 11 | 10.2 |
| Simulation Parameters | ||||
|---|---|---|---|---|
| Category | Group | Type | Unit | Parameter Input Value |
| Thermo-physical parameters | Envelope | U-value exterior walls | W/m2K | 0.12–0.64 |
| Windows: U-value | W/m2K | 1.40 | ||
| SHGC | - | 0.75 | ||
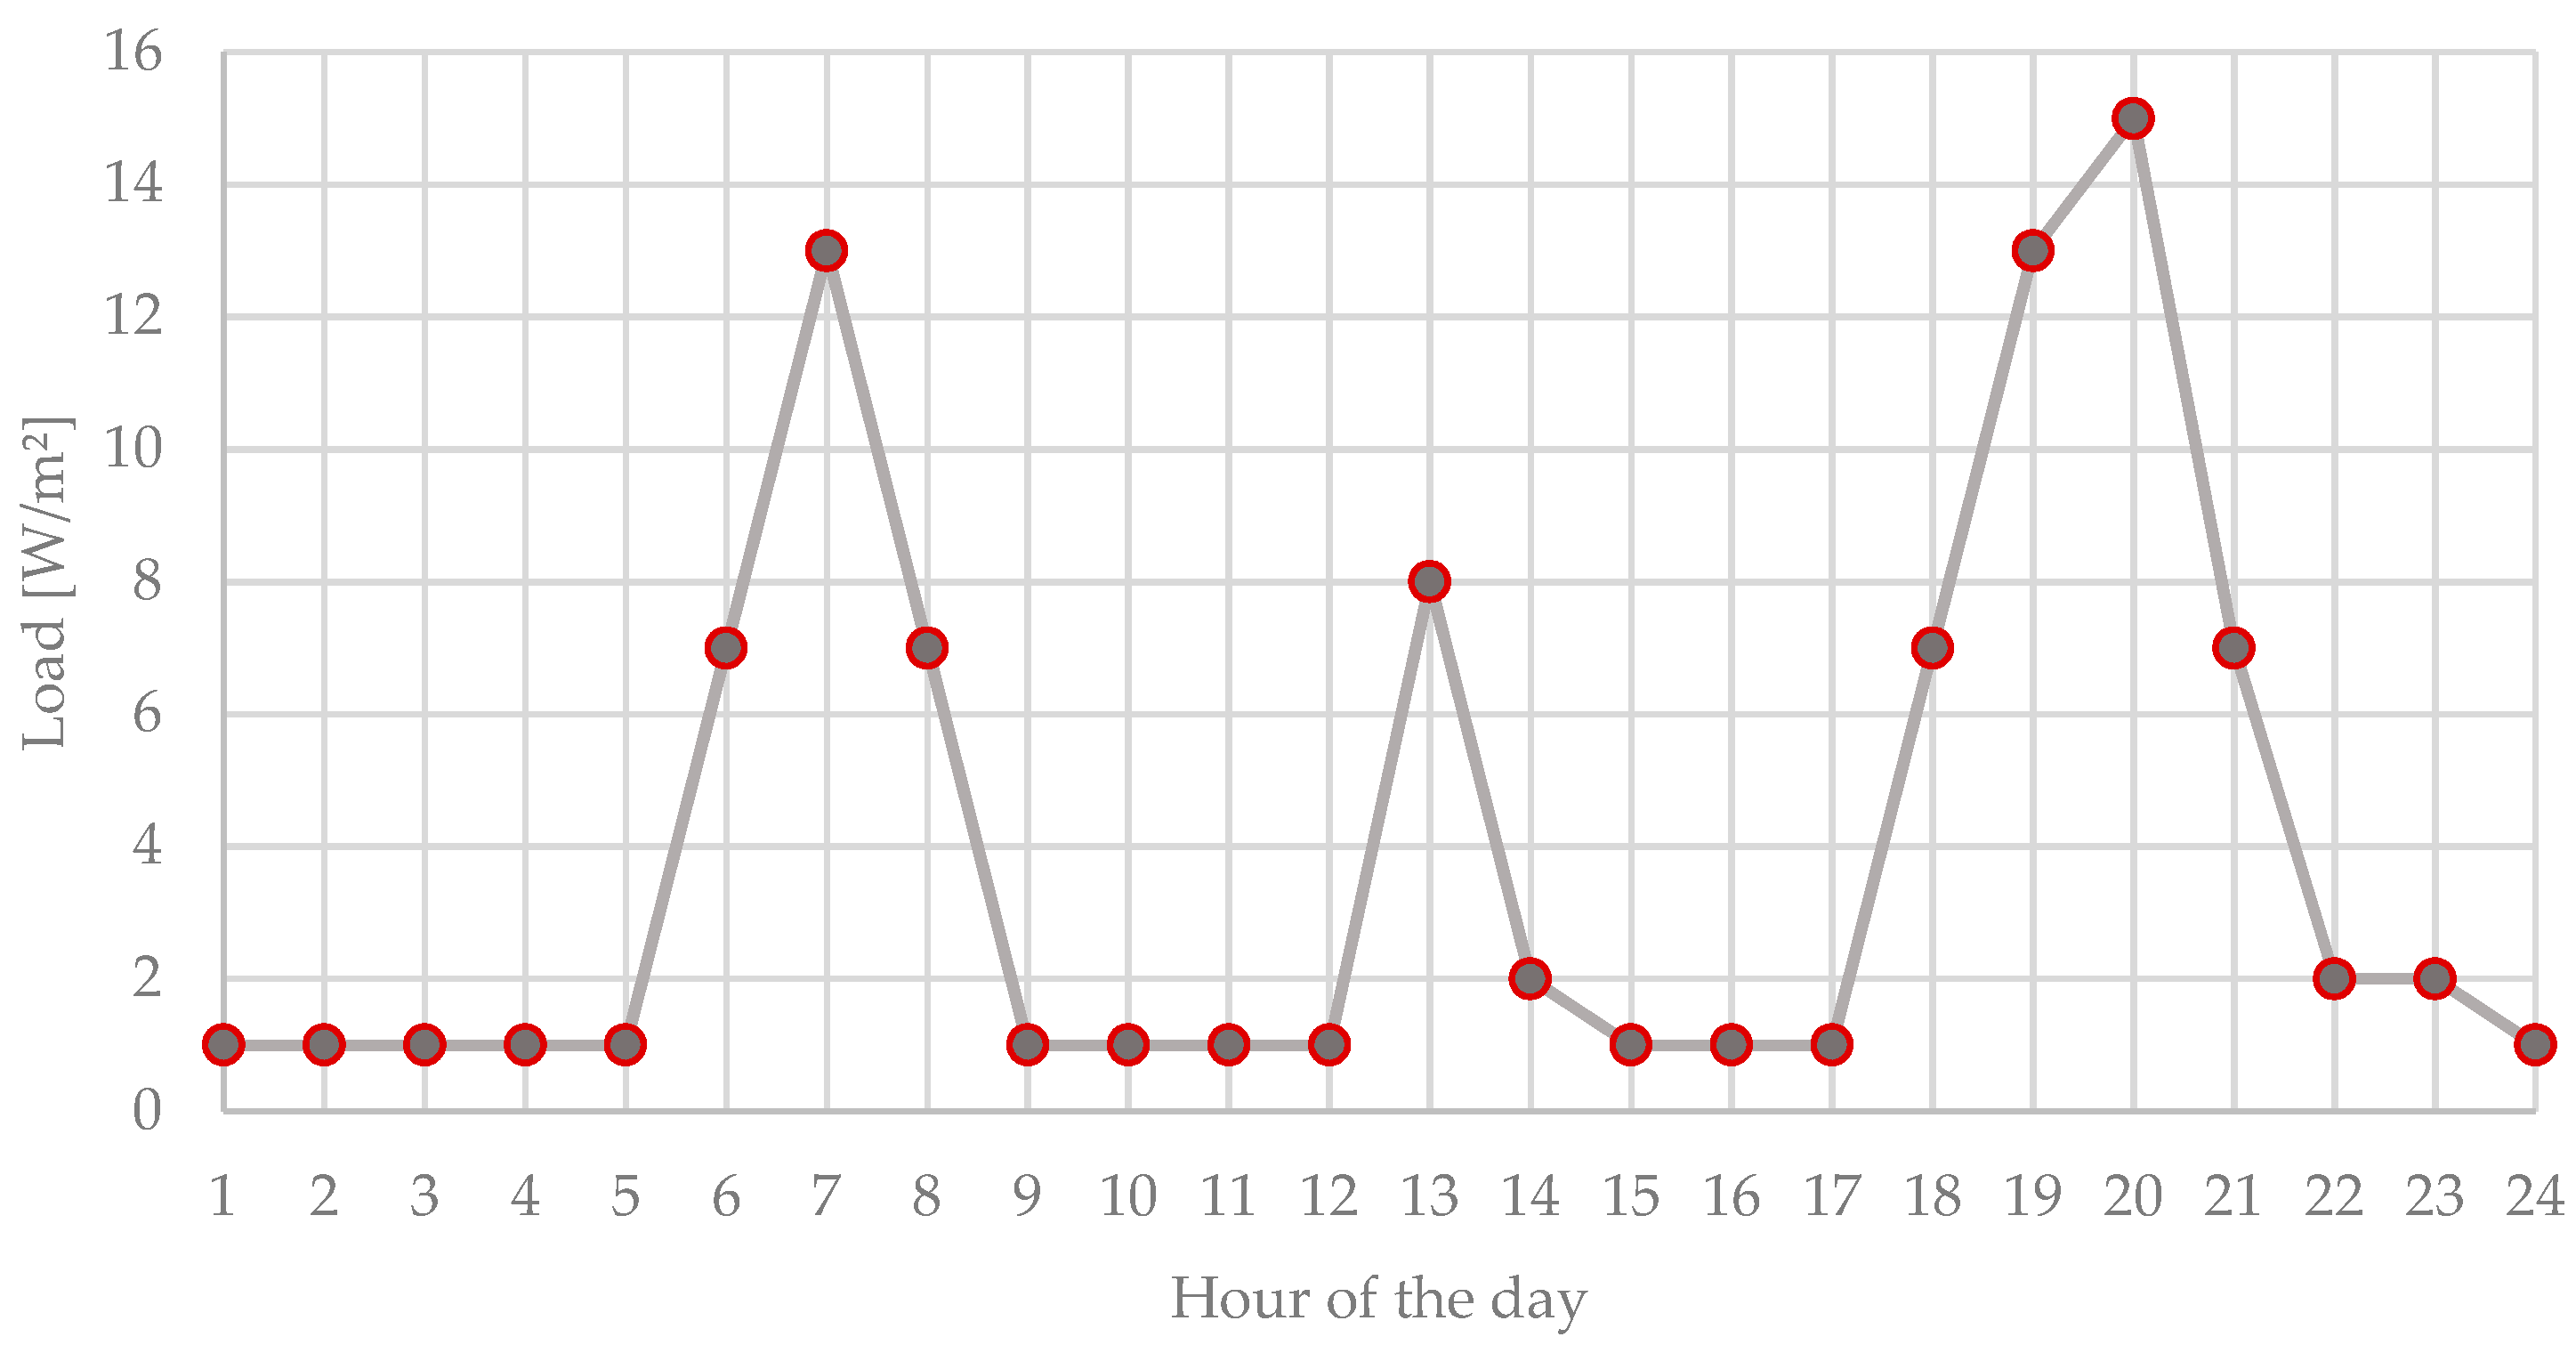
| Building operation | Activities | Internal load per area (a) daily average. Daily profile in Figure 5 | W/m2 | 4 |
| Control and operation settings | Heating set-point temperature | °C | 20 | |
| Cooling set-point temperature | °C | 26 | ||
| Air-change rate ACR (infiltration and natural ventilation) | vol/h | 0.5 from 8:01 to 20:00, 0.2 from 20:01 to 8:00 | ||
| Country | Location | ID | External Wall’s Optimal U-Value [W/m2K] | Country | Location | ID | External Wall’s Optimal U-Value [W/m2K] |
|---|---|---|---|---|---|---|---|
| Albania | Korca | 1 | 0.22 | Jersey | Jersey | 51 | 0.20 |
| Tirana | 2 | 0.32 | Latvia | Riga | 52 | 0.12 | |
| Armenia | Gyumri | 3 | 0.13 | Liechtenstein | Vaduz | 53 | 0.17 |
| Yerevan | 4 | 0.18 | Lithuania | Kaunas | 54 | 0.12 | |
| Austria | Innsbruck | 5 | 0.16 | Luxemburg | Luxemburg | 55 | 0.15 |
| Vienna | 6 | 0.13 | Moldova | Chisinau | 56 | 0.16 | |
| Azerbaijan | Baku | 7 | 0.25 | Malta | Valetta | 57 | 0.64 |
| Lankaran | 8 | 0.24 | Man Island | Castletown | 58 | 0.18 | |
| Sheki | 9 | 0.20 | Montenegro | Podgorica | 59 | 0.28 | |
| Belarus | Minsk | 10 | 0.12 | The Netherlands | Amsterdam | 60 | 0.15 |
| Belgium | Brussels | 11 | 0.16 | North Macedonia | Skopje | 61 | 0.18 |
| Saint Hubert | 12 | 0.12 | Norway | Bergen | 62 | 0.12 | |
| Bosnia and Herzegovina | Banja Luka | 13 | 0.16 | Oslo | 63 | 0.12 | |
| Bulgaria | Plovdiv | 14 | 0.18 | Poland | Bialystok | 64 | 0.12 |
| Sofia | 15 | 0.15 | Kasprowy Wierch Mt. | 65 | 0.12 | ||
| Varna | 16 | 0.18 | Warsaw | 66 | 0.13 | ||
| Croatia | Zagreb | 17 | 0.18 | Zakopane | 67 | 0.12 | |
| Cyprus | Larnaca | 18 | 0.64 | Portugal | Braganca | 68 | 0.27 |
| Czech Republic | Prague | 19 | 0.12 | Coimbra | 69 | 0.63 | |
| Denmark | Copenhagen | 20 | 0.12 | Evora | 70 | 0.58 | |
| Estonia | Tallinn | 21 | 0.12 | Lisboa | 71 | 0.64 | |
| Faroe Islands | Torshavn | 22 | 0.13 | Romania | Bucharest | 72 | 0.15 |
| Finland | Helsinki | 23 | 0.12 | Cluj-Napoca | 73 | 0.14 | |
| France | Bordeaux | 24 | 0.26 | Constanta | 74 | 0.17 | |
| Marseille | 25 | 0.33 | Russia | Arkhangelsk | 75 | 0.12 | |
| Paris | 26 | 0.17 | Moscow | 76 | 0.12 | ||
| Georgia | Akhaltsikhé | 27 | 0.12 | Samara | 77 | 0.12 | |
| Tbilisi | 28 | 0.22 | Serbia | Belgrade | 78 | 0.16 | |
| Germany | Berlin | 29 | 0.14 | Slovak Republic | Bratislava | 79 | 0.15 |
| Mannheim | 30 | 0.16 | Kosice | 80 | 0.13 | ||
| Munich | 31 | 0.13 | Slovenia | Ljubljana | 81 | 0.13 | |
| Gibraltar | Gibraltar | 32 | 0.64 | Spain | Almeria | 82 | 0.64 |
| Greece | Athens | 33 | 0.49 | Barcelona | 83 | 0.39 | |
| Thessaloniki | 34 | 0.30 | Burgos | 84 | 0.17 | ||
| Guernsey | Guernsey | 35 | 0.23 | Cordoba | 85 | 0.64 | |
| Hungary | Debrecen | 36 | 0.14 | Madrid | 86 | 0.29 | |
| Szombathely | 37 | 0.14 | Salamanca | 87 | 0.23 | ||
| Iceland | Reykjavik | 38 | 0.12 | Santander | 88 | 0.40 | |
| Ireland | Clones | 39 | 0.16 | Teruel | 89 | 0.21 | |
| Dublin | 40 | 0.16 | Sweden | Gothenburg | 90 | 0.12 | |
| Valentia | 41 | 0.19 | Kiruna | 91 | 0.12 | ||
| Italy | Bolzano | 42 | 0.15 | Stockholm | 92 | 0.12 | |
| Campobasso | 43 | 0.18 | Switzerland | Geneva | 93 | 0.16 | |
| Catania | 44 | 0.47 | Turkey | Ankara | 94 | 0.14 | |
| Florence | 45 | 0.22 | Istanbul | 95 | 0.23 | ||
| Foggia | 46 | 0.24 | Izmir | 96 | 0.42 | ||
| Milan | 47 | 0.16 | Ukrain | Kiev | 97 | 0.12 | |
| Palermo | 48 | 0.64 | Odessa | 98 | 0.14 | ||
| Rome | 49 | 0.42 | United Kingdom | Aberdeen | 99 | 0.14 | |
| Tarvisio | 50 | 0.12 | London | 100 | 0.16 |
Publisher’s Note: MDPI stays neutral with regard to jurisdictional claims in published maps and institutional affiliations. |
© 2022 by the authors. Licensee MDPI, Basel, Switzerland. This article is an open access article distributed under the terms and conditions of the Creative Commons Attribution (CC BY) license (https://creativecommons.org/licenses/by/4.0/).
Share and Cite
Ounis, S.; Aste, N.; Butera, F.M.; Pero, C.D.; Leonforte, F.; Adhikari, R.S. Optimal Balance between Heating, Cooling and Environmental Impacts: A Method for Appropriate Assessment of Building Envelope’s U-Value. Energies 2022, 15, 3570. https://doi.org/10.3390/en15103570
Ounis S, Aste N, Butera FM, Pero CD, Leonforte F, Adhikari RS. Optimal Balance between Heating, Cooling and Environmental Impacts: A Method for Appropriate Assessment of Building Envelope’s U-Value. Energies. 2022; 15(10):3570. https://doi.org/10.3390/en15103570
Chicago/Turabian StyleOunis, Safieddine, Niccolò Aste, Federico M. Butera, Claudio Del Pero, Fabrizio Leonforte, and Rajendra S. Adhikari. 2022. "Optimal Balance between Heating, Cooling and Environmental Impacts: A Method for Appropriate Assessment of Building Envelope’s U-Value" Energies 15, no. 10: 3570. https://doi.org/10.3390/en15103570
APA StyleOunis, S., Aste, N., Butera, F. M., Pero, C. D., Leonforte, F., & Adhikari, R. S. (2022). Optimal Balance between Heating, Cooling and Environmental Impacts: A Method for Appropriate Assessment of Building Envelope’s U-Value. Energies, 15(10), 3570. https://doi.org/10.3390/en15103570