
Renewable and Non-Renewable Energy Consumption and Trade Policy: Do They Matter for Environmental Sustainability?


Abstract
:1. Introduction
2. Literature Review
3. Variable Description and Model Specification
3.1. Variable Description
3.2. Model Specification
4. Empirical Analysis
4.1. Fundamental Statistics
4.2. Bounds Test
4.3. Analyses of Long-Run and Short-Run Auto-Regressive Distribution Lag Coefficients
4.4. Toda-Yamaimo Causality Test
5. Discussions
6. Conclusions
Funding
Institutional Review Board Statement
Informed Consent Statement
Data Availability Statement
Conflicts of Interest
References
- Usman, O.; Alola, A.A.; Sarkodie, S.A. Assessment of the Role of Renewable Energy Consumption and Trade Policy on Environmental Degradation Using Innovation Accounting: Evidence from the US. Renew. Energy 2020, 150, 266–277. [Google Scholar] [CrossRef]
- Wang, Z.; Yang, L.; Yin, J.; Zhang, B. Assessment and Prediction of Environmental Sustainability in China Based on a Modified Ecological Footprint Model. Resour. Conserv. Recycl. 2018, 132, 301–313. [Google Scholar] [CrossRef]
- Siche, J.R.; Agostinho, F.; Ortega, E.; Romeiro, A. Sustainability of Nations by Indices: Comparative Study between Environmental Sustainability Index, Ecological Footprint and the Emergy Performance Indices. Ecol. Econ. 2008, 66, 628–637. [Google Scholar] [CrossRef]
- He, Y.; Li, X.; Huang, P.; Wang, J. Exploring the Road toward Environmental Sustainability: Natural Resources, Renewable Energy Consumption, Economic Growth, and Greenhouse Gas Emissions. Sustainability 2022, 14, 1579. [Google Scholar] [CrossRef]
- Khan, I.; Hou, F.; Le, H.P.; Ali, S.A. Do Natural Resources, Urbanization, and Value-Adding Manufacturing Affect Environmental Quality? Evidence from the Top Ten Manufacturing Countries. Resour. Policy 2021, 72, 102109. [Google Scholar] [CrossRef]
- Zia, S.; Rahman, M.; Noor, M.H.; Khan, M.K.; Bibi, M.; Godil, D.I.; Quddoos, M.U.; Anser, M.K. Striving towards Environmental Sustainability: How Natural Resources, Human Capital, Financial Development, and Economic Growth Interact with Ecological Footprint in China. Environ. Sci. Pollut. Res. 2021, 28, 52499–52513. [Google Scholar] [CrossRef] [PubMed]
- Zhang, Y.; Siang, C.C. Alternative Fuel Implementation Policy in China and Its Assessment; Institute of Energy Economics: Tokyo, Japan, 2007. [Google Scholar]
- Tian, T.; Tu, X. The Ecological Security Pattern of China’s Energy Consumption Based on Carbon Footprint. Landsc. Archit. Front. 2016, 4, 10–18. [Google Scholar]
- Adebayo, T.S.; Agboola, M.O.; Rjoub, H.; Adeshola, I.; Agyekum, E.B.; Kumar, N.M. Linking Economic Growth, Urbanization, and Environmental Degradation in China: What Is the Role of Hydroelectricity Consumption? Int. J. Environ. Res. Public. Health 2021, 18, 6975. [Google Scholar] [CrossRef]
- Rozelle, S.; Huang, J.; Zhang, L. Poverty, Population and Environmental Degradation in China. Food Policy 1997, 22, 229–251. [Google Scholar] [CrossRef]
- Chen, Y.; Zhao, J.; Lai, Z.; Wang, Z.; Xia, H. Exploring the Effects of Economic Growth, and Renewable and Non-Renewable Energy Consumption on China’s CO2 Emissions: Evidence from a Regional Panel Analysis. Renew. Energy 2019, 140, 341–353. [Google Scholar] [CrossRef]
- Munir, K.; Riaz, N. Asymmetric Impact of Energy Consumption on Environmental Degradation: Evidence from Australia, China, and USA. Environ. Sci. Pollut. Res. 2020, 27, 11749–11759. [Google Scholar] [CrossRef]
- Sharma, R.; Sinha, A.; Kautish, P. Does Renewable Energy Consumption Reduce Ecological Footprint? Evidence from Eight Developing Countries of Asia. J. Clean. Prod. 2021, 285, 124867. [Google Scholar] [CrossRef]
- Ulucak, R.; Khan, S.U.-D. Determinants of the Ecological Footprint: Role of Renewable Energy, Natural Resources, and Urbanization. Sustain. Cities Soc. 2020, 54, 101996. [Google Scholar]
- Ansari, M.A.; Haider, S.; Masood, T. Do Renewable Energy and Globalization Enhance Ecological Footprint: An Analysis of Top Renewable Energy Countries? Environ. Sci. Pollut. Res. 2021, 28, 6719–6732. [Google Scholar] [CrossRef] [PubMed]
- Caglar, A.E.; Mert, M.; Boluk, G. Testing the Role of Information and Communication Technologies and Renewable Energy Consumption in Ecological Footprint Quality: Evidence from World Top 10 Pollutant Footprint Countries. J. Clean. Prod. 2021, 298, 126784. [Google Scholar] [CrossRef]
- Nathaniel, S.P.; Yalçiner, K.; Bekun, F.V. Assessing the Environmental Sustainability Corridor: Linking Natural Resources, Renewable Energy, Human Capital, and Ecological Footprint in BRICS. Resour. Policy 2021, 70, 101924. [Google Scholar] [CrossRef]
- Kongbuamai, N.; Bui, Q.; Nimsai, S. The Effects of Renewable and Nonrenewable Energy Consumption on the Ecological Footprint: The Role of Environmental Policy in BRICS Countries. Environ. Sci. Pollut. Res. 2021, 28, 27885–27899. [Google Scholar] [CrossRef]
- Nathaniel, S.; Nwodo, O.; Sharma, G.; Shah, M. Renewable Energy, Urbanization, and Ecological Footprint Linkage in CIVETS. Environ. Sci. Pollut. Res. 2020, 27, 19616–19629. [Google Scholar] [CrossRef]
- Onifade, S.T.; Erdoğan, S.; Alagöz, M.; Bekun, F.V. Renewables as a Pathway to Environmental Sustainability Targets in the Era of Trade Liberalization: Empirical Evidence from Turkey and the Caspian Countries. Environ. Sci. Pollut. Res. 2021, 28, 41663–41674. [Google Scholar] [CrossRef]
- Khan, I.; Zakari, A.; Ahmad, M.; Irfan, M.; Hou, F. Linking Energy Transitions, Energy Consumption, and Environmental Sustainability in OECD Countries. Gondwana Res. 2022, 103, 445–457. [Google Scholar] [CrossRef]
- Alola, A.A. The Trilemma of Trade, Monetary and Immigration Policies in the United States: Accounting for Environmental Sustainability. Sci. Total Environ. 2019, 658, 260–267. [Google Scholar] [CrossRef] [PubMed]
- Chakraborty, D.; Mukherjee, S. How Do Trade and Investment Flows Affect Environmental Sustainability? Evidence from Panel Data. Environ. Dev. 2013, 6, 34–47. [Google Scholar] [CrossRef]
- Iheonu, C.O.; Anyanwu, O.C.; Odo, O.K.; Nathaniel, S.P. Does Economic Growth, International Trade, and Urbanization Uphold Environmental Sustainability in Sub-Saharan Africa? Insights from Quantile and Causality Procedures. Environ. Sci. Pollut. Res. 2021, 28, 28222–28233. [Google Scholar] [CrossRef] [PubMed]
- Akadiri, S.S.; Alkawfi, M.M.; Uğural, S.; Akadiri, A.C. Towards Achieving Environmental Sustainability Target in Italy. The Role of Energy, Real Income and Globalization. Sci. Total Environ. 2019, 671, 1293–1301. [Google Scholar] [CrossRef]
- Nathaniel, S.; Khan, S.A.R. The Nexus between Urbanization, Renewable Energy, Trade, and Ecological Footprint in ASEAN Countries. J. Clean. Prod. 2020, 272, 122709. [Google Scholar] [CrossRef]
- Nathaniel, S.P.; Murshed, M.; Bassim, M. The Nexus between Economic Growth, Energy Use, International Trade and Ecological Footprints: The Role of Environmental Regulations in N11 Countries. Energy Ecol. Environ. 2021, 6, 496–512. [Google Scholar] [CrossRef]
- Ahmed, Z.; Zhang, B.; Cary, M. Linking Economic Globalization, Economic Growth, Financial Development, and Ecological Footprint: Evidence from Symmetric and Asymmetric ARDL. Ecol. Indic. 2021, 121, 107060. [Google Scholar] [CrossRef]
- Udemba, E.N. A Sustainable Study of Economic Growth and Development amidst Ecological Footprint: New Insight from Nigerian Perspective. Sci. Total Environ. 2020, 732, 139270. [Google Scholar] [CrossRef]
- Ahmad, M.; Jiang, P.; Majeed, A.; Umar, M.; Khan, Z.; Muhammad, S. The Dynamic Impact of Natural Resources, Technological Innovations and Economic Growth on Ecological Footprint: An Advanced Panel Data Estimation. Resour. Policy 2020, 69, 101817. [Google Scholar] [CrossRef]
- Baz, K.; Xu, D.; Ali, H.; Ali, I.; Khan, I.; Khan, M.M.; Cheng, J. Asymmetric Impact of Energy Consumption and Economic Growth on Ecological Footprint: Using Asymmetric and Nonlinear Approach. Sci. Total Environ. 2020, 718, 137364. [Google Scholar] [CrossRef]
- Kihombo, S.; Ahmed, Z.; Chen, S.; Adebayo, T.S.; Kirikkaleli, D. Linking Financial Development, Economic Growth, and Ecological Footprint: What Is the Role of Technological Innovation? Environ. Sci. Pollut. Res. 2021, 28, 61235–61245. [Google Scholar] [CrossRef] [PubMed]
- Ikram, M.; Xia, W.; Fareed, Z.; Shahzad, U.; Rafique, M.Z. Exploring the Nexus between Economic Complexity, Economic Growth and Ecological Footprint: Contextual Evidences from Japan. Sustain. Energy Technol. Assess. 2021, 47, 101460. [Google Scholar] [CrossRef]
- Acar, S.; Aşıcı, A.A. Nature and Economic Growth in Turkey: What Does Ecological Footprint Imply? Middle East Dev. J. 2017, 9, 101–115. [Google Scholar] [CrossRef]
- Hussain, H.I.; Haseeb, M.; Kamarudin, F.; Dacko-Pikiewicz, Z.; Szczepańska-Woszczyna, K. The Role of Globalization, Economic Growth and Natural Resources on the Ecological Footprint in Thailand: Evidence from Nonlinear Causal Estimations. Processes 2021, 9, 1103. [Google Scholar] [CrossRef]
- Usman, M.; Makhdum, M.S.A. What Abates Ecological Footprint in BRICS-T Region? Exploring the Influence of Renewable Energy, Non-Renewable Energy, Agriculture, Forest Area and Financial Development. Renew. Energy 2021, 179, 12–28. [Google Scholar] [CrossRef]
- Usman, M.; Makhdum, M.S.A.; Kousar, R. Does Financial Inclusion, Renewable and Non-Renewable Energy Utilization Accelerate Ecological Footprints and Economic Growth? Fresh Evidence from 15 Highest Emitting Countries. Sustain. Cities Soc. 2021, 65, 102590. [Google Scholar] [CrossRef]
- Christoforidis, T.; Katrakilidis, C. The Dynamic Role of Institutional Quality, Renewable and Non-Renewable Energy on the Ecological Footprint of OECD Countries: Do Institutions and Renewables Function as Leverage Points for Environmental Sustainability? Environ. Sci. Pollut. Res. 2021, 28, 53888–53907. [Google Scholar] [CrossRef]
- Khan, I.; Hou, F.; Le, H.P. The Impact of Natural Resources, Energy Consumption, and Population Growth on Environmental Quality: Fresh Evidence from the United States of America. Sci. Total Environ. 2021, 754, 142222. [Google Scholar] [CrossRef]
- Sahoo, M.; Sethi, N. The Intermittent Effects of Renewable Energy on Ecological Footprint: Evidence from Developing Countries. Environ. Sci. Pollut. Res. 2021, 28, 56401–56417. [Google Scholar] [CrossRef]
- Rout, S.K.; Gupta, M.; Sahoo, M. The Role of Technological Innovation and Diffusion, Energy Consumption and Financial Development in Affecting Ecological Footprint in BRICS: An Empirical Analysis. Environ. Sci. Pollut. Res. 2022, 29, 25318–25335. [Google Scholar] [CrossRef]
- Khan, I.; Hou, F. The Dynamic Links among Energy Consumption, Tourism Growth, and the Ecological Footprint: The Role of Environmental Quality in 38 IEA Countries. Environ. Sci. Pollut. Res. 2021, 28, 5049–5062. [Google Scholar] [CrossRef] [PubMed]
- Wang, X.; Yan, L.; Zhao, X. Tackling the Ecological Footprint in China through Energy Consumption, Economic Growth and CO2 Emission: An ARDL Approach. Qual. Quant. 2022, 56, 511–531. [Google Scholar] [CrossRef]
- Naqvi, S.A.A.; Shah, S.A.R.; Mehdi, M.A. Revealing Empirical Association among Ecological Footprints, Renewable Energy Consumption, Real Income, and Financial Development: A Global Perspective. Environ. Sci. Pollut. Res. 2020, 27, 42830–42849. [Google Scholar] [CrossRef] [PubMed]
- Hassan, S.T.; Xia, E.; Khan, N.H.; Shah, S.M.A. Economic Growth, Natural Resources, and Ecological Footprints: Evidence from Pakistan. Environ. Sci. Pollut. Res. 2019, 26, 2929–2938. [Google Scholar] [CrossRef]
- Galli, A.; Kitzes, J.; Niccolucci, V.; Wackernagel, M.; Wada, Y.; Marchettini, N. Assessing the Global Environmental Consequences of Economic Growth through the Ecological Footprint: A Focus on China and India. Ecol. Indic. 2012, 17, 99–107. [Google Scholar] [CrossRef]
- Nathaniel, S.P. Biocapacity, Human Capital, and Ecological Footprint in G7 Countries: The Moderating Role of Urbanization and Necessary Lessons for Emerging Economies. Energy Ecol. Environ. 2021, 6, 435–450. [Google Scholar] [CrossRef]
- Agbede, E.A.; Bani, Y.; Azman-Saini, W.N.; Naseem, N.A. The Impact of Energy Consumption on Environmental Quality: Empirical Evidence from the MINT Countries. Environ. Sci. Pollut. Res. 2021, 28, 54117–54136. [Google Scholar] [CrossRef]
- Pata, U.K.; Isik, C. Determinants of the Load Capacity Factor in China: A Novel Dynamic ARDL Approach for Ecological Footprint Accounting. Resour. Policy 2021, 74, 102313. [Google Scholar] [CrossRef]
- Banerjee, P.; Mukhopadhayay, A. Ecological Footprint: Indicator of Environmental Sustainability. In Environmental Management: Issues and Concerns in Developing Countries; Springer: Berlin/Heidelberg, Germany, 2021; pp. 43–59. [Google Scholar]
- Chu, L.K. Determinants of Ecological Footprint in OCED Countries: Do Environmental-Related Technologies Reduce Environmental Degradation? Environ. Sci. Pollut. Res. 2022, 29, 23779–23793. [Google Scholar] [CrossRef]
- Shittu, W.; Adedoyin, F.F.; Shah, M.I.; Musibau, H.O. An Investigation of the Nexus between Natural Resources, Environmental Performance, Energy Security and Environmental Degradation: Evidence from Asia. Resour. Policy 2021, 73, 102227. [Google Scholar] [CrossRef]
- Rafique, M.Z.; Nadeem, A.M.; Xia, W.; Ikram, M.; Shoaib, H.M.; Shahzad, U. Does Economic Complexity Matter for Environmental Sustainability? Using Ecological Footprint as an Indicator. Environ. Dev. Sustain. 2022, 24, 4623–4640. [Google Scholar] [CrossRef] [PubMed]
- Ahmed, Z.; Asghar, M.M.; Malik, M.N.; Nawaz, K. Moving towards a Sustainable Environment: The Dynamic Linkage between Natural Resources, Human Capital, Urbanization, Economic Growth, and Ecological Footprint in China. Resour. Policy 2020, 67, 101677. [Google Scholar] [CrossRef]
- Khan, N.H.; Ju, Y.; Latif, Z.; Khan, K. Nexus between Carbon Emission, Financial Development, and Access to Electricity: Incorporating the Role of Natural Resources and Population Growth. J. Public Aff. 2021, 21, e2131. [Google Scholar] [CrossRef]
- Chen, M.; Wang, R.; Zhang, L.; Xu, C. Temporal and Spatial Assessment of Natural Resource Use in China Using Ecological Footprint Method. Int. J. Sustain. Dev. World Ecol. 2006, 13, 255–268. [Google Scholar] [CrossRef]
- Zheng, W.; Cai, F.; Chen, S.; Zhu, J.; Qi, H.; Zhao, S.; Liu, J. Ecological Suitability of Island Development Based on Ecosystem Services Value, Biocapacity and Ecological Footprint: A Case Study of Pingtan Island, Fujian, China. Sustainability 2020, 12, 2553. [Google Scholar] [CrossRef] [Green Version]
- Ünal, H.; Aktuğ, M. The Impact of Human Capital and Bio-Capacity on the Environmental Quality: Evidence from G20 Countries. Environ. Sci. Pollut. Res. 2022. [Google Scholar] [CrossRef]
- Hassan, S.T.; Baloch, M.A.; Mahmood, N.; Zhang, J. Linking Economic Growth and Ecological Footprint through Human Capital and Biocapacity. Sustain. Cities Soc. 2019, 47, 101516. [Google Scholar]
- Galli, A.; Iha, K.; Pires, S.M.; Mancini, M.S.; Alves, A.; Zokai, G.; Lin, D.; Murthy, A.; Wackernagel, M. Assessing the Ecological Footprint and Biocapacity of Portuguese Cities: Critical Results for Environmental Awareness and Local Management. Cities 2020, 96, 102442. [Google Scholar] [CrossRef]
- Eregha, P.B.; Nathaniel, S.P.; Vo, X.V. Economic Growth, Environmental Regulations, Energy Use, and Ecological Footprint Linkage in the Next-11 Countries: Implications for Environmental Sustainability. Energy Environ. 2022, 0958305X221084293. [Google Scholar] [CrossRef]
- Liu, Y.; Sadiq, F.; Ali, W.; Kumail, T. Does Tourism Development, Energy Consumption, Trade Openness and Economic Growth Matters for Ecological Footprint: Testing the Environmental Kuznets Curve and Pollution Haven Hypothesis for Pakistan. Energy 2022, 245, 123208. [Google Scholar] [CrossRef]
- Usman, M.; Kousar, R.; Yaseen, M.R.; Makhdum, M.S.A. An Empirical Nexus between Economic Growth, Energy Utilization, Trade Policy, and Ecological Footprint: A Continent-Wise Comparison in Upper-Middle-Income Countries. Environ. Sci. Pollut. Res. 2020, 27, 38995–39018. [Google Scholar] [CrossRef] [PubMed]
- Iorember, P.T.; Goshit, G.G.; Dabwor, D.T. Testing the Nexus between Renewable Energy Consumption and Environmental Quality in Nigeria: The Role of Broad-Based Financial Development. Afr. Dev. Rev. 2020, 32, 163–175. [Google Scholar] [CrossRef]
- Sharif, A.; Baris-Tuzemen, O.; Uzuner, G.; Ozturk, I.; Sinha, A. Revisiting the Role of Renewable and Non-Renewable Energy Consumption on Turkey’s Ecological Footprint: Evidence from Quantile ARDL Approach. Sustain. Cities Soc. 2020, 57, 102138. [Google Scholar] [CrossRef]
- Udeagha, M.C.; Ngepah, N. Disaggregating the Environmental Effects of Renewable and Non-Renewable Energy Consumption in South Africa: Fresh Evidence from the Novel Dynamic ARDL Simulations Approach. Econ. Chang. Restruct. 2021, 1–48. [Google Scholar] [CrossRef]
- Pesaran, M.H.; Shin, Y.; Smith, R.J. Bounds Testing Approaches to the Analysis of Level Relationships. J. Appl. Econom. 2001, 16, 289–326. [Google Scholar] [CrossRef]
- Alola, A.A.; Bekun, F.V.; Sarkodie, S.A. Dynamic Impact of Trade Policy, Economic Growth, Fertility Rate, Renewable and Non-Renewable Energy Consumption on Ecological Footprint in Europe. Sci. Total Environ. 2019, 685, 702–709. [Google Scholar] [CrossRef]
- Toda, H.Y.; Yamamoto, T. Statistical Inference in Vector Autoregressions with Possibly Integrated Processes. J. Econom. 1995, 66, 225–250. [Google Scholar] [CrossRef]
- Dickey, D.A.; Fuller, W.A. Distribution of the Estimators for Autoregressive Time Series with a Unit Root. J. Am. Stat. Assoc. 1979, 74, 427–431. [Google Scholar]
- Phillips, P.C.; Perron, P. Testing for a Unit Root in Time Series Regression. Biometrika 1988, 75, 335–346. [Google Scholar] [CrossRef]
- Kripfganz, S.; Schneider, D.C. Response Surface Regressions for Critical Value Bounds and Approximate P-Values in Equilibrium Correction Models 1. Oxf. Bull. Econ. Stat. 2020, 82, 1456–1481. [Google Scholar] [CrossRef]
- Naqvi, S.A.A.; Shah, S.A.R.; Anwar, S.; Raza, H. Renewable Energy, Economic Development, and Ecological Footprint Nexus: Fresh Evidence of Renewable Energy Environment Kuznets Curve (RKC) from Income Groups. Environ. Sci. Pollut. Res. 2021, 28, 2031–2051. [Google Scholar] [CrossRef] [PubMed]
- Abid, M.; Gheraia, Z.; Abdelli, H. Does Renewable Energy Consumption Affect Ecological Footprints in Saudi Arabia? A Bootstrap Causality Test. Renew. Energy 2022, 189, 813–821. [Google Scholar] [CrossRef]
- Lu, W.-C. The Interplay among Ecological Footprint, Real Income, Energy Consumption, and Trade Openness in 13 Asian Countries. Environ. Sci. Pollut. Res. 2020, 27, 45148–45160. [Google Scholar] [CrossRef] [PubMed]
- Mujtaba, A.; Jena, P.K.; Bekun, F.V.; Sahu, P.K. Symmetric and Asymmetric Impact of Economic Growth, Capital Formation, Renewable and Non-Renewable Energy Consumption on Environment in OECD Countries. Renew. Sustain. Energy Rev. 2022, 160, 112300. [Google Scholar] [CrossRef]
- Destek, M.A.; Sinha, A. Renewable, Non-Renewable Energy Consumption, Economic Growth, Trade Openness and Ecological Footprint: Evidence from Organisation for Economic Co-Operation and Development Countries. J. Clean. Prod. 2020, 242, 118537. [Google Scholar] [CrossRef]
- Pata, U.K. Renewable and Non-Renewable Energy Consumption, Economic Complexity, CO2 Emissions, and Ecological Footprint in the USA: Testing the EKC Hypothesis with a Structural Break. Environ. Sci. Pollut. Res. 2021, 28, 846–861. [Google Scholar] [CrossRef]
- Majeed, M. Reexamination of Environmental Kuznets Curve for Ecological Footprint: The Role of Biocapacity, Human Capital, and Trade. Pak. J. Commer. Soc. Sci. 2020, 14, 202–254. [Google Scholar] [CrossRef]
- Usman, O.; Alola, A.A.; Saint Akadiri, S. Effects of Domestic Material Consumption, Renewable Energy, and Greenhouse Gas Emissions on Environmental Sustainability in the EU-28: Evidence from GMM Panel-VAR. Renew. Energy 2021, 184, 239–251. [Google Scholar] [CrossRef]
- Farhadi, P.; Eldermi, A.; Migranir, M. Assessment Bio Capacity and Ecological Footprint of Urban Ecosystems (Case Study: Hamedan). J. Environ. Sci. Technol. 2021, 23, 240–251. [Google Scholar]
- Ike, G.N.; Usman, O.; Sarkodie, S.A. Testing the Role of Oil Production in the Environmental Kuznets Curve of Oil Producing Countries: New Insights from Method of Moments Quantile Regression. Sci. Total Environ. 2020, 711, 135208. [Google Scholar] [CrossRef]
- Rafindadi, A.A.; Usman, O. Globalization, Energy Use, and Environmental Degradation in South Africa: Startling Empirical Evidence from the Maki-Cointegration Test. J. Environ. Manag. 2019, 244, 265–275. [Google Scholar] [CrossRef] [PubMed]
- Sarkodie, S.A. The Invisible Hand and EKC Hypothesis: What Are the Drivers of Environmental Degradation and Pollution in Africa? Environ. Sci. Pollut. Res. 2018, 25, 21993–22022. [Google Scholar] [CrossRef] [PubMed]
- Nathaniel, S.P. Natural Resources, Urbanisation, Economic Growth and the Ecological Footprint in South Africa: The Moderating Role of Human Capital. Quaest. Geogr. 2021, 40, 63–76. [Google Scholar] [CrossRef]
- Nathaniel, S.P.; Adedoyin, F.F. The Role of Income, Trade, and Environmental Regulations in Ensuring Environmental Sustainability in MINT Countries: Evidence from Ecological Footprint. Estud. Econ. Apl. 2021, 39, 8. [Google Scholar] [CrossRef]
- Usman, O.; Akadiri, S.S.; Adeshola, I. Role of Renewable Energy and Globalization on Ecological Footprint in the USA: Implications for Environmental Sustainability. Environ. Sci. Pollut. Res. 2020, 27, 30681–30693. [Google Scholar] [CrossRef] [PubMed]
- Elshimy, M.; El-Aasar, K.M. Carbon Footprint, Renewable Energy, Non-Renewable Energy, and Livestock: Testing the Environmental Kuznets Curve Hypothesis for the Arab World. Environ. Dev. Sustain. 2020, 22, 6985–7012. [Google Scholar] [CrossRef]
- Adekoya, O.B.; Oliyide, J.A.; Fasanya, I.O. Renewable and Non-Renewable Energy Consumption–Ecological Footprint Nexus in Net-Oil Exporting and Net-Oil Importing Countries: Policy Implications for a Sustainable Environment. Renew. Energy 2022, 189, 524–534. [Google Scholar] [CrossRef]
- Ahmed, Z.; Zafar, M.W.; Mansoor, S. Analyzing the Linkage between Military Spending, Economic Growth, and Ecological Footprint in Pakistan: Evidence from Cointegration and Bootstrap Causality. Environ. Sci. Pollut. Res. 2020, 27, 41551–41567. [Google Scholar] [CrossRef]
- Fonchamnyo, D.C.; Emmanuel, O.N.B.; Dinga, G.D. The Effects of Trade, Foreign Direct Investment, and Economic Growth on Environmental Quality and Overshoot: A Dynamic Common Correlation Effects Approach. SN Bus. Econ. 2021, 1, 138. [Google Scholar] [CrossRef]
- Wu, D. Spatially and Temporally Varying Relationships between Ecological Footprint and Influencing Factors in China’s Provinces Using Geographically Weighted Regression (GWR). J. Clean. Prod. 2020, 261, 121089. [Google Scholar] [CrossRef]


| Variable | Form | Definition | Source |
|---|---|---|---|
| Ecological footprint | efp | Ecological footprint (gha\person) in log | Global Footprint Network |
| Renewable energy consumption | rec | Renewable energy consumption (million tons) in log | OECD Database |
| Non-renewable energy consumption | nec | Fossil fuel energy consumption (% of total final energy consumption) | World Bank Database |
| Bio-capacity | bio | Bio-capacity (gha\person) in log | Global Footprint Network |
| Economic growth | gdp | GDP per capita (current US$) in log | World Bank Database |
| Trade policy | tra | Trade policy index in log | FRED Economic Database |
| Descriptive Statistics | ||||||
|---|---|---|---|---|---|---|
| Variable/Statistics | efp | rec | nec | bio | gdp | tra |
| Mean | 0.267 | 2.311 | 0.771 | −0.055 | 2.853 | 1.812 |
| Maximum | 0.569 | 2.446 | 0.906 | 0.551 | 3.948 | 2.374 |
| Minimum | 0.025 | 2.195 | 0.598 | −0.108 | 2.074 | 0.664 |
| Standard deviation | 0.175 | 0.052 | 0.089 | 0.092 | 0.595 | 0.376 |
| Correlation Test | ||||||
| Variable | efp | rec | nec | bio | gdp | tra |
| efp | 1.000 (----) | |||||
| rec | −0.751 *** (−7.622) | 1.000 (----) | ||||
| nec | 0.965 *** (24.951) | 0.821 *** (9.675) | 1.000 (----) | |||
| bio | 0.383 *** (2.782) | 0.397 *** (2.909) | 0.326 ** (2.314) | 1.000 (----) | ||
| gdp | 0.993 *** (57.416) | 0.756 *** (7.756) | 0.950 *** (20.489) | 0.408 *** (3.004) | 1.000 (----) | |
| tra | −0.511 *** (−3.989) | 0.673 *** (6.112) | 0.605 *** (5.097) | 0.168 (1.144) | 0.480 *** (3.673) | 1.000 (----) |
| Unit Root Test | ||||||
| Level | ADF test | PP test | First Difference | ADF test | PP test | |
| efp | −1.496 | −1.638 | efp | −5.765 *** | −5.759 *** | |
| rec | −2.282 | −1.674 | rec | −5.054 *** | −1.953 ** | |
| nec | −3.037 | −2.377 | nec | −5.318 *** | −5.346 *** | |
| bio | −6.684 *** | −6.683 *** | bio | −13.141 *** | −13.240 *** | |
| gdp | −1.480 | −1.248 | gdp | −5.739 *** | −5.722 *** | |
| tra | −4.521 *** | −4.573 *** | tra | −10.144 *** | −11.526 *** | |
| Panel A: efp = f(rec, nec, bio, gdp, tra) | ||||||||
|---|---|---|---|---|---|---|---|---|
| Test Statistics | Value | k | ||||||
| F-statistics | 7.221 *** | 5 | ||||||
| T-statistics | −6.417 *** | |||||||
| Critical Value Bounds | ||||||||
| Significance | I(0) | I(1) | ||||||
| 10% | 2.08 | 3.0 | ||||||
| 5% | 2.39 | 3.38 | ||||||
| 1% | 3.06 | 4.15 | ||||||
| Panel B: Kripfganz and Scheneider Critical Values and Approximate p-Values | ||||||||
| k = 5 | 10% Significance Level | 5% Significance Level | 1% Significance Level | p-Value | ||||
| I(0) | I(1) | I(0) | I(1) | I(0) | I(1) | I(0) | I(1) | |
| F-critical | 2.276 | 3.297 | 2.694 | 3.829 | 3.674 | 5.019 | 0.000 | 0.000 |
| T-critical | −2.306 | −3.353 | −2.734 | −3.920 | −3.657 | −5.256 | 0.000 | 0.000 |
| F-calculated | 7.587 *** | |||||||
| T-calculated | −5.519 *** | |||||||
| Dependent Variable: efp = f(rec, nec, bio, gdp, tra) | ||
|---|---|---|
| Type\Variable | Long-Run Estimation | Short-Run Estimation |
| rec | −0.297 *** (−3.544) | −0.092 *** (−3.790) |
| nec | 0.551 *** (5.291) | 0.259 *** (4.448) |
| bio | 0.738 ** (2.218) | 0.176 *** (2.571) |
| gdp | 0.229 *** (16.609) | 0.350 *** (6.342) |
| tra | −0.014 *** (−4.094) | −0.011 *** (−4.676) |
| c | −0.146 *** (−8.805) | −0.375 ** (−2.146) |
| ecm−1 | −0.014 *** (3.633) | |
| Diagnostic test | ||
| Statistical method | Statistical value | p-value |
| 1.532 | 0.215 | |
| 1.388 | 0.499 | |
| 0.505 | 0.484 | |
| 0.953 | 0.621 | |
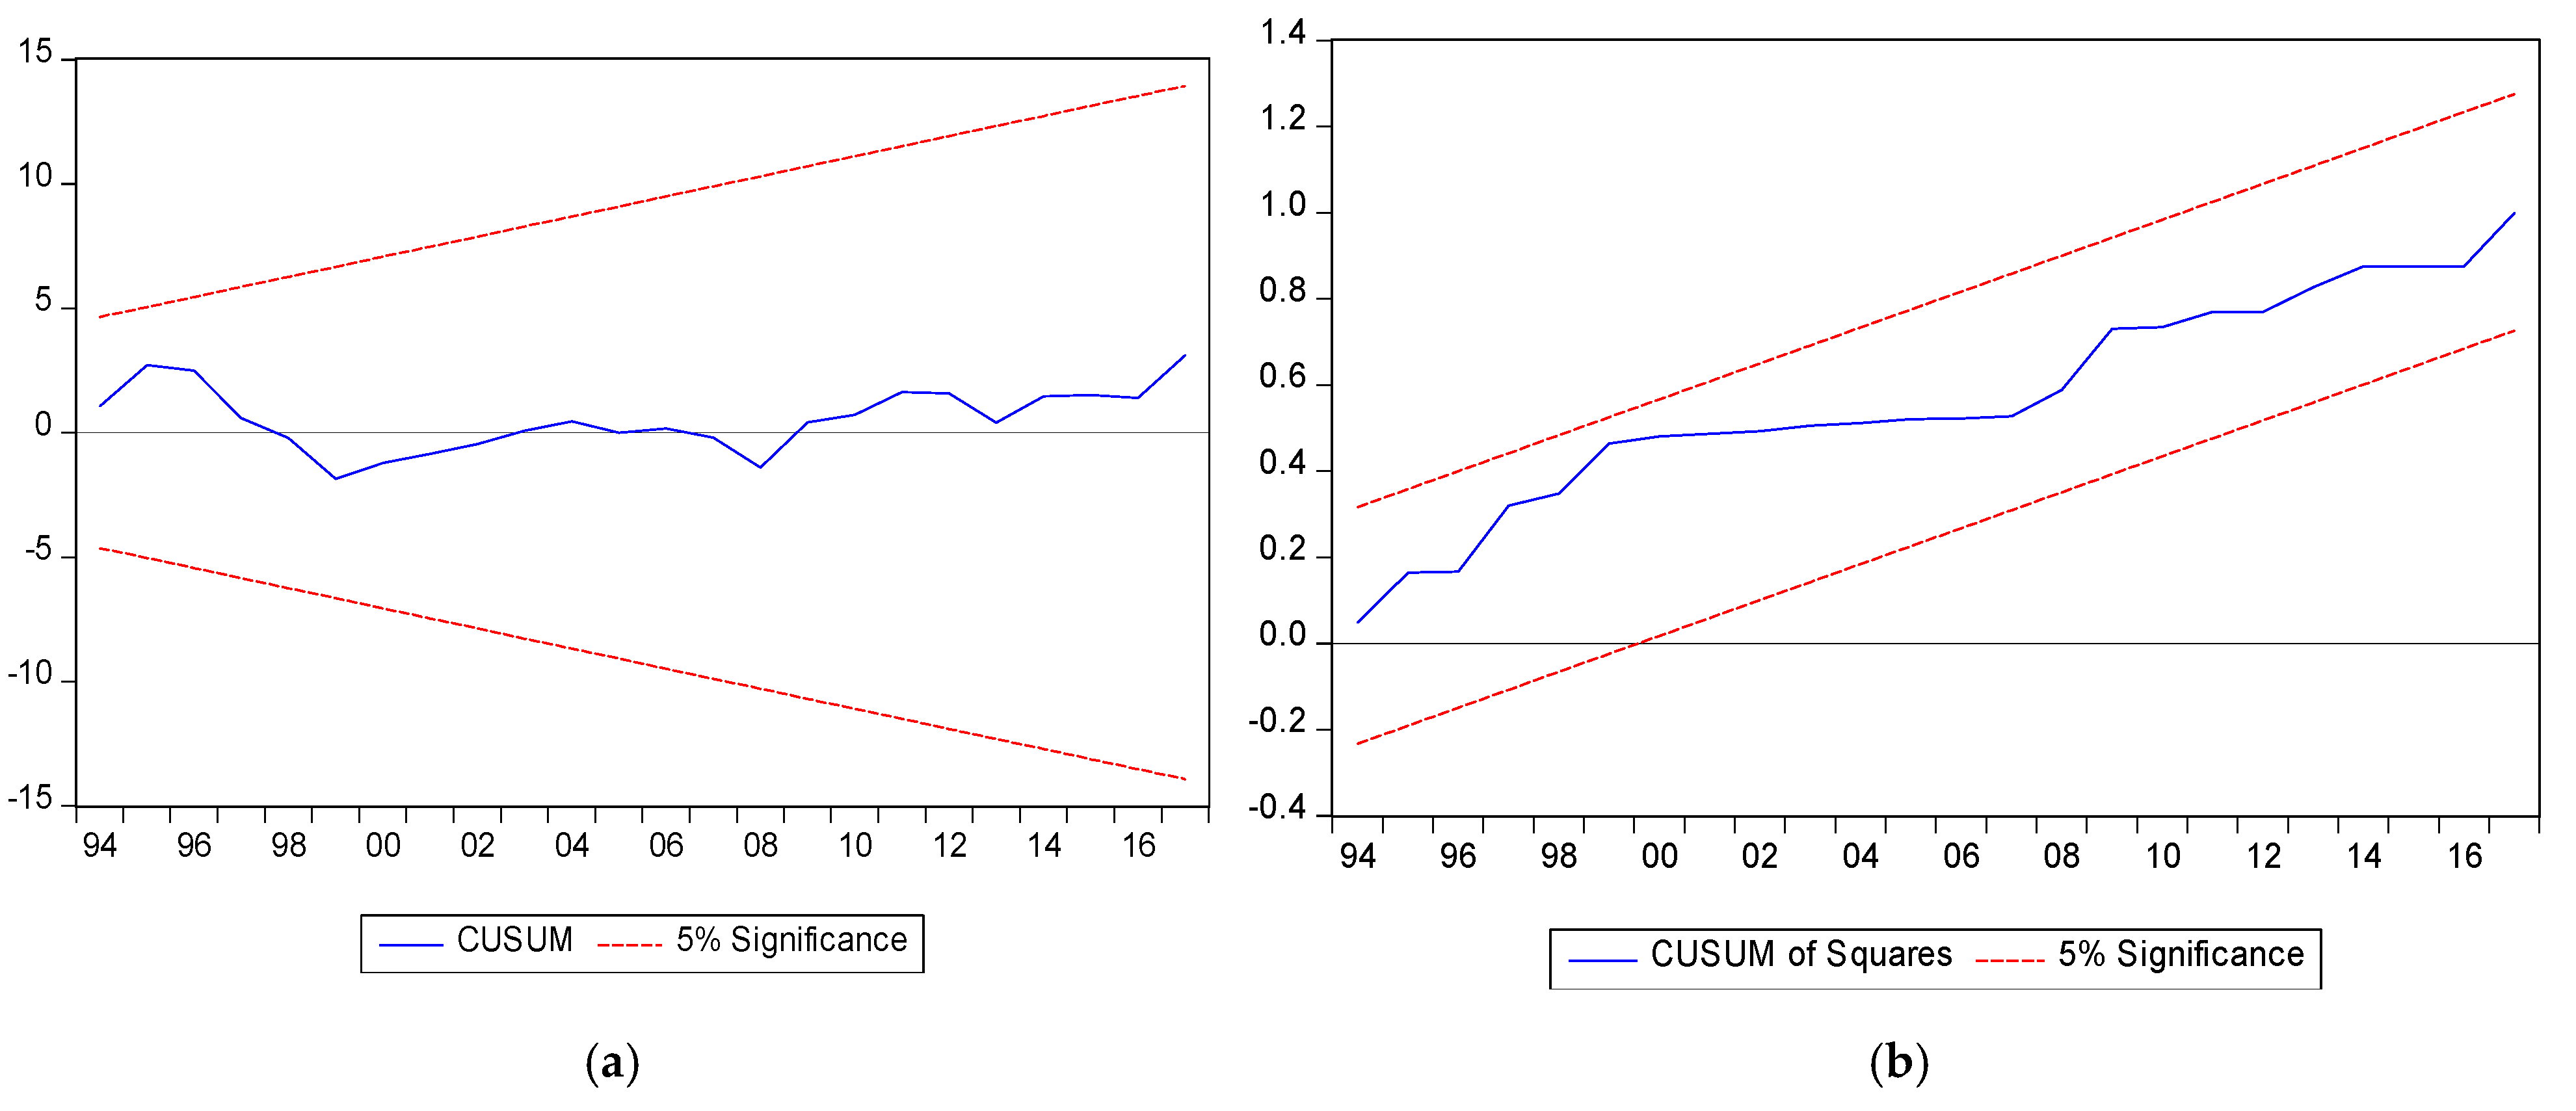
| CUSUM | Stable | |
| CUSUM of squares | Stable | |
| short-run auto-regressive distributed lag (1,2,2,2,2,2) regression | ||
| Variable | efp | rec | nec | bio | gdp | tra | Overall χ2-Statistics |
|---|---|---|---|---|---|---|---|
| efp | ---- (----) | 7.372 *** (0.007) | 16.004 *** (0.000) | 9.999 *** (0.002) | 7.209 *** (0.007) | 4.249 ** (0.039) | 6.168 *** (0.000) |
| rec | 5.675 ** (0.017) | ---- (----) | 2.946 * (0.086) | 5.574 ** (0.018) | 17.197 *** (0.000) | 7.964 *** (0.005) | 20.225 *** (0.001) |
| nec | 27.396 *** (0.000) | 5.071 ** (0.024) | ---- (----) | 7.506 *** (0.006) | 8.377 *** (0.004) | 6.662 *** (0.009) | 28.538 *** (0.000) |
| bio | 0.006 (0.941) | 1.532 (0.216) | 0.038 (0.844) | ---- (----) | 4.364 ** (0.037) | 0.865 (0.352) | 16.045 *** (0.007) |
| gdp | 14.873 *** (0.001) | 15.140 *** (0.000) | 7.179 *** (0.007) | 1.649 (0.199) | ---- (----) | 21.780 *** (0.000) | 24.965 *** (0.000) |
| tra | 0.122 (0.792) | 0.991 (3.319) | 2.265 (0.132) | 0.029 (0.863) | 10.445 *** (0.001) | ---- (----) | 31.785 *** (0.000) |
Publisher’s Note: MDPI stays neutral with regard to jurisdictional claims in published maps and institutional affiliations. |
© 2022 by the author. Licensee MDPI, Basel, Switzerland. This article is an open access article distributed under the terms and conditions of the Creative Commons Attribution (CC BY) license (https://creativecommons.org/licenses/by/4.0/).
Share and Cite
He, Y. Renewable and Non-Renewable Energy Consumption and Trade Policy: Do They Matter for Environmental Sustainability? Energies 2022, 15, 3559. https://doi.org/10.3390/en15103559
He Y. Renewable and Non-Renewable Energy Consumption and Trade Policy: Do They Matter for Environmental Sustainability? Energies. 2022; 15(10):3559. https://doi.org/10.3390/en15103559
Chicago/Turabian StyleHe, Yugang. 2022. "Renewable and Non-Renewable Energy Consumption and Trade Policy: Do They Matter for Environmental Sustainability?" Energies 15, no. 10: 3559. https://doi.org/10.3390/en15103559
APA StyleHe, Y. (2022). Renewable and Non-Renewable Energy Consumption and Trade Policy: Do They Matter for Environmental Sustainability? Energies, 15(10), 3559. https://doi.org/10.3390/en15103559