
Prony Method Estimation for Motor Current Signal Analysis Diagnostics in Rotor Cage Induction Motors

 ,
,  ,
,
Abstract
: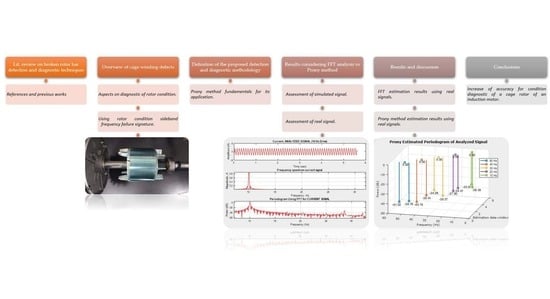
1. Introduction
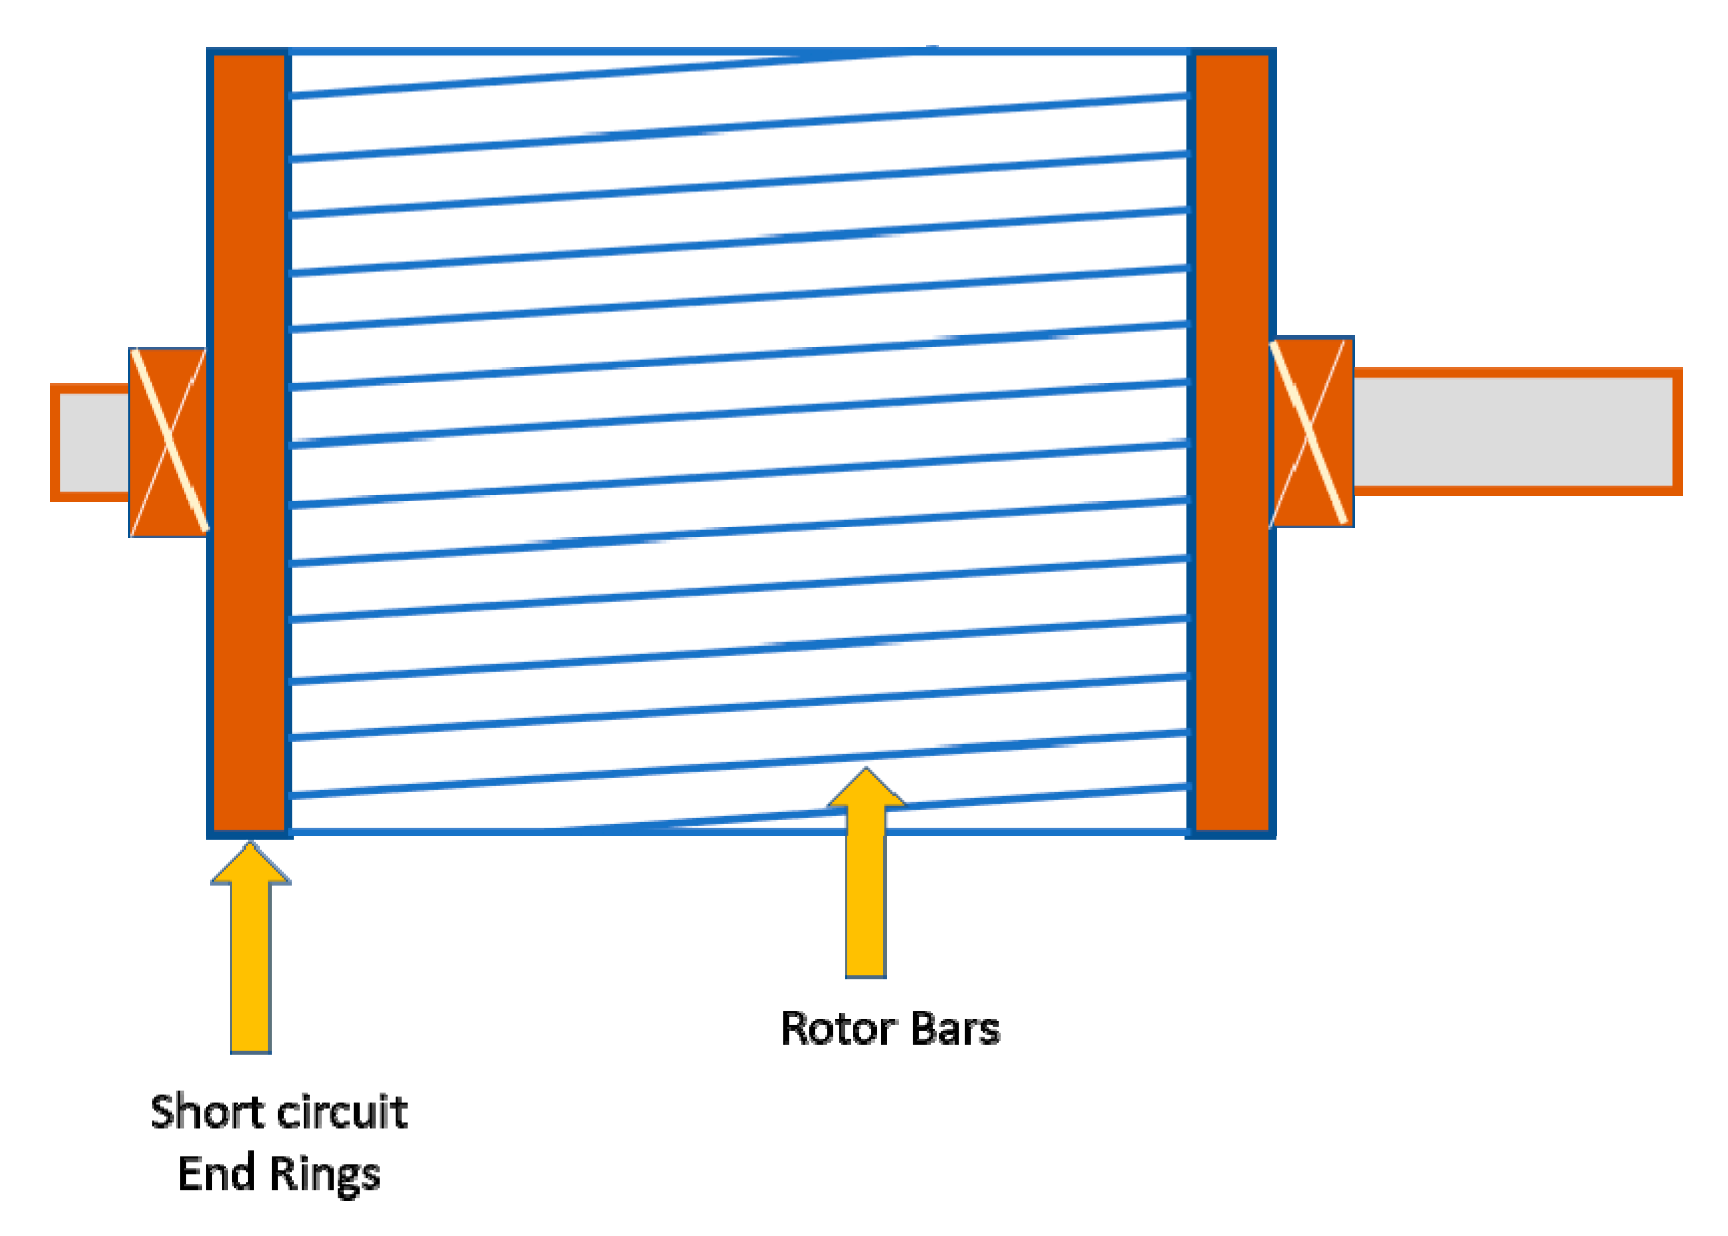
2. Overview of Diagnostics on Cage Winding Defects
3. Prony Method Estimation for Motor Current Signal Analysis
- (1)
- Know the sampling frequency (fs), sampling time (Ts), length of the current signal under analysis (L) with a minimum of 25 cycles of data and the order (p) of the linear prediction model (LPM), where an initial value of p for a data window of current signal measurement for analysis must be selected.
- (2)
- A Toeplitz matrix “” with the data of the current signal “y(t)” must be defined as (4).
- (3)
- A vector “” (coefficients of characteristic Equation (3)) using (4) is calculated in (5).
- (4)
- Calculate the roots from vector “” and the resulting roots vector “” will be used in (6) and (7) to calculate dampingand frequency
- (5)
- Obtain Vandermonde matrix “Z” of vector “” using (8).
- (6)
- Obtain vector “h” in (9) using vandermonde matrix “Z” and vector “” from (8).
- (7)
- The resulting vector “h” obtained in (9) will be used in (10) and (11) to calculate amplitude and phase angle.
- (8)
- The order for good estimation results is obtained evaluating the mean square error (MSE) of the full signal data p = 1, 2,…, Ns, where Ns is the total data samples of the selected data signal for analysis. The MSE for each value of p in (12) needs to be calculated, where MSE is obtained by using the reconstructed signal with the estimated parameters “” and the real signal “”, so the MSE of lesser magnitude is selected for the corresponding p value is the optimum estimate of the model signal parameters.
4. Study Case for Motor Current Signal Analysis Using Prony Method Estimation
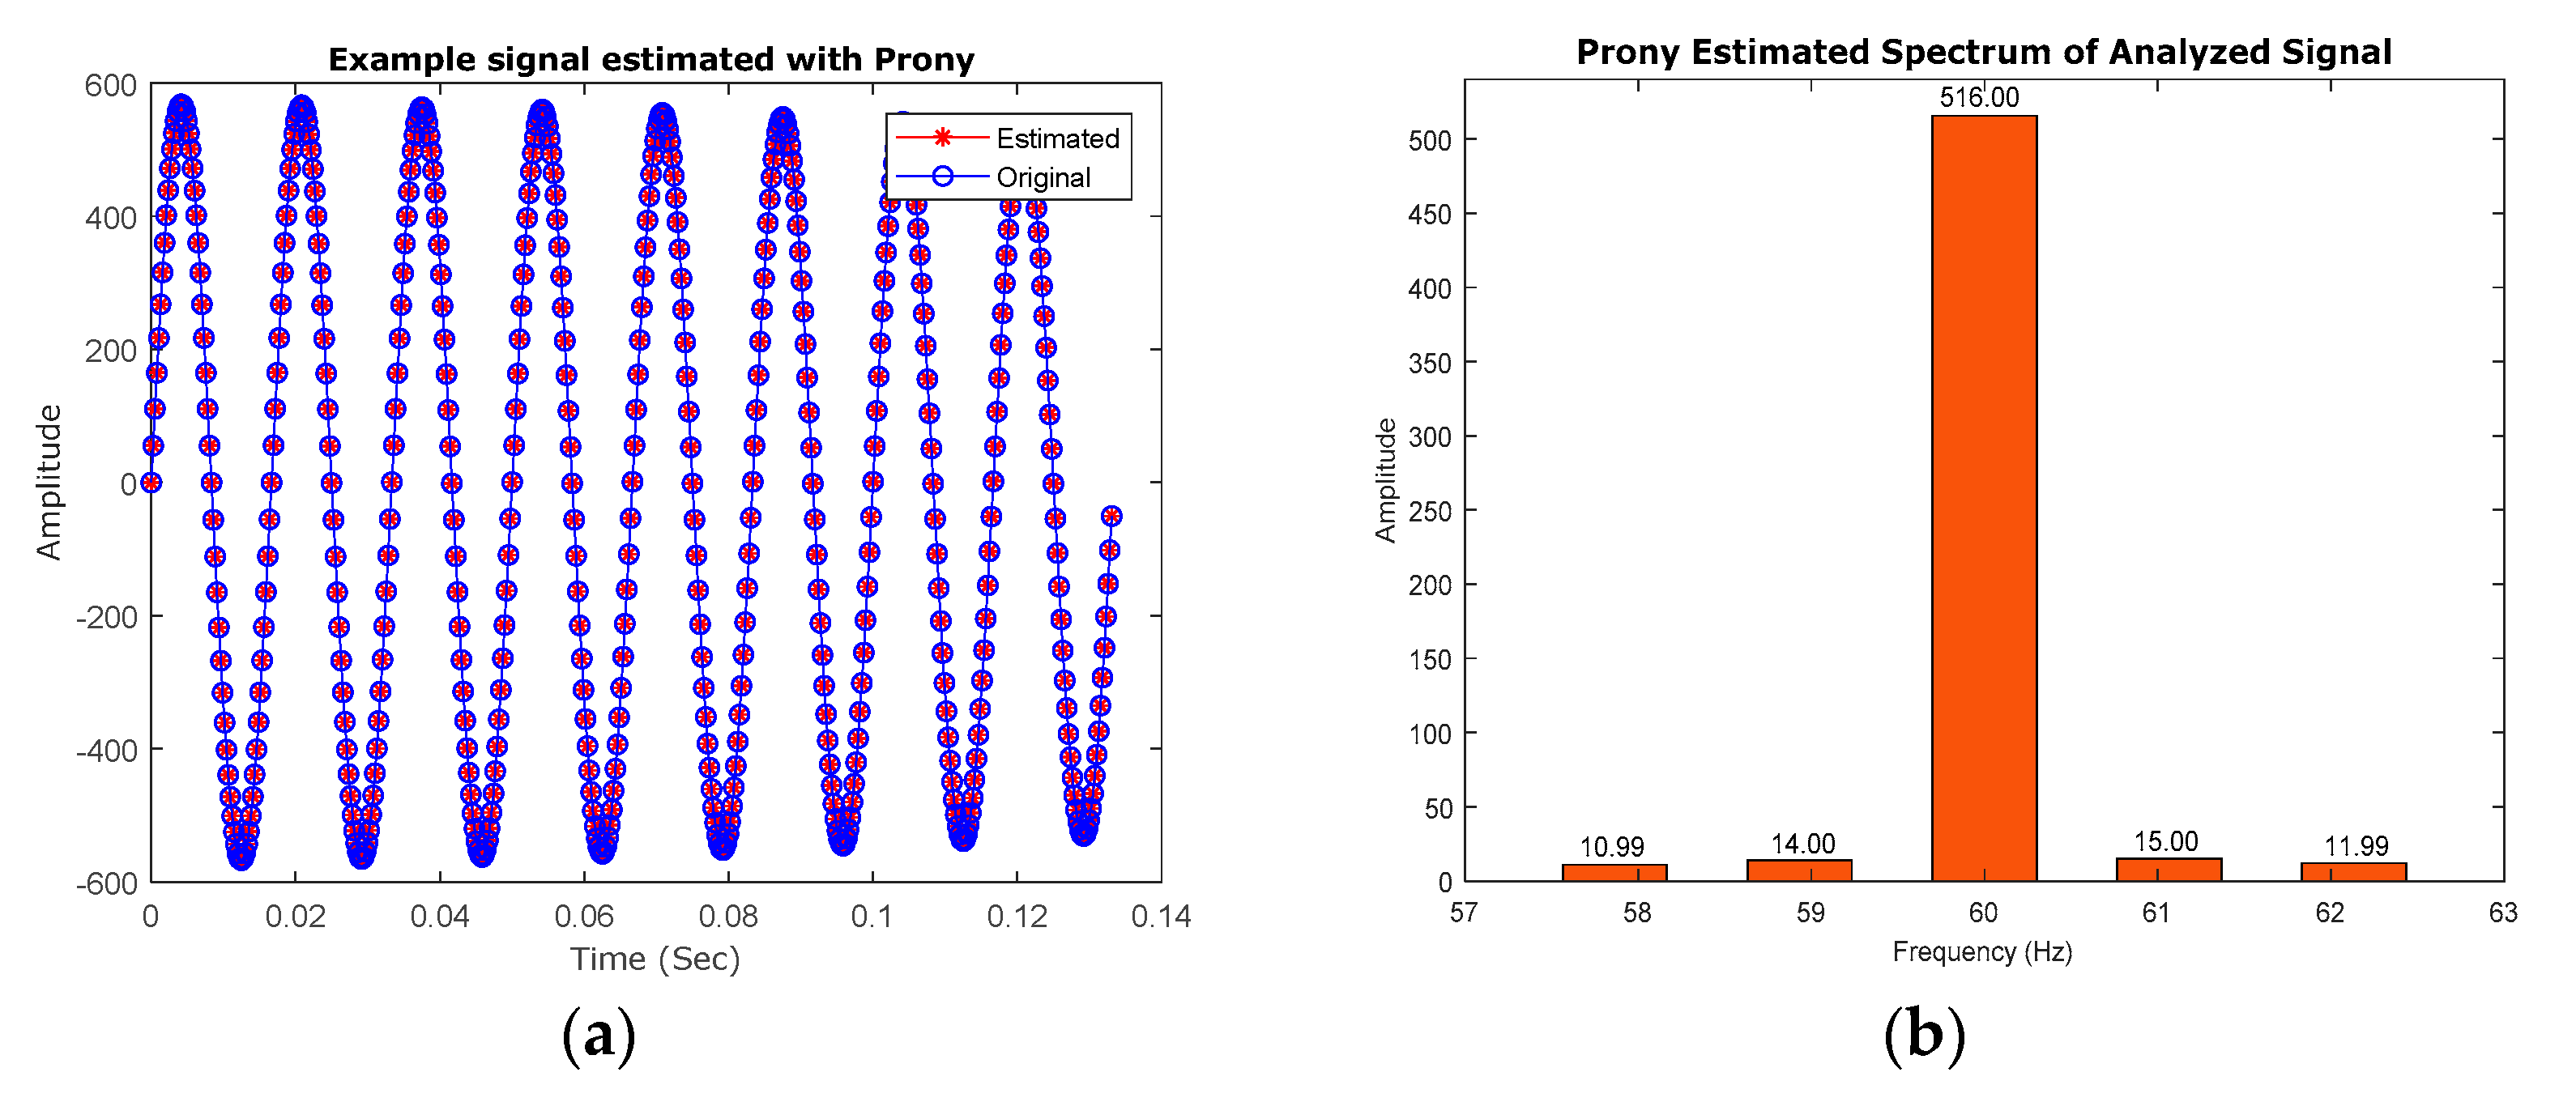
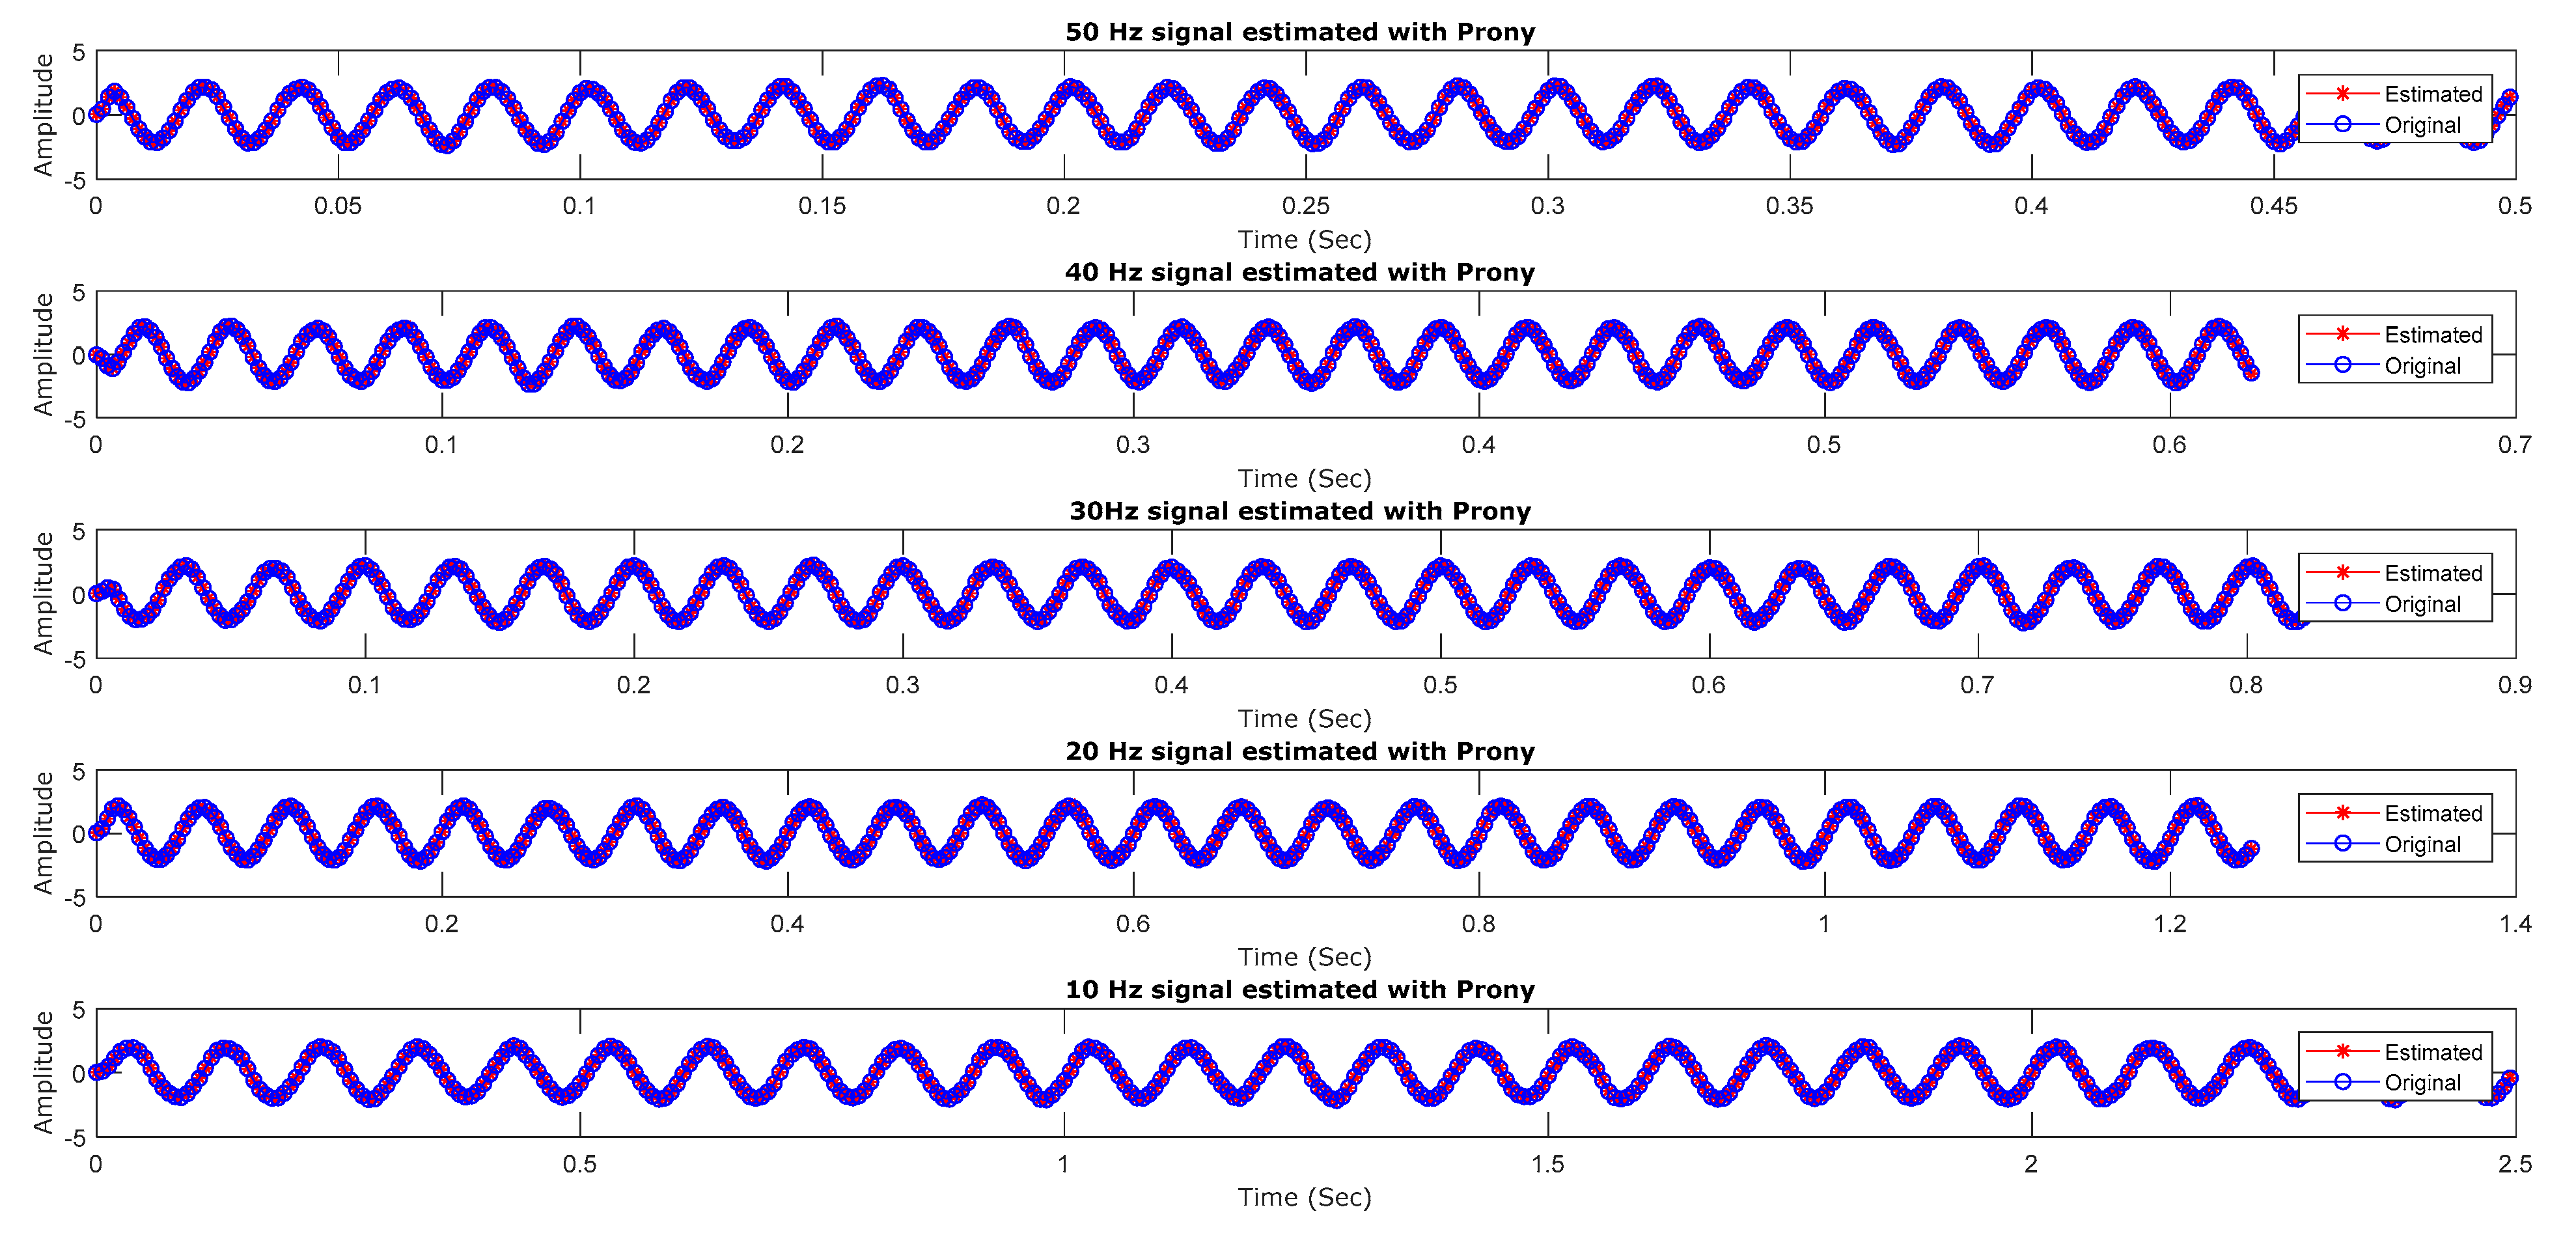
4.1. Assessment of Numerical Simulation of Broken Rotor Bar Current Signal
Prony Estimation Results
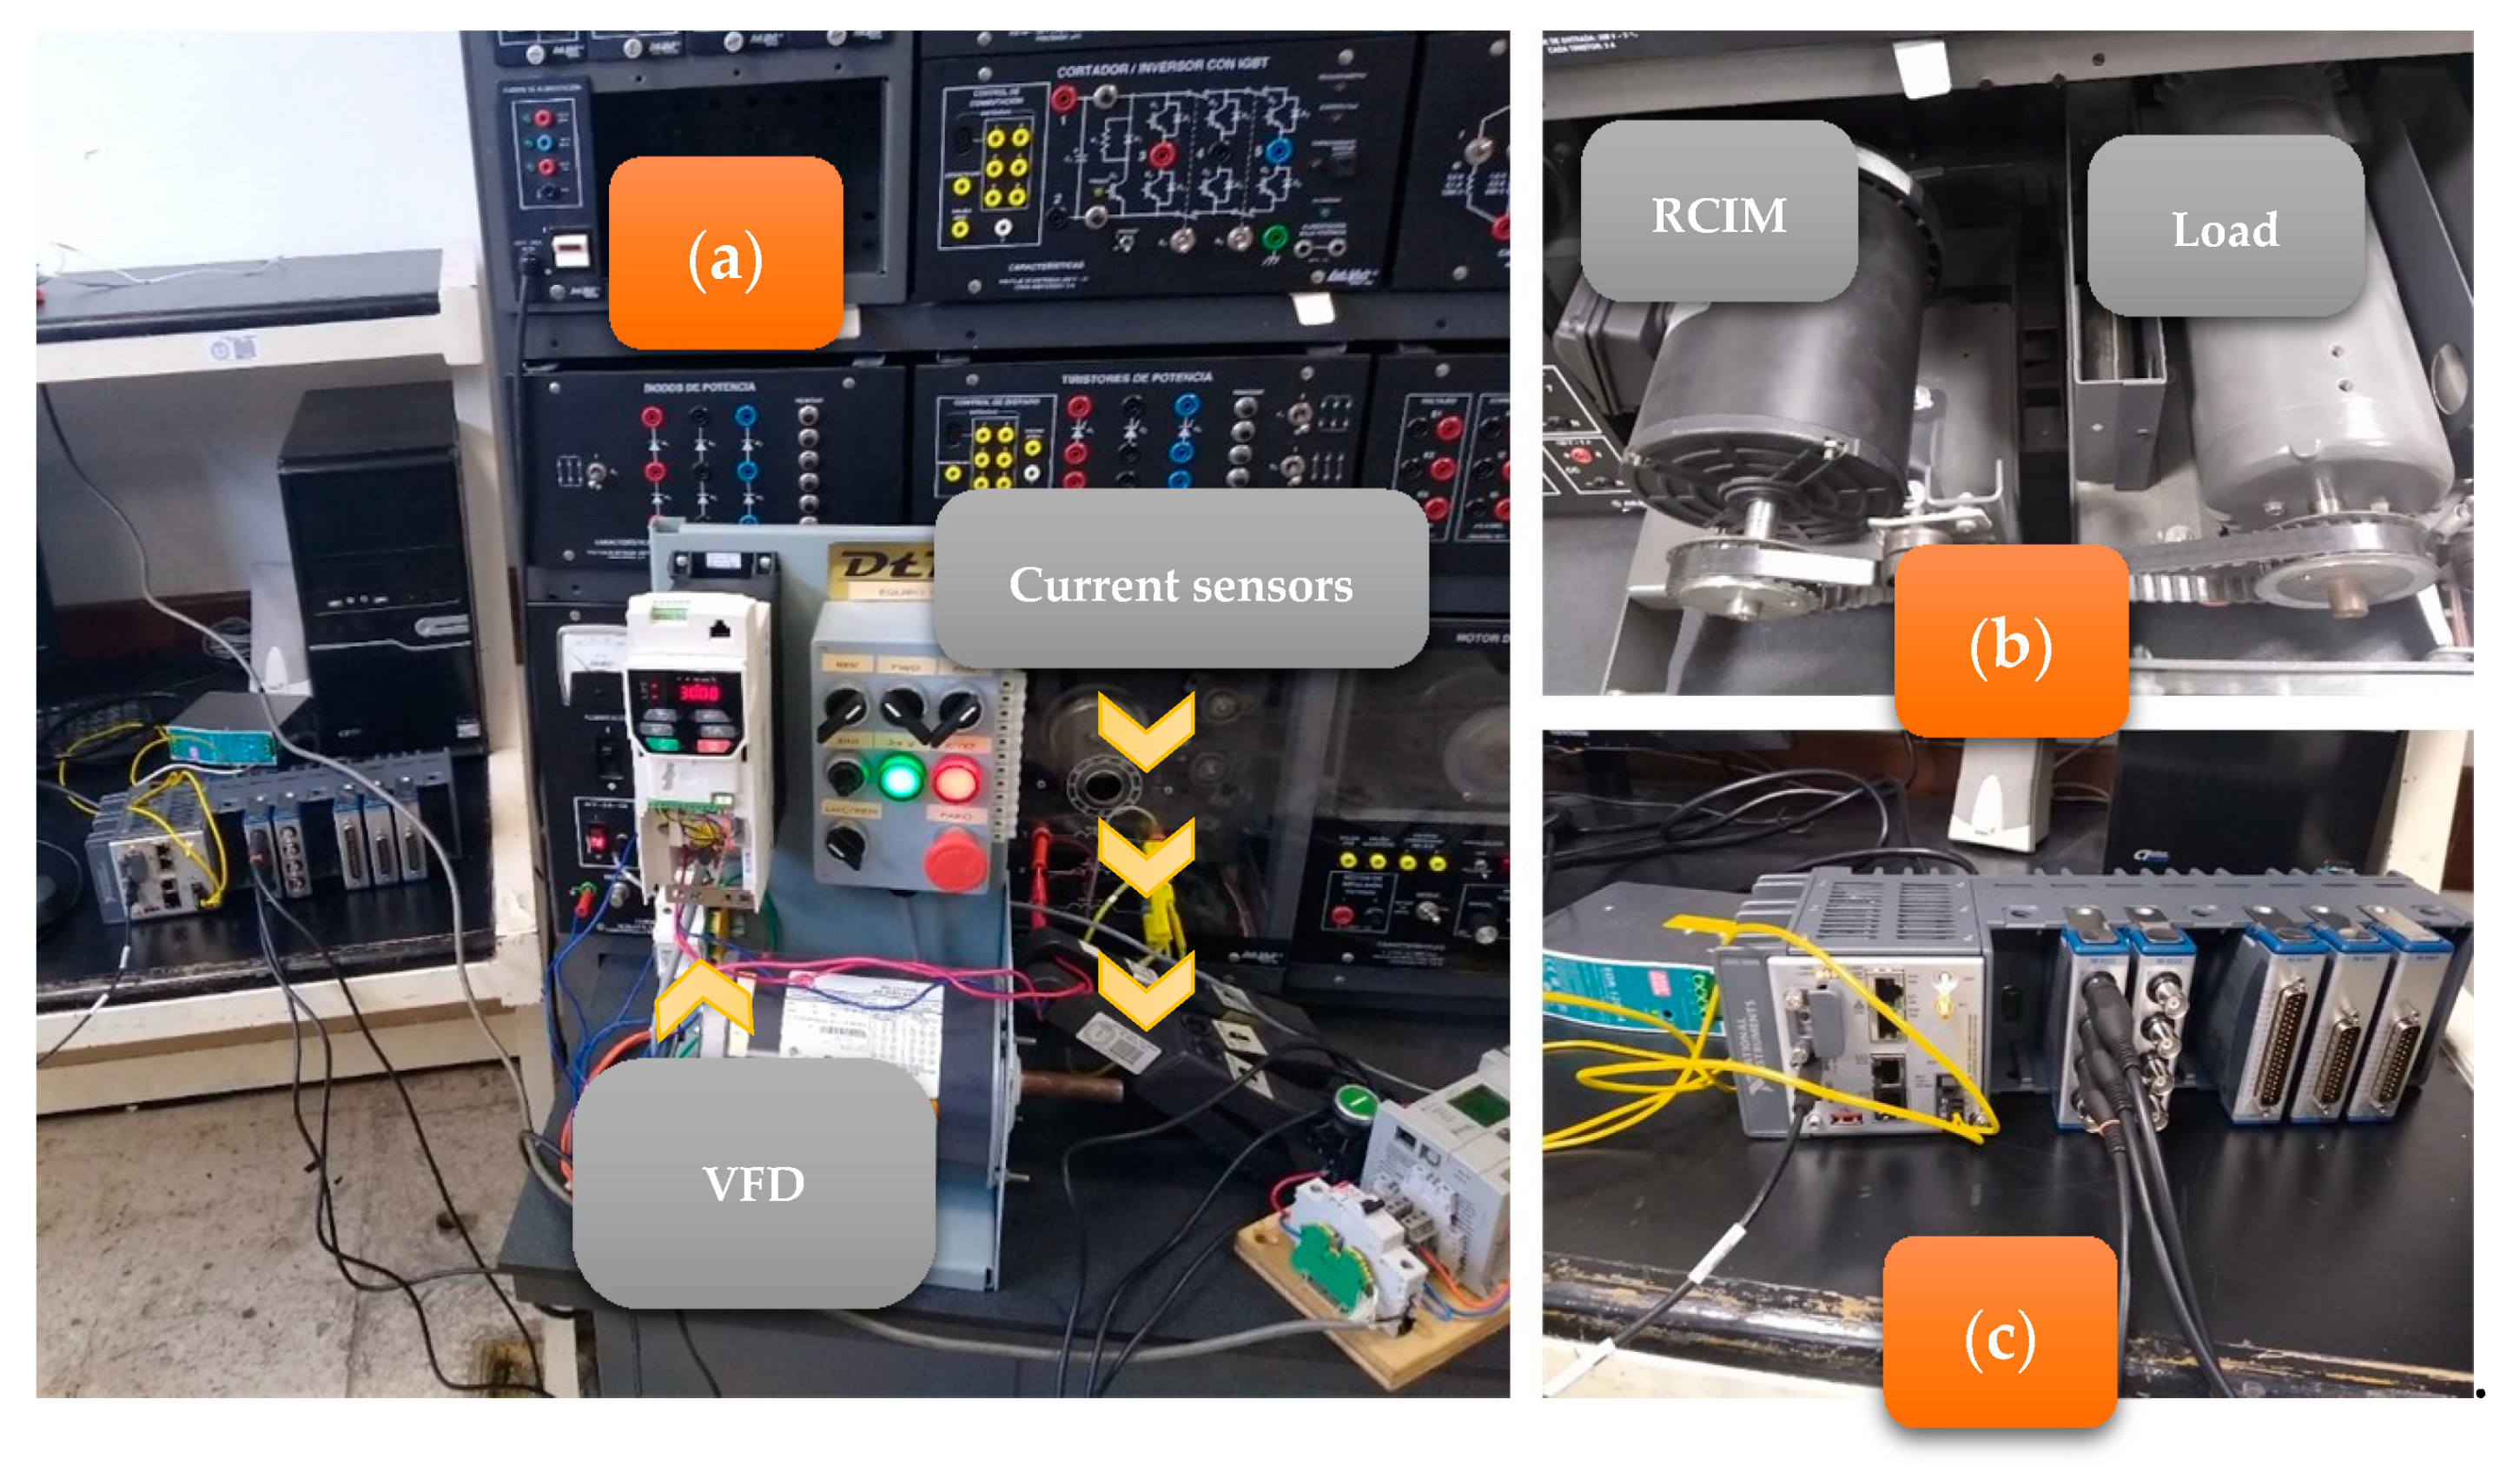
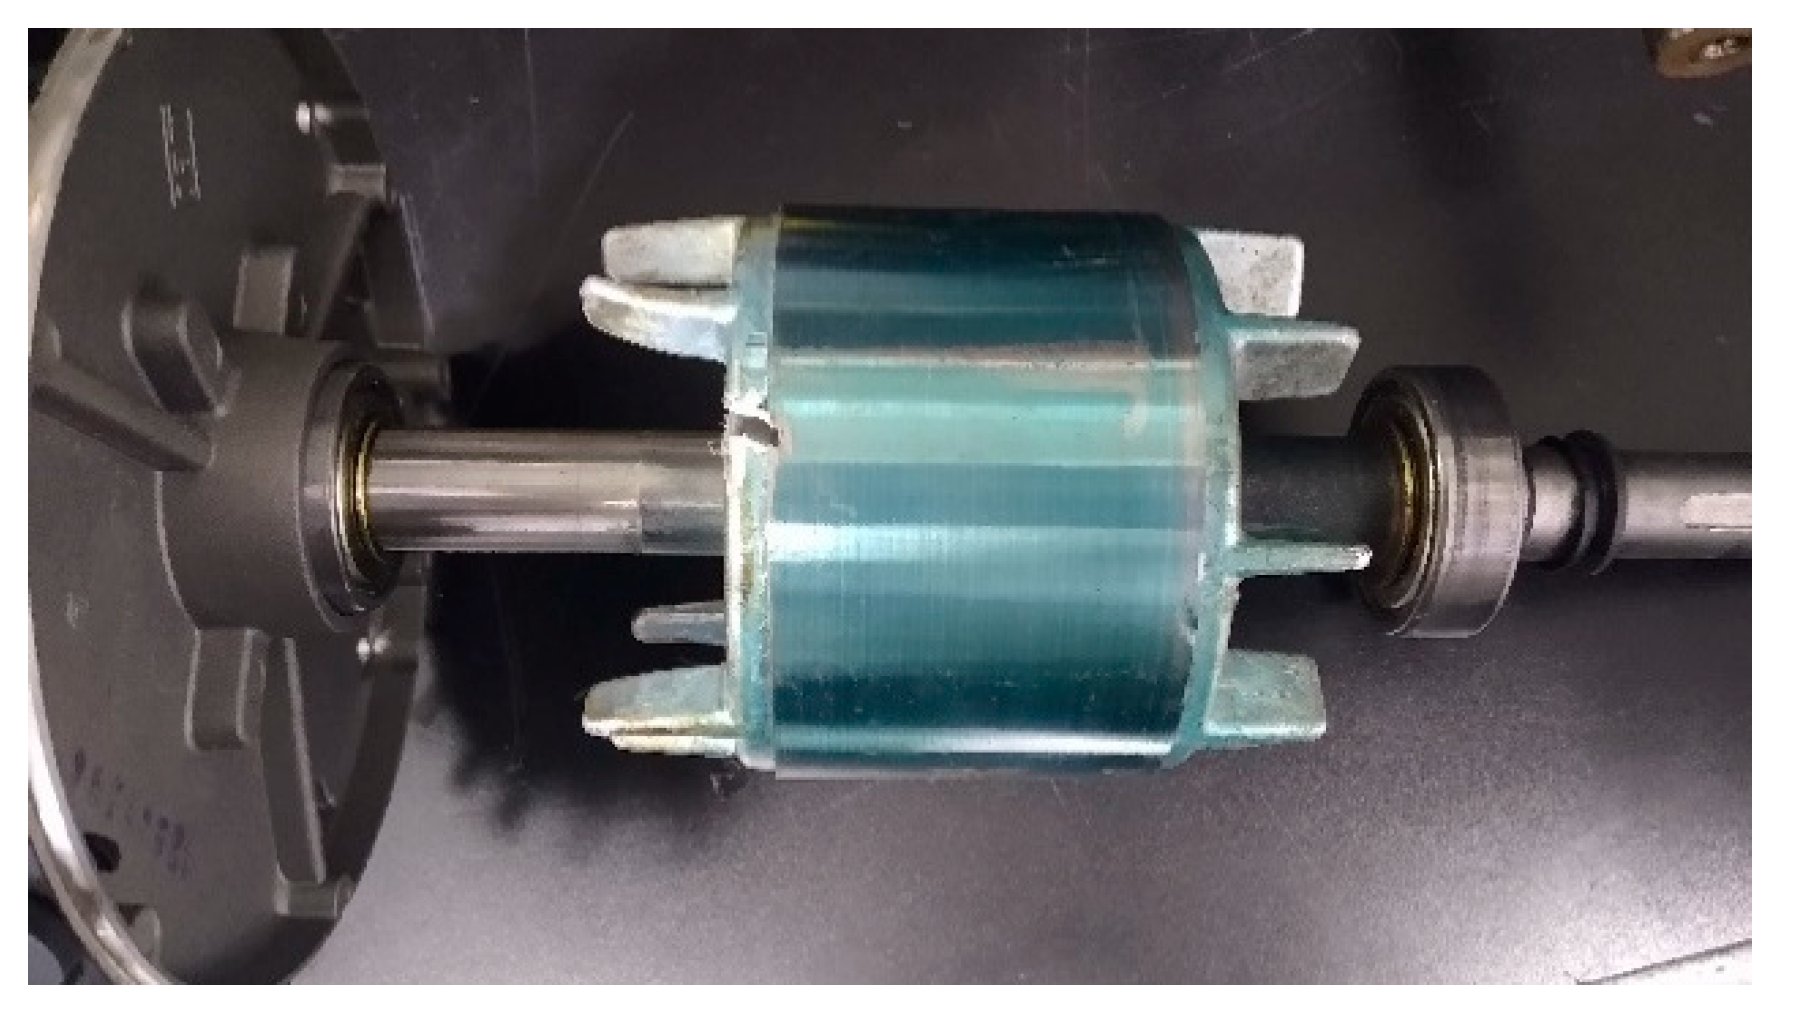
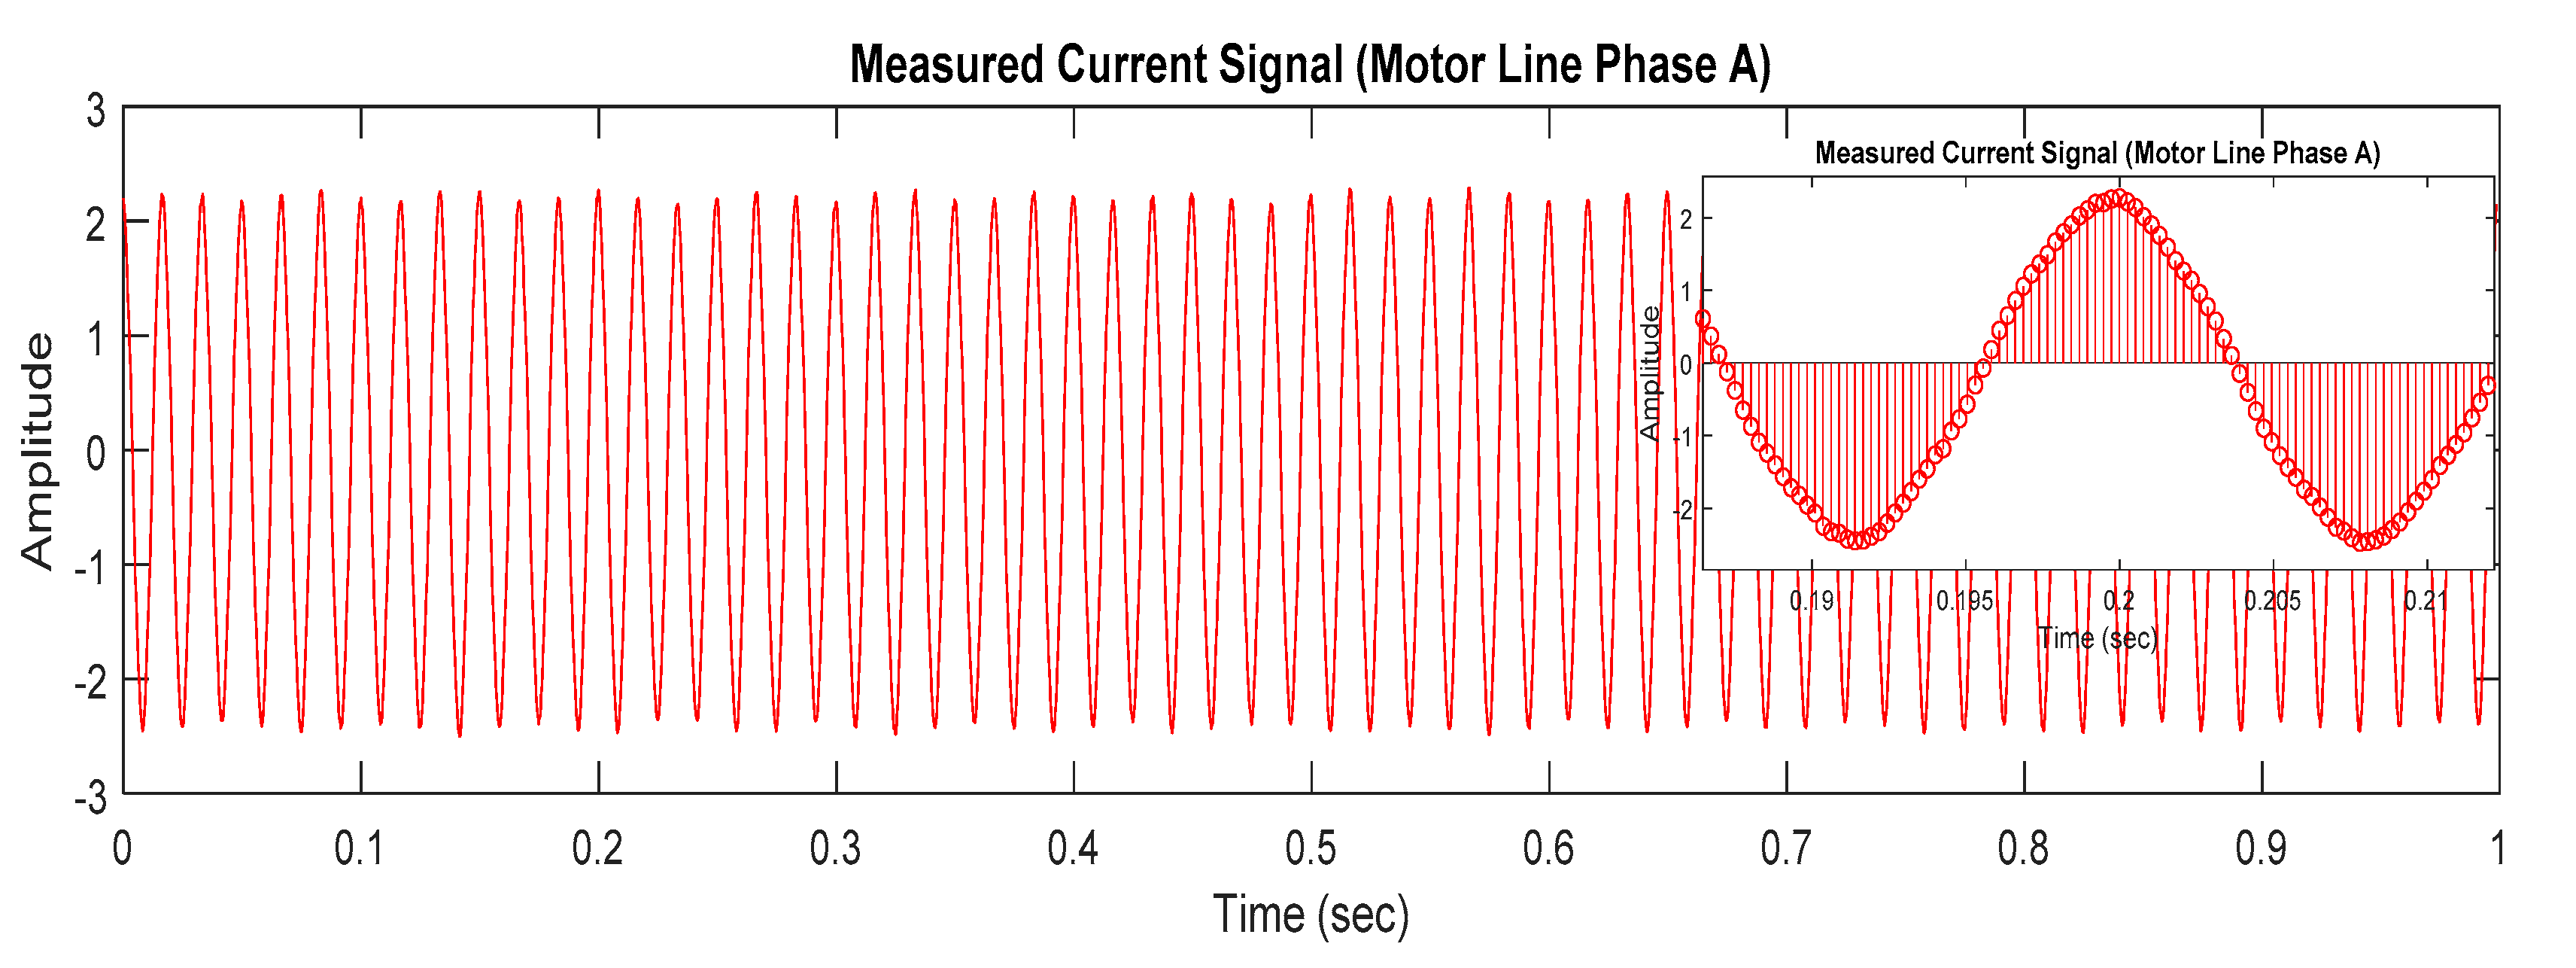
4.2. Assessment of Real Broken Rotor Bar Current Signal from a Laboratory Test System
4.2.1. Laboratory Test System
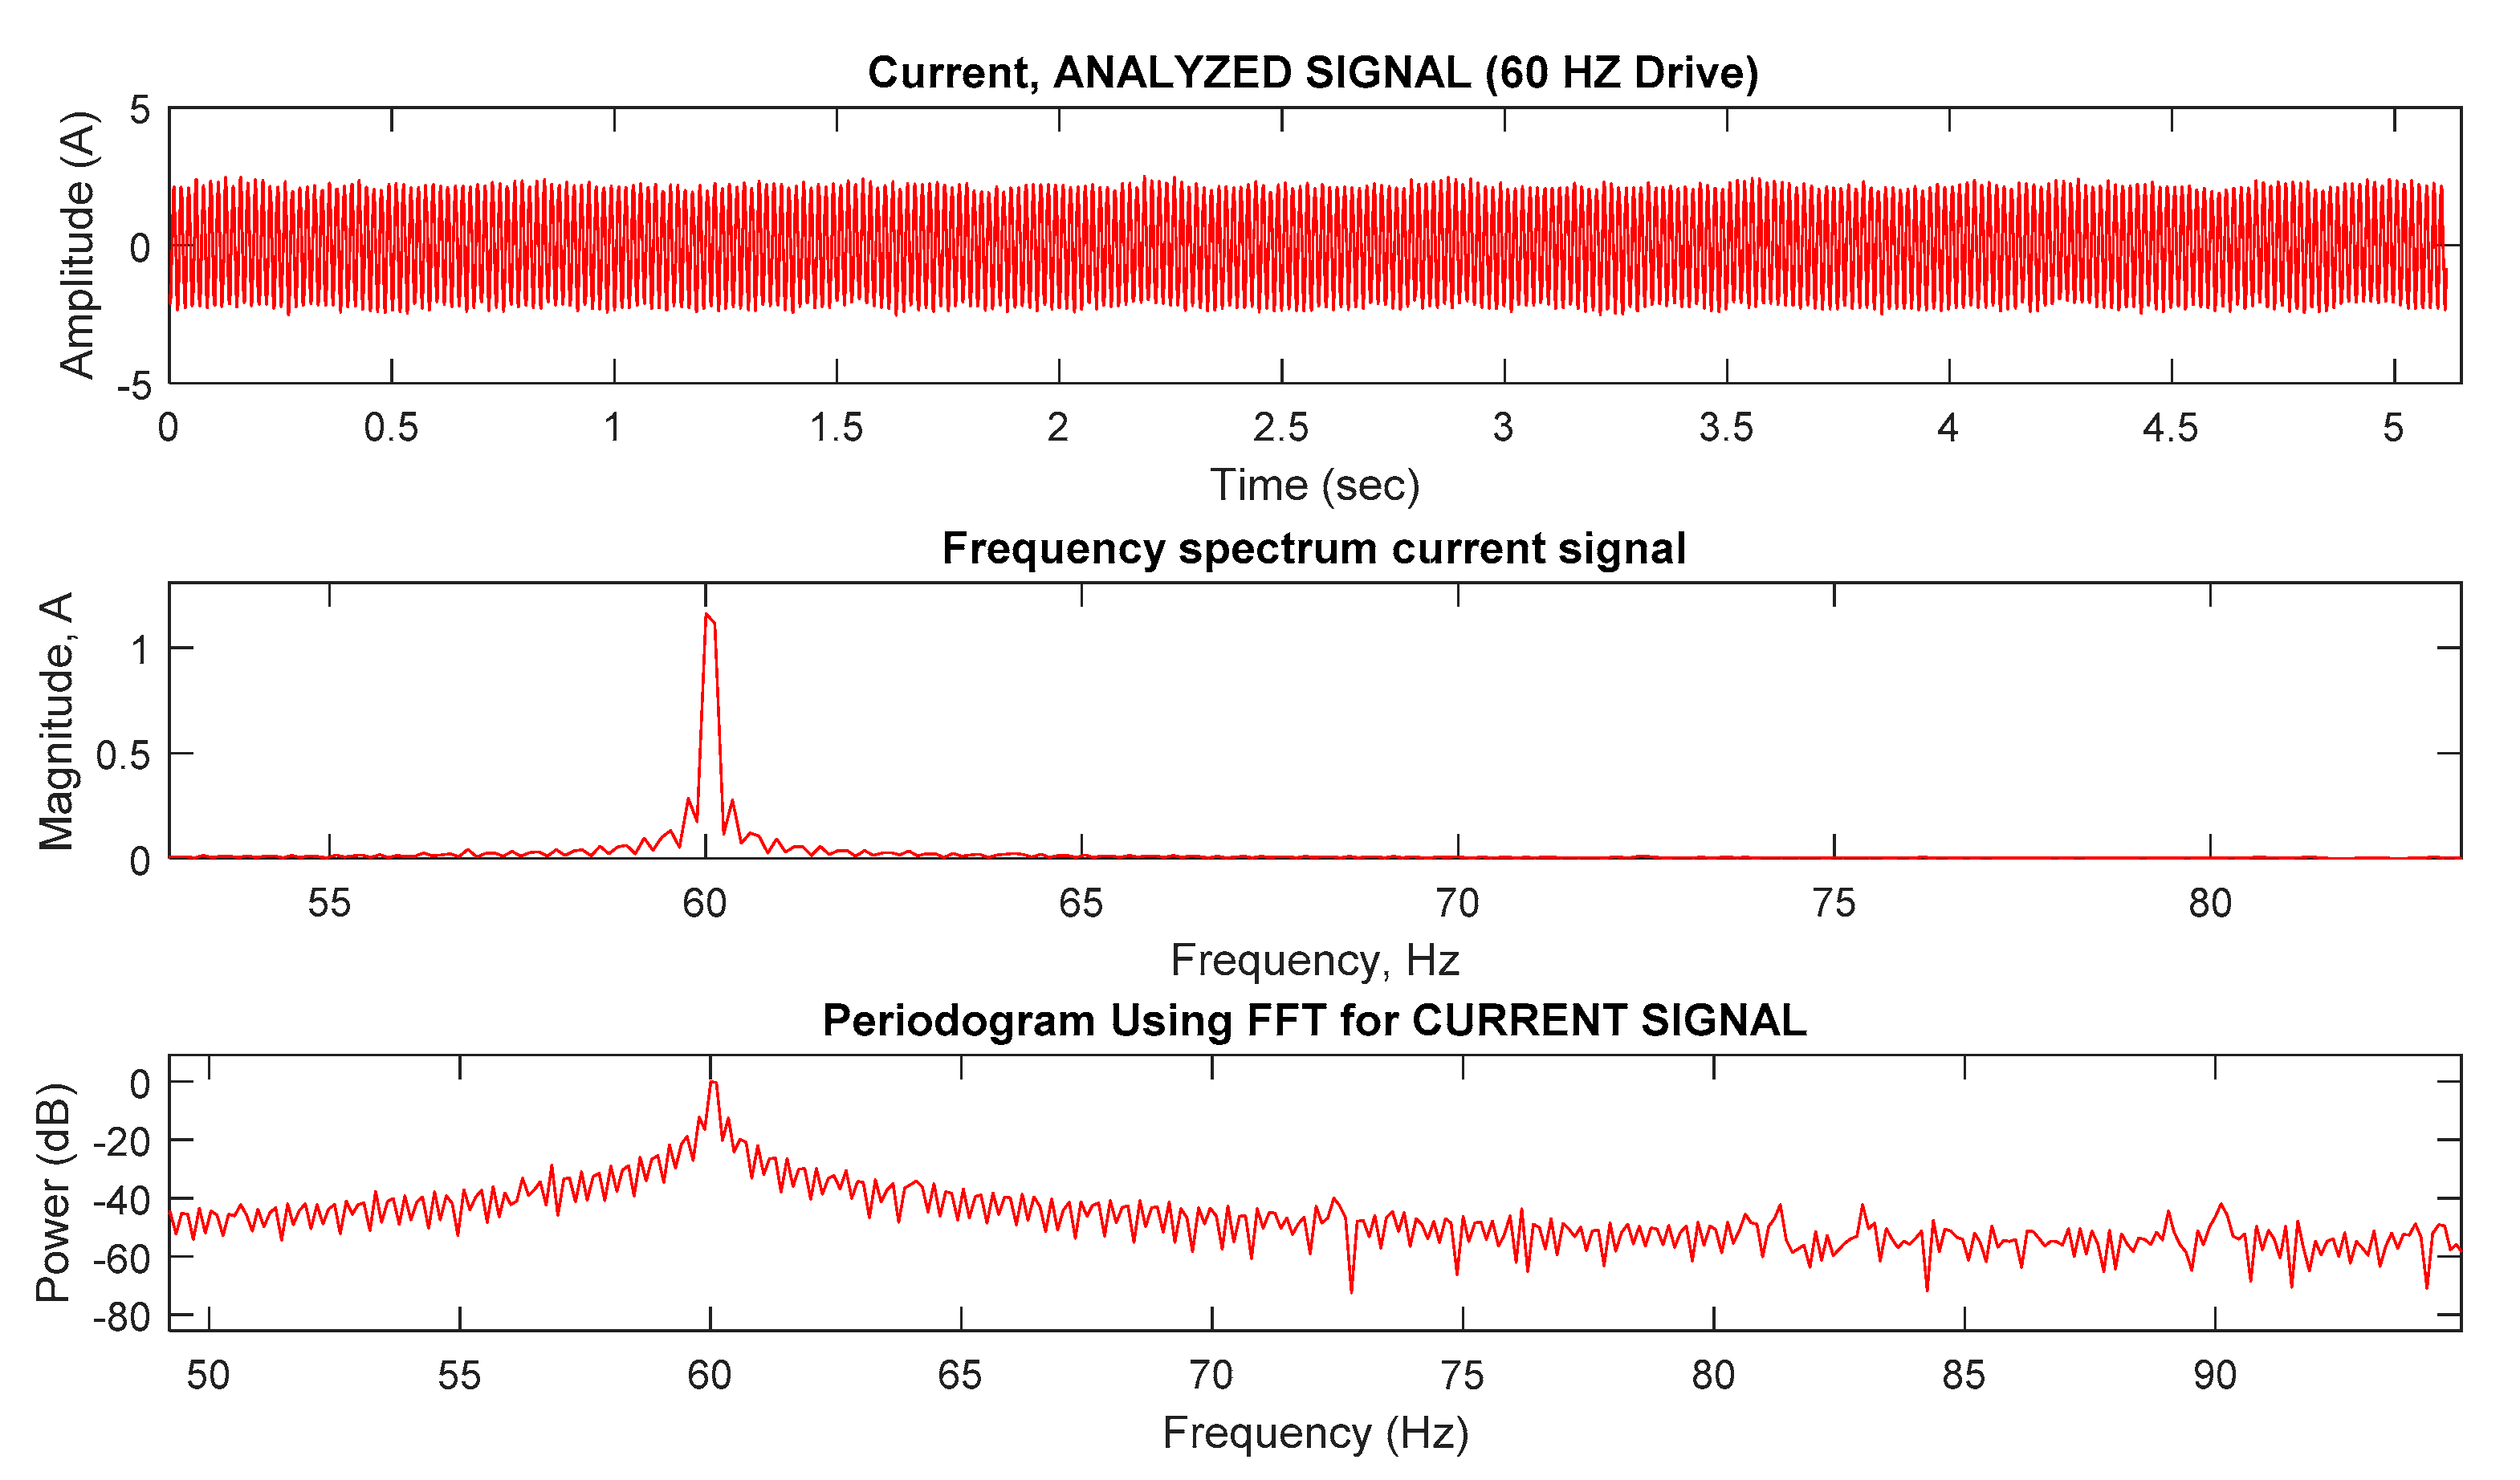
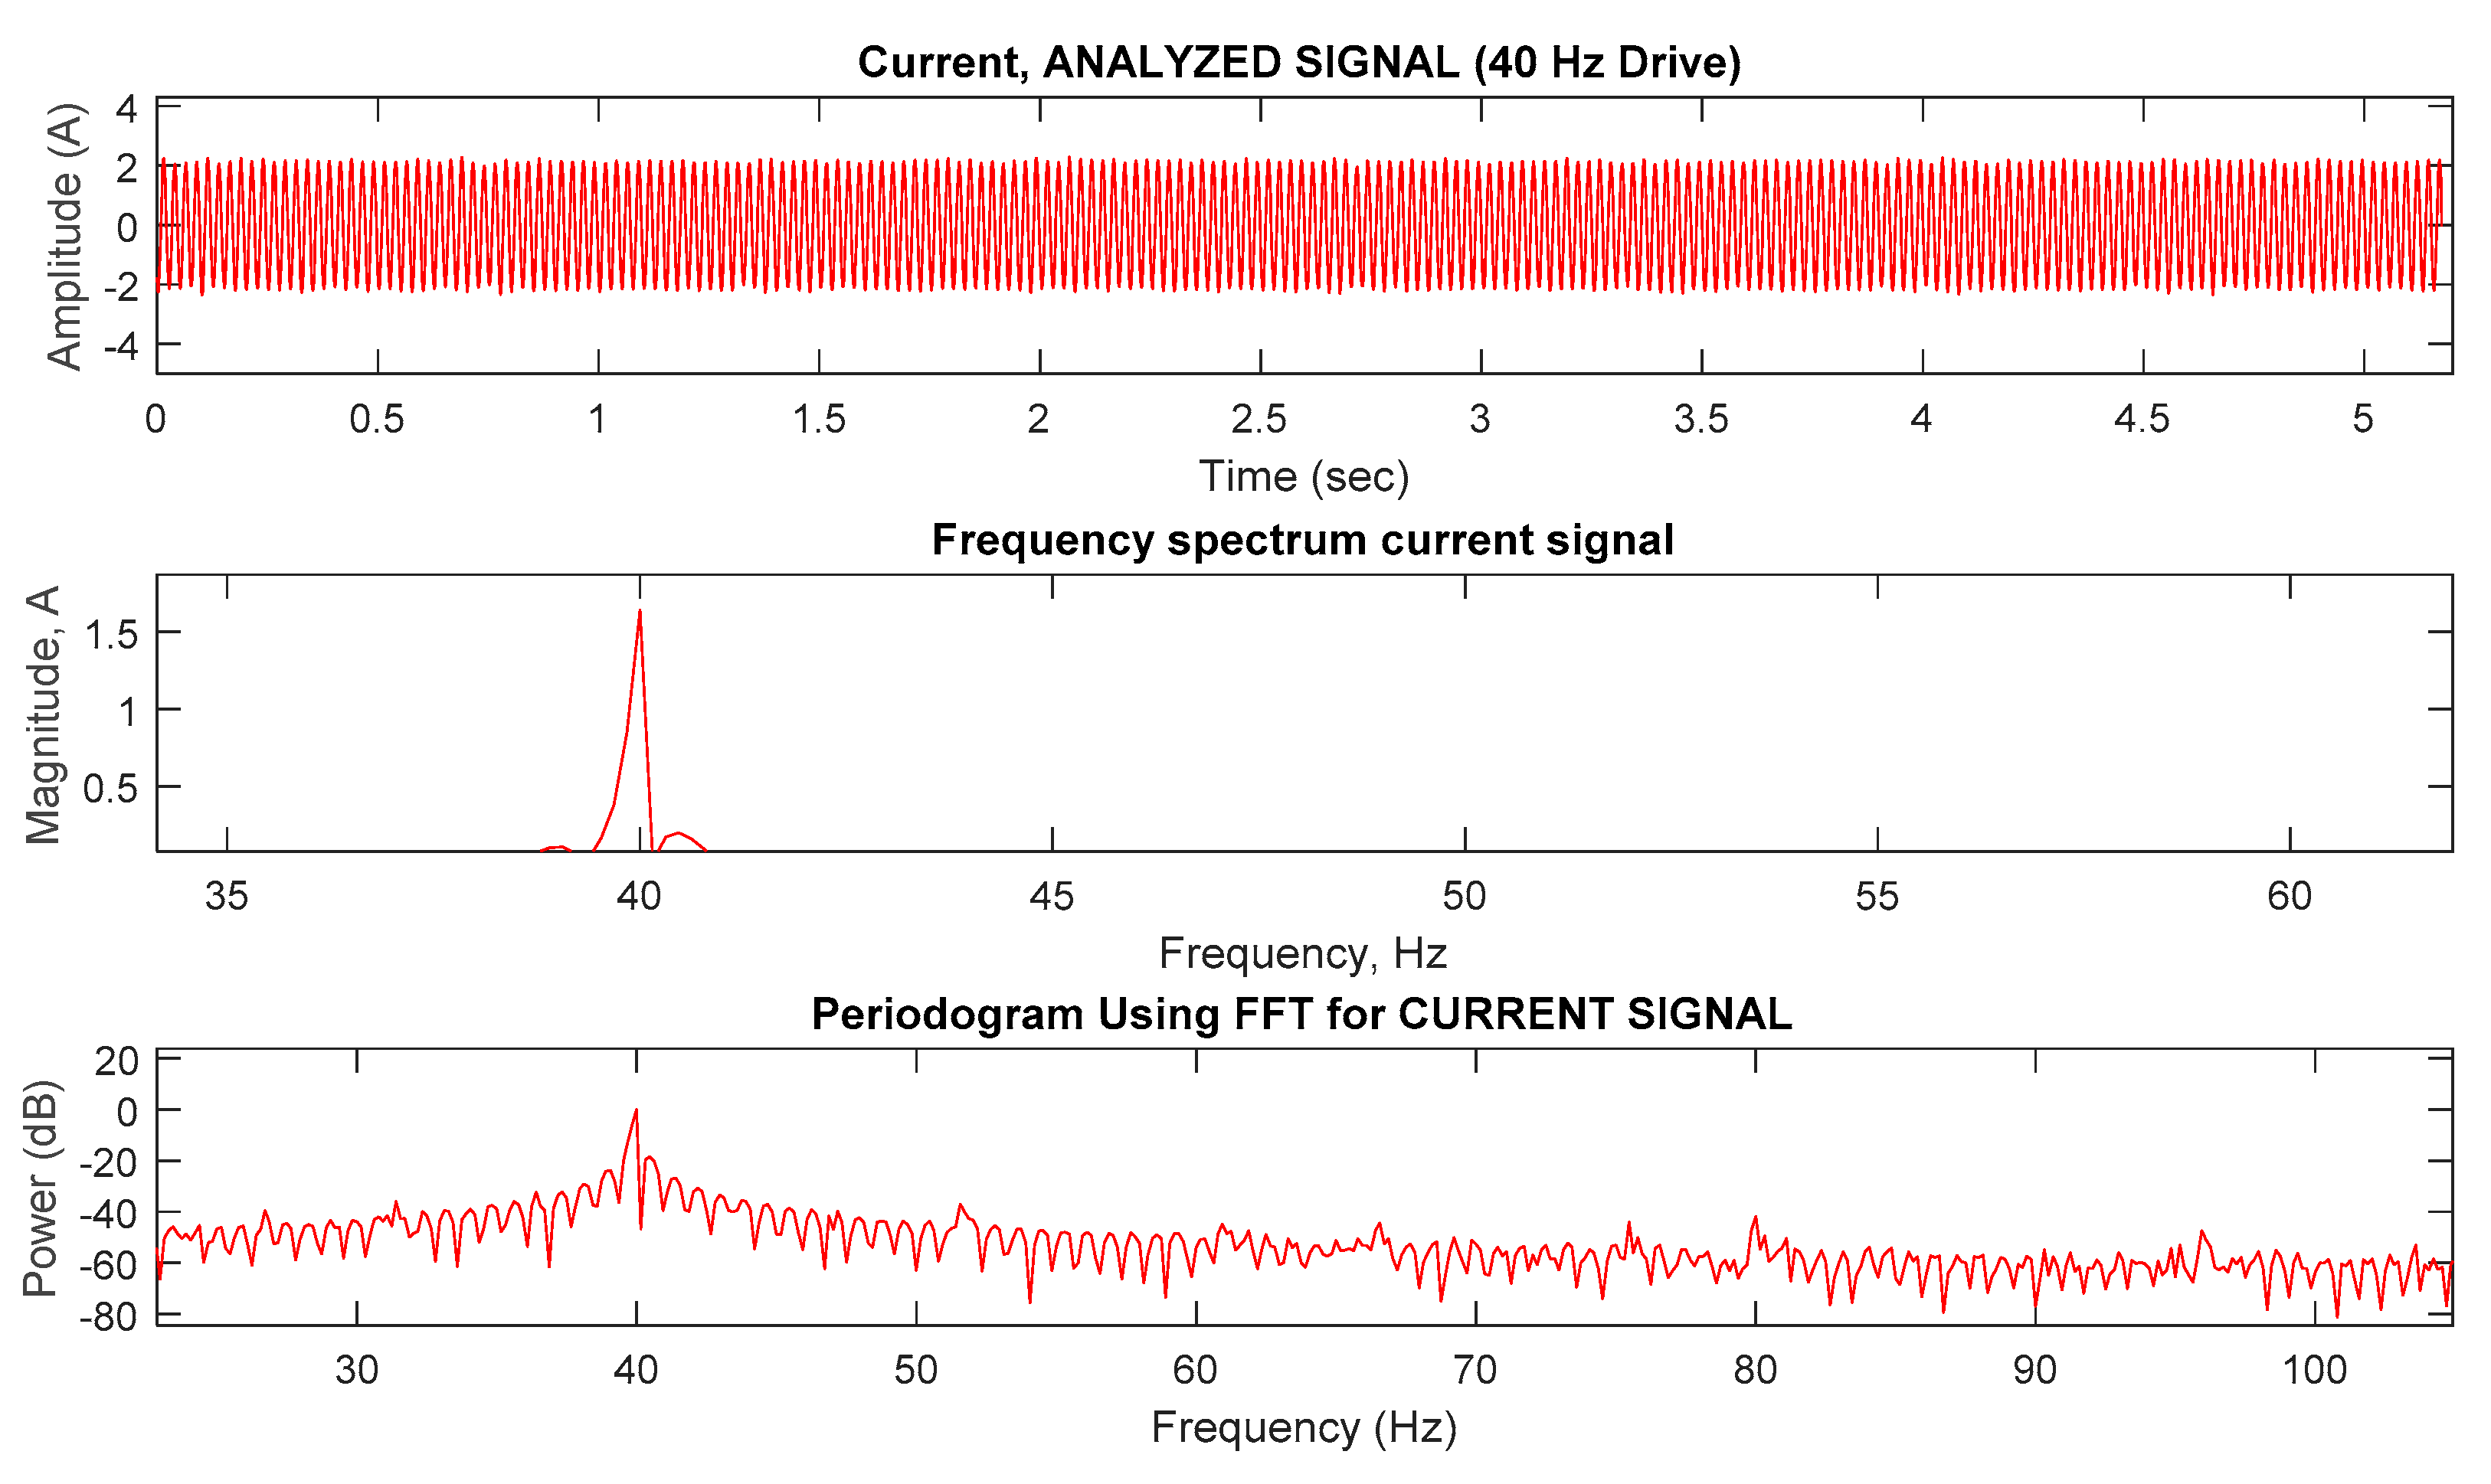
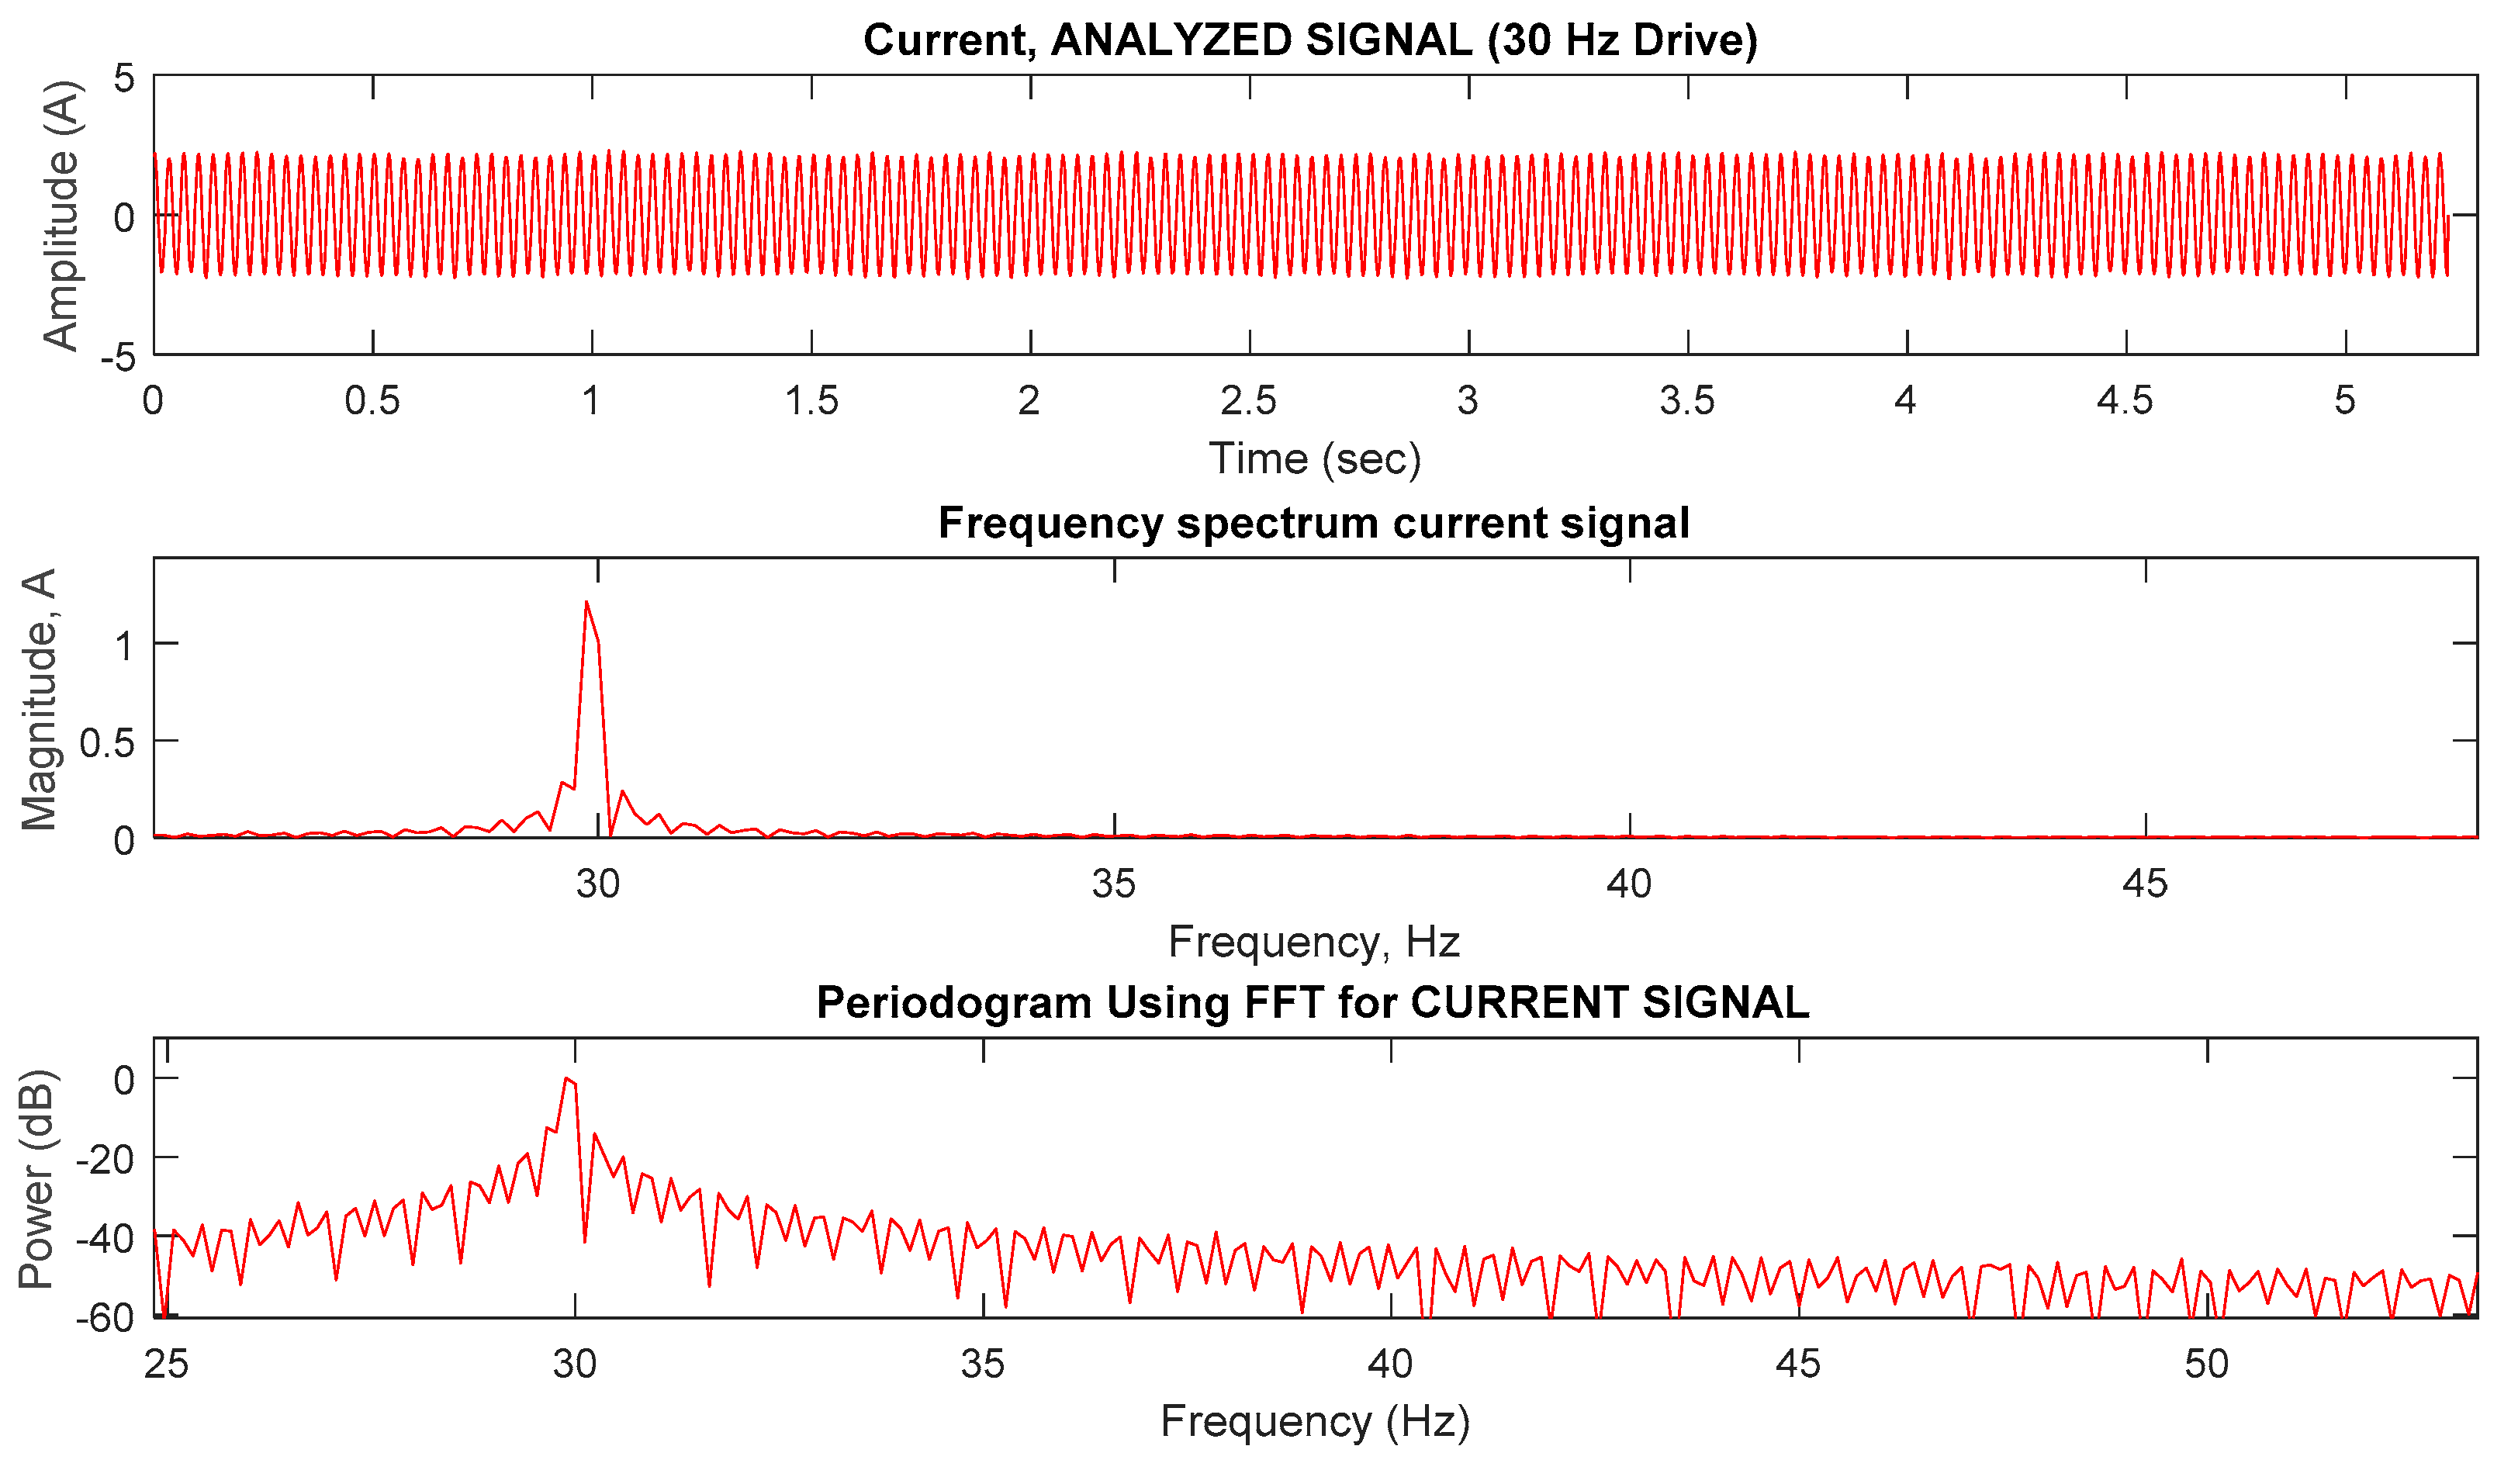
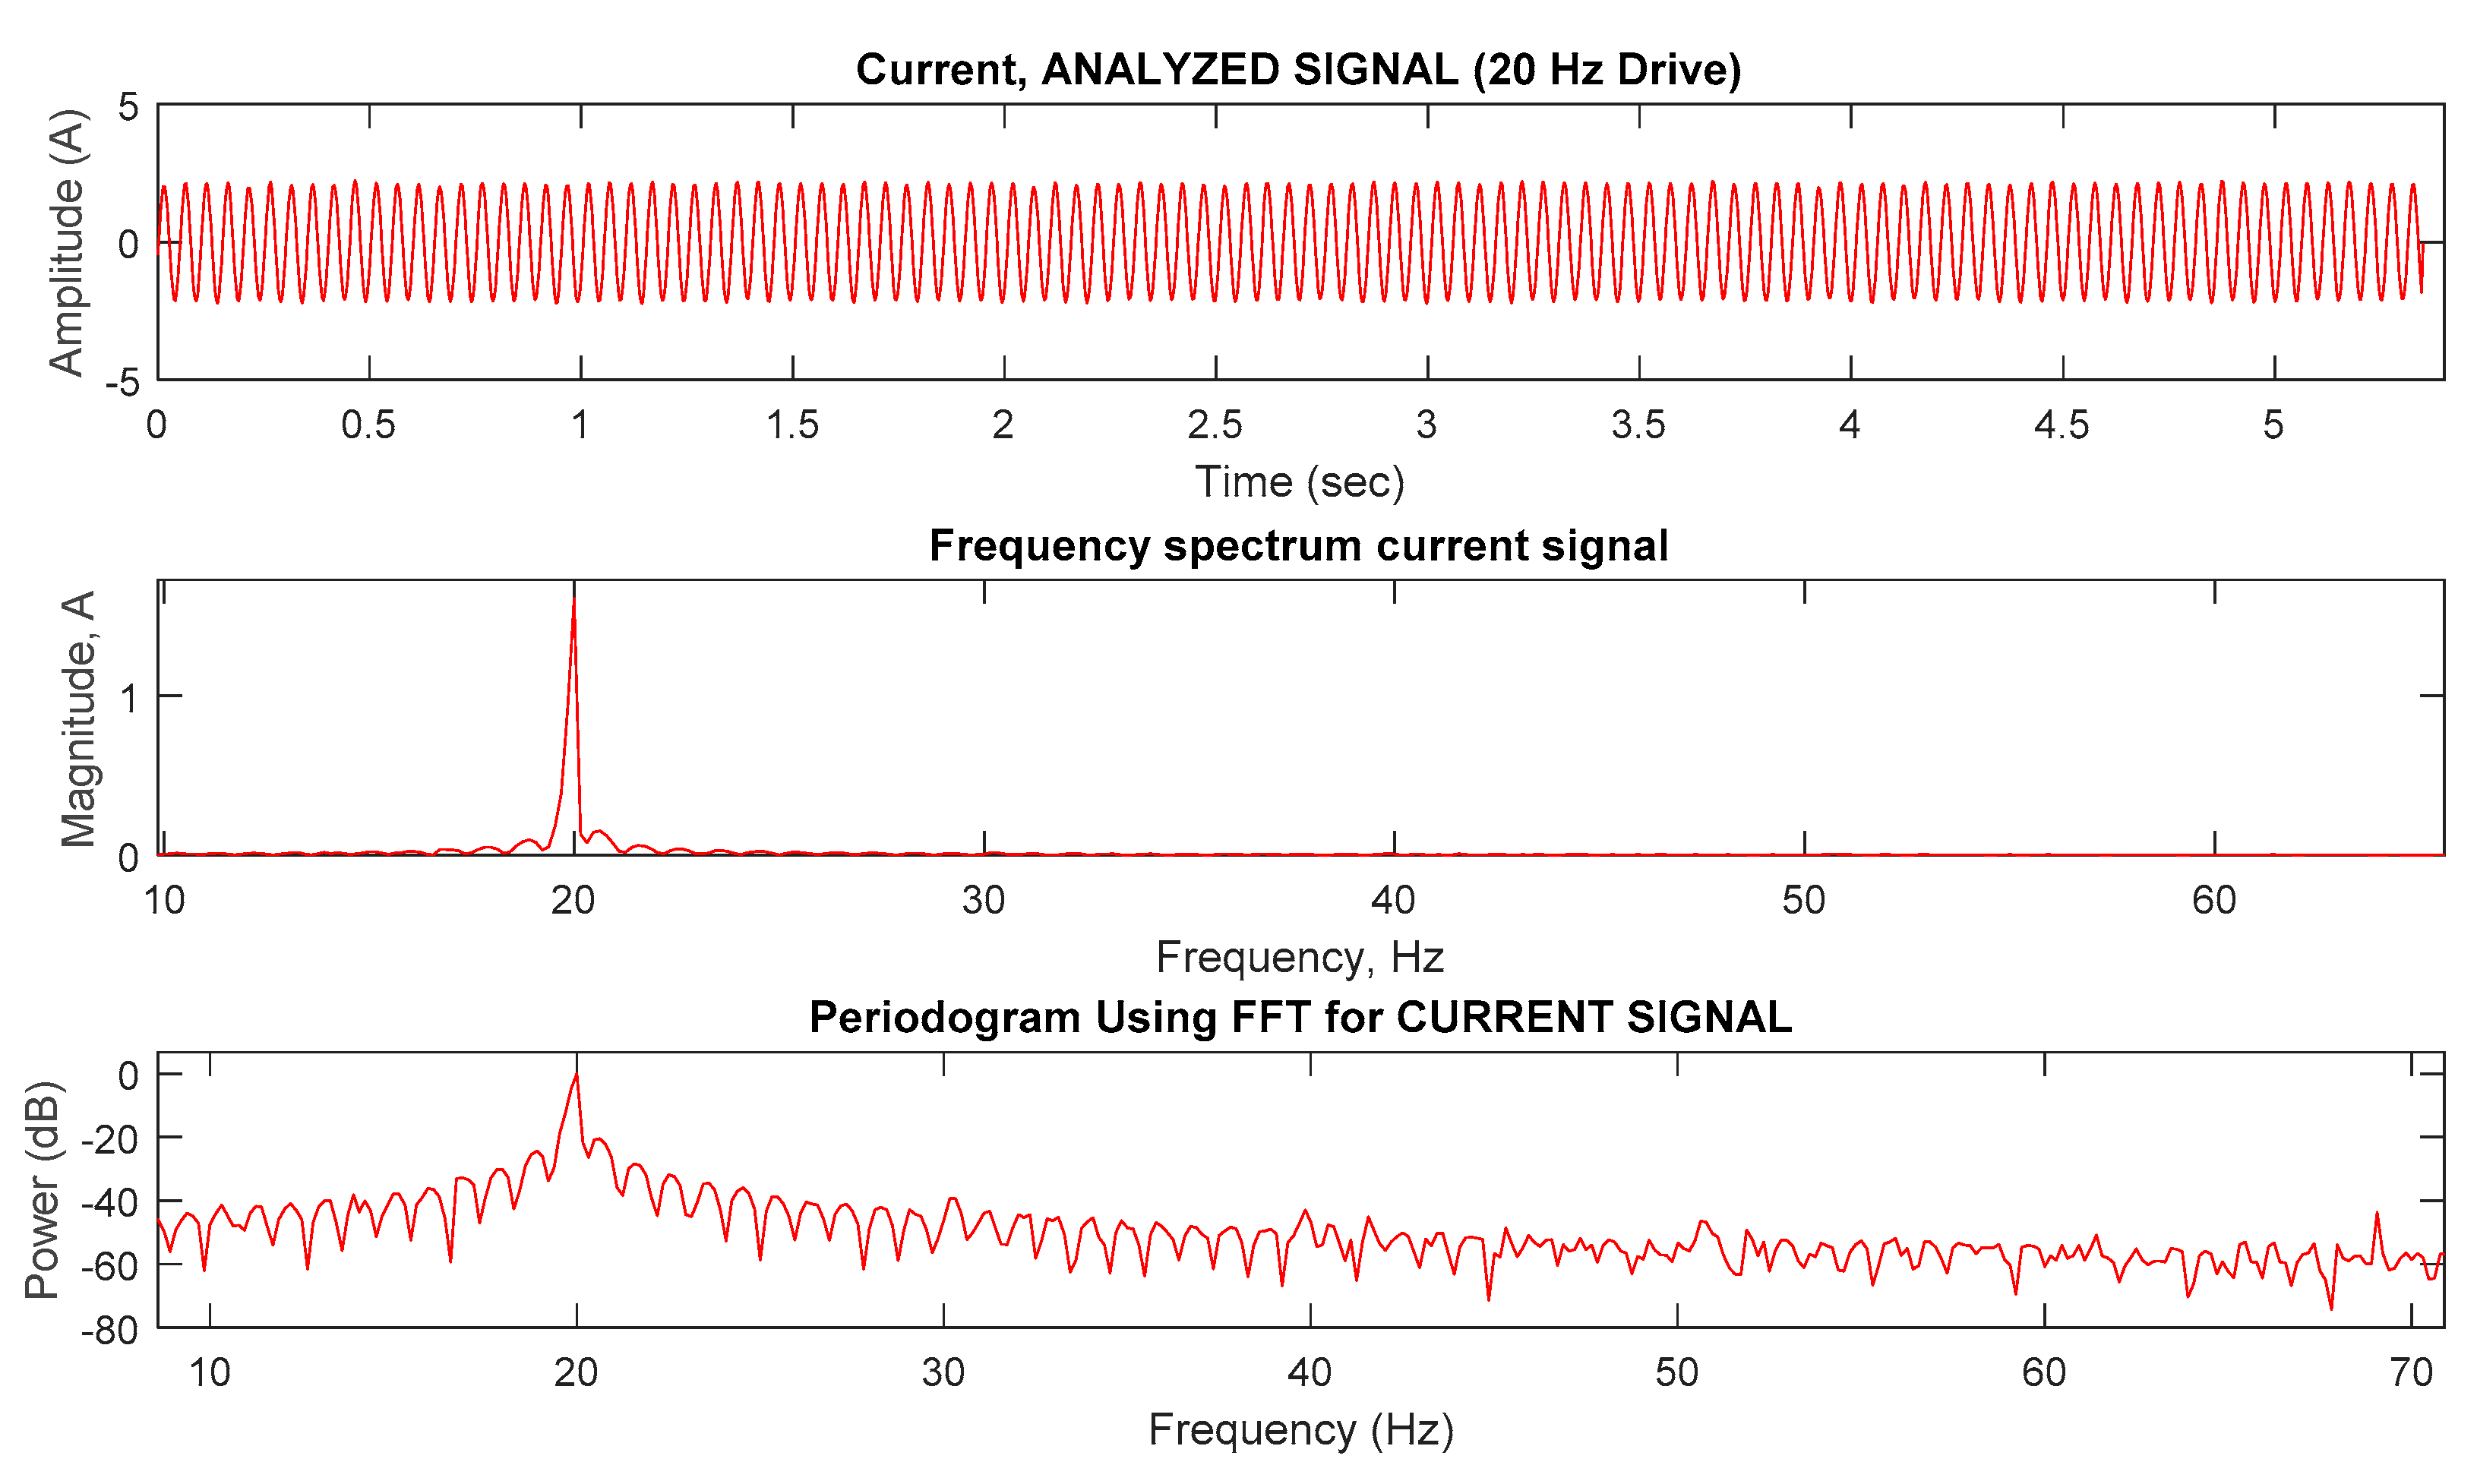
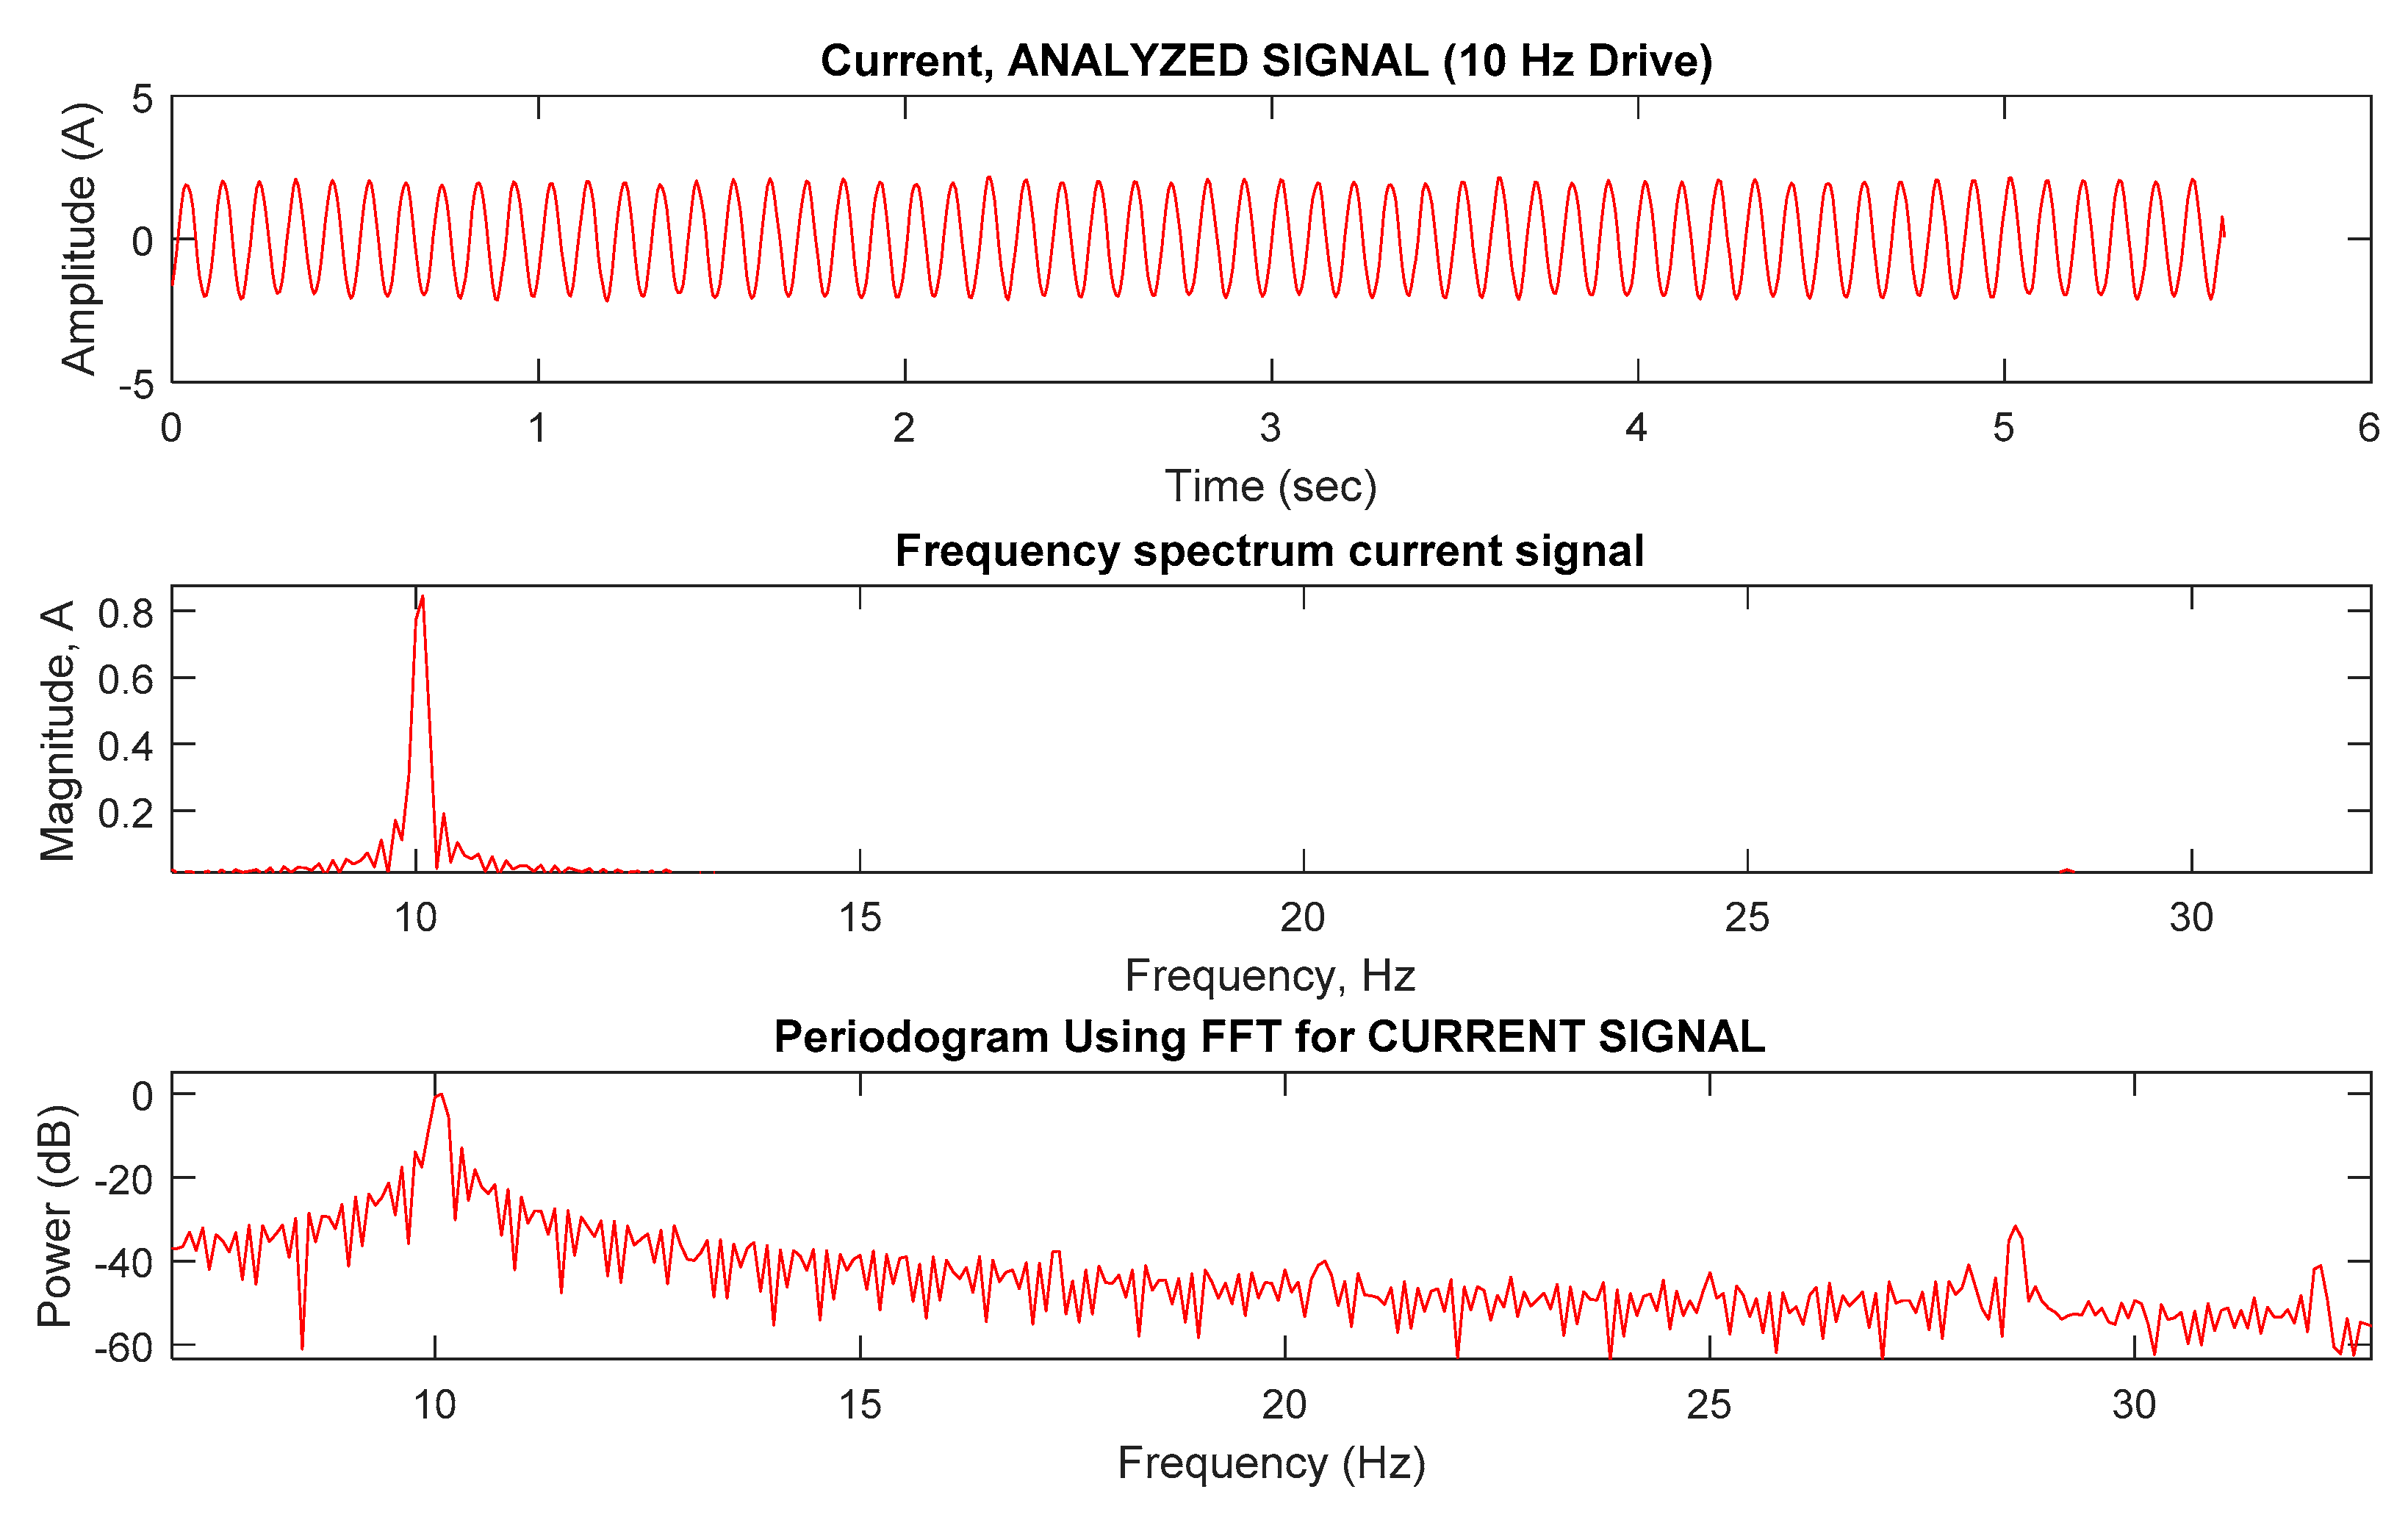
4.2.2. Fast Fourier Transform Estimation Results
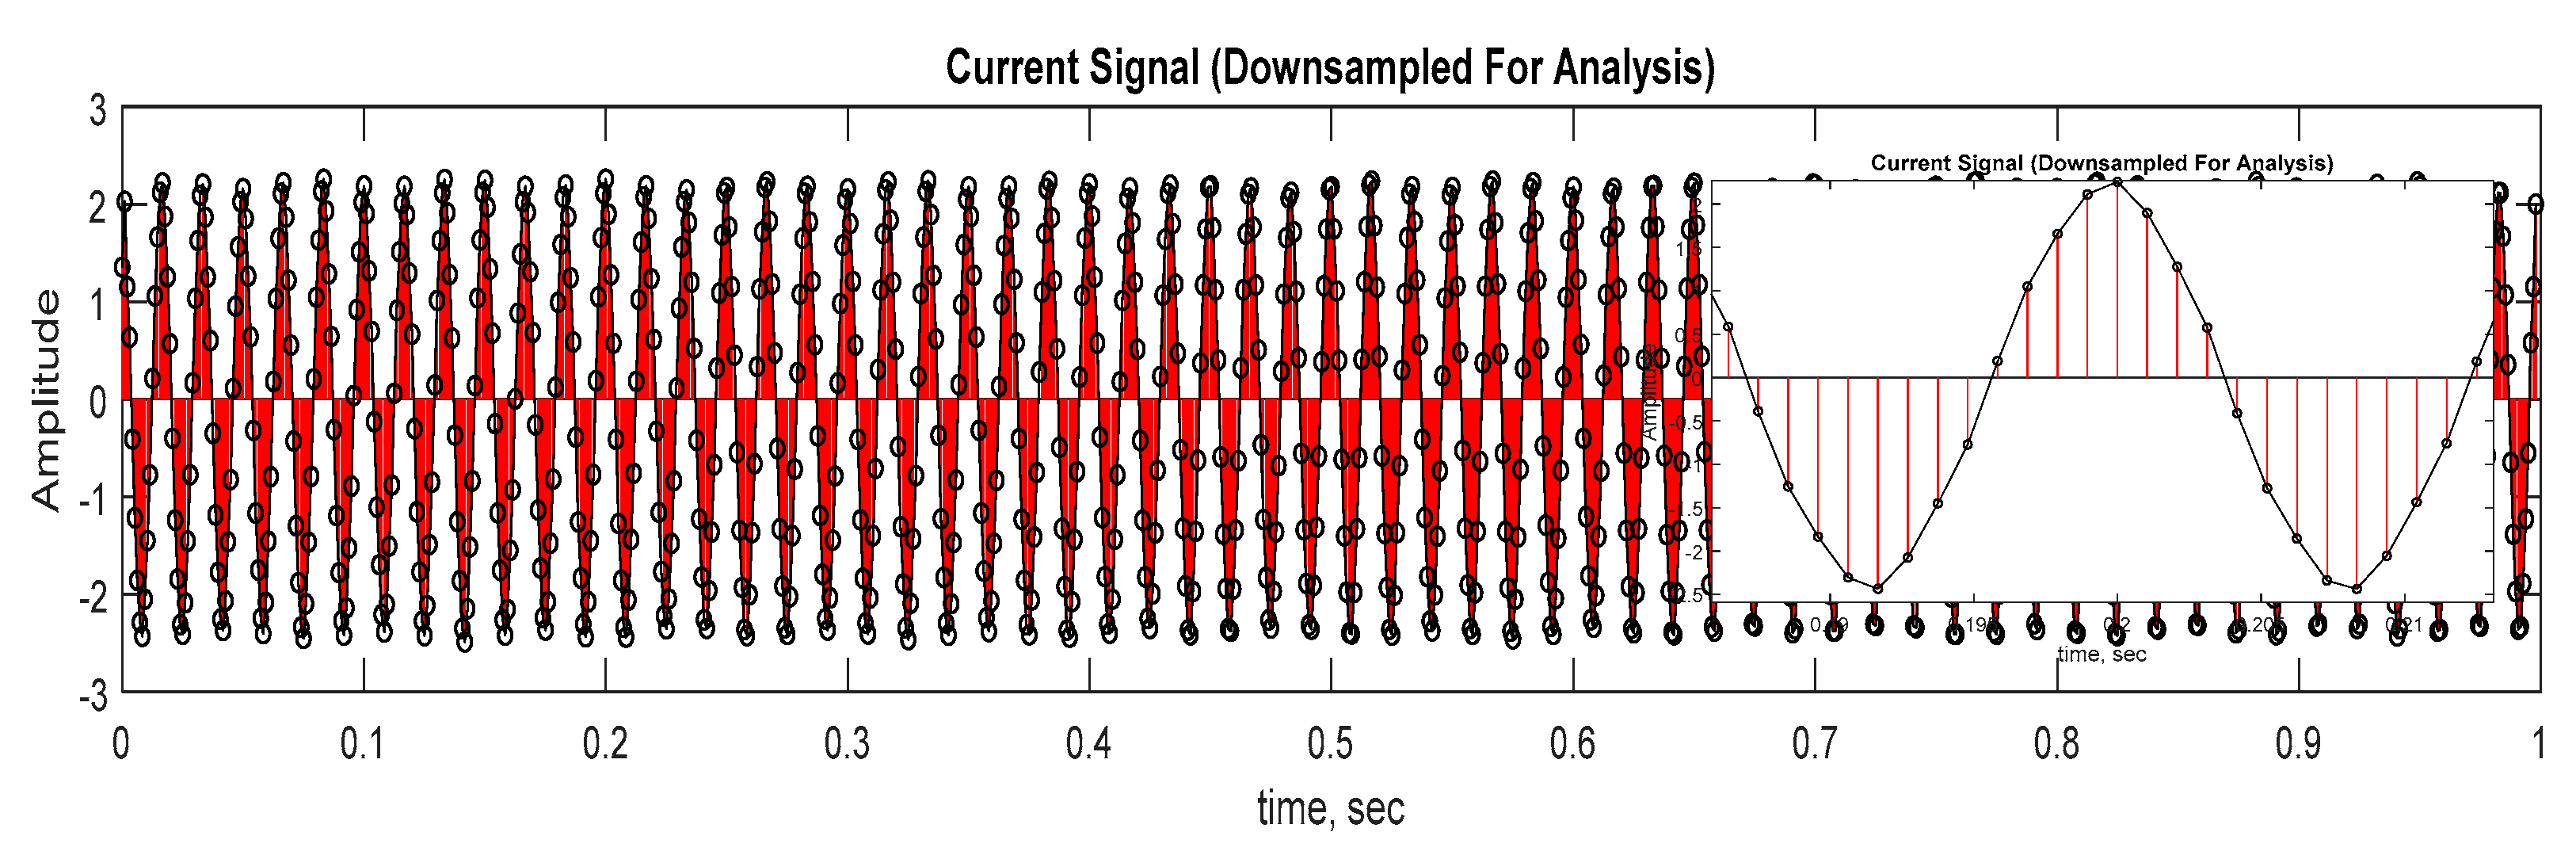
4.2.3. Prony Estimation Results
Downsampling
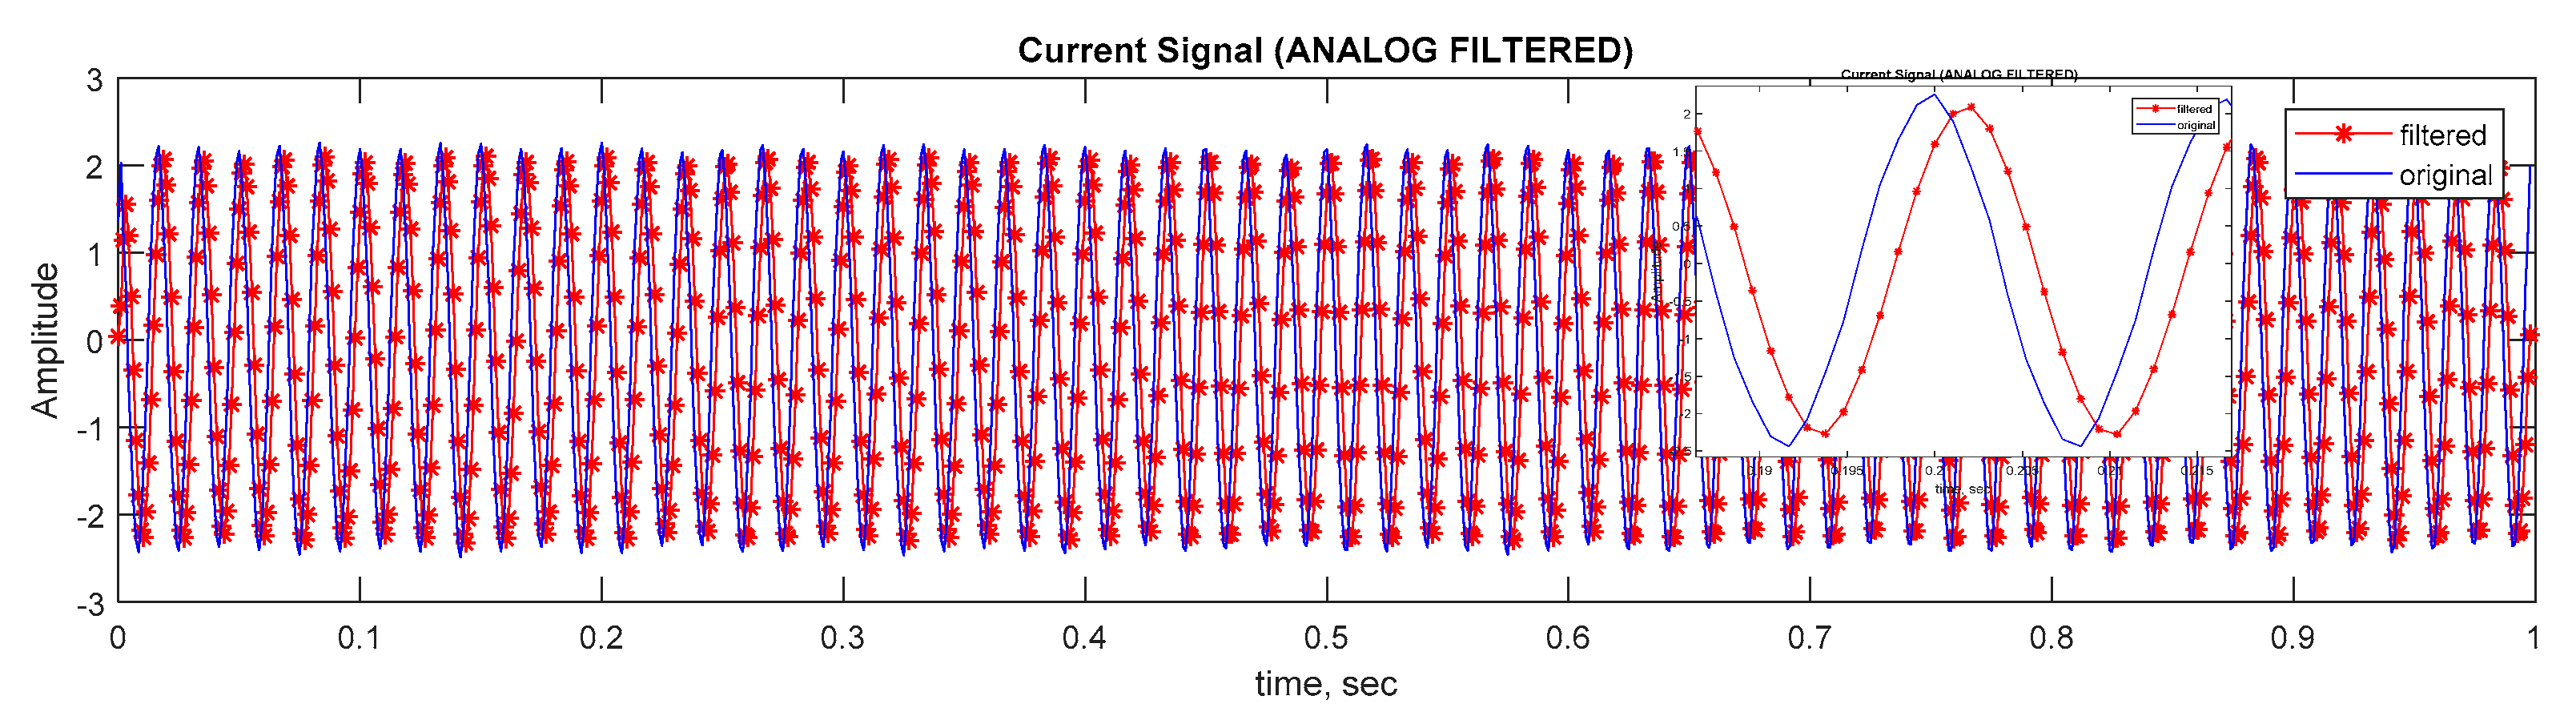
Low Pass and DC Filter
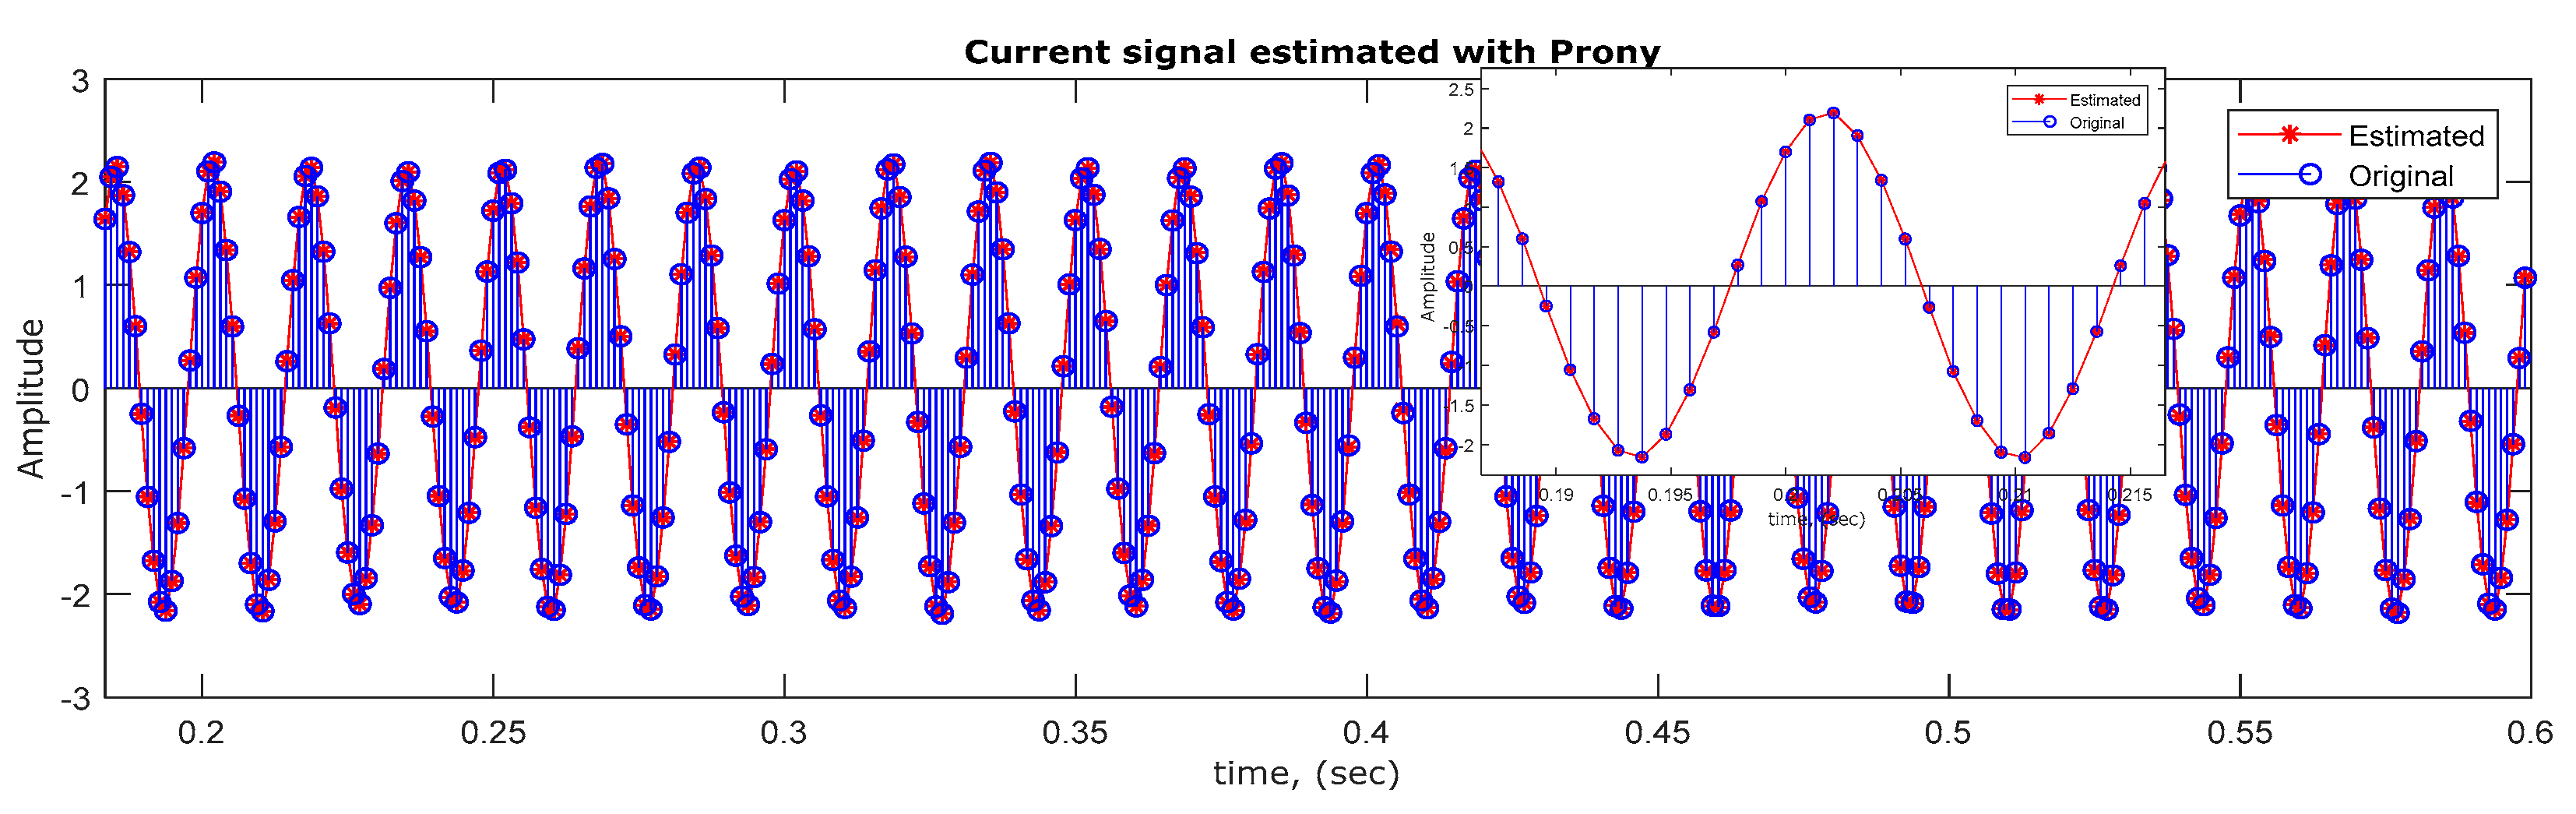
Signal Parameter Estimation
5. Results and Discussion
6. Conclusions
Author Contributions
Funding
Institutional Review Board Statement
Informed Consent Statement
Data Availability Statement
Acknowledgments
Conflicts of Interest
Abbreviations
| RCIM | Rotor Cage Induction Motor |
| BRB | Broken Rotor Bar |
| BRBsbf | Broken Rotor Bar sideband frequencies |
| Sbf+ | Upper sideband frequency |
| Sbf− | Lower sideband frequency |
| CBER | Cracked/Broken End Ring |
| DOL | Direct-On-Line |
| MCSA | Motor Current Signature Analysis |
| AAGE | Abnormal Air Gap Eccentricity |
| OTD | Online Test Diagnostics |
| MSE | Mean Square Error |
| VFD | Variable Frequency Drive |
| FFT | Fast Fourier Transform |
| DSP | Digital Signal Processing |
Appendix A

| Motor Data | ||
|---|---|---|
| Rated Current | 1.98 | A |
| Rated Voltage | 208 | V |
| Rated Power | 0.5 | HP |
| Temperature insulation class F | 155 | °C |
| Rated Frequency | 60 | Hz |
| Service factor | 1.15 | |
| Efficiency | 72 | % |
| Connection | YY | |
| Rotor cage material | Aluminum | |
| Rated Speed | 1730 | RPM |
References
- Singh, G.K.; Kazzaz, S.A.S.A. Induction machine drive condition monitoring and diagnostic research—A survey. Electr. Power Syst. Res. 2003, 64, 145–158. [Google Scholar] [CrossRef]
- Toliyat, H.A.; Nandi, S.; Choi, S.; Meshgin-Kelk, H. Electric Machines: Modeling, Condition Monitoring, and Fault Diagnosis, 1st ed.; CRC Press: Boca Raton, FL, USA, 2013. [Google Scholar]
- Bonnett, A.H.; Soukup, G.C. Cause and analysis of stator and rotor failures in three-phase squirrel-cage induction motors. IEEE Trans. Ind. Appl. 1992, 28, 921–937. [Google Scholar] [CrossRef]
- Thomson, W.T.; Culbert, I. Current Signature Analysis for Condition Monitoring of Cage Induction Motors: Industrial Applications and Case Histories, 1st ed.; John Wiley & Sons, Inc.: Hoboken, NJ, USA, 2017. [Google Scholar]
- Messaoudi, M.; Flah, A.; Alotaibi, A.A.; Althobaiti, A.; Sbita, L.; Ziad El-Bayeh, C. Diagnosis and Fault Detection of Rotor Bars in Squirrel Cage Induction Motors Using Combined Park’s Vector and Extended Park’s Vector Approaches. Electronics 2022, 11, 380. [Google Scholar] [CrossRef]
- Mazouji, R.; Khaloozadeh, H.; Arasteh, M. Fault Diagnosis of Broken Rotor Bars in Induction Motors Using Finite Element Analysis. In Proceedings of the 2020 11th Power Electronics, Drive Systems, and Technologies Conference (PEDSTC), Tehran, Iran, 4–6 February 2020. [Google Scholar] [CrossRef]
- Ferrucho-Alvarez, E.R.; Martinez-Herrera, A.L.; Cabal-Yepez, E.; Rodriguez-Donate, C.; Lopez-Ramirez, M.; Mata-Chavez, R.I. Broken Rotor Bar Detection in Induction Motors through Contrast Estimation. Sensors 2021, 21, 7446. [Google Scholar] [CrossRef] [PubMed]
- Drakaki, M.; Karnavas, Y.L.; Karlis, D.A.; Chasiotis, I.D.; Tzionas, P. Study on fault diagnosis of broken rotor bars in squirrel cage induction motors: A multi-agent system approach using intelligent classifiers. Inst. Eng. Technol. 2020, 14, 245–255. [Google Scholar] [CrossRef]
- Bazan, G.H.; Goedtel, A.; Duque-Perez, O.; Morinigo-Sotelo, D. Multi-Fault Diagnosis in Three-Phase Induction Motors Using Data Optimization and Machine Learning Techniques. Electronics 2021, 10, 1462. [Google Scholar] [CrossRef]
- Martinez-Herrera, A.L.; Ferrucho-Alvarez, E.R.; Ledesma-Carrillo, L.M.; Mata-Chavez, R.I.; Lopez-Ramirez, M.; Cabal-Yepez, E. Multiple Fault Detection in Induction Motors through Homogeneity and Kurtosis Computation. Energies 2022, 15, 1541. [Google Scholar] [CrossRef]
- Liu, X.; Yan, Y.; Hu, K.; Zhang, S.; Li, H.; Zhang, Z.; Shi, T. Fault Diagnosis of Rotor Broken Bar in Induction Motor Based on Successive Variational Mode Decomposition. Energies 2022, 15, 1196. [Google Scholar] [CrossRef]
- Bonet-Jara, J.; Morinigo-Sotelo, D.; Duque-Perez, O.; Serrano-Iribarnegaray, L.; Pons-Llinares, J. End-ring wear in deep well submersible motor pumps. In Proceedings of the IEEE Transactions on Industry Applications, Greenfield, WI, USA, 12 April 2022. [Google Scholar] [CrossRef]
- Elvira-Ortiz, D.A.; Morinigo-Sotelo, D.; Zorita-Lamadrid, A.L.; Osornio-Rios, R.A.; Romero-Troncoso, R.d.J. Fundamental Frequency Suppression for the Detection of Broken Bar in Induction Motors at Low Slip and Frequency. Appl. Sci. 2020, 10, 4160. [Google Scholar] [CrossRef]
- Zamudio-Ramirez, R.A.; Osornio-Rios, J.A.; Antonino-Daviu, H.R.; Romero-Troncoso, R.d.J. Magnetic Flux Analysis for the Condition Monitoring of Electric Machines: A Review. In Proceedings of the IEEE Transactions on Industry Applications, Taipei, Taiwan, 2 April 2022; Volume 18, pp. 2895–2908. [Google Scholar] [CrossRef]
- Garcia-Calva, T.A.; Morinigo-Sotelo, D.; Romero-Troncoso, R.D.J. Fundamental Frequency Normalization for Reliable Detection of Rotor and Load Defects in VSD-fed Induction Motors. In Proceedings of the IEEE Transactions on Industry Applications, Trieste, Italy, 13 November 2021. [Google Scholar] [CrossRef]
- Fernandez-Cavero, V.; Pons-Llinares, J.; Duque-Perez, O.; Morinigo-Sotelo, D. Detection of Broken Rotor Bars in Nonlinear Startups of Inverter-Fed Induction Motors. In Proceedings of the IEEE Transactions on Industry Applications, Greenfield, WI, USA, 17 March 2021; Volume 57, pp. 2559–2568. [Google Scholar] [CrossRef]
- Fernandez-Cavero, V.; Pons-Llinares, J.; Duque-Perez, O.; Morinigo-Sotelo, D. Detection and quantification of bar breakage harmonics evolutions in inverter-fed motors through the dragon transform. ISA Trans. 2021, 109, 352–367. [Google Scholar] [CrossRef]
- Fernandez-Cavero, V.; García-Escudero, L.A.; Pons-Llinares, J.; Fernández-Temprano, M.A.; Duque-Perez, O.; Morinigo-Sotelo, D. Diagnosis of Broken Rotor Bars during the Startup of Inverter-Fed Induction Motors Using the Dragon Transform and Functional ANOVA. Appl. Sci. 2021, 11, 3769. [Google Scholar] [CrossRef]
- Garcia-Calva, T.A.; Morinigo-Sotelo, D.; Fernandez-Cavero, V.; Garcia-Perez, A.; Romero-Troncoso, R.d.J. Early Detection of Broken Rotor Bars in Inverter-Fed Induction Motors Using Speed Analysis of Startup Transients. Energies 2021, 14, 1469. [Google Scholar] [CrossRef]
- Pezzani, C.; Donolo, P.; Bossio, G.; Donolo, M.; Guzmán, A.; Zocholl, S.E. Detecting Broken Rotor Bars With Zero-Setting Protection. In Proceedings of the IEEE Transactions on Industry Applications, Greenfield, WI, USA, 31 July 2014; Volume 50, pp. 1373–1384. [Google Scholar] [CrossRef]
- Ayhan, B.; Chow, M.-Y.; Trussell, H.J.; Song, M.-H. A case study on the comparison of non-parametric spectrum methods for broken rotor bar fault detection. In Proceedings of the 29th Annual Conference of the IEEE Industrial Electronics Society (IECON), Roanoke, VA, USA, 2–6 November 2003. [Google Scholar] [CrossRef]
- Ribeiro, P.F.; Duque, C.A.; Ribeiro, P.M.; Cerqueira, A.S. Power Systems Signal Processing for Smart Grids, 1st ed.; Wiley: London, UK, 2014. [Google Scholar]
- Trujillo-Guajardo, L.A.; Rodriguez-Maldonado, J.; Moonem, M.A.; Platas-Garza, M.A. A Multiresolution Taylor–Kalman Approach for Broken Rotor Bar Detection in Cage Induction Motors. IEEE Trans. Inst. Meas. 2018, 67, 1317–1328. [Google Scholar] [CrossRef]
- Naha, A.; Samanta, A.K.; Routray, A.; Deb, A.K. A method for detecting half-broken rotor bar in lightly loaded induction motors using current. IEEE Trans. Inst. Meas. 2016, 65, 1614–1625. [Google Scholar] [CrossRef]
- Valles-Novo, R.; Rangel-Magdaleno, J.; Ramirez-Cortes, J.M.; Peregrina-Barreto, H.; Morales-Caporal, R. Empirical mode decomposition analysis for broken-bar detection on squirrel cage induction motors. IEEE Trans. Inst. Meas. 2015, 64, 1118–1128. [Google Scholar] [CrossRef]
- Picazo-Rdenas, M.J.; Antonino-Daviu, J.; Climente-Alarcon, V.; Royo-Pastor, R.; Mota-Villar, A. Combination of noninvasive approaches for general assessment of induction motors. IEEE Trans. Ind. Appl. 2015, 51, 2172–2180. [Google Scholar] [CrossRef] [Green Version]
- Wang, J.; Gao, R.X.; Yan, R. Broken-Rotor-Bar Diagnosis for Induction Motors. In Proceedings of the 9th International Conference on Damage Assessment of Structures (DAMAS 2011), London, UK, 11–13 July 2011. [Google Scholar]
- Bessam, B.; Menacer, A.; Boumehraz, M.; Cherif, H. Detection of broken rotor bar faults in induction motor at low load using neural network. ISA Trans. 2016, 64, 241–246. [Google Scholar] [CrossRef]
- Sahraoui, M.; Cardoso, A.J.M.; Ghoggal, A. The Use of a Modified Prony Method to Track the Broken Rotor Bar Characteristic Frequencies and Amplitudes in Three-Phase Induction Motors. IEEE Trans. Ind. Appl. 2014, 51, 2136–2147. [Google Scholar] [CrossRef]
- Jia, Z.; Zhu, H.; Liu, X.; Shang, H. Incipient Broken Rotor Bar Fault Diagnosis Based on Extended Prony Spectral Analysis Technique. In Proceedings of the 2018 37th Chinese Control Conference (CCC), Wuhan, China, 25–27 July 2018. [Google Scholar] [CrossRef]
- Chen, S.; Zivanovic, R. Estimation of frequency components in stator current for the detection of broken rotor bars in induction machines. Measurement 2010, 43, 887–900. [Google Scholar] [CrossRef]
- Xu, B.Q.; Tian, S.H. A Detection Method for Broken Rotor Bar Fault in Induction Motors Based on SVD Combined MUSIC with Extended Prony; Applied Mechanics and Materials Trans Tech Publications, Ltd.: Basel, Switzerland, 2014; Volume 707, pp. 333–337. [Google Scholar] [CrossRef]
- Dehina, W.; Boumehraz, M.; Kratz, F. On-line detection and estimation of harmonics components in induction motors rotor fault through a modified Prony’s method. Int. Trans. Electr. Energ. Syst. 2021, 31. [Google Scholar] [CrossRef]
- Lobos, T.; Rezmer, J.; Schegner, J. Parameter estimation of distorted signals using Prony method. In Proceedings of the 2003 IEEE Bologna Power Tech Conference Proceedings, Bologna, Italy, 23–26 June 2003. [Google Scholar] [CrossRef] [Green Version]
- Leonowicz, Z.; Lobos, T.; Rezmer, J. Advanced Spectrum Estimation Methods for Signal Analysis in Power Electronics. IEEE Trans. Ind. Electr. 2003, 50, 514–519. [Google Scholar] [CrossRef]
- Wrocław University of Science and Technology Digital Library. Parametric Methods for Time–Frequency Analysis of Electric Signals. Available online: https://www.dbc.wroc.pl/dlibra/publication/1877/edition/2021?language=pl (accessed on 15 February 2022).
- Qi, L.; Qian, L.; Woodruff, S.; Cartes, D. Prony Analysis for Power System Transients. EURASIP J. Adv. Signal Processing 2007, 2007, 048406. [Google Scholar] [CrossRef] [Green Version]
- Meunier, M.; Brouaye, F. Fourier transform, Wavelets, Prony Analysis: Tools for Harmonics and Quality of Power. In Proceedings of the 8th Int. Conf. on Harmonics and Quality of Power ICHQP’98, Athens, Greece, 14–16 October 1998. [Google Scholar] [CrossRef]
- Johnson, M.A.; Zarafonitis, I.P.; Calligaris, M. Prony analysis and power system stability-some recent theoretical and applications research. In Proceedings of the 2000 Power Engineering Society Summer Meeting, Seattle, WA, USA, 16–20 July 2000. [Google Scholar] [CrossRef]
- Castillo, R.; Ramírez, J.R.; Alonso, G.; Ortiz-Villafuerte, J. Prony’s method application for BWR instabilities characterization. Nucl. Eng. Des. J. 2014, 284, 67–73. [Google Scholar] [CrossRef]
- Trujillo Guajardo, L.A. Relevador De Protección De Distancia Con Estimador Fasorial De Prony (MX Patent No. 351620 B). México Patent Office, Instituto Mexicano de la Propiedad Industrial, IMPI. 2017. Available online: https://vidoc.impi.gob.mx/visor?usr=SIGA&texp=SI&tdoc=E&id=MX/a/2014/012486 (accessed on 12 January 2022).
- Trujillo Guajardo, L.A. Prony filter vs conventional filters for distance protection relays: An evaluation. Electr. Power Syst. Res. 2016, 137, 163–174. [Google Scholar] [CrossRef]


| Energy, dB | Rotor Condition |
|---|---|
| >60 | |
| 54–60 | |
| 48–54 | |
| 42–48 | |
| 36–42 | |
| 30–36 | |
| <30 |
| Harmonic Order | Frequency, (Hz) | Amplitude |
|---|---|---|
| 1 | 60 | 516 |
| 1.0178 | 61.06 (+sb1) | 15 |
| 0.9822 | 58.93 (−sb1) | 14 |
| 1.0356 | 62.13 (+sb2) | 12 |
| 0.9644 | 57.86 (−sb2) | 11 |
| Estimated Signal Parameters | Frequency, (Hz) | Amplitude |
|---|---|---|
| Example signal | 60 | 516.00 |
| 61.06 | 15.00 | |
| 58.93 | 14.00 | |
| 62.13 | 11.99 | |
| 57.86 | 10.99 |
| Full Load Slip, (s) | Sideband Frequencies | Frequency, (Hz) | |||||
|---|---|---|---|---|---|---|---|
| 0.0388 | Speed operation Condition, Fundamental frequency | 60 | 50 | 40 | 30 | 20 | 10 |
| Sb1+ | 64.66 | 53.88 | 43.11 | 32.33 | 21.55 | 10.77 | |
| Sb1− | 55.33 | 46.11 | 36.88 | 27.66 | 18.44 | 9.22 | |
| Sb2+ | 69.33 | 57.77 | 46.22 | 34.66 | 23.11 | 11.55 | |
| Sb2− | 50.66 | 42.22 | 33.77 | 25.33 | 16.88 | 8.44 | |
| Estimated Signal Parameters | True Frequency Values (Hz) | FFT Estimation Results | |||
|---|---|---|---|---|---|
| Frequency (Hz) | Amplitude (A) | Power (dB) | |||
| Full Load Slip s = 0.0388 | (1 + 2 s) f [Sb1−] | 55.33 | 59.77 | 0.285 | −12.20 |
| Fundamental (f) | 60.00 | 60.00 | 1.161 | 0 | |
| (1 − 2 s) f [Sb1+] | 64.66 | 60.35 | 0.277 | −12.42 | |
| (1 + 2 s) f [Sb1−] | 46.11 | 49.8 | 0.232 | −13.16 | |
| Fundamental (f) | 50.00 | 50.1 | 1.055 | 0 | |
| (1 − 2 s) f [Sb1+] | 53.88 | 50.39 | 0.192 | −14.76 | |
| (1 + 2 s) f [Sb1−] | 36.88 | 39.06 | 0.104 | −23.9 | |
| Fundamental (f) | 40.00 | 40.00 | 1.641 | 0 | |
| (1 − 2 s) f [Sb1+] | 43.11 | 40.47 | 0.196 | −18.44 | |
| (1 + 2 s) f [Sb1−] | 27.66 | 29.65 | 0.285 | −12.58 | |
| Fundamental (f) | 30.00 | 29.88 | 1.216 | 0 | |
| (1 − 2 s) f [Sb1+] | 32.33 | 30.23 | 0.241 | −14.03 | |
| (1 + 2 s) f [Sb1−] | 18.44 | 18.91 | 0.096 | −24.41 | |
| Fundamental (f) | 20.00 | 20.00 | 1.61 | 0 | |
| (1 − 2 s) f [Sb1+] | 21.55 | 20.63 | 0.151 | −20.52 | |
| (1 + 2 s) f [Sb1−] | 9.22 | 9.21 | 0.108 | −23.1 | |
| Fundamental (f) | 10.00 | 10.00 | 1.543 | 0 | |
| (1 − 2 s) f [Sb1+] | 10.77 | 11.41 | 0.071 | −26.68 | |
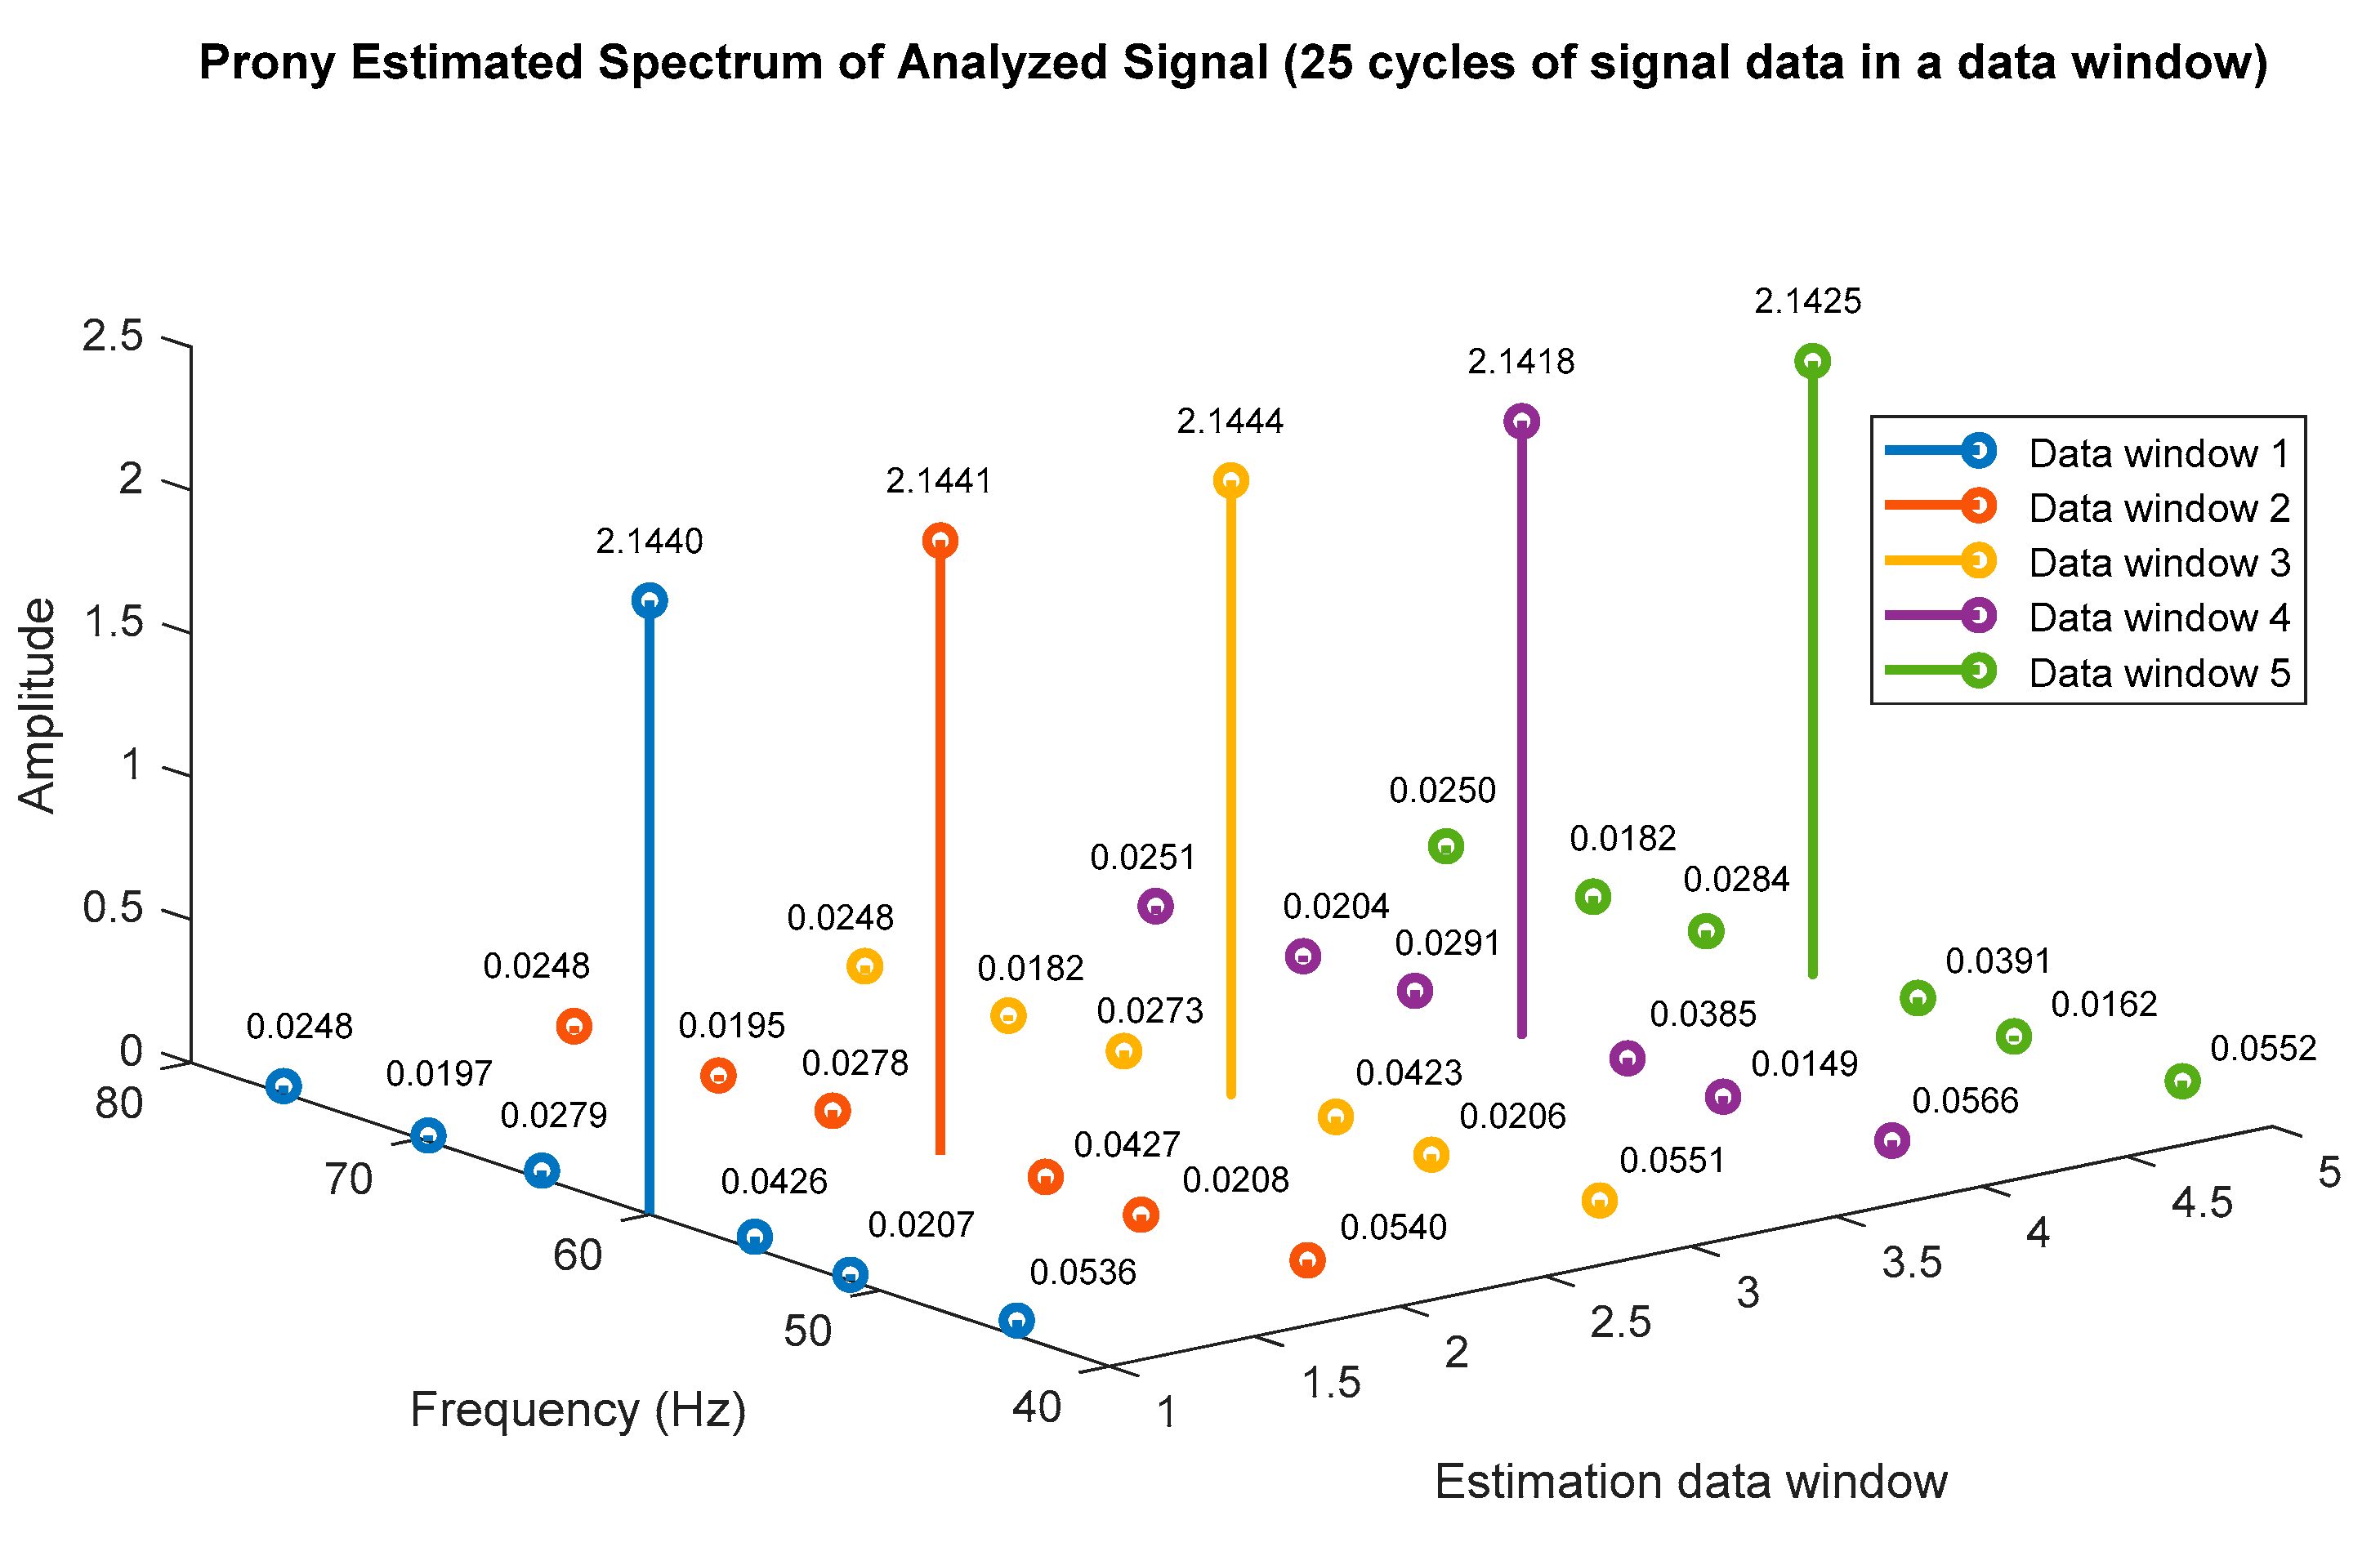
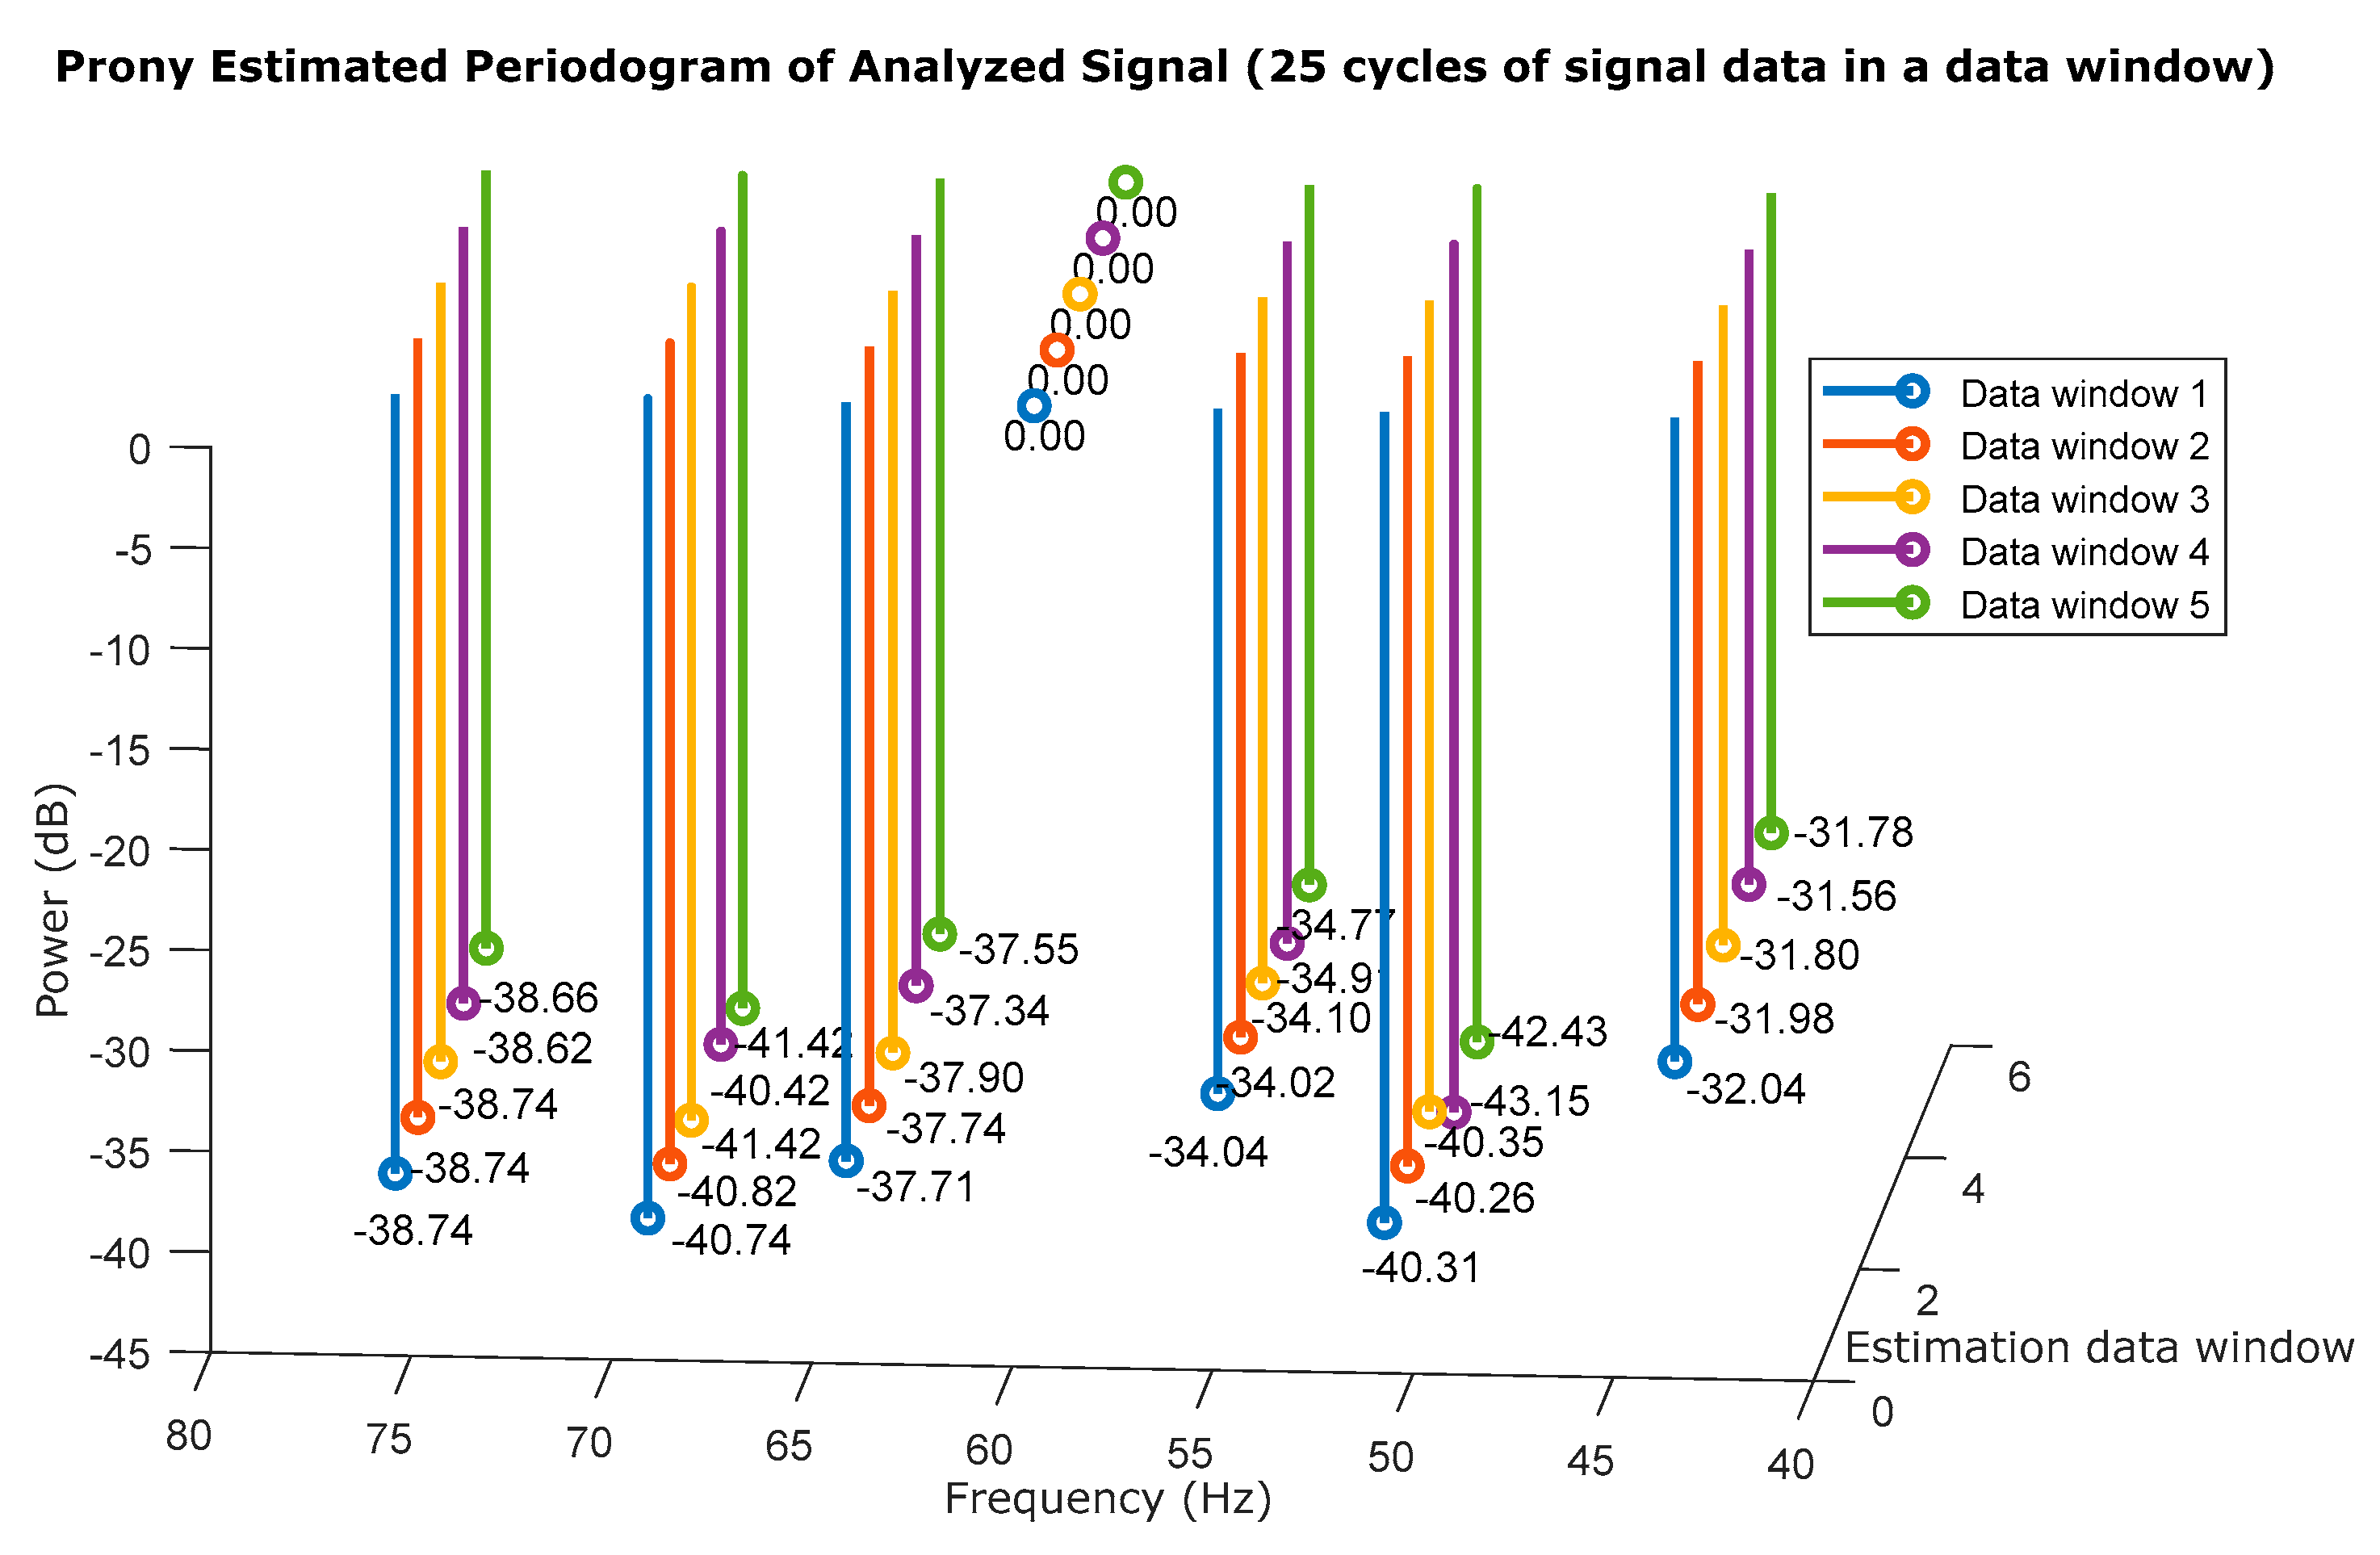
| Estimated Signal Parameters | Data Window 1 | Data Window 2 | Data Window 3 | Data Window 4 | Data Window 5 | |||||
|---|---|---|---|---|---|---|---|---|---|---|
| Frequency (Hz) | Amplitude | Frequency (Hz) | Amplitude | Frequency (Hz) | Amplitude | Frequency (Hz) | Amplitude | Frequency (Hz) | Amplitude | |
| Sb3− | 44.03 | 0.0536 | 44.03 | 0.0540 | 43.97 | 0.0551 | 43.90 | 0.0566 | 43.91 | 0.0552 |
| Sb2− | 51.28 | 0.0207 | 51.28 | 0.0208 | 51.30 | 0.0206 | 51.26 | 0.0149 | 51.25 | 0.0162 |
| Sb1− | 55.44 | 0.0426 | 55.44 | 0.0427 | 55.46 | 0.0423 | 55.42 | 0.0385 | 55.44 | 0.0391 |
| Fundamental | 60.02 | 2.1440 | 60.02 | 2.1441 | 60.02 | 2.1444 | 60.02 | 2.1418 | 60.02 | 2.1425 |
| Sb1+ | 64.71 | 0.0279 | 64.71 | 0.0278 | 64.69 | 0.0273 | 64.68 | 0.0291 | 64.66 | 0.0284 |
| Sb2+ | 69.66 | 0.0197 | 69.68 | 0.0195 | 69.72 | 0.0182 | 69.55 | 0.0204 | 69.58 | 0.0182 |
| Sb3+ | 75.96 | 0.0248 | 75.97 | 0.0248 | 75.97 | 0.0248 | 75.97 | 0.0251 | 75.98 | 0.0250 |
| Estimated Signal Parameters | Measured Signal (Current Phase A) | |||||
|---|---|---|---|---|---|---|
| True Frequency Values (Hz) | Prony Method Estimation Results | |||||
| Frequency (Hz) | Amplitude (A) | Power (dB) | MSE Curve Fitting | |||
| Full Load Slip s = 0.0388 | (1 + 2 s) f [Sb1−] | 46.11 | 46.89 | 0.0222 | −39.76 | 1.7889 × 10⁻⁴ |
| Fundamental (f) | 50.00 | 50.07 | 2.1599 | 0 | ||
| (1 − 2 s) f [Sb1+] | 53.88 | 54.16 | 0.0192 | −41.02 | ||
| (1 + 2 s) f [Sb1−] | 36.88 | 36.50 | 0.0327 | −36.41 | 5.2202 × 10⁻⁴ | |
| Fundamental (f) | 40.00 | 39.96 | 2.1628 | 0 | ||
| (1 − 2 s) f [Sb1+] | 43.11 | 43.64 | 0.0140 | −43.78 | ||
| (1 + 2 s) f [Sb1−] | 27.66 | 26.78 | 0.0231 | −39.37 | 6.4835 × 10⁻⁴ | |
| Fundamental (f) | 30.00 | 29.92 | 2.1475 | 0 | ||
| (1 − 2 s) f [Sb1+] | 32.33 | 33.23 | 0.0424 | −34.09 | ||
| (1 + 2 s) f [Sb1−] | 18.44 | 18.01 | 0.0400 | −34.41 | 4.6944 × 10⁻⁴ | |
| Fundamental (f) | 20.00 | 19.95 | 2.1011 | 0 | ||
| (1 − 2 s) f [Sb1+] | 21.55 | 21.59 | 0.0277 | −37.60 | ||
| (1 + 2 s) f [Sb1−] | 9.22 | 9.68 | 0.0305 | −36.39 | 2.4833 × 10⁻⁴ | |
| Fundamental (f) | 10.00 | 10.05 | 2.0117 | 0 | ||
| (1 − 2 s) f [Sb1+] | 10.77 | 10.60 | 0.0420 | −33.61 | ||
| Estimated Signal Parameters | Measured Signal (Current Phase A) | ||||||||
|---|---|---|---|---|---|---|---|---|---|
| True Frequency Values (Hz) | FFT Estimation Results | Prony Method Estimation Results | |||||||
| Frequency (Hz) | Amplitude (A) | Power (dB) | Frequency (Hz) | Amplitude (A) | Power (dB) | MSE Curve Fitting | |||
| Full Load Slip s = 0.0388 | (1 + 2 s) f [Sb1−] | 55.33 | 59.77 | 0.285 | −12.20 | 55.44 | 0.0426 | −34.04 | 6.4593 × 10⁻⁴ |
| Fundamental (f) | 60.00 | 60.00 | 1.161 | 0 | 60.02 | 2.1440 | 0 | ||
| (1 − 2 s) f [Sb1+] | 64.66 | 60.35 | 0.277 | −12.42 | 64.71 | 0.0279 | −37.71 | ||
| (1 + 2 s) f [Sb1−] | 46.11 | 49.8 | 0.232 | −13.16 | 46.89 | 0.0222 | −39.76 | 1.7889 × 10⁻⁴ | |
| Fundamental (f) | 50.00 | 50.1 | 1.055 | 0 | 50.07 | 2.1599 | 0 | ||
| (1 − 2 s) f [Sb1+] | 53.88 | 50.39 | 0.192 | −14.76 | 54.16 | 0.0192 | −41.02 | ||
| (1 + 2 s) f [Sb1−] | 36.88 | 39.06 | 0.104 | −23.9 | 36.50 | 0.0327 | −36.41 | 5.2202 × 10⁻⁴ | |
| Fundamental (f) | 40.00 | 40.00 | 1.641 | 0 | 39.96 | 2.1628 | 0 | ||
| (1 − s) f [Sb1+] | 43.11 | 40.47 | 0.196 | −18.44 | 43.64 | 0.0140 | −43.78 | ||
| (1 + 2 s) f [Sb1−] | 27.66 | 29.65 | 0.285 | −12.58 | 26.78 | 0.0231 | −39.37 | 6.4835 × 10⁻⁴ | |
| Fundamental (f) | 30.00 | 29.88 | 1.216 | 0 | 29.92 | 2.1475 | 0 | ||
| (1 − 2 s) f [Sb1+] | 32.33 | 30.23 | 0.241 | −14.03 | 33.23 | 0.0424 | −34.09 | ||
| (1 + 2 s) f [Sb1−] | 18.44 | 18.91 | 0.096 | −24.41 | 18.01 | 0.0400 | −34.41 | 4.6944 × 10⁻⁴ | |
| Fundamental (f) | 20.00 | 20.00 | 1.61 | 0 | 19.95 | 2.1011 | 0 | ||
| (1 − 2 s) f [Sb1+] | 21.55 | 20.63 | 0.151 | −20.52 | 21.59 | 0.0277 | −37.60 | ||
| (1 + 2 s) f [Sb1−] | 9.22 | 9.21 | 0.108 | −23.1 | 9.68 | 0.0305 | −36.39 | 2.4833 × 10⁻⁴ | |
| Fundamental (f) | 10.00 | 10.00 | 1.543 | 0 | 10.05 | 2.0117 | 0 | ||
| (1 − 2 s) f [Sb1+] | 10.77 | 11.41 | 0.071 | −26.68 | 10.60 | 0.0420 | −33.61 | ||
Publisher’s Note: MDPI stays neutral with regard to jurisdictional claims in published maps and institutional affiliations. |
© 2022 by the authors. Licensee MDPI, Basel, Switzerland. This article is an open access article distributed under the terms and conditions of the Creative Commons Attribution (CC BY) license (https://creativecommons.org/licenses/by/4.0/).
Share and Cite
Trujillo Guajardo, L.A.; Platas Garza, M.A.; Rodríguez Maldonado, J.; González Vázquez, M.A.; Rodríguez Alfaro, L.H.; Salinas Salinas, F. Prony Method Estimation for Motor Current Signal Analysis Diagnostics in Rotor Cage Induction Motors. Energies 2022, 15, 3513. https://doi.org/10.3390/en15103513
Trujillo Guajardo LA, Platas Garza MA, Rodríguez Maldonado J, González Vázquez MA, Rodríguez Alfaro LH, Salinas Salinas F. Prony Method Estimation for Motor Current Signal Analysis Diagnostics in Rotor Cage Induction Motors. Energies. 2022; 15(10):3513. https://doi.org/10.3390/en15103513
Chicago/Turabian StyleTrujillo Guajardo, Luis Alonso, Miguel Angel Platas Garza, Johnny Rodríguez Maldonado, Mario Alberto González Vázquez, Luis Humberto Rodríguez Alfaro, and Fernando Salinas Salinas. 2022. "Prony Method Estimation for Motor Current Signal Analysis Diagnostics in Rotor Cage Induction Motors" Energies 15, no. 10: 3513. https://doi.org/10.3390/en15103513
APA StyleTrujillo Guajardo, L. A., Platas Garza, M. A., Rodríguez Maldonado, J., González Vázquez, M. A., Rodríguez Alfaro, L. H., & Salinas Salinas, F. (2022). Prony Method Estimation for Motor Current Signal Analysis Diagnostics in Rotor Cage Induction Motors. Energies, 15(10), 3513. https://doi.org/10.3390/en15103513