1. Introduction
Our desire for advancing Smart Cities and the Internet of Things dictates the need for improved networks of wireless sensors. In fact, networks of wireless sensors are currently witnessing increased demand due to their suitability for a wide range of applications, particularly those involving monitoring and detection. Among these applications are their use in industrial process monitoring and control [
1], structural damage detection [
2], air pollution monitoring [
3], water quality monitoring [
4], forest fire detection [
5], and natural disaster management [
6]. A wireless sensor network typically contains tens to hundreds of sensor nodes, each comprising a sensor together with a processor and a communication unit. However, these components can only function when a power source provides them with sufficient power. Clearly, a battery can be used for such a function; however, when there are many nodes involved and/or these nodes are in remote locations, batteries become a less favorable option and a ‘deploy and forget’ solution becomes a necessity. This makes small-sized energy harvesters a potential alternative solution in such cases given their ability to convert the mechanical energy from the environment to useful electrical power sufficient to satisfy the power demands of each node.
Small-sized devices that can be used for mechanical to electrical energy conversion can rely on different physical concepts, such as electromagnetic/electrostatic induction. However, devices relying on piezoelectricity are typically favored due to their relatively higher energy density and the ability to design them from a range of different materials and with different configurations, allowing more freedom in tuning their performance [
7,
8]. Ambient environmental vibrations, on the other hand, exist in many forms and there have been excessive demonstrations of the ability to use piezoelectric energy harvesters to exploit the mechanical energy contained within these vibrations to generate useful electric power. Arguably, piezoelectric energy harvesters excited via base vibrations have been the most demonstrated devices in this area. This has enabled several review studies on their modeling and realization [
9], efficiency and damping considerations [
10], how base vibrations compare against other sources of excitation [
11], optimization techniques to enhance harvesters’ performance [
12], and the use of these devices for low-frequency vibrations [
13], low-level vibrations [
14], and roadway [
15] energy-harvesting applications. However, in recent years, and with the existence of relatively flexible piezoelectric elements, namely PVDF (polyvinylidene difluoride), considerable interest has developed in using these flexible elements to harvest energy from wind excitations. In fact, the so-called ‘inverted flag’ configuration has increasingly been considered over the past few years as a viable configuration to employ flexible PVDF elements and generate electricity when subjected to wind excitations. Homogeneous energy-harvesting inverted flags, with [
16,
17] and without [
18] additional solar panels, as well as composite inverted flags, with [
19] and without [
20] additional solar panels, have all been demonstrated. Moreover, the dynamics of this configuration are well established, and the reader can refer to the authors’ previous work [
20] for a detailed description of the dynamic states of such flags, as well as their capacity for generating electric power and how this capacity varies with their geometrical and configurational parameters.
Previous studies on inverted flag harvesters have focused solely on their performance in generating electric power, and how to maximize such generation, while the sustainability of this performance, in terms of how long such flags can operate while delivering near-constant levels of power, has rarely been considered. This appears to be a clear shortcoming in the literature, given the aim of realizing a device that has real-world application. From a practical point of view, it is not sufficient to consider the amount of power generation as the only metric to judge a device’s performance. In fact, it may be more important to consider the duration over which this device can produce such power and how performance degradation will take place over its lifespan. Clearly, this is an essential part of any new product development, but it appears to have been overlooked when investigating piezoelectric energy harvesters. As such, this paper aims to provide insight into the mechanical durability of an inverted flag energy harvester to inform the community on what can be expected in terms of the usable lifespan of such devices.
Studies have considered the degradation of piezoelectric devices of various configurations, such as flat discs and long cylinders [
21] as well as rectangular patches [
22]. However, a more relevant configuration to inverted flags is piezoelectric energy-harvesting beams. For example, Pillatsch et al. [
23] considered a bending beam with a tip mass of a bimorph cantilever configuration, exciting it at the tip using symmetrical and asymmetrical magnetic actuation. They showed that extended operation affects both the mechanical and electrical properties of the beam, leading to loss of power. Additionally, Wang et al. [
24] considered beams with Macro Fiber Composite (MFC) patches, showing that stress depolarization leads to the degradation and ultimately failure of the structure. In fact, micro-cracks have been seen in several studies, e.g., [
25,
26], and their existence is always an indication of degradation. Later, Hirst et al. [
27] experimentally measured the long-term operation performance of piezoelectric vibration energy harvesters made from three of the most used piezoelectric materials, including PVDF, MFC, and Quick Pack, for low-frequency applications. They showed that higher cumulative variations in natural frequency and optimum load resistance lead to degradation in the mechanical and electrical properties of the harvesters. For stiffer harvester beams, they demonstrated that increasing the tip mass can have negative effects on the power output. Interestingly, they showed that PVDFs are the best candidates when considering the power density to cost ratio. Most recently, review studies on the lifetime performance of piezoelectric energy harvesters have been presented. Salazar et al. [
28] reviewed fatigue investigations of vibration energy harvesters, showing that there is a lack of knowledge on the important lifespan degradation properties. Later, another review was presented [
29], considering both piezoelectric property degradation as well as cracks due to fatigue and their combined effects on the lifespan performance of a harvester.
PVDF-based harvesters are typically of high flexibility, leading to low resonant frequencies, and therefore have attracted increased interest over the past few years as vibration harvesters for low-frequency applications. In fact, a number of useful investigations have been presented for PVDF-based vibration harvesters. These include studies considering design optimization [
30], demonstrating the potential for using additional magnetic mass [
31] or solar panels [
32] within the harvesters, investigating their operation in vacuum [
33], implementing these harvesters in arrays [
34], using a flexible meshed core to tailor the harvester’s structural response [
35], and exploring planform and excitation effects on performance [
36]. While several piezoelectric material options can be employed for vibration harvesters, PVDFs are the only option that has been employed within inverted flag harvesters due to the need for their unique characteristic of high flexibility, being a piezoelectric polymer. However, the degradation performance of piezoelectric wind energy harvesters does not appear to have been considered previously, providing the motivation for this study. As such, we employed a composite inverted flag and performed a prolonged testing campaign till reaching structural failure. In doing so, we were able to provide an insight and a preliminary understanding of how long this configuration can operate sustainably, and we also report how the energy harvesting performance changes over this period, particularly during the stage leading to structural failure. We believe that this is a useful contribution to the field as it provides a clearer and more practical appraisal of what to expect from such devices when deployed within real applications, raising important considerations for the selection of such devices over more classical power options such as batteries. This insight should motivate improvements in the design of these harvesters that would allow them to operate for much longer durations.
The rest of this communication is arranged as follows:
Section 2 shows the harvester configuration used for assessment, the experimental apparatus employed for testing, and the responses measured from our inverted flag.
Section 3 provides the results of the endurance testing conducted and discusses the observations made. Finally,
Section 4 provides the main conclusions of the work, as well as an outlook of how to improve the design of such devices.
2. Materials and Methods
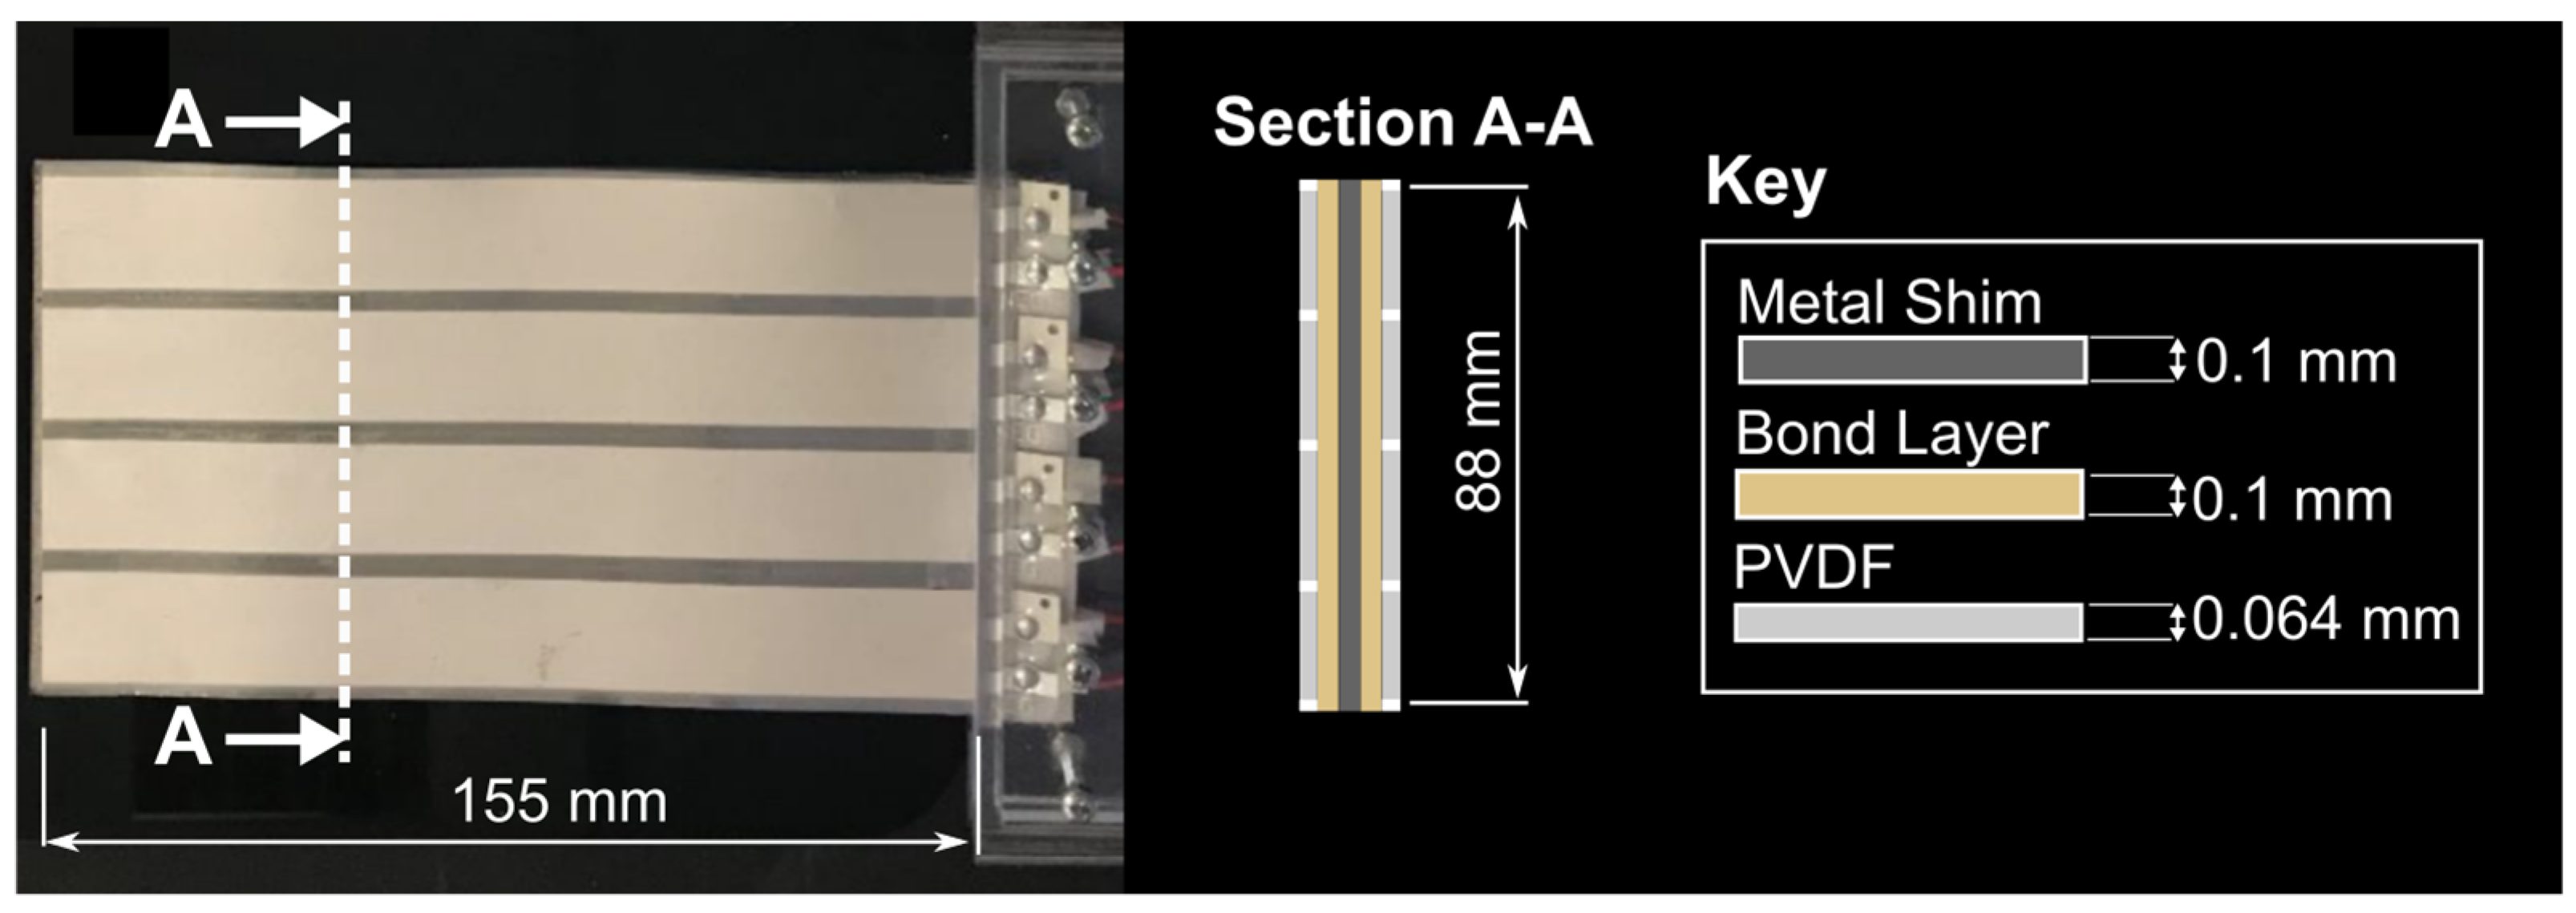
Figure 1 shows the present piezoelectric inverted flag, which is a composite bimorph comprising a passive metallic core and two active piezoelectric layers. Length and width of the inverted flag are 155 mm and 88 mm, respectively, corresponding to an aspect ratio of 1.76. The metallic core was realized using a 0.1 mm thick stainless-steel shim (density of 7900 kg/m
3 and Young’s modulus of 180 GPa) commercialized by Precision Brand (
www.precisionbrand.com, last accessed: 17 December 2021). The piezoelectric layers were realized using eight discrete PVDF strips, four on each side of the flag (model DT4-028K with thickness of 0.064 mm, density of 2280 kg/m
3, Young’s modulus of 2.8 GPa, and piezo-strain constant d
31 of 23 × 10
−12 C/N) commercialized by TE Connectivity (
www.te.com, accessed on 17 December 2021). The PVDF strips were bonded to the metal shim using 0.1 mm thick double-sided adhesive tape commercialized by Tesa (
www.tesa.com, accessed on 17 December 2021).
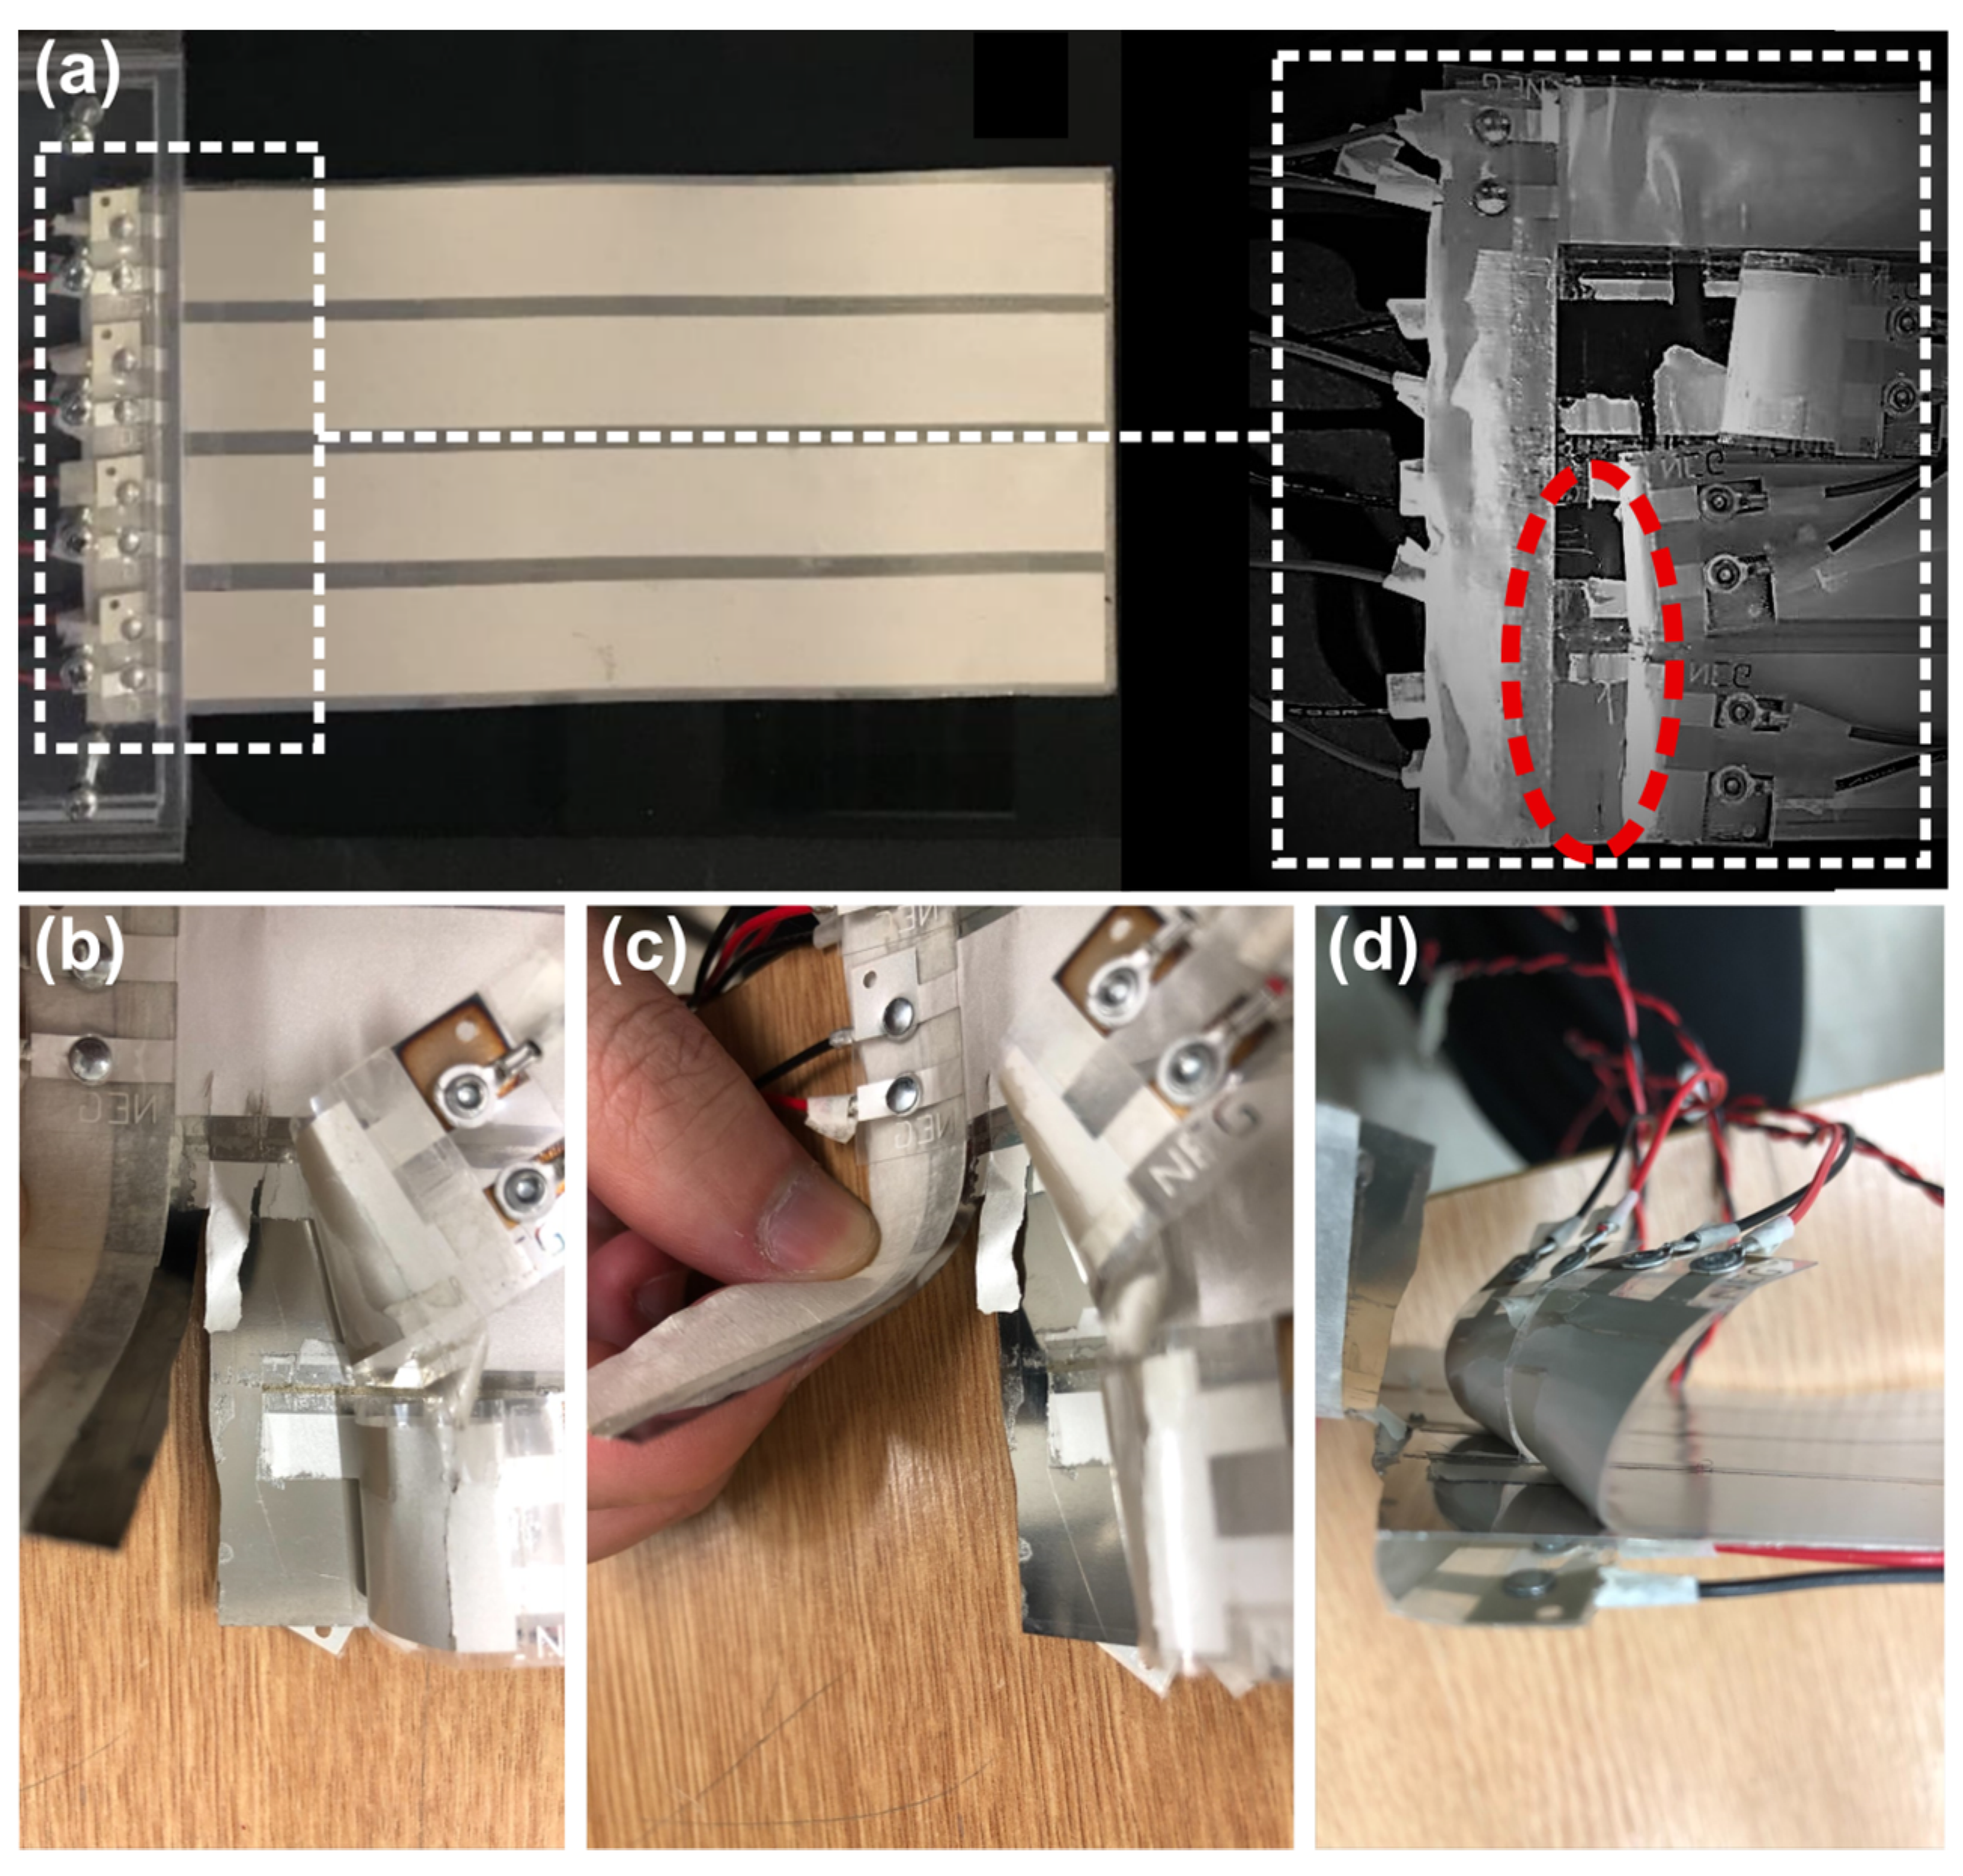
Note that the PVDF strips employed here are so loose that it is not possible to realize an inverted flag unless a more rigid supporting core is incorporated into the design—hence the inclusion of the metallic shim. Without the latter, the flag would be of no use (i.e., unable to realize the dynamic responses needed to enable energy harvesting) because it would fold over on itself, as shown in
Figure 2.
Although not considered here, an alternative would be to employ more rigid PVDF strips and realize a homogeneous/non-composite piezoelectric inverted flag without any supporting core, as done by Orrego et al. [
18] and Cioncolini et al. [
17]. Such non-composite inverted flags have, however, more restricted practical applicability because of the limited elasticity of the PVDF strips on their own. In contrast, composite inverted flags that include a supporting core, such as the one considered here, are broader in scope because of the wider range of operational wind speeds, reduced hysteresis, and greater flexibility in tailoring the flag design and performance for specific applications [
20].
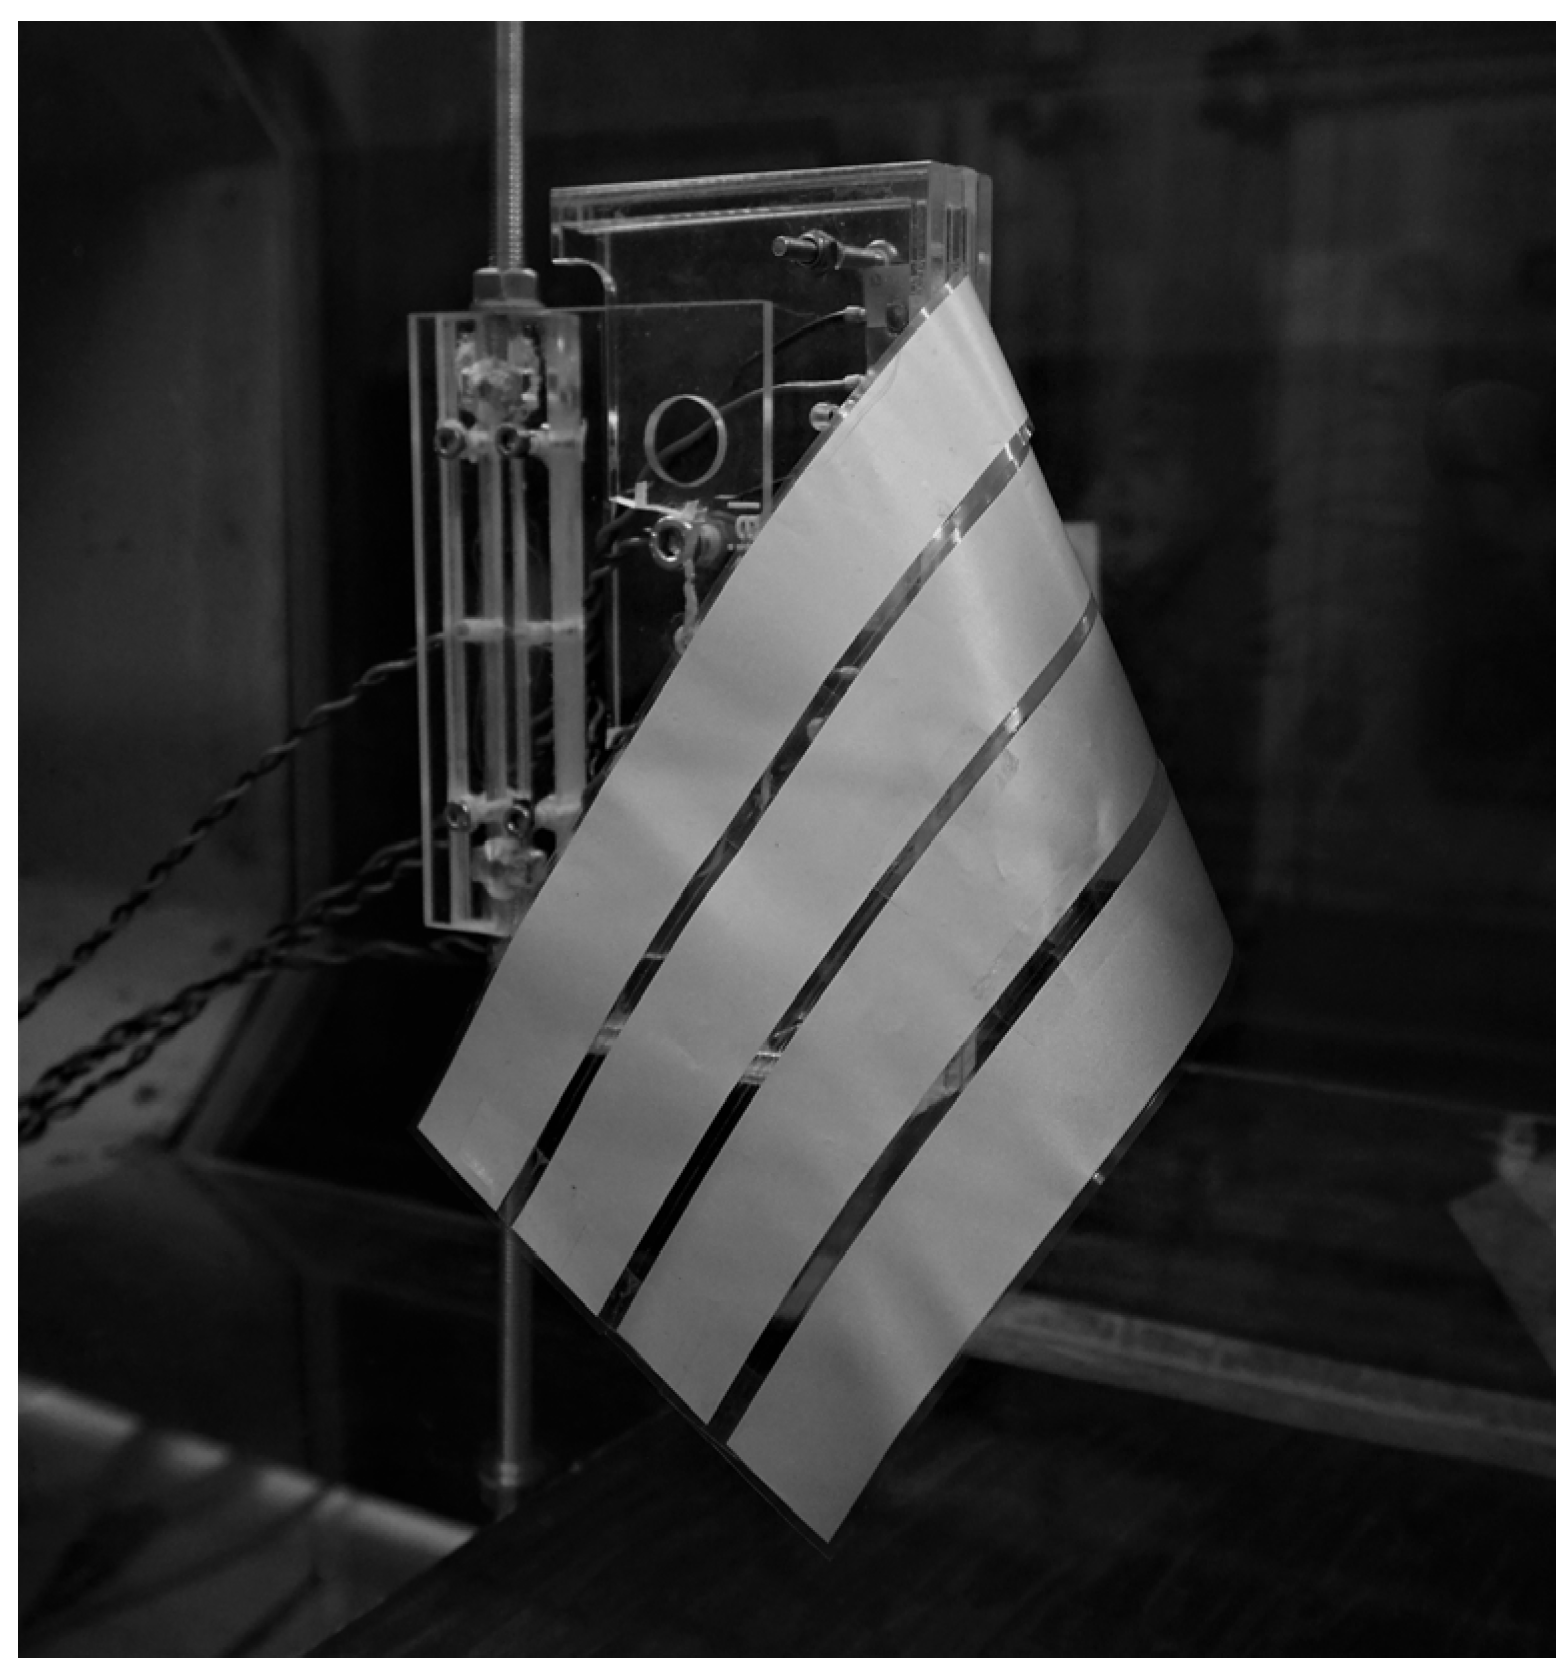
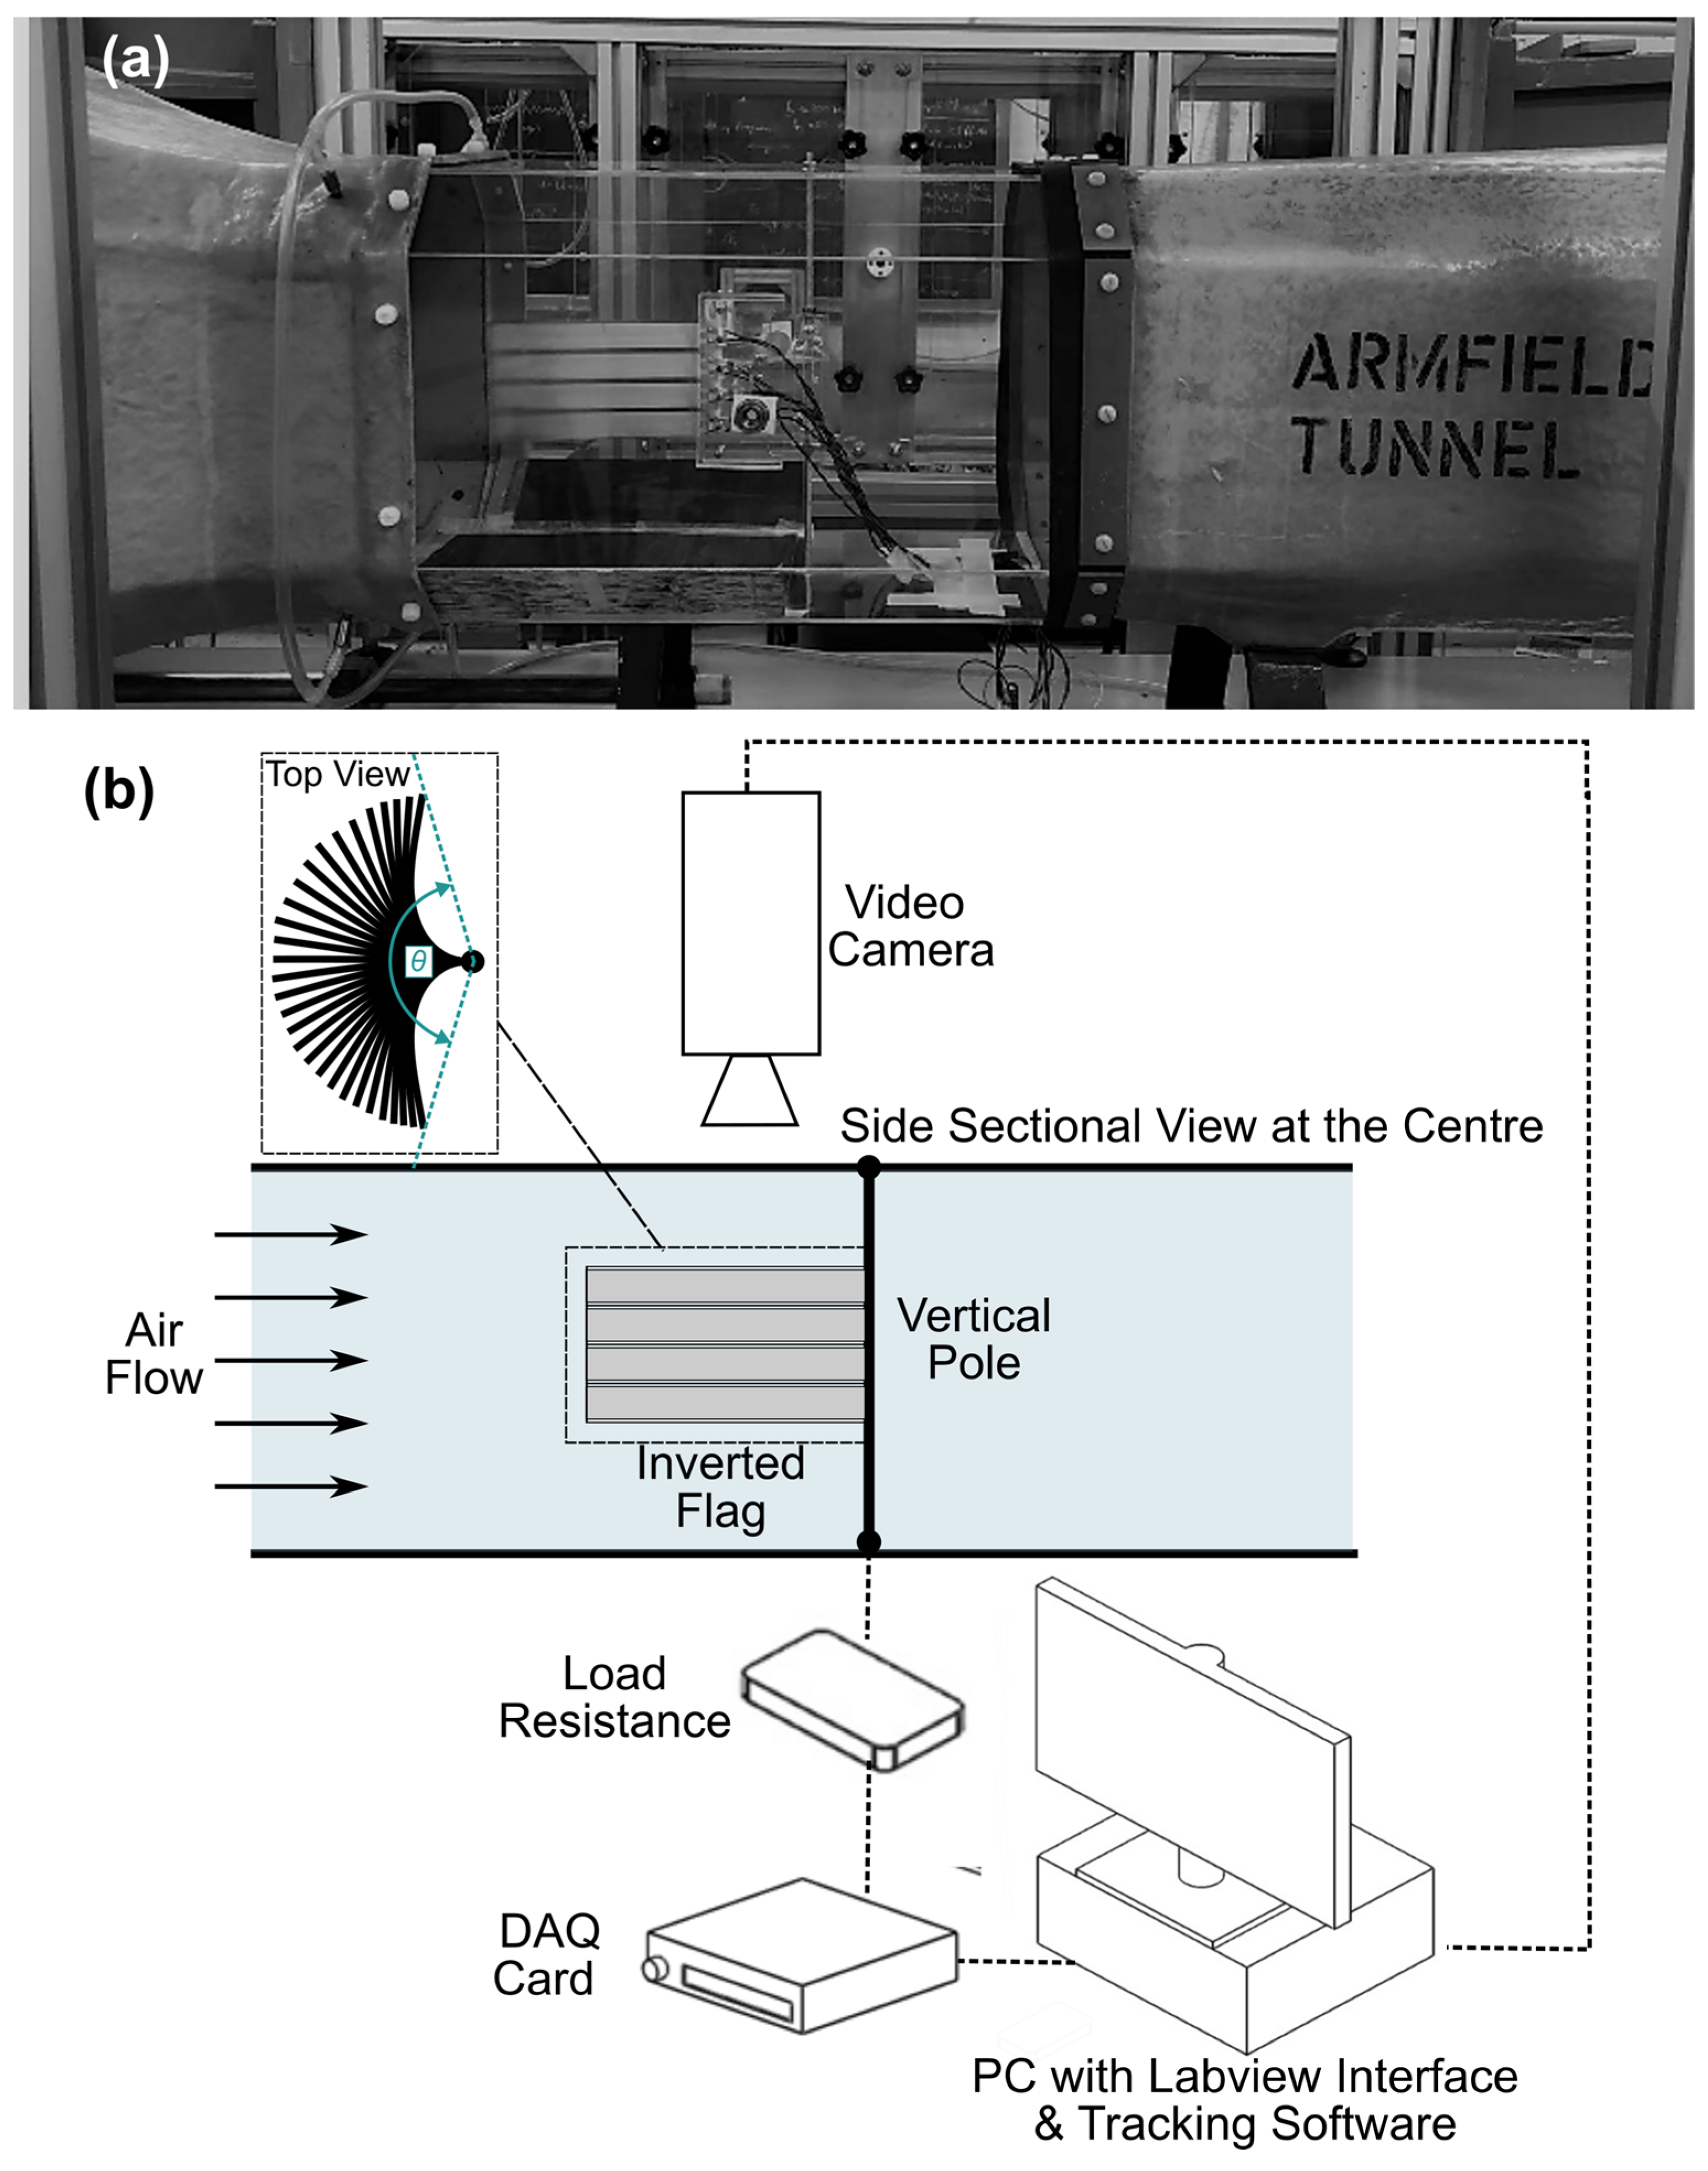
Figure 3a shows the piezoelectric inverted flag while being secured with a purpose-made Perspex clamp (also visible in
Figure 1 and
Figure 2) to a vertical pole located midway through a wind tunnel (by Armfield Limited,
www.armfieldonline.com, accessed on 17 December 2021) of octagonal cross-section (height and width of 350 mm). The clamp was designed to provide a cantilever boundary condition at the flag root. A preliminary characterization of the wind tunnel flow (not documented here) indicated that, under test conditions, the inverted flag was exposed to a fully developed velocity profile with turbulence intensity of 0.6%. The average airflow velocity through the wind tunnel was measured (to within ±5% error) with pressure transducers (SDP816 by Sensirion,
www.sensirion.com, accessed on 17 December 2021). All tests were carried out with air at ambient conditions (101 ± 1 kPa and 298 ± 1 K).
During the tests, the PVDF strips were connected in parallel to a load resistance. The optimum value of this latter is 450 kΩ, corresponding to the maximum power generation of the inverted flag, and was empirically determined by means of a variable resistance (Resistance Decade Box, model 1040) commercialized by Time Electronics (
www.timeelectronics.co.uk, accessed on 17 December 2021). A power scan was hence conducted, allowing the identification of the optimum load resistance value. It is understood that the optimum resistance may vary within the flapping range of velocities. Since our focus was the assessment of the mechanical durability, and not the maximization of the power output for a given wind speed, the optimum resistance identified as explained above was deemed appropriate for the scope of the study. The power generated by the inverted flag was collected with an external DAQ (NI-USB-6225 by National Instruments,
www.ni.com, accessed on 17 December 2021) controlled by LabVIEW 2017. Note that the power,
, values reported here (
Figure 4) are calculated from the measured voltage peak/amplitude,
, and the identified optimum load resistance,
, as follows:
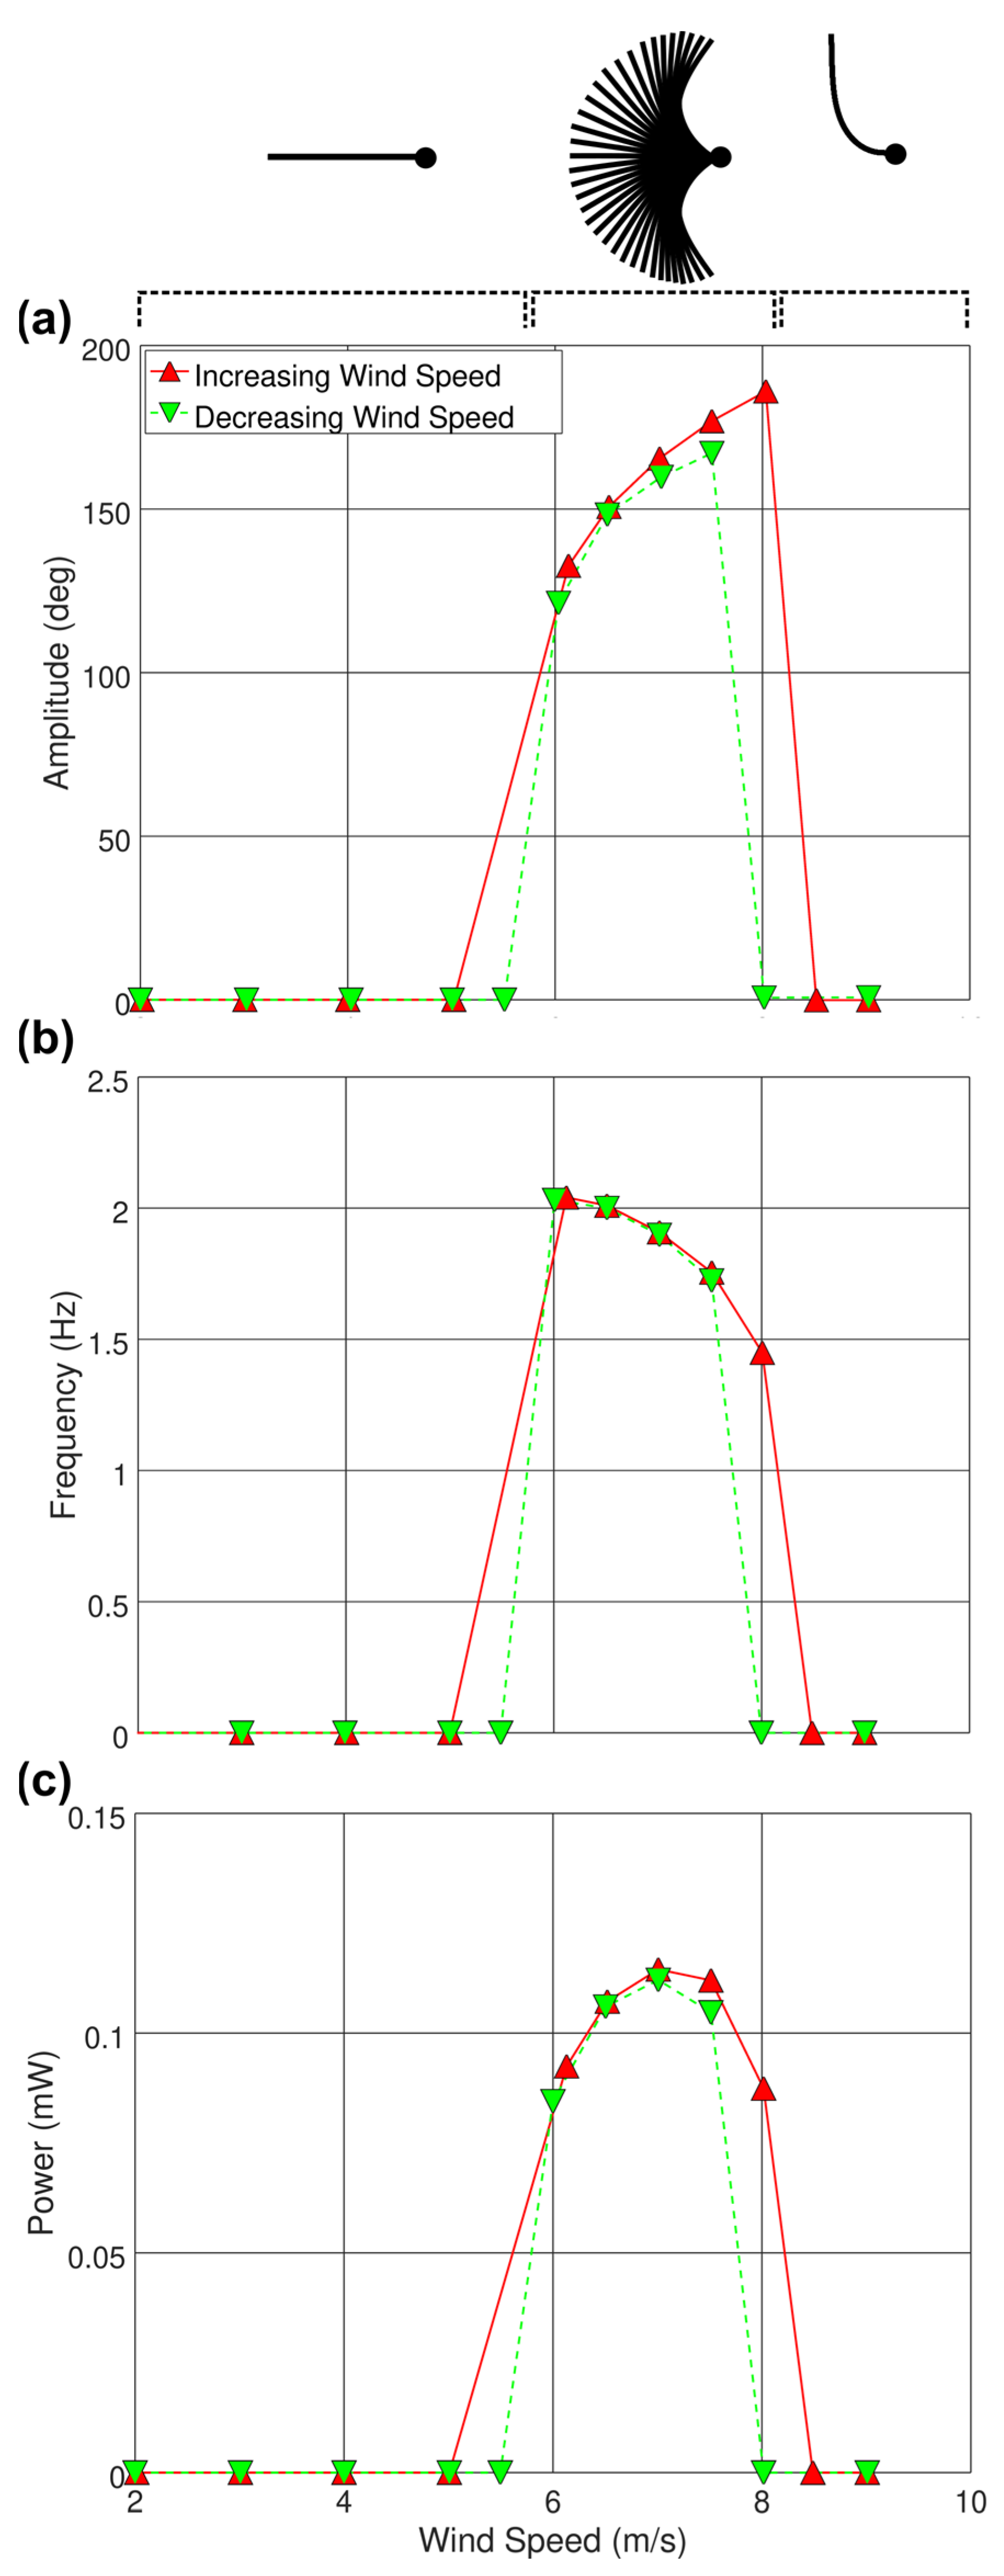
The endurance test was preceded and informed by a preliminary characterization of the flag response at different wind speeds, which is documented in Yang et al. [
20]. For convenience, the results are reproduced in
Figure 4, where the amplitude of motion (the angle between the two extreme positions of the flag during flapping; see
Figure 3b), the flapping frequency, and the power output are presented as functions of the wind speed. It is worth reiterating that the focus of the present study was to assess the mechanical durability of an inverted flag energy harvester. The power generation of inverted flags is discussed extensively in our previous study [
20], where power generation performance was also compared among different studies from the literature. Note that the preliminary characterization of the inverted flag was quick enough (it lasted less than one hour) to assume that the flag was still ‘fresh’ at the beginning of the endurance test.
Depending on the wind speed and on the flag’s mechanical properties, the dynamic response of an inverted flag will be one of the following: (a) static at rest or vibrating with very small amplitude around the rest position; (b) flapping oscillation of large amplitude; (c) flapping oscillation of small amplitude around a deflected configuration (not always observed); and (d) deflected. The modes evident for the flag considered in this study are shown as schematic insets at the top of
Figure 4. The dynamic response of interest for energy harvesting is clearly the large-amplitude flapping mode (b). Note that mode (c) is restricted to a very narrow wind velocity range, so, in practice, it may or may not be observed depending on how finely the wind velocity is scanned during the testing.
As can be noted in
Figure 4, the present flag remains at rest for wind speeds below 5–5.5 m/s, flaps for wind speeds between 6 m/s and 8 m/s, and fully deflects when the wind speed is above 8–8.5 m/s. Note the minor hysteresis between increasing and decreasing wind speed when the flag switches between different modes, which is normally observed for inverted flags. The deflected flapping mode (c) is not observed for this flag. As the wind speed is gradually increased from 6 m/s up to 8 m/s, the flapping amplitude gradually increases (from approximately 120 to approximately 180 degrees) whilst the flapping frequency gradually decreases (from approximately 2 to approximately 1.5 Hz). The piezoelectric power output, dependent on both the flapping amplitude and the flapping frequency, peaks (at approximately 0.12 mW) midway through the flapping range at a wind speed of approximately 7 m/s.
While a flag operated at 6 m/s undergoes more flapping cycles per unit time than a flag operated at 8 m/s, the higher amplitude motion of the latter leads to a larger bending stress. Noting basic cumulative damage theory such as Miner’s rule, which assumes an inverse linear relationship between cycles to failure and stress per cycle, we hypothesize that a higher number of cycles before failure will be achieved in the 6 m/s case. Further testing is required to establish the impact on cycles to failure of the higher-amplitude bending, i.e., the extent to which operational lifetime is reduced, but, in the first instance, we wanted to establish an estimate for the longest operation. Having established an upper limit in this way, it appears likely that the mechanical durability of the present flag is not yet adequate for long-term ‘deploy and forget’ applications, since, as described in the following section, the flag failed after approximately half a million flapping cycles.
3. Results and Discussion
The endurance test at a nominal wind speed of 6 m/s was completed during June 2021 and spanned 12 non-consecutive days, as indicated in
Table 1. When feasible, it is normally preferred to run endurance tests non-stop until failure. In the present case, this was not possible: Health and Safety regulations do not allow out-of-hours access to laboratories or unsupervised test-rig operation (Our laboratory was only accessible during normal working hours, with further restrictions in place to ensure social distancing in a multi-occupancy environment due to the COVID-19 outbreak). The testing schedule is presented in
Table 1. The ultimate cause of failure of the inverted flag was the formation of a crack in the metal core. The flags are extremely light, and, at rest, it is unlikely that their weight would impact crack growth between testing. Temperature variation in the laboratory was minimal throughout the testing. As such, interruption of the loading is assumed to have negligible impact on the final conclusion. Furthermore, the cyclic stop–start nature of these tests is arguably more representative of the operational conditions of these devices than a continual test.
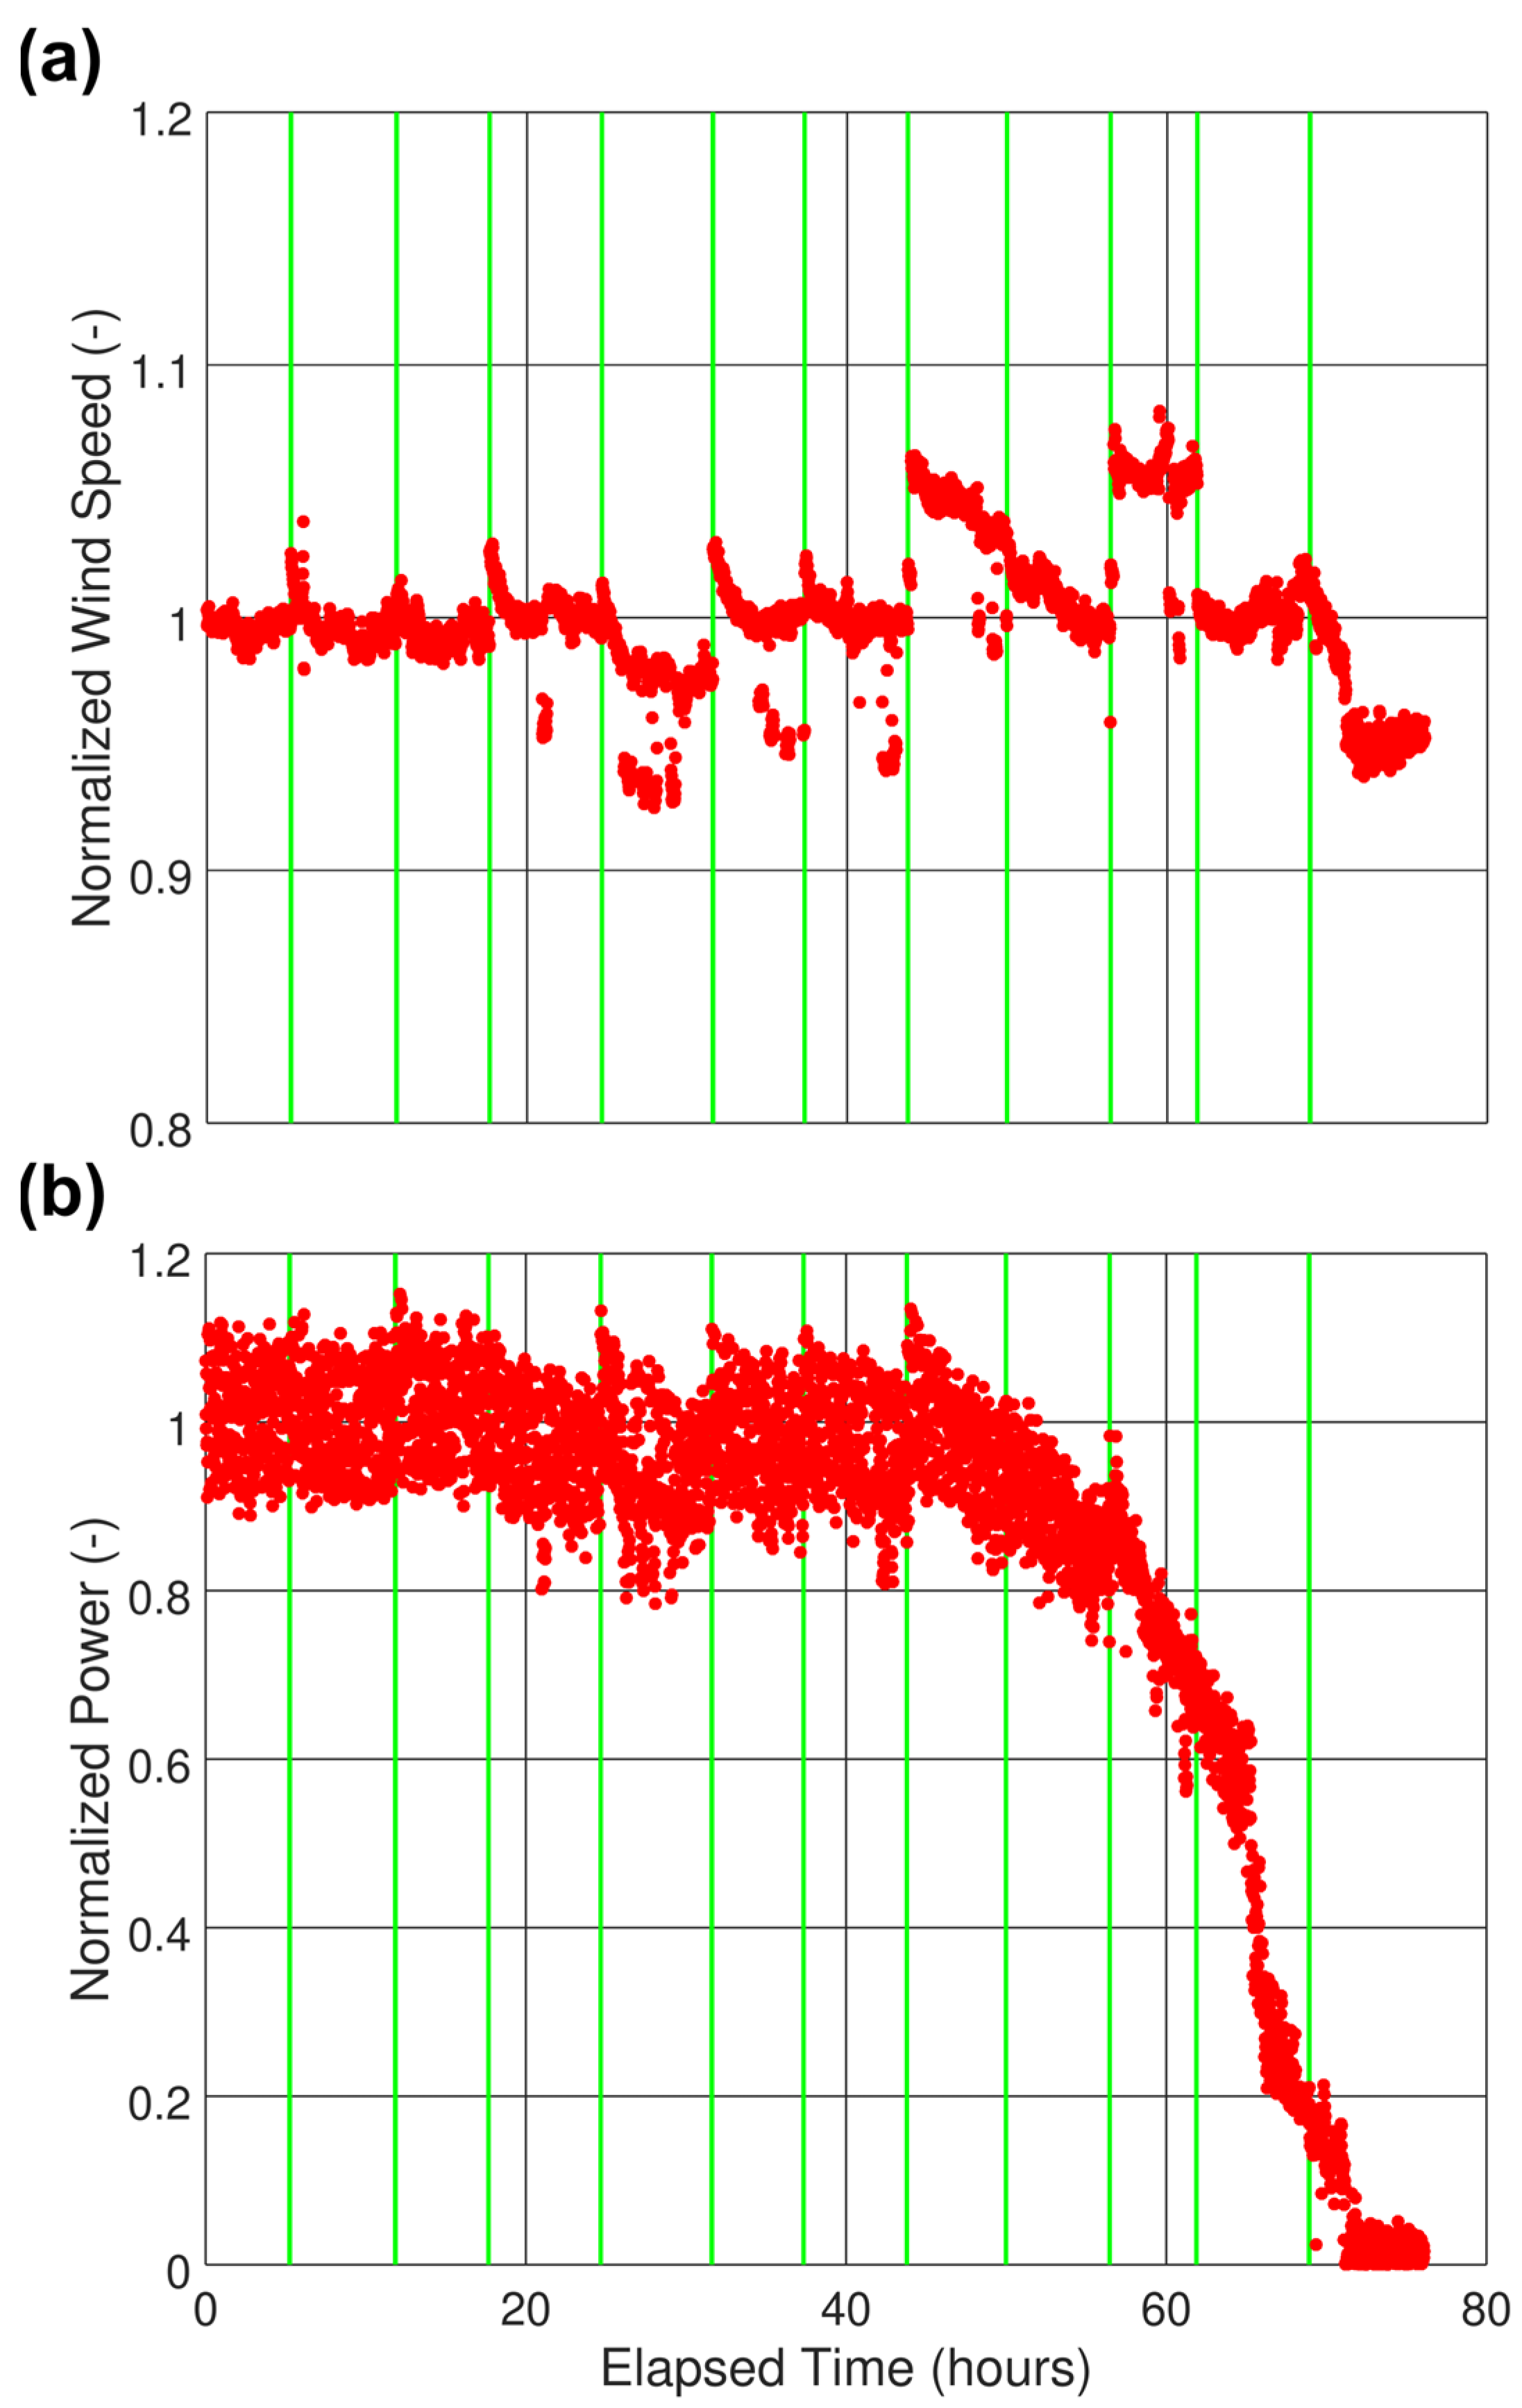
During the endurance test, the wind speed and the power output were recorded with a sampling frequency of one sample/minute, and the corresponding time histories are provided in
Figure 5 as normalized wind speed (the measured wind speed divided by the nominal value of 6 m/s) and normalized power (the measured power divided by the power output of 0.09 mW measured at the beginning of the test) versus elapsed time (i.e., cumulative time). The vertical lines in green included in
Figure 5 indicate when the testing was interrupted, as specified in
Table 1.
As can be noted in
Figure 5a, the wind speed remained fairly constant throughout the testing. There were clear discontinuities when the testing was interrupted and minor variations during a few test periods, but, overall, the variation was within 7–8% of the nominal value, which is comparable with the measuring error (as noted previously, the wind speed was measured to within ±5% error) and small enough to make the results informative.
The power output in
Figure 5b remained fairly constant for approximately 50 h, and then it gradually declined until the flag failed after around 70 h of testing. Subsequent inspection of the failed flag showed that the metal core was cracked, as can be noted in
Figure 6. Not surprisingly, the crack was vertically oriented and located close to the flag root, which is where stresses are concentrated in inverted flags and, more generally, in cantilevers under cyclic bending loading.
The rather gradual decline in power output observed in
Figure 5b suggests that the metal core crack initiated after around 50 h of operation, when the power started declining. A power reduction of around 20% was observed after 10 further hours of operation. A further 20% reduction to a normalized power of 0.6 then occurred at around twice this rate, from 60 to 65 h. A rapid decline was then observed, where the normalized power was reduced to a level of 0.2 in the space of 1–2 h. The decrease in power likely followed the gradual growth of the crack, which progressively limited the ability of the flag to flap and generate power. When the crack was large enough to completely impede flapping, the power output fell to zero. This happened after more than 70 h of elapsed time, corresponding to around half a million flapping cycles (at 6 m/s wind speed, the flag flapping frequency is of 2 Hz; see
Figure 4).
During the 50 h of successful operation before degradation begins, the present flag generates approximately 0.09 mW of power, which corresponds to 16.2 J of energy. In order to put this result into perspective, we refer to market-available low-power temperature sensors for portable applications as a representative example. These sensors have power consumption on the order of ~10–100 µW when operated at a sampling frequency on the order of ~1 sample/s, which corresponds to an energy consumption on the order of 10–100 µJ/sample (note that the standby power consumption of these sensors is a few percent of their nominal power consumption, meaning that they practically consume power only when actively sampling). The energy generated by the present flag would suffice for a number of samplings on the order of 105–106, corresponding to a few days of continuous operation at a sampling frequency on the order of ~1 sample/s, or a few months of continuous operation at a sampling frequency on the order of ~1 sample/minute. This might suffice for low-power applications where a relatively low sampling frequency is adequate, such as structural integrity monitoring, environmental monitoring, animal tracking, and agriculture management, but it is inadequate for applications requiring higher sampling frequencies or more power-demanding sensors.
Our current research on inverted flags is therefore focused on improving the fatigue resistance of the metallic shim core to increase the mechanical durability of the flag. In particular, we are considering different metals besides the stainless-steel that we have used so far, particularly metals fabricated using techniques that reduce the number of internal defects, and/or metals that have been pre-treated to harden the outer surface. An alternative option that is worth considering but has not yet been explored is to employ highly fatigue-resistant composites for the flag core, such as those that are gradually being introduced in the aerospace industry.
4. Concluding Remarks
Inverted flags have been demonstrated to be an attractive configuration for wind energy harvesting, employing flexible piezoelectric materials (PVDF) to benefit from the high-amplitude oscillations. Many recent studies have highlighted the potential for such devices to power remote sensors, where batteries become a less favorable option and a ‘deploy and forget’ solution becomes a necessity. Similarly, there is a substantial body of research on the dynamics of these devices, based primarily on numerical and theoretical models. To the best of the authors’ knowledge, no previous work on inverted flags has reported prolonged operation leading to structural fatigue and failure.
To address this, the present work provides an initial practical assessment of the endurance of an inverted flag energy harvester, tested over multiple days in a wind tunnel. The inverted flag is a composite bimorph, composed of PVDF strips combined with a passive metallic core to provide sufficient stiffness. The flag, which was tested while flapping with an amplitude of ~120 degrees and a frequency of ~2 Hz, generates a constant power of ~0.09 mW in a wind velocity of 6 m/s. The flag was observed to complete cycles before failure, corresponding to 70 h of operation. The energy generated in this period is estimated to be sufficient to power a standard low-power temperature sensor for several months at a sampling rate of one sample/minute. During the first 50 h of operation, the performance is demonstrated to be constant, within around 10% of the average over this period. Structural fatigue is observed to take hold after 50 h, with a gradual decline in performance for 15 h thereafter, before a dramatic decline and failure.
This work highlights the need to address structural resilience of energy-harvesting devices before they can realize their potential for the long-term provision of power to remote sensors. Ongoing work will consider the fatigue resistance of the metal core to prolong this performance.


