1. Introduction
The common presence of artificial light of different spectra, both during the day and night, has a significant influence on our psychology and physiology, including psychophysical performance and alertness. The state of human alertness is subject to circadian changes, which are controlled by the biological clock located in the suprachiasmatic nuclei (SCN) of the hypothalamus. The perception of light by melanopsin in the intrinsically photosensitive retinal ganglion cells (ipRGCs) and the related secretion of melatonin into the bloodstream play a very important role in the processes of controlling the circadian rhythm [
1,
2,
3].
With the increase in the amount of light with a specific spectral distribution that reaches the ipRGCs, the inhibited secretion of melatonin is stronger. Inhibiting the secretion of melatonin means for the human body that it is daytime—a state of wakefulness. The lack of light is a signal for the pineal gland to produce melatonin and thus prepare the human body for the sleep phase [
3]. This way, the increased level of melatonin in the bloodstream informs the body about the initiation of night-time processes such as sleep, lowering the core body temperature, or slowing down the heart rate [
4]. On the other hand, bright white light or monochromatic light, especially in the range of 420–550 nm, inhibits the secretion of melatonin and prepares the body to the ready state [
3]. Thanks to this, by using light with a specific spectral distribution and intensity at different times of the day and night, it is possible to influence both the level of alertness and psychophysical performance of a human as well as their circadian rhythm. It is assumed that the daily changes in psychophysical performance, alertness, and emotions are conditioned by the effect of light as one of the main synchronizers of the circadian rhythm. Exposure to light of a certain color increases or decreases the secretion of melatonin, which determines the level of human alertness.
In this article, the definition of alertness was adopted as a person’s condition characterized by correct perception of stimuli and quick and adequate response, increased involvement, and stimulation, which have a positive effect on the efficiency and quality of task performance. An indirect indicator of alertness is psychophysical performance, which can be assessed using objective and subjective methods.
Daily changes in the ability to work physically and mentally are also described by the so-called Lehmann curve [
5], which illustrates the circadian cycle of human alertness. It shows that the level of the ability to work is slightly reduced in the early-afternoon period (between 1:00 and 3:00 p.m.) and significantly reduced during the night (between 12:00 and 5:00 a.m.). The lowering of night-time alertness is due to higher levels of melatonin. Night shift workers may experience increased levels of sleepiness, poorer hand–eye coordination, and longer reaction times. The problem of lowering the level of alertness and increasing sleepiness in the afternoon hours (named as “post-lunch dip effect” [
3]) is the effect of the two phenomena that contribute to this: the homeostatic sleep drive and the circadian rhythm.
The regulation of physiological processes through the influence of light in order to increase the psychophysical performance has been the subject of research for over twenty years. In the first period of research, attempts were made to interact with light, which inhibits the secretion of melatonin and thus increases the level of alertness. Research conducted in 2001 [
6,
7] showed that light in the range of 425–560 nm is effective in inhibiting the secretion of melatonin, especially blue light with a wavelength of approximately 460–480 nm. In the next period, it was shown that the exposure to blue light increases the level of alertness [
8,
9,
10]. It has been demonstrated that the amount of light needed to reduce melatonin secretion depends on the spectral characteristics of radiation and the age group of the respondents [
11]. Older people require much more light not only for proper vision, but also for the proper course of photobiological processes.
Later, the information began to appear about the negative aspect of the influence of blue light on humans. This applies to the negative health consequences resulting from disturbances in the circadian rhythm and the exposure of the eye’s retina to blue light (blue-light hazard) [
12]. Increasing the level of alertness by reducing the content of melatonin in the blood due to excessive exposure to blue light may contribute to the activation of hormone-dependent cancers [
13,
14]. It has been shown that the inhibition of melatonin secretion when exposed to red light is significantly lower than to blue and white light [
9,
15,
16,
17]; it increases the level of alertness both in the morning and at night. Therefore, it was found that a strong inhibition of melatonin secretion is not needed to increase the level of human alertness. It is also claimed that emotions caused by a given color of light may play an important role in increasing daytime alertness [
18].
Alertness tests are mainly based on monitoring the level of melatonin in blood, urine, or saliva and on subjective assessments of the respondents—assessment of sleepiness, fatigue, as well as visual and psychomotor performance tests [
6,
7,
16]. Apart from the assessment of the melatonin level in the blood, EEG signal recordings are used [
8,
9,
10,
15,
19,
20]. Alpha and theta waves were analyzed to assess the level of alertness. An additional indicator of the level of alertness/sleepiness in subjective assessments was the result of the Karolinska Sleepiness Scale (KSS) survey [
9,
10,
15,
16,
17,
21], which was used together with the assessment of EEG indicators for the tests of driver drowsiness [
22,
23]. In research on the level of vigilance, the so-called PVT test (Psychomotor Vigilance Test) is used to assess psychomotor performance–reaction time and the number of errors, the reliability and practical value of which for testing sleepiness/alertness has been repeatedly confirmed [
8,
18,
22,
23,
24,
25,
26,
27].
One of the psychomotor vigilance tests to indirectly assess the level of alertness or sleepiness is the GONOGO test [
9,
15,
17,
21]. It assesses the efficiency of attention, perceptiveness, and the ability to select a reaction by inhibiting an undesirable reaction and by an appropriate rate of the desired reaction. The test involves cognitive decision-making processes in controlling one’s own behavior. The literature on the subject documented the relationship between the test result and the indicators of the brain’s electrical activity measured by recording the EEG signal [
28]. Therefore, this test is used in testing the level of alertness with EEG signal recording [
17,
28,
29]. By assessing the level of alertness in e.g., EEG recording and measuring the quality of performance in standard performance tests, it is possible to conclude about the relationship between physical working conditions, e.g., in different lighting, and the level of alertness of employees.
Referring to the current trends in research on the effect of the color of light on the level of human alertness, studies were carried out to determine the impact of exposure to different colors of light on the psychophysical performance of white-collar workers in the age groups 55+ and 22–34 years old during the early afternoon drop off in work capacity (“post-lunch dip effect”). The analysis of alertness included the results of electroencephalographic (EEG) recording, electrooculographic (EOG) recording, subjective level of alertness/sleepiness, and psychophysical performance tests. In this article, only the results of psychophysical tests assessing the state of attention and perceptiveness, mood, and fatigue as well as psychomotor performance are discussed.
The aim of the article is to present the results of research on psychophysical performance after the exposure to a different color of light and to determine whether the psychophysical performance tests selected for the study can be recommended as a simple tool for alertness assessment, which could be used both by lighting designers and employers or safety officers.
2. Materials and Methods
2.1. Characteristic of Study Group
The total number of respondents was 50, including 30 people from the 55+ group and 20 from the 22–34 age group. Basic data on the study group characteristic are presented in
Table 1. Moreover, the controlled variable was the chronotype of the respondents (determined according to Horne–Ostberg). The subjects completed the daily sleepiness profile questionnaire seven days before the tests and on the day of the test. The starting time of the afternoon study, i.e., when the sleepiness occurred, took into account the individual’s sleepiness profile. Thus, the natural shift in sleep and wake periods in people of different chronotypes was taken into account.
Based on the general questionnaire of the respondent, the following aspects were checked: education, work experience, and habits of the respondents concerning: drinking coffee and other caffeinated beverages, smoking, problems with sleep, and sleepiness during the working day. In the 55+ group, job seniority was not less than 20 years of work, while in the control group, it was not more than 10 years of work.
The authors tried to eliminate additional (known) factors that could have affected the results of the conducted experiments. The following factors were taken into account when qualifying for the experimental group: temperamental traits, good general health (including no history of neurological and psychiatric diseases), no sleep problems, no use of psychotropic or neurological drugs, normal eye condition (no color recognition disorders), chronotype (neither definitely morning, nor definitely evening), basic computer skills, and no travels with crossing two time zones in the last year.
The number of participants in the 22–34 group and the 55+ group was not equal. The Chi-square test showed that the differences between the groups were statistically insignificant (for p > 0.05). This means that it can be assumed that a similar number of people (statistically) in the groups 22–34 and 55+ were taken into account in the experiment. This authorizes further statistical analysis (comparison) in particular tests.
2.2. Lighting Conditions—Exposure to Light
The study used three light scenes of different colors that occurred during a 40-min exposure in the early afternoon:
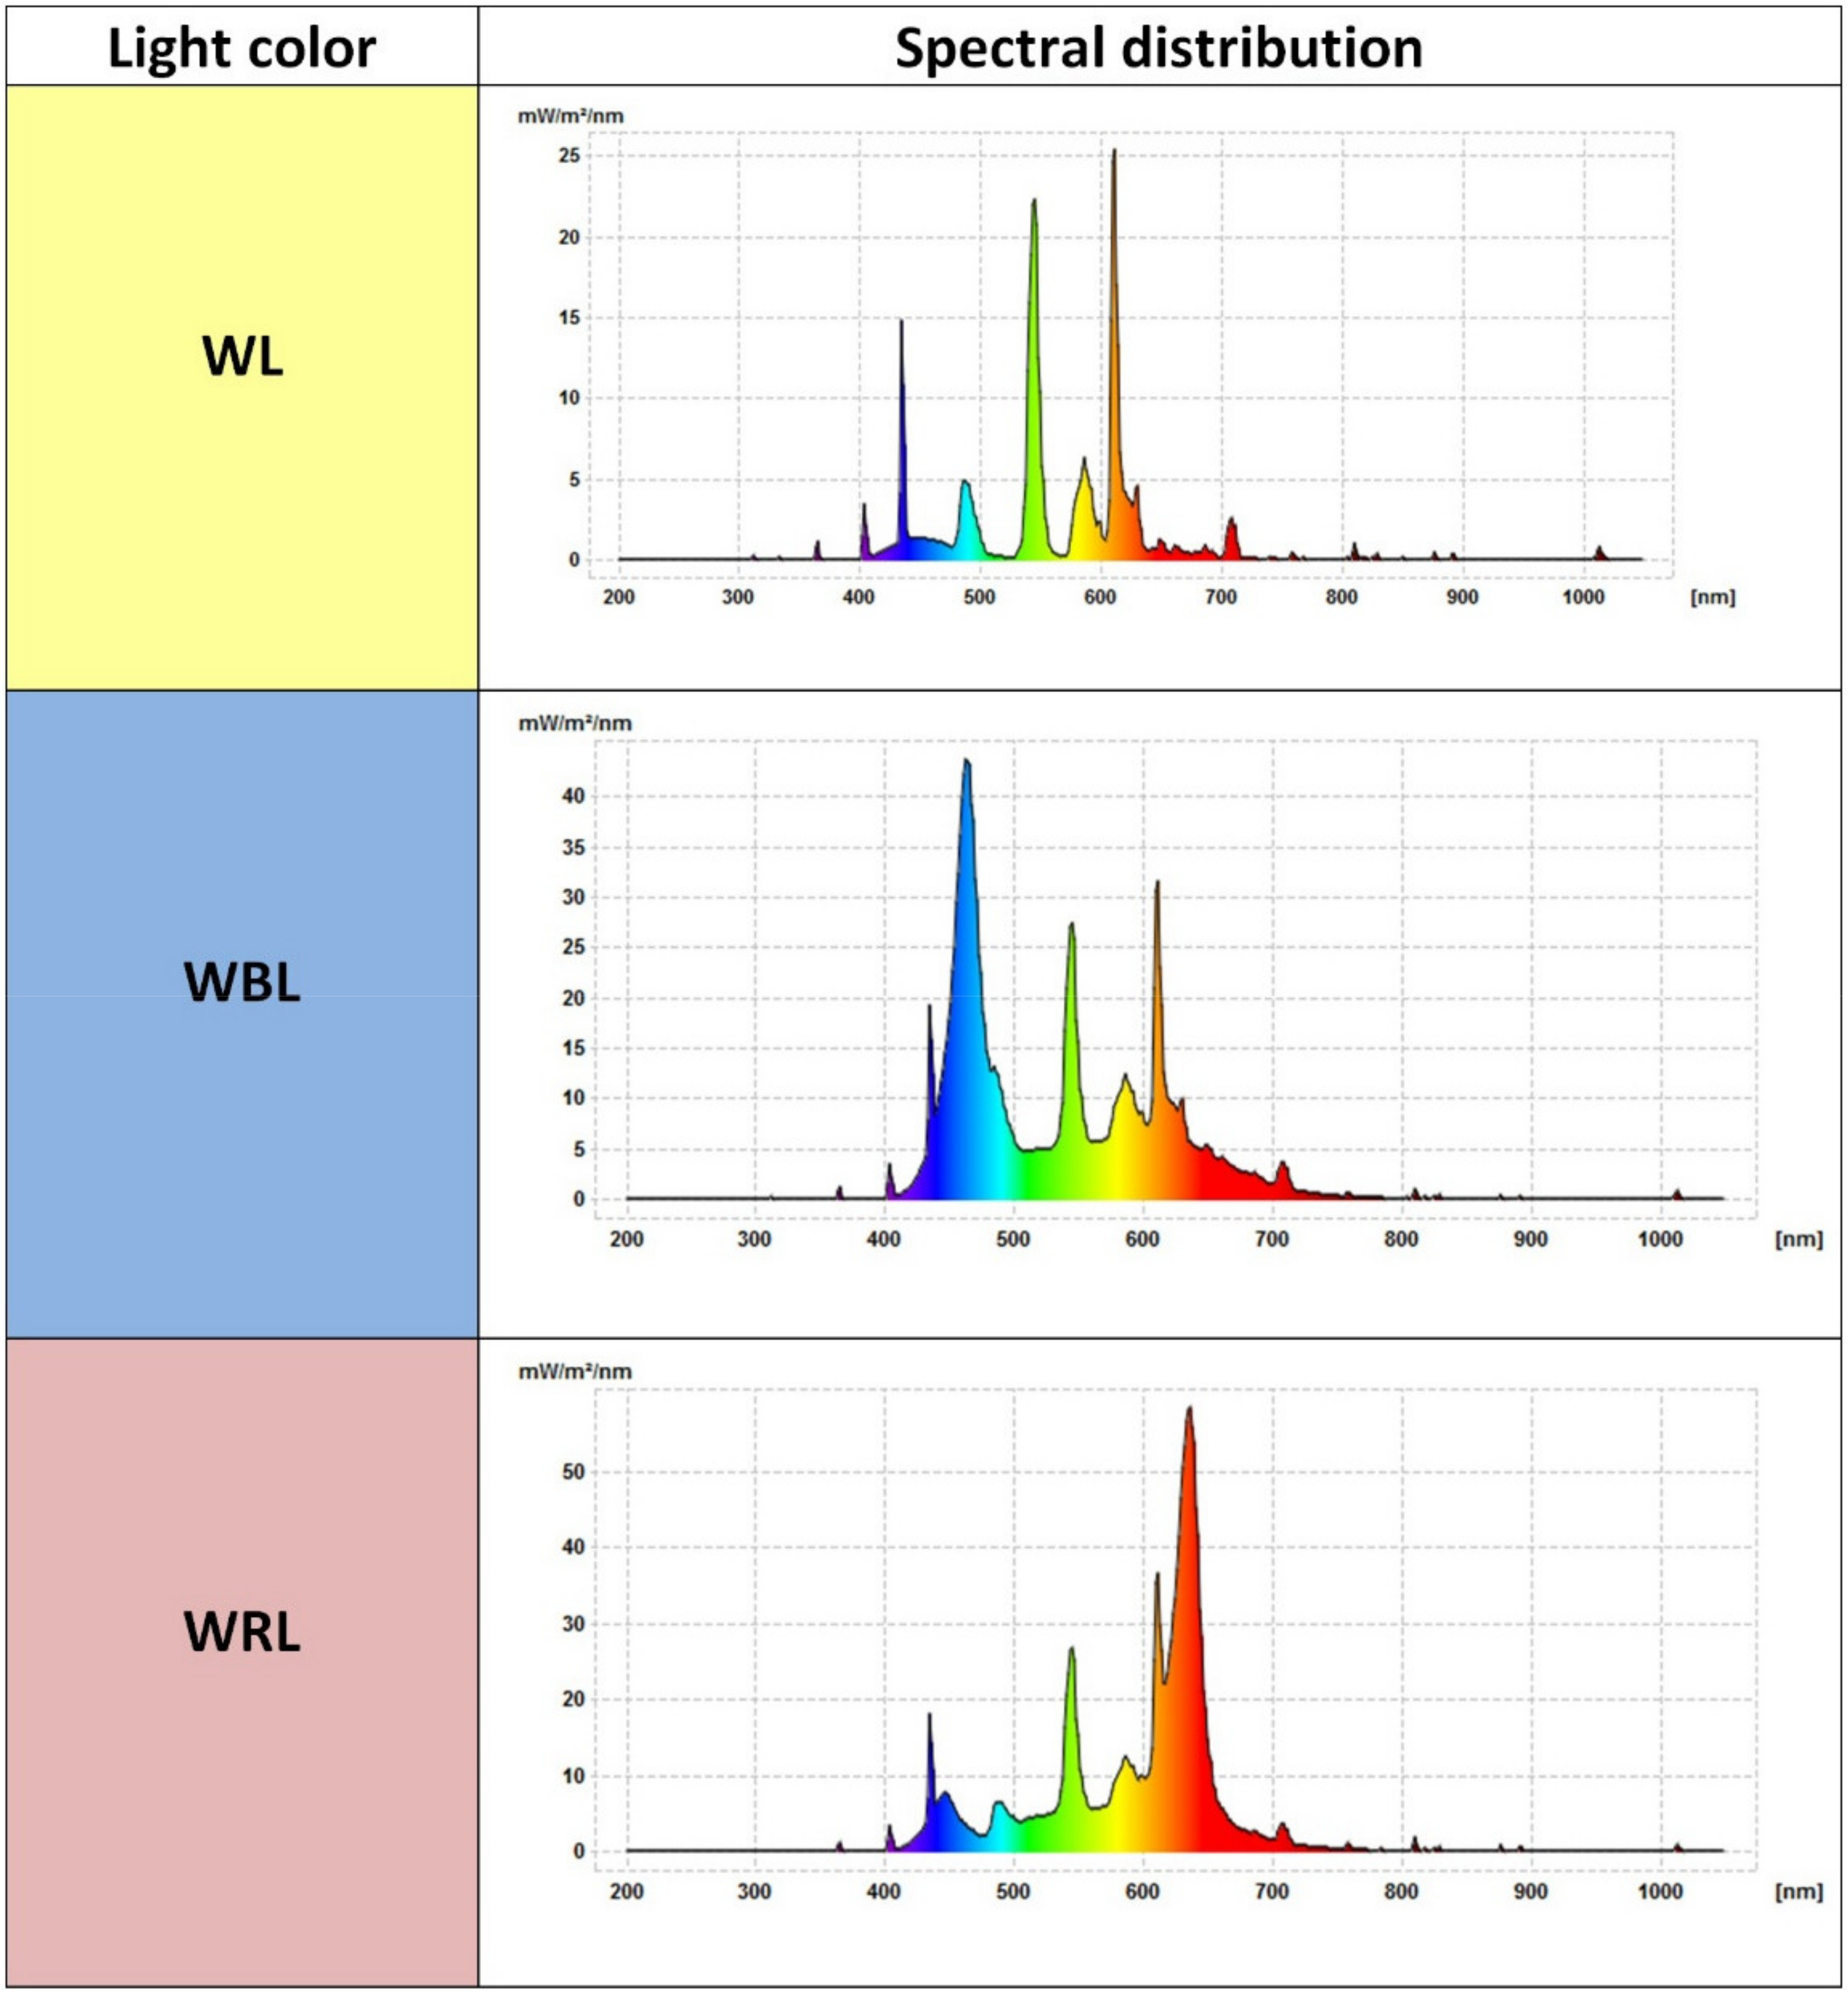
Reference scene (white)—white light (WL: correlated color temperature—Tc = 4000 K, color rendering index—Ra > 80);
Blue scene—white light enriched with blue light (WBL: additionally turned on blue LEDs, λmax = 470 nm and white Tc = 4000 K in the luminaire located above the head of the examined person);
Red scene—white light enriched with red light (WRL: additionally turned on red LEDs, λmax = 630 nm and white Tc = 4000 K in the luminaire located above the head of the examined person).
Taking into account the application nature of the research results, the spectral distributions of the irradiance for individual light scenes are presented in
Figure 1. The maximum effective irradiance in inhibiting melatonin secretion (E
mmax) was measured at the subject’s eyes in vertical plane and amounted respectively to 0.258 W/m
2 at the reference scene, 1.535 W/m
2 at the blue scene, and 0.574 W/m
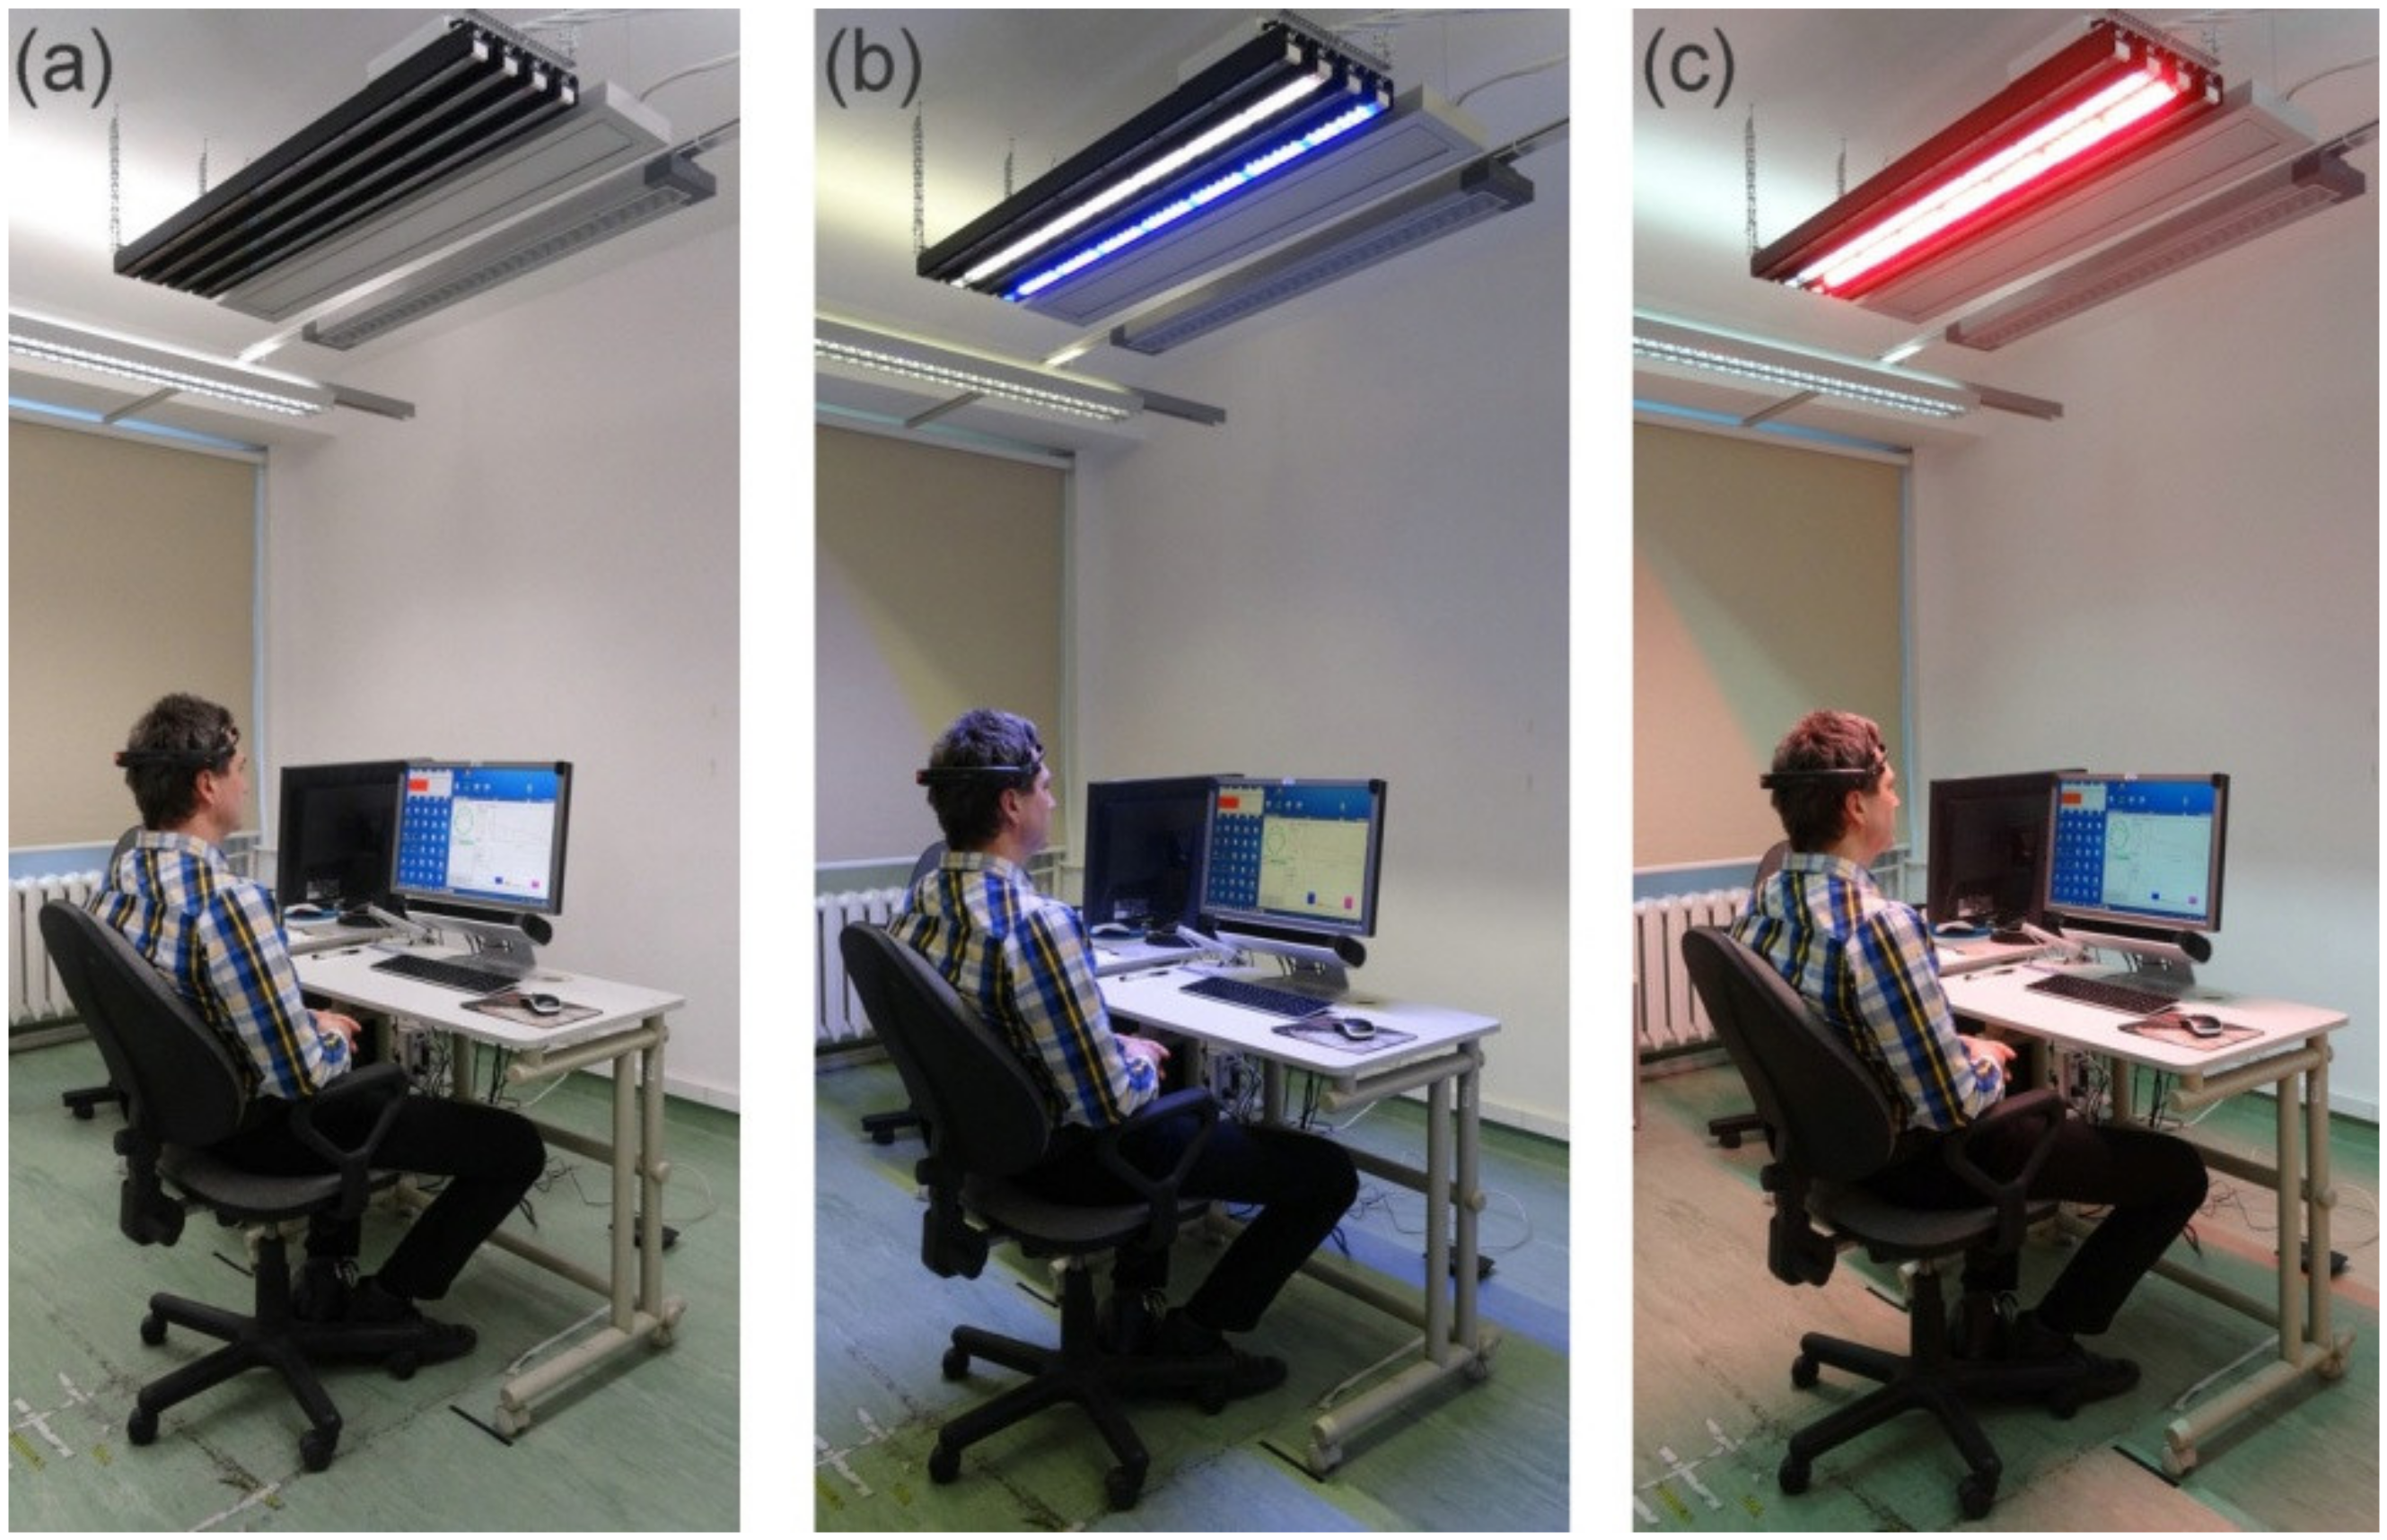
2 at the red scene. Due to the fact that during the exhibition, the subject was sitting on a stand with a computer over which there was a lighting fixture with blue or red LEDs turned on, the range of changes to the effective irradiance was negligibly small and resulted only from the subject’s torso and head movements at that time. The lighting was located above the subject’s head and did not cause glare. The view of the test stand during the test at specific light scenes is shown in
Figure 2. In all three cases, the only additional light source was a computer monitor, which is common work equipment for the office workers who constituted the study group. The monitor had been checked, and the way of its operation (spectral distribution) had been standardized for all the conducted experiments. The light emitted by the monitor was not changed during the experiments (in all scenes), and it was assumed that it should not affect the course of the experiment.
In addition, we took care of the environmental conditions at the place where the experiments were carried out. The same physical environment conditions (temperature, humidity) were maintained in the laboratory throughout the study. The laboratory where the experiments were carried out is practically not exposed to any external noise, so the acoustic conditions were also the same.
2.3. Procedure for Conducting Experiments
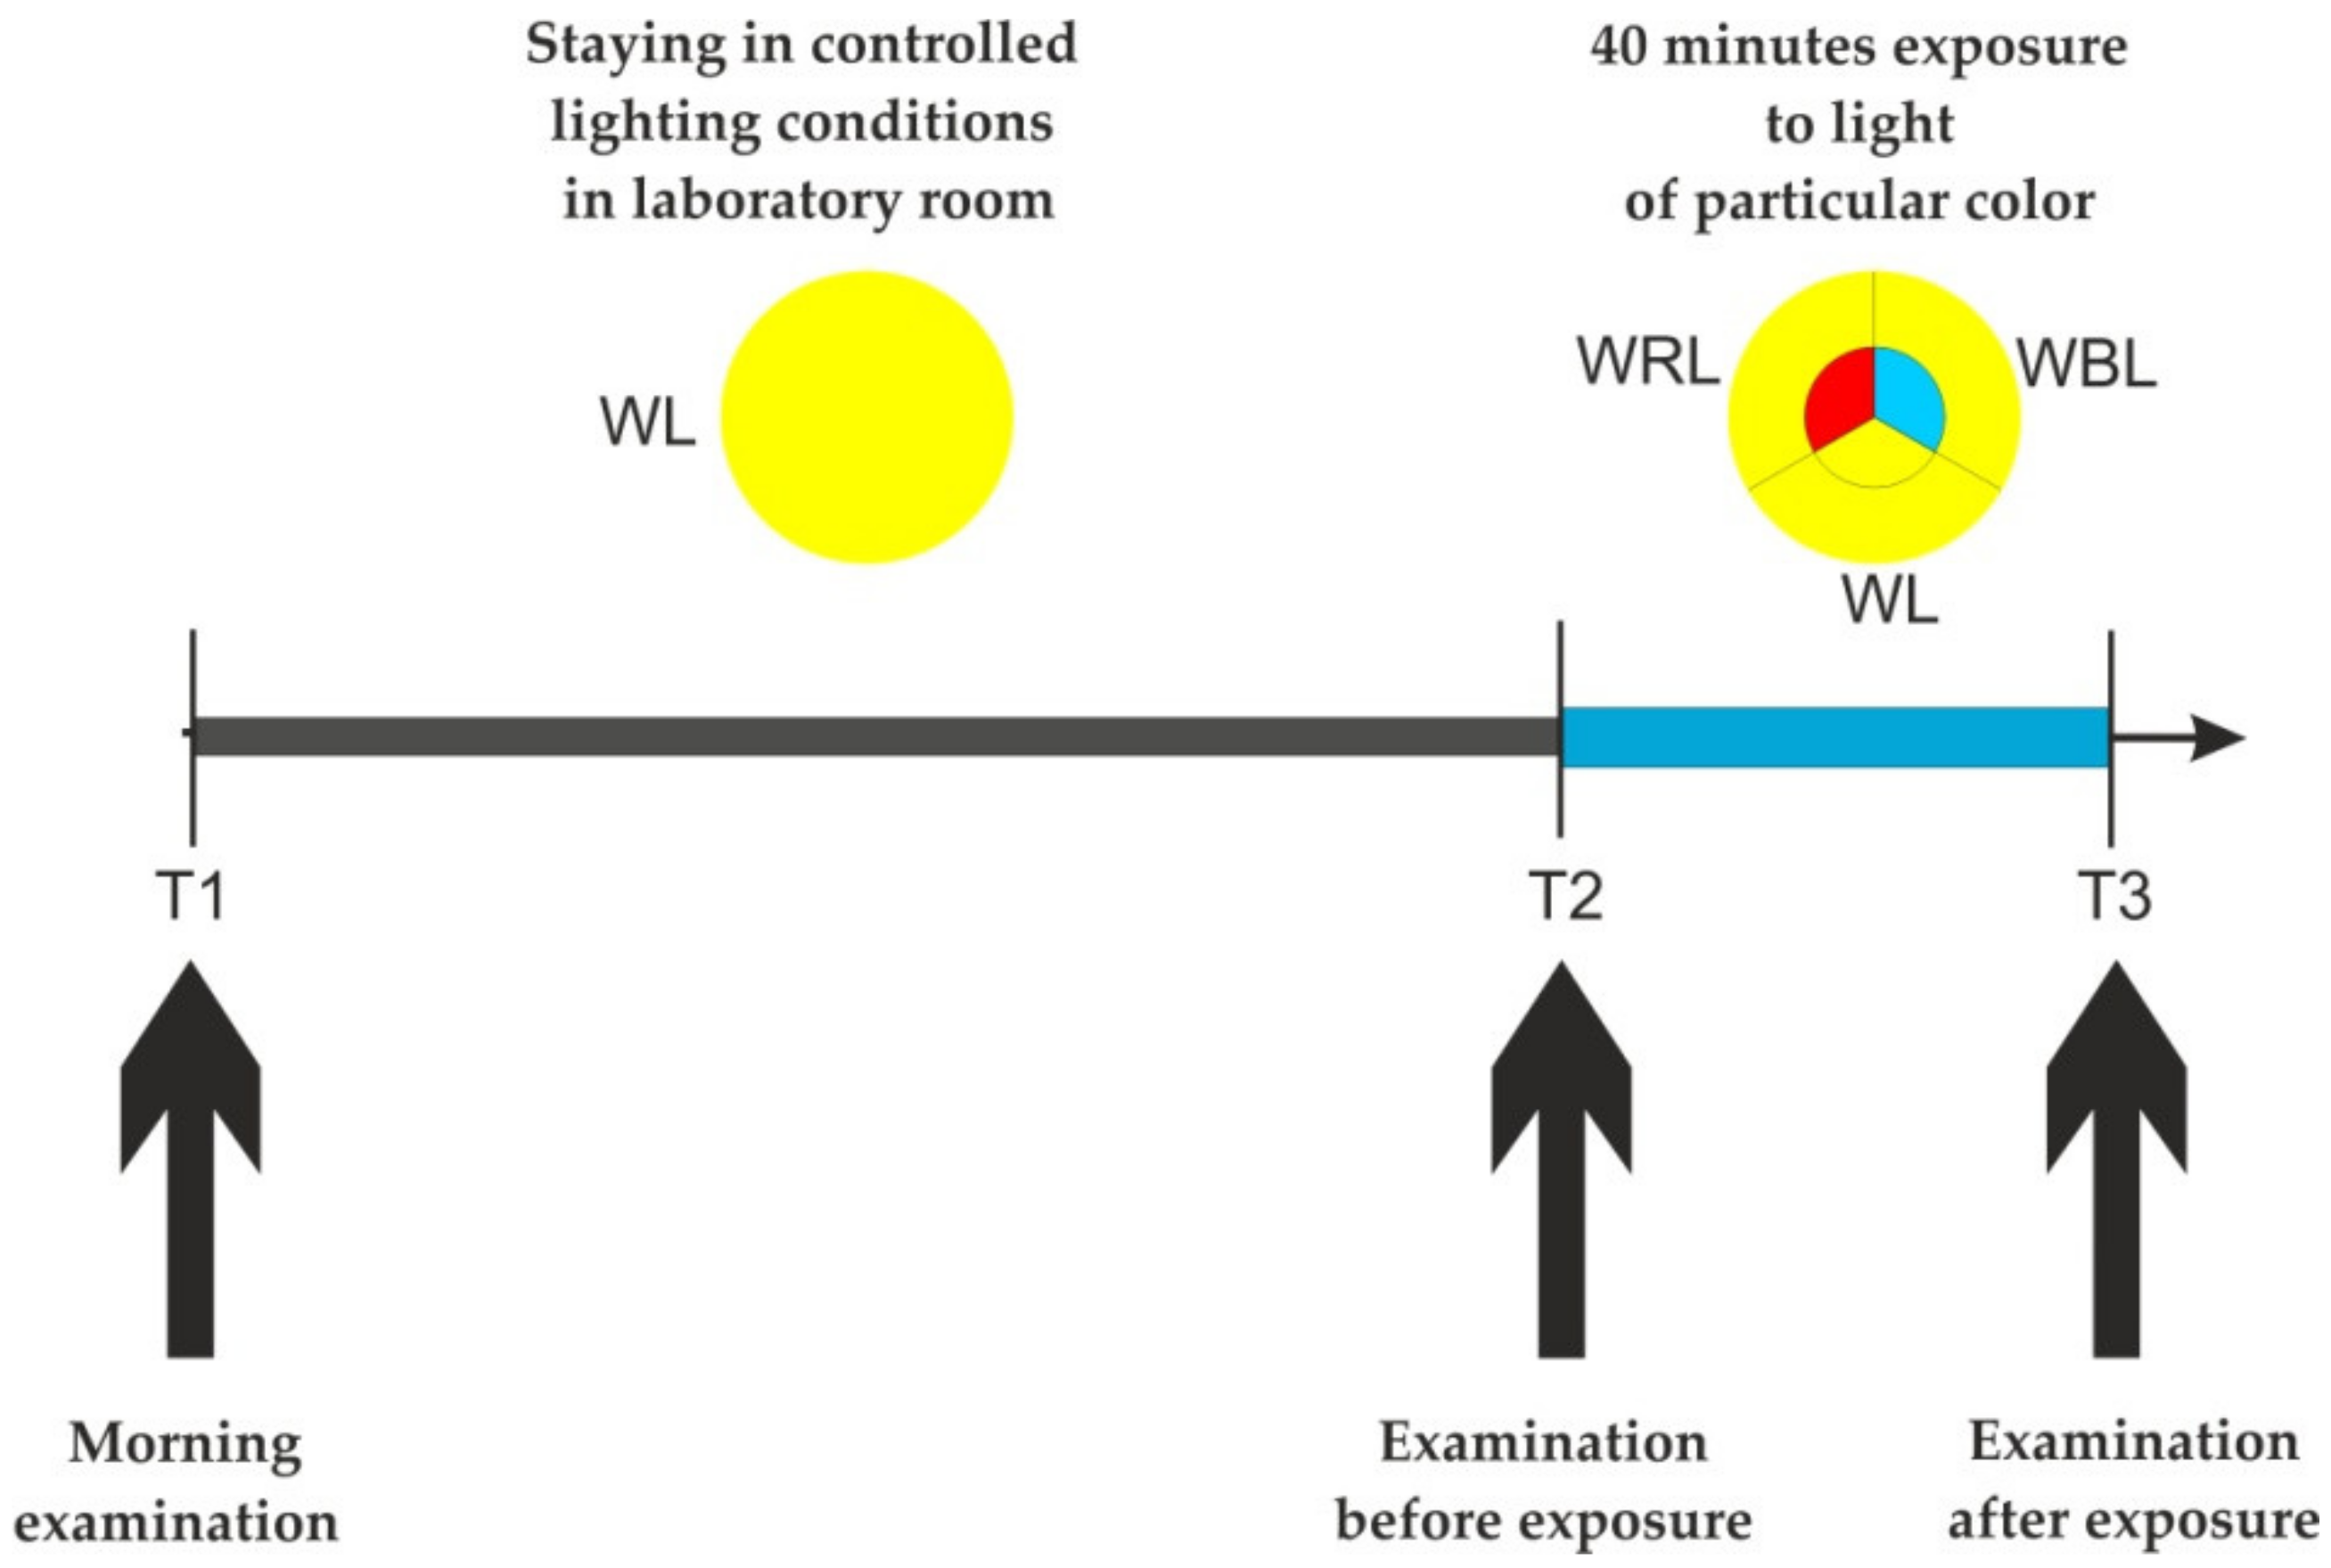
Each of the subjects took part in three experimental sessions, consecutively at intervals of one week. One week before the start of the study, each subject completed a daily diary of the daily sleepiness profile, in which the level of sleepiness was assessed on a 5-point scale (from zero to very high). During a single session, participants performed cognitive tasks and were exposed to light (controlled lighting conditions—artificial lighting) of a specific color. The order of sessions with exposure to a specific color of light (light scene) varied between test subjects so as to limit the impact of learning and test skills on test results. During one test day, the examined person performed three psychomotor tasks and was subjected to EEG registration during the reaction time test as well as joint EEG and EOG registration.
The tests were carried out sequentially: in the morning, in the afternoon, when the level of alertness decreased—“before exposure to light” and “after exposure to light”. On the days of the experiments, the participants arrived at the laboratory at approximately 8:00 a.m. and they were always under white light conditions (reference scene). They stayed under these conditions until the typical afternoon drop in alertness (depending on their individual sleepiness/alertness scores on a diary for at least one week prior to the diary of the diurnal sleepiness profile). Then, the first measurements were carried out (“before-exposure” session—EEG, PVT, TUS, GONOGO, Grandjean Scale). One of the three light scenes, “reference”, “red”, or “blue”, was subsequently turned on, and the participants performed a visual task typical for office work, which lasted 40 min. The choice of period of time was made on the basis of the analysis of publications describing this type of research [
1,
7,
9,
20,
30,
31] and pilot studies carried out earlier. Then, a third recording of the results was performed (“after-exposure” session—same tests as “before-exposure” and questionnaire for subjective evaluation of lighting conditions). During the exposure to light, the examined person was at a computer station where the entire experimental session was held, performing a task of entering data into an Excel spreadsheet standardized for all participants. The course of the experiment with appropriate time dependencies for one participant was discussed in [
32] and is presented in
Figure 3.
Between 8:00 a.m. and 12:00 p.m., the participants could read and write (without using the monitor). Snacks, water, and tea were available. It was assumed that it should not affect the course of the experiment.
2.4. Description of the Selected Methods Used in the Study
For the conducted studies of psychophysical fitness, three tests were used: GONOGO, TUS, and the Grandjean Scale.
2.4.1. Subjective Assessment of Mood and Fatigue (Grandjean Scale)
The Grandjean Scale is a subjective method of mood and mental fatigue diagnosis. It is used as a subjective measure of fatigue resulting from various types of work and occupations, e.g., in air traffic controllers [
33], as an indicator of changes in the level of psychophysical performance and excitation under the influence of pharmacological agents, as well as an indicator of mental workload resulting from the performance of tasks associated with mental activity [
34]. It consists of 14 subscales in the form of 10 cm segments described at their ends with terms denoting opposite feelings relating to mood (6 subscales) and fatigue (8 subscales). The task of the respondent is to mark on each subscale the place that best describes the current (i.e., at the time of assessment) intensity of feelings defined at both ends of each subscale.
The subjective fatigue index consists of the following subscales: strong–weak, rested–tired, interested–bored, full of vigor–exhausted, awake–asleep, effective in action–ineffective in action, attentive–distracted, able to concentrate–unable to concentrate.
These subscales, based on the results of factor analysis, were found to be accurate in determining the level of fatigue caused by work. The measure of fatigue is the number of points obtained on each subscale, which is equal to the distance (measured in millimeters) from the beginning of the scale to the place marked by the respondent.
The subjective mood index consists of the other subscales of the Grandjean Scale, namely: positive mood–negative mood, relaxed–tense, happy–depressed, energetic–lethargic, in a good mood–in a bad mood, excited–calm.
The subscales listed were found to be accurate in assessing current mood and emotional state on the same basis as above. In this case, the measure is analogous to that for determining mental fatigue resulting from work.
2.4.2. Description of the Attention and Perceptiveness Test (TUS)
The Attention and Perceptiveness Test (TUS) is used to examine attention, divided attention, and the ability to focus on individual symbols [
35].
The term attention refers to the selective aspect of perception that manifests itself in noticing and focusing on certain features of the environment and relatively ignoring other features. This ability can also be manifested by the ability to focus the mind on a particular problem or on several problems simultaneously for a long time. The analysis of the role of individual human characteristics in terms of sensorimotor skills, personality traits, abilities, and interests in the safe performance of difficult and dangerous occupations has shown that in the category of abilities, concentration of attention ranks 2nd among 10 other abilities.
The test consists in crossing out the given symbols from among other similar symbols within three minutes. TUS comprises 4 independent versions, differing by the symbols to be crossed out: “b and k”, “3 and 8”, “6 and 9”, and “*” (asterisks). In the present study, the version with 6 and 9 characters was used. It includes 3726 characters, which are digits from 1 to 9 arranged in a random order. The participant’s task is to cross out only the numbers 6 and 9 from among all the signs. In each row, there are at least 7 signs to be crossed out, and the maximum number of signs in a row is 12. The time allocated to complete the test is 3 min.
Three indices are calculated in the test [
35]:
Perception speed (PS)—shows how fast the subject is able to review the presented signs (an indicator of the speed of reviewing perceptual material);
Perceptual fallibility (number of mistakes—NM)—shows the differentiation ability of the subject (an indicator of the correctness of task performance);
Unreliability of attention (number of omissions—NO)—shows what the ability to perceive relevant stimuli is at a given moment (index of ability to perceive relevant stimuli).
The reliability of the test is satisfactory—the coefficients of absolute stability were tested on a group of students. Similarly, the theoretical relevance was confirmed—the results correlate significantly with those tests from the WAIS-R Scale (PL), which examine attention and perceptiveness.
The “digital” version of 6/9 was used in the planned research.
2.4.3. GONOGO Psychomotor Test
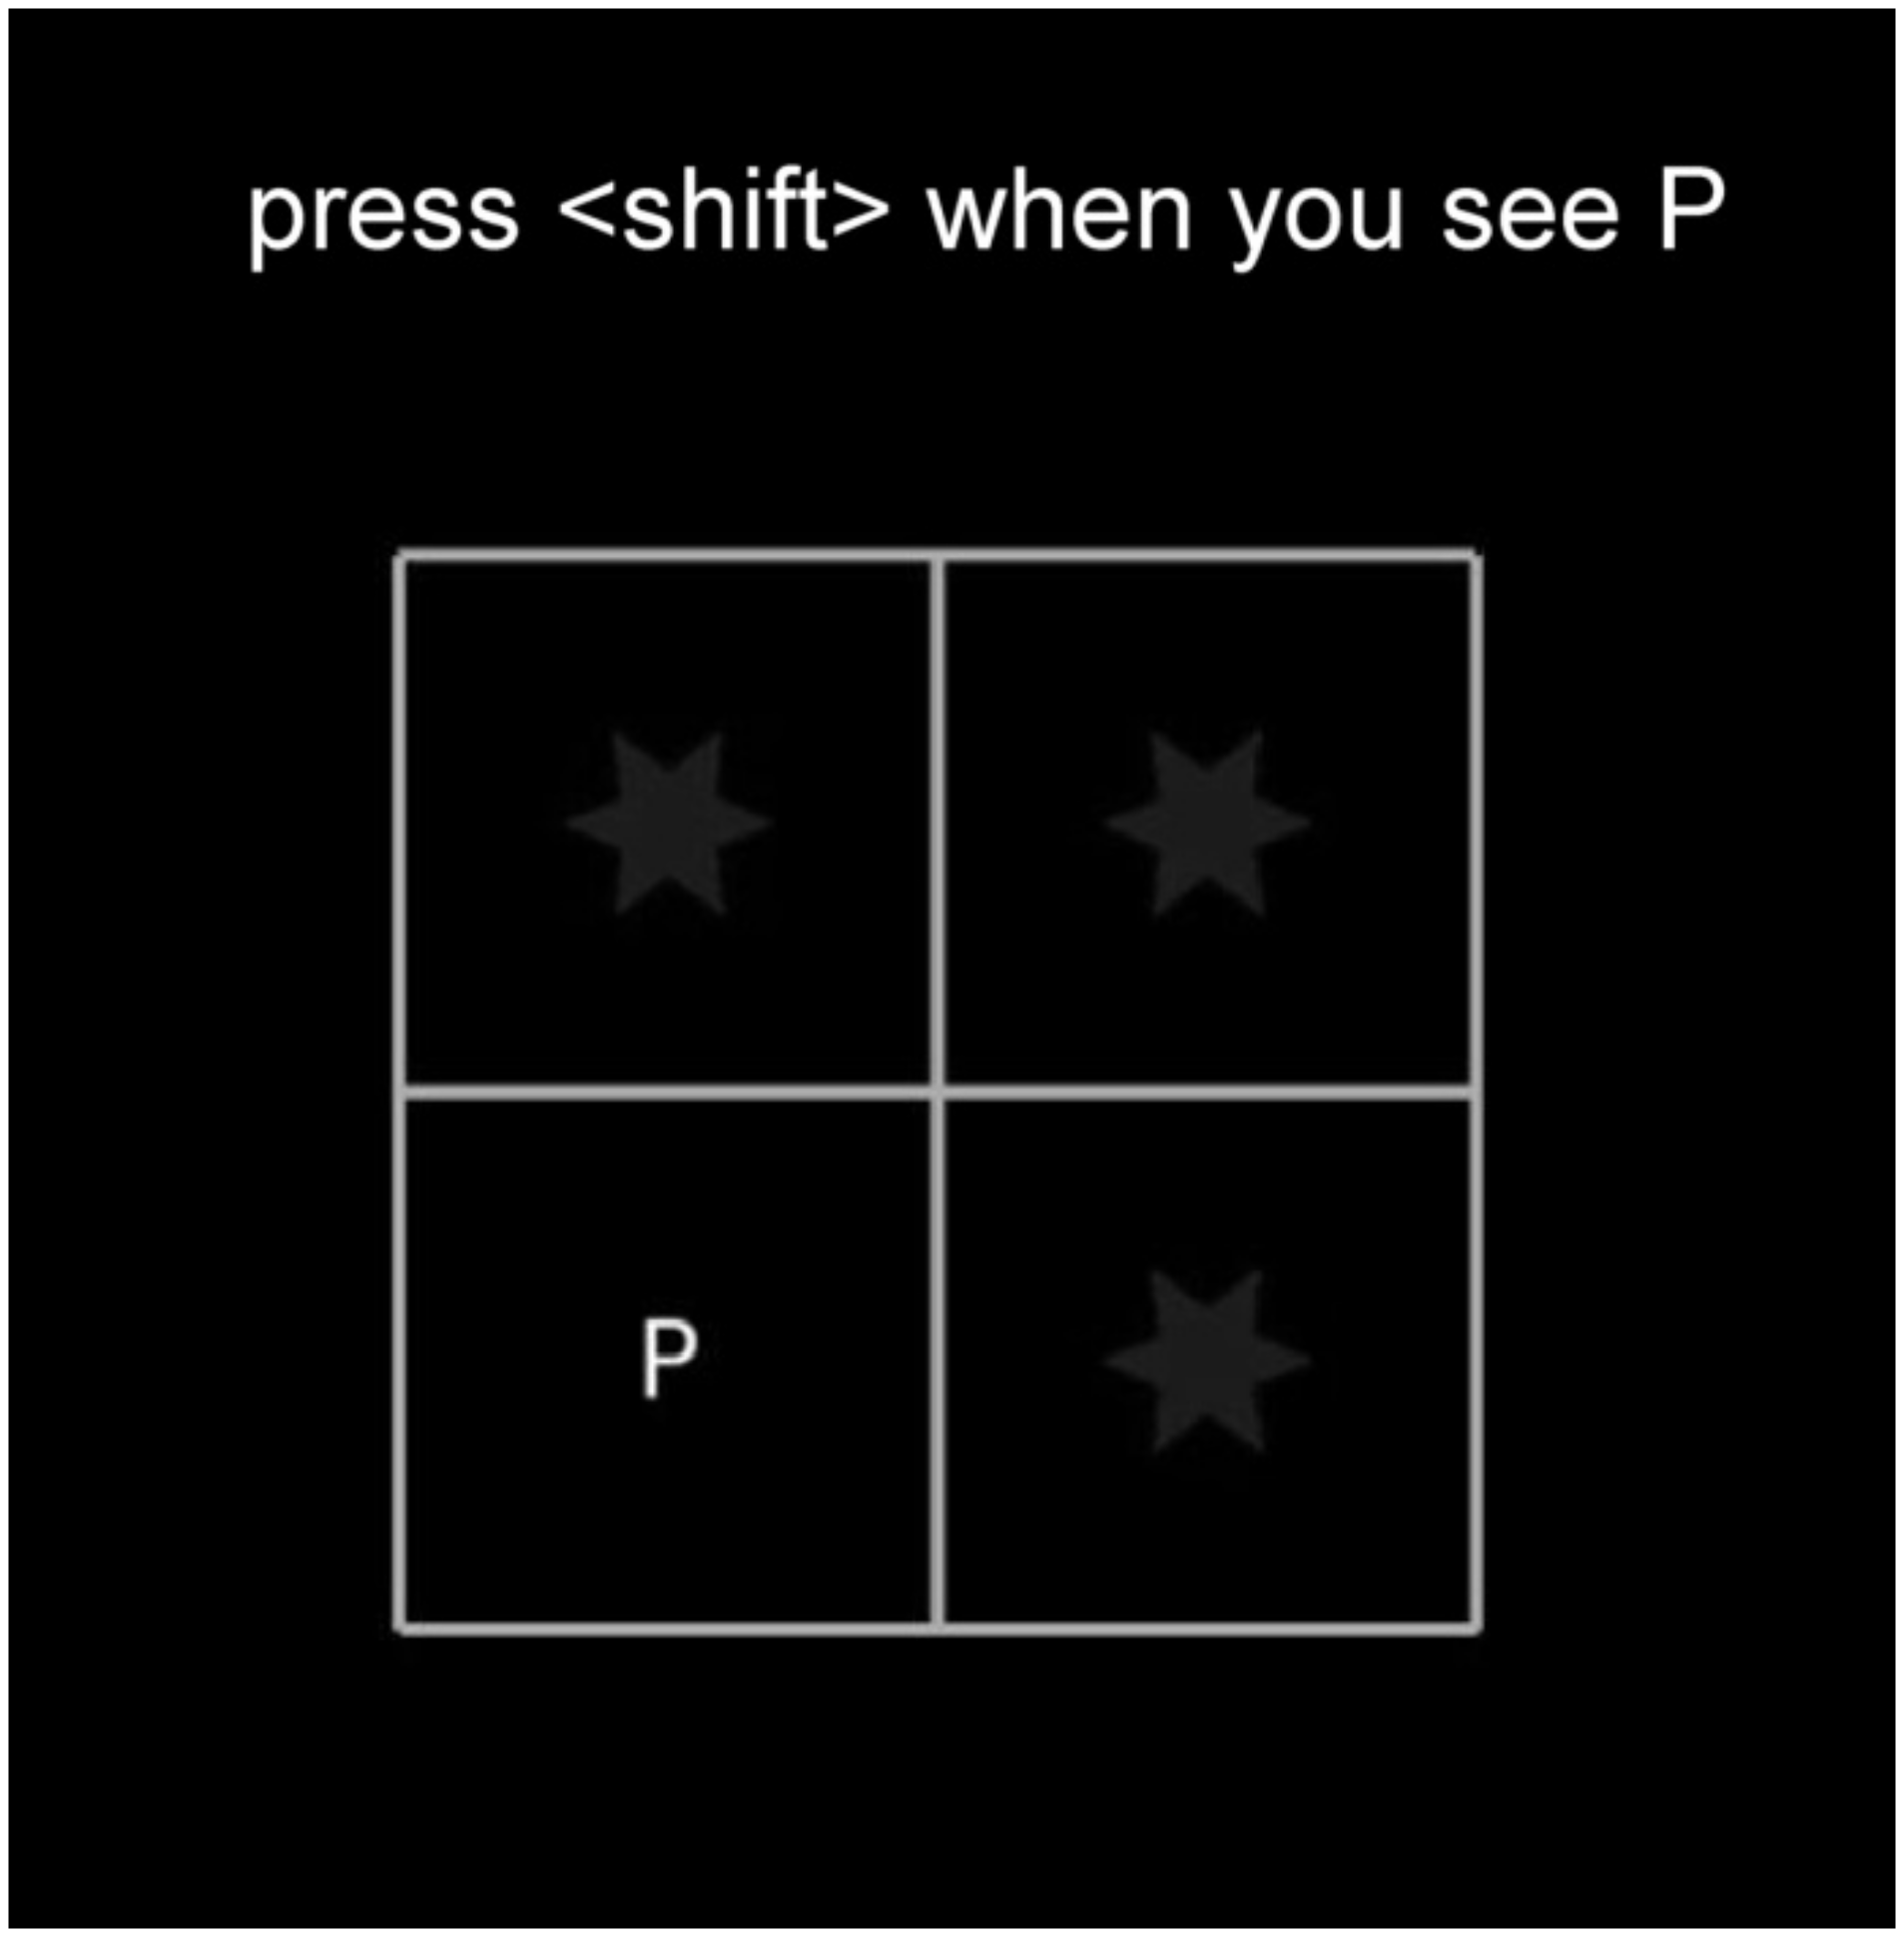
The GONOGO test from the Psychology Experiment Building Language (PEBL) battery [
36] is a tool for measuring the efficiency of attention, perceptiveness, and the ability to select responses by inhibiting the undesired response and by appropriate speed of the desired response. The selected test presents the letters P or R in randomly selected boxes on the screen. In the first part of the test, the subject is asked to react only to the letter P and not to react (inhibitory reaction) to the letter R. In the second part of the test, the situation is reversed, and the respondent should react only to the letter R and not react (inhibitory reaction) to the letter P. A view of the screen with the GONOGO test presentation is shown in
Figure 4.
Performance level is measured based on the reaction time and number of errors made. The test requires responding selectively to one category of stimulus and refraining from responding to another category of stimulus. The speed of reaction time is treated as an indicator of cognitive alertness. In contrast, the number of errors associated with an overreaction—at the moment when it should be inhibited—is an indicator of cognitive control. In the situation of over-arousal, negatively influencing the precision of behavior, we can expect an increased number of errors. The measurements included indices related to the average time of correct reactions and indicators reflecting the number of errors resulting from an overreaction (disinhibition).
The analysis included the following test indicators: total number of correctly performed trials, total number of errors, mean performance accuracy, mean number of errors, and mean reaction time.
In addition, in order to evaluate the change in average performance levels of the GONOGO task after light exposure compared to the pre-exposure condition, an “after–before” lighting difference index was introduced in the total number of errors, mean performance accuracy, mean number of errors, and mean reaction time. The “after–before” difference index allows for comparison of the change in performance levels that occurred in the blue light and red light exposure conditions with respect to the reference (white light) conditions.
3. Results
Statistical analysis was performed with the use of the SPSS 11.5 program. In order to select an appropriate statistical test to assess the significance of differences (from the group of parametric or non-parametric tests), the Kolmogorov–Smirnov test was first performed to determine whether the random variable significantly differed from the normal distribution. The analysis of the significance of the difference concerned the differences between:
Individual experimental variants when exposed to the particular colors of light for the entire group of subjects (50 subjects) and for individual subgroups: 22–34 years old and 55+;
Individual subgroups from two age ranges: 22–34 years old and 55+ with particular experimental variants;
The results of 150 experimental sessions in which the subjects performed the same psychophysical tests 3 times were analyzed. It gives a total of 450 test results.
3.1. Grandjean Scale Scores
The results of the Grandjean Scale for each subscale showed a general trend of increasing the mean values of fatigue severity, mental workload, and performance level after exposure to each color of light variant. In the 22–34 age group, the exposure to WRL and WBL contributed to the maintenance of all subscales at approximately the same level, while levels concerning fatigue, boredom, bad mood, sleepiness, distractibility, and inability to concentrate increased significantly after exposure to WL. In the 55+ group, the exposure to WRL, WBL, and WL significantly increased levels on the scales, specifically regarding fatigue (WBL and WL), boredom (WL), bad mood (WBL), distraction (WBL and WRL), inability to concentrate (WBL and WRL), ineffectiveness in action (WBL and WRL), and tension (WRL and WL).
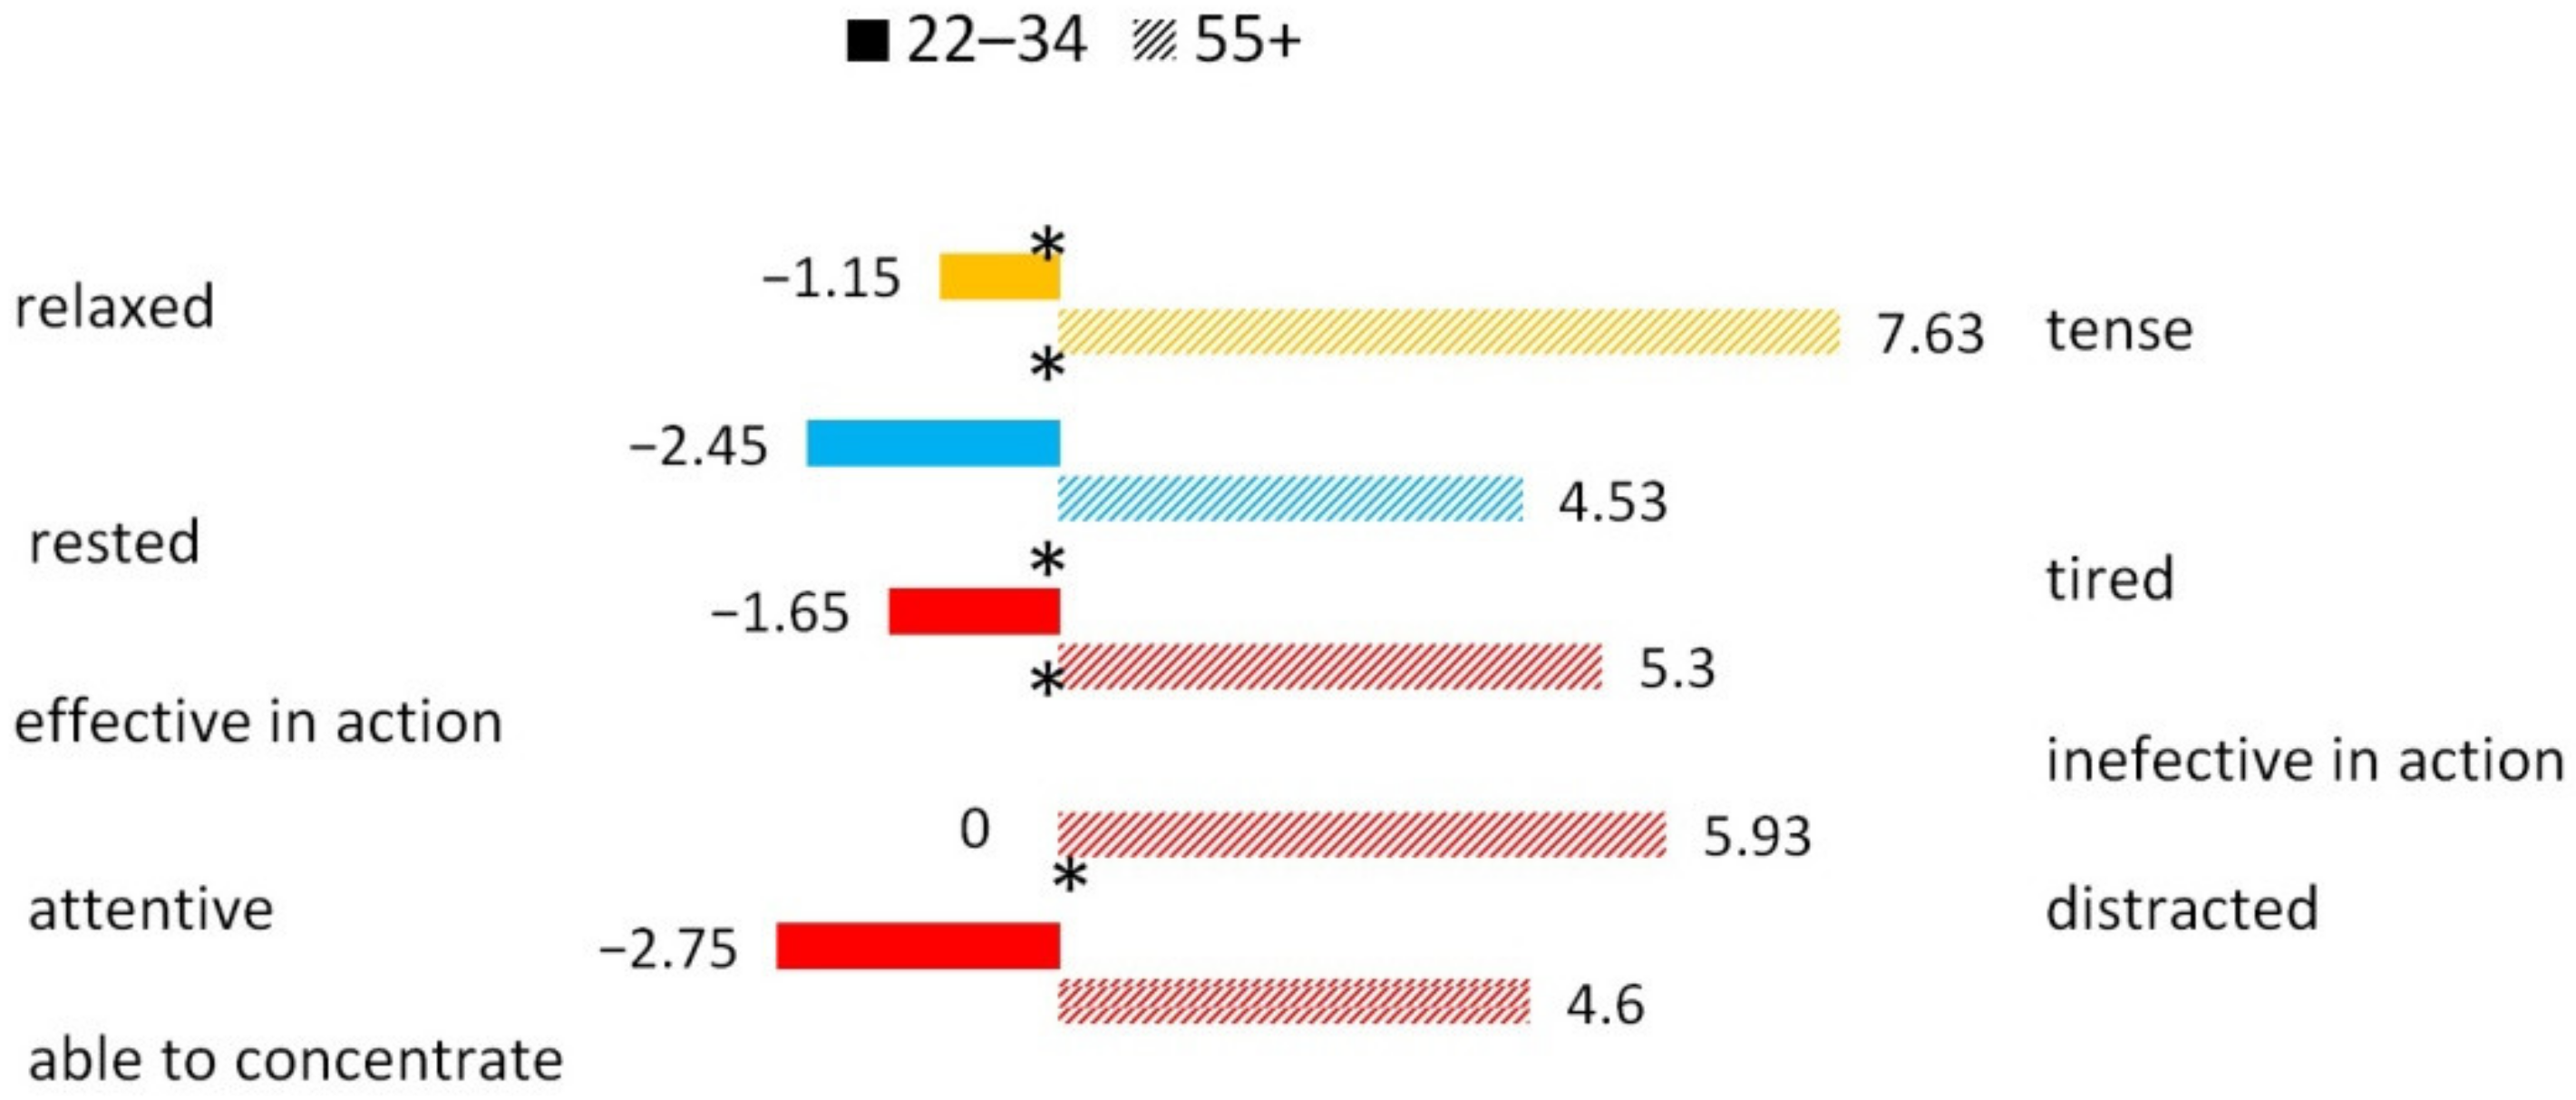
In order to compare distinctions in the effects of various colors of light on fatigue and mood indices, absolute differences in subjective ratings were determined and statistically analyzed. The absolute differences in the subjective assessment of alertness level before and after the exposure were calculated as the variations of scores on a given subscale after and before exposure (after–before). The results of the significance analysis of differences (Friedman test) in the rates of change (after–before) for each subscale between the three variants of exposure to different colors of light are presented in
Table 2. The results show three statistically significant differences in the Grandjean Scale indices: rested–tired, interested–bored, and excited–calm. The differences (after–before) in the rested–tired indicators point out that exposure to WBL resulted in the smallest shifts of the scores toward fatigue, while the greatest shifts were found after exposure to the WL. The distinctions (after–before) in the interested–bored indices show that the exposure to WRL contributed to the smallest shifts of the results toward boredom, and the largest shifts were observed by the exposure to the WL. The differences (after–before) in the excited–calm indices inversely to the previously discussed outcomes show that the shift toward calmness was the highest during the exposure to the WL, whereas the differences were negative when exposed to WBL and WRL. This indicates the stimulating effect for these colors of light.
The results regarding the significance of differences analysis (Mann–Whitney Test) are presented in
Figure 5. It illustrates the rates of change (after–before) for each subscale between groups in diverse experimental variants with exposure to different colors of light (only those subscales for which statistical significance was demonstrated are shown: *
p < 0.05, **
p < 0.1).
The results concerning the significance of differences between the age groups 22–34 and 55+ in the experimental variant exposed to WBL, WRL, and WL show a difference in indices:
Rested–tired only with the blue light scene (level of statistical tendency); differences show that people aged 55+ were more fatigued than people in the 22–34 age group after the experiment with the exposure to WBL;
Effective in action–ineffective in action, attentive–distracted, able to concentrate–unable to concentrate only with the red light scene; differences show that subjects aged 55+ were less effective in action, less able to concentrate, and more distracted than subjects aged 22–34 after the experiment with the exposure to WRL;
Relaxed–tensed only at the reference scene (level of statistical tendency); differences show that subjects aged 55+ were more tense than subjects aged 22–34 after the experiment with the exposure to WL.
In conclusion, the stimulating effect of the exposure to WRL and WBL can be observed. When exposed to WBL and WRL, subjects felt less tired and bored after the experiment than after exposure to white light (
Table 2). The stimulating effect of blue and red light on the excited–calm subscales was also found.
The results of the significance of differences between the 22–34 and 55+ age groups after the exposure to WRL showed three significant differences: the 22–34-year-olds were more effective in action, more able to concentrate, and more focused than the 55+ age group after the exposure to WRL experimental variant.
3.2. Performance on the Attention and Perceptiveness Test (TUS)
Statistical analysis of TUS results, in perception speed (PS), number of omissions (NO), and number of mistakes (NM) before and after the exposure to individual colors of light in all experimental variants did not show statistically significant differences. However, it can be noted that with the blue and red scenes, there is a tendency for an increase in the mean PS, both in the whole group and in the individual subgroups, while with the reference scene, there is a slight decrease (
Figure 6). One can see a larger increase in PS in the 22–34 years group after exposure to WRL and WBL than in the 55+ group. For the 22–34 years group, after WBL exposure, the mean NO declined slightly, and the mean NM did not change, while with WRL and WL exposure, the mean NO increased, and the mean NM decreased slightly. However, for the group 55+, after exposure to WBL, the mean NO and mean NM raised slightly; after exposure to WRL, the mean NO declined slightly, and after exposure to WL, the mean NM increased slightly and the mean NO and mean NM decreased.
To compare the results between the variants of exposure to different colors of light, the absolute differences of the outcomes obtained after and before the exposure (post-exposure) were determined. Results of the significance of differences test (Friedman test) for PS, NM, and NO after exposure to different colors of light did not show statistically significant differences in terms of changes in attention and perceptual indices after exposure to light of different colors. However, for the 22–34 years group, during the exposure to WRL, the difference in SP speed was close to statistical significance (Chi-square = 4.785, p = 0.091). The increase in SP after WRL exposure in the 22–34 years group was higher at the level of statistical trend than in the other exposure variants.
The results of the statistical analysis of the PS, NM, and NO differences after and before different variants of exposure (“after–before”) to light of diverse colors showed that only in the case of NM after red light exposure was the distinction between the groups close to statistical significance (Mann–Whitney test: U = 228.5, p = 0.058). After WRL exposure, the younger group (22–34 years old) had a significantly larger reduction in the number of errors comparing to the 55+ group.
In conclusion, it can be stated that there is a certain tendency for the increase in PS after WRL and WBL exposure in both groups of subjects, with the increase in PS after WRL exposure being higher in the 22–34 years group than in the 55+ group. After WRL exposure, the increase in PS in the 22–34 years group was larger (at the level of statistical tendency) than in the other exposure variants. With the TUS indices, it can be seen that the WRL had a more significant effect on PS increase in both groups than the other exposure variants.
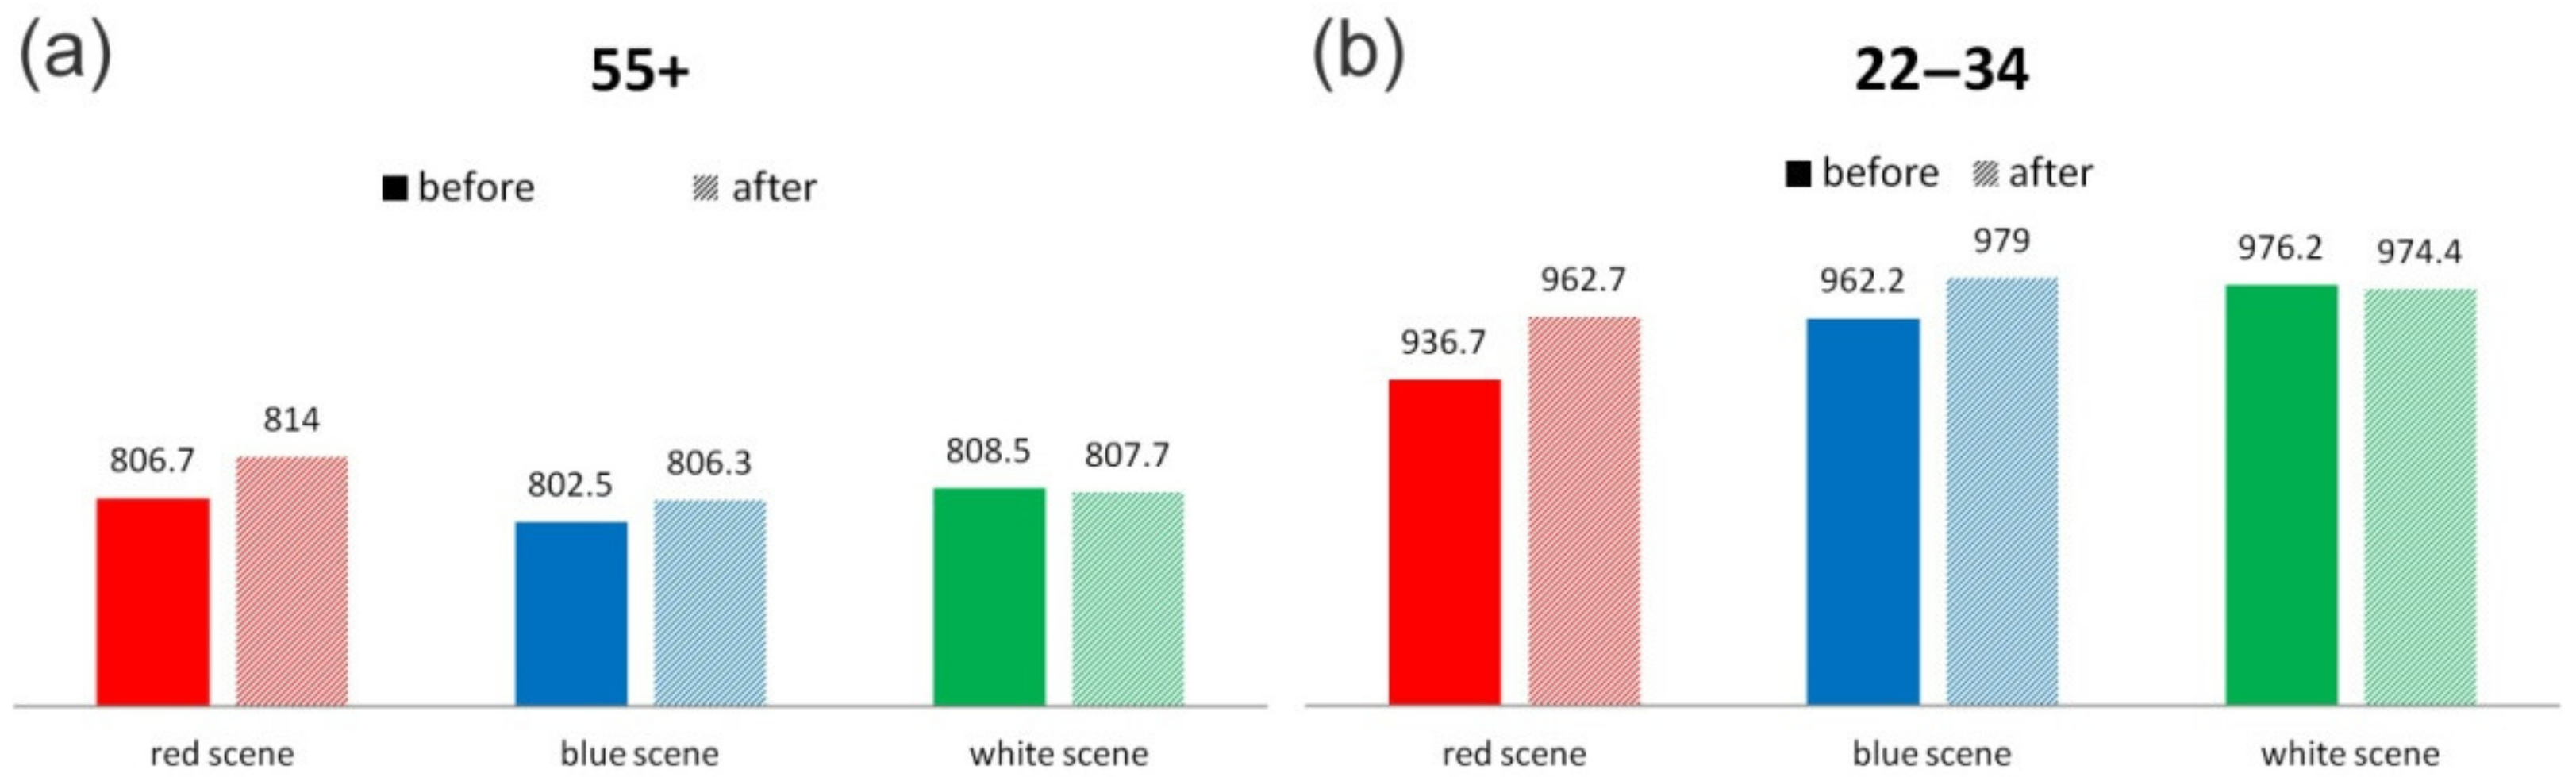
3.3. Performance on the GONOGO Psychomotor Test
The statistical analysis included the following test indicators: total number of correctly performed trials, total number of errors, mean accuracy of performance, mean number of errors, and mean reaction time. Due to the extensive nature of the data, this paper will present the results regarding the before and after exposure mean values for mean accuracy, mean number of errors, and mean reaction time to the letter P in the 1st round (i.e., a mark dedicated to the subject’s reaction and clicking the key as quickly as possible after noticing it).
Figure 7 shows the mean values of the aforementioned parameters before and after exposure to the different color of light in both studied subgroups. Only in the 55+ group, after exposure to WBL, a statistically significant improvement in psychophysical performance can be observed in terms of a lower mean number of errors and, at the level of statistical tendency, a reduction in reaction time. For the other parameters and variants of exposure, no statistically significant differences were found in the two subgroups studied.
The “after–before” difference indices for the discussed parameters of the GONOGO test allow us to compare the change in the level of performance that occurred under exposure to different colors of light (
Table 3). In the case of the 22–34 years group, an improvement in concentration was found in the number of correctly performed trials, mean accuracy of performance, and mean number of errors after exposure to red light. The average difference in the number of correctly performed trials was statistically significantly larger after WRL exposure than after WL exposure. The 55+ group showed an improved concentration in the number of correctly performed trials, mean accuracy of performance, and mean number of errors after WBL exposure. The average difference in the number of correctly performed trials, mean accuracy, and mean number of errors was statistically significantly larger after WBL exposure than after WRL exposure.
Taking into account the age of the subjects, the analysis of differences between groups of GONOGO test indices (Student’s t-test for independent samples) showed statistically significant differences only for the WL variant for the following parameters: number of correct performances (p = 0.05—a significantly larger decrease in the number of correct test performances in the 22–34 age group than in the 55+ group), total number of errors (p = 0.05—a significantly larger decrease in the average number of errors in the 22–34 age group than in the group 55+), the average accuracy (p = 0.05), and at the level of statistical trend (p = 0.083—a significantly larger decrease in accuracy in the 22–34 age group than in the group 55+).
4. Discussion
Statistical results analysis of the indices of all the psychophysical tests presented in the article showed the stimulating effect of white light enriched with blue light (WBL) and white light enriched with red light (WRL) in the early afternoon both in the group of 55+ and the younger group of 22–34 years. However, they showed some differences in the effect of these two colors of light on the studied groups. The main conclusions of the analysis are summarized in
Table 4,
Table 5 and
Table 6 for Grandjean Scale, TUS, and GONOGO, respectively. The outcomes of the study confirming the strong effect of WBL and the apparent effect of WRL on alertness are consistent with previous publications on the effects of blue and red colors of light on human alertness levels [
3,
4,
9,
10,
15,
16,
17,
32].
It can be noted that in the case of young people aged 22–34 years, exposure to WRL was more stimulating than exposure to WBL, which is confirmed by the indices of all three tests applied. A shift on the Grandjean Scale in the direction of being able to concentrate, being effective in action, and also an increase in the speed of work, a decrease in the number of mistakes, an increase in the number of correct attempts, and the mean accuracy of task performance may indicate an improvement of psychophysical performance as a result of exposure to WRL. However, in the case of the elderly aged 55+, the WBL exposure was more stimulating than WRL exposure, which was confirmed by all indices of the GONOGO test. The decrease in the mean reaction time, the decrease in the number of mistakes, the increase in the number of correct trials, and the increase in the mean accuracy of task performance may indicate an improvement of psychophysical performance as a result of exposure to WBL.
However, when considering the tested group without division into age subgroups, the stimulating effect of both considered colors of light (blue and red scene) can be stated, which was confirmed by shifts on the Grandjean Scale (statistically significant) in the following directions: interested, rested, and excited, as well as the tendency (statistically insignificant) to increase the speed of work in the TUS. Additionally, there was a significant increase in the mean reaction time in the GONOGO test in the whole group after exposure to WBL. This result may be related to the numerical predominance of the elderly in the entire group of subjects, which results in the predominance of effects specific to this group in the statistics for all subjects tested. In the studies conducted to date regarding the influence of color of light on the alertness level, the GONOGO test is often used as it provides the additional means to confirm the results of the objective measures such as EEG, EOG, melatonin levels in blood, saliva, or urine [
9,
15,
16,
21]. Hence, this test was applied in our study and confirmed the results of the EEG analyses [
32].
5. Conclusions
The results of this study using selected tests to assess attention and perceptiveness, mood, and fatigue as well as human psychomotor performance can be used to conclude that there is a modulatory effect of the color of light with a significant proportion of the blue or red component on psychophysical performance in the early afternoon part of the day. The conclusions obtained from the psychophysical tests are consistent with the conclusions drawn from the analysis of the EEG signal (carried out on the basis of the EEG signal recorded in the discussed studies). The results of EEG analyses for the whole group showed the influence of white light enriched by blue light (WBL) on the level of alertness (statistically significant) and white light enriched by red light—WRL (at the level of statistical tendency) [
32].
The confirmation of objective measures of the level of alertness (which include indices analyzed from the recorded EEG signal) by the indices of psychophysical tests may indicate the applicability of the tests used to study the level of alertness when exposed to light or another factor of the physical work environment (e.g., sound). They broaden the scope of knowledge by providing detailed information on separated features classified to describe human alertness such as attention and perceptiveness, mood, and fatigue as well as psychomotor efficiency. When used appropriately, they can also be utilized as a tool for estimating the level of alertness in studies where it is not possible to record EEG or electrooculography (EOG) signals. The tests with employees in real working conditions may be an example.
It is worth noting that the variation in the “sensitivity” of the tests was used in relation to different age groups. While the Grandjean Scale and TUS clearly indicated red color stimulation in young people (22–34 years), in the group of 55+, they did not give statistically significant confirmation of the influence of blue light, which was only confirmed by the GONOGO psychomotor test. This fact should be taken into account in planned studies.
The application of the Grandjean Scale and the TUS is new in this kind of research, and we treated them as complementary to the knowledge about the subjective feelings of the respondents and about attention and perceptiveness. As an interesting novelty in the study of the influence of light on the level of alertness, we may consider the results of the Grandjean Scale, which show a different “dimension” of alertness perceived subjectively in terms of five subscales: interested–bored, rested–tired, excited–calm, effective in action–ineffective in action, able to concentrate–unable to concentrate. However, in the case of the TUS, according to our research, it seems to be less “sensitive” for people in the age group of 55+, so when planning the research, this fact should be taken into account.
It is worth adding that the authors conducted 150 full-day measurement sessions using subjective and objective indicators of alertness, sleepiness, and performance. They also conducted EEG examinations and computer tests. It is very rare to find studies on the effects of lighting on the psychophysical performance that use such a wide array of different tests and analyses. On the other hand, a very important effect of the conducted research is the finding of the influence of white light enriched with blue or red light and not only pure monochromatic blue or red light.
The results of the study allow us to conclude that the psychophysical tests discussed in the article can be applied to study the influence of color of light on psychophysical efficiency and, indirectly, on the level of alertness. However, it is advisable to verify this conclusion in further experimental studies on larger groups of subjects.


