1. Introduction
Port tugs are small, special-purpose ships (width approximately 10–12 m, length approximately 24–32 m). Their task is to assist larger vessels during maneuvers, when precise and reliable control over the position of the assisted vessel is essential.
Examples of situations where the assistance of tugs is necessary include entering and leaving the port, berthing and unberthing from the quay, changing the berth in the port or turning the ship around in place. Port tugs are also at the disposal of ship captains in situations where a ship equipped with devices enabling independent execution of the above-mentioned maneuvers is, for some reason, unable to perform them independently, or there is a risk that it will not be able to execute them safely. Such situations may include, for example, too strong a wind force or an extremely unfavorable wind direction; partial or total failures of the ship’s equipment; specific requirements of the cargo carried by the ship (e.g., increased possibility of explosion or fire); and finally, when the captain has any doubts regarding the planned maneuver, e.g., has insufficient experience.
Contrary to other types of tugs, such as seagoing or river tugs, port tugs are designed for short-term operations, usually not lasting more than a few hours, and having a range of activity limited to the harbor basin and its immediate vicinity.
A characteristic feature of the tug is its high power to hull size ratio. In order to perform maneuvers, a tug needs to apply large tractive force, which requires a powerful propulsion system. In order to generate the required force, the tug uses at least one propeller, but in the vast majority of cases, it has at least two propellers or thrusters.
Until recently, the only practical source of mechanical energy capable of moving a tug’s propellers was the diesel engine. Recent advances in the technology of electric drive and constantly developed battery energy storage allow for wider replacement of the classic diesel drive with a drive based on electric motors, whether in the form of a hybrid propulsion [
1,
2,
3] or fully electric drive [
4,
5,
6,
7].
In hybrid systems, a combination of diesel engines and electric motors is used, allowing them to work in such a way that they complement each other’s capabilities. The advantage of the electric drive is high efficiency in a wide load range, while its disadvantage is operating time, limited by the size of energy storage. In turn, the diesel engine can operate for a long time, due to the much higher volumetric and mass energy density of diesel fuel. Unfortunately, when contrasted with an electric drive, the efficiency of diesel engines is low, especially with light loads. The use of electric motors during low-load operation allows for extending the downtime of diesel engines, which are only started in periods when high propulsive power is required [
8].
Fully electric drive allows infrastructure associated with diesel engines and the engines themselves to be eliminated from the deck of the ship. In an all-electric ship, the following components are redundant: fuel tanks, lubricating oil tanks, massive cooling installations and mechanical transmission systems such as reduction gears and drive shafts. In their place, it becomes possible to install an electric energy storage, which for maintenance purposes requires less space around it. This allows the use of smaller passages than in a conventional engine room and improves the mass distribution by placing the energy store at the lowest possible point of the hull.
The integration of the electric drive may also facilitate the use of the tug in an autonomous, unmanned mode, which may speed up the response time and allow the anti-collision algorithms to work effectively [
9,
10].
Global trends force the development of clean, eco technologies that do not rely on energy obtained from conventional fossil fuels. Taking into account economic aspects, it is beneficial to exploit such energy sources, which is not necessarily favorable to the natural environment [
11]. When designing modern means of transport, which electric tugs certainly are, it is possible to select their operational parameters so that the energy spent for operation is used as efficiently as possible. It is an important way of reducing the Total Cost of Ownership (TCO).
One of the tools used when designing a new vessel are the EEDI—Energy Efficiency Design Index, and the EEOI—Energy Efficiency Operational Indicator. The obligation to use the EEDI applies only to vessels with a tonnage greater than 400 GT, i.e., only the largest tugboats [
12].
Optimizing the configuration of the ship’s propulsion system is an issue widely discussed in the literature due to the multitude of possible implementation options. Paper [
1] presents an impact analysis of converting two tugs from conventional propulsion to hybrid propulsion with a serial structure. Several variants of the implementation of the energy storage have been presented, including a variant with a removable electrical energy store. Depending on the variant, a reduction in fuel consumption of between 6% and in excess of 50% was achieved, together with a reduction of NOx emissions of up to 91%.
The effect of the type of current in the electricity distribution system (Alternating Current or Direct Current) on energy consumption was analyzed in [
13]. It has been shown that it is possible to reduce fuel consumption by 5–15% by using a DC system compared to a traditional distribution system using AC power.
Optimization of the PMS system operation using evolutionary algorithms in a hybrid drive system with a parallel structure was the subject of research in [
14]. The effect was a reduction of energy consumption in a hybrid river barge by an average of 4.5%. In [
15], genetic algorithms were used for multi-variant optimization of the hybrid drive system on an AHTS unit. As a result, two configuration variants were obtained, one that reduces GHG emissions and significantly reduces initial capital expenditure, while the other reduces both the GHG emissions and fuel consumption.
Optimization of the components of the drive system is justified only in the case of designing new vessels or a thorough refit of existing ones. Paper [
16] presents how the selection of hybrid drive components using the bi-level nested optimization method can enable a long-term reduction of operating costs by more than 35%, while allowing the reduction of engine size by more than 20% and engine operation time by up to 80%. In turn, the authors of [
17] conducted an analysis in economic terms concerning various configurations of the propulsion system in the process of designing a tug. The result of their work was the selection of a favorable configuration of three medium-power engines, which minimizes the risk of failure capable of disabling the vessel, and limits its CO
2 emissions and fuel consumption.
When starting the process of designing the structure of a new tug, its load characteristics should be considered, which will then allow determination of the total energy demand during typical tasks performed during the service.
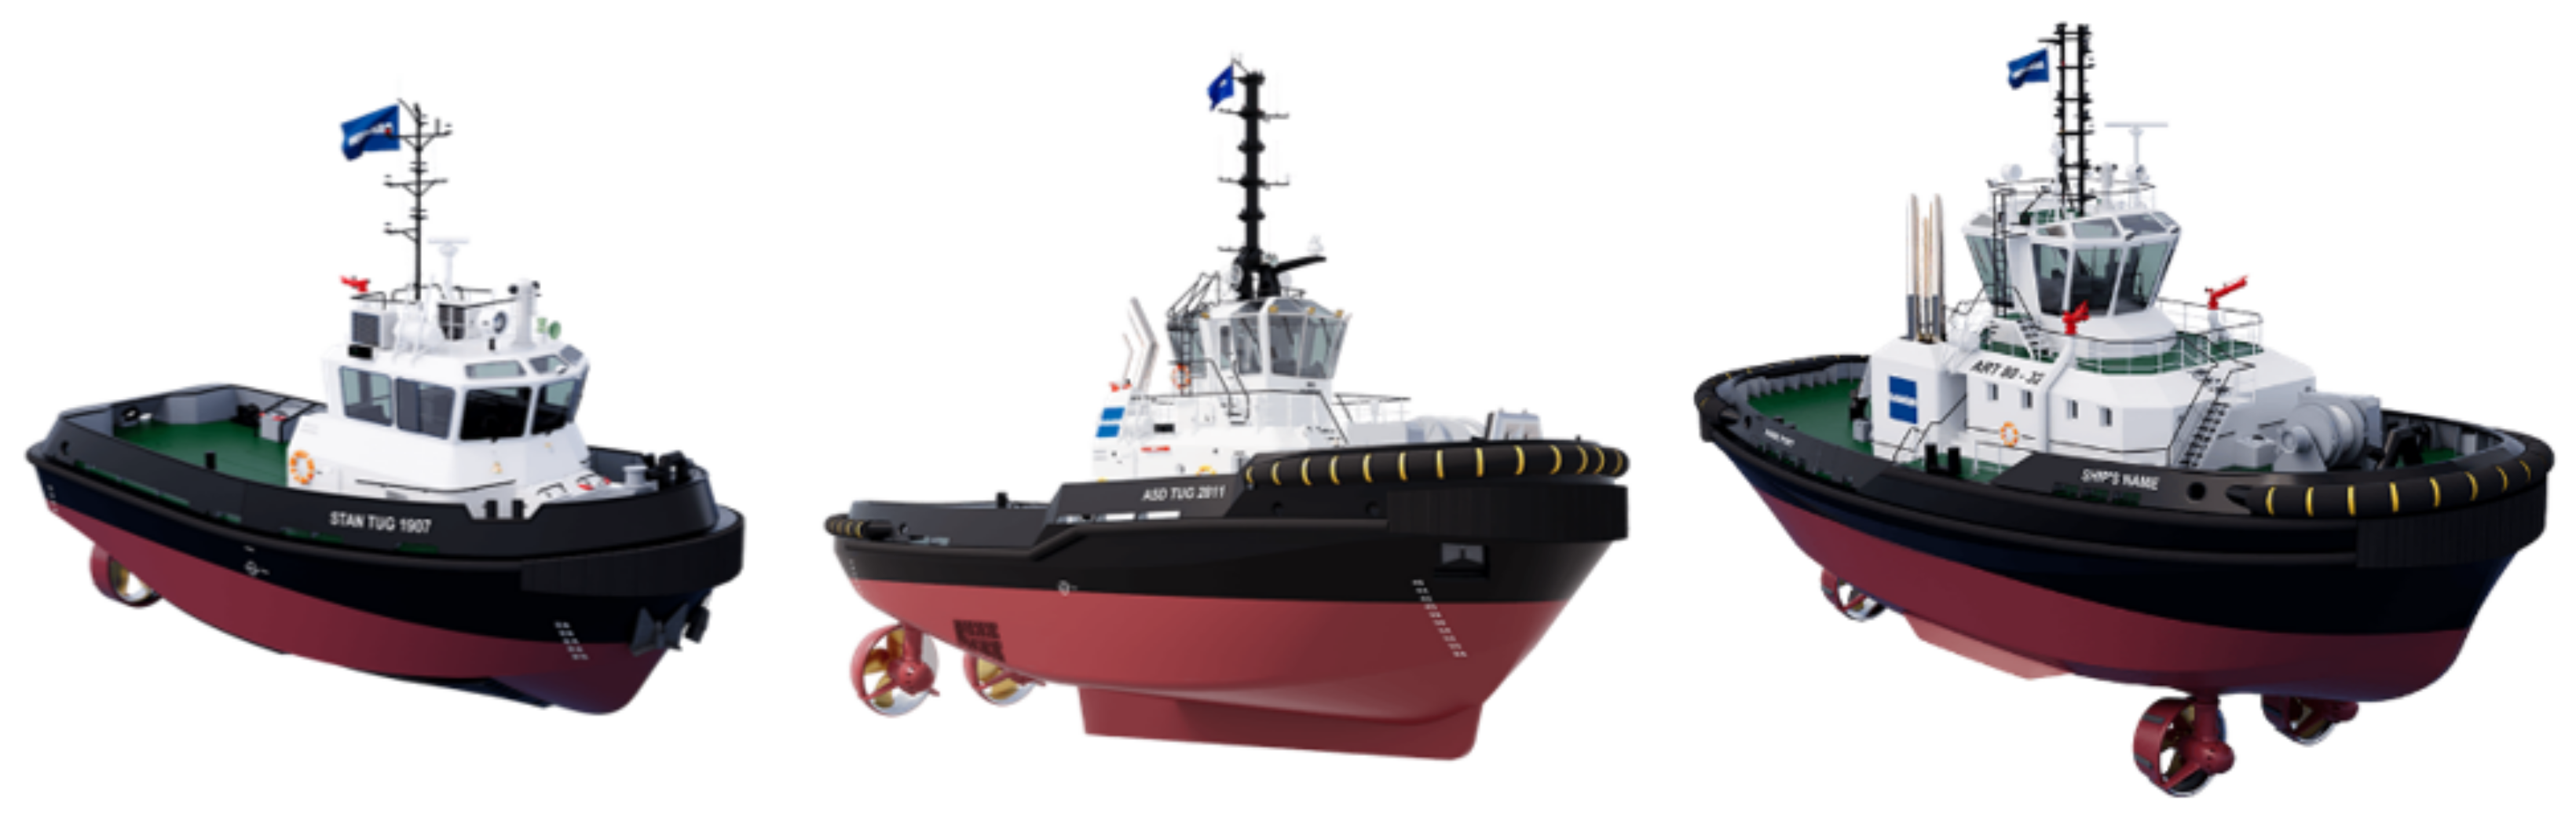
The classic tug propulsion uses stern propellers, often in conjunction with devices that improve their efficiency and low speed towing, such as the Kort Nozzle. The invention of improved kinds of propulsion, such as azimuth thrusters, allowed for two important changes. A free rotation of each thruster in the horizontal plane by 360° became possible, so that the force exerted by its propeller could be directed in any direction. Secondly, it became possible to move some propellers from the stern to other places, e.g., to the midship or to the bow. This allowed the distance between the thrusters to be increased, which made it possible to exert higher torsional moments on the hull of the tug, contributing to increased maneuverability of the vessel.
Currently, both tugs with a classic propulsion system (
Figure 1, left) and those with improved maneuverability are used. A typical group of such tugs are the azimuth stern drive (ASD) class tugs, using a pair of azimuth thrusters located at the stern (
Figure 1, middle). These tugboats are more maneuverable than tugs with classic propulsion. Even greater maneuverability is offered by tugs with azimuth thrusters located not only at the stern, such as the Rotor Tug manufactured by Damen Shipyards. This type of tug has three azimuth thrusters, two of which are located near the bow and one is located at the stern (
Figure 1, right).
A separate group are tugs with Voith-Schneider propellers (tractor tugs) [
19], but they will not be considered here, due to the difficulty of comparing the V-S propulsion using large rotors placed in pairs under the hull, with a propulsion using screw propellers.
Many new strategic documents, such as the “Fit for 55” plan announced by the European Commission [
20], assume a significant reduction of CO
2 emissions in many sectors of the economy, including the transport sector. This means that the conventional drive can be replaced by low-emission drives. This situation is likely to occur first on smaller vessels and those with a small range. Tugboats belong to both of these groups. In parallel to the revolution that is currently taking place in propulsion systems, the market of autonomous vehicles is also developing, including the MASS (Maritime Autonomous Surface Ships). Machines generally have greater precision in process control, possibly also with such complex operations as the assistance of ships by tugboats during port operations. Both aspects will change the hull structure of the tugs. The first introduced changes, due to the type of drive, concern the minimization of hydrodynamic drag. In addition to changes in the shape of the hull itself, changes can also be expected in the above-water part of the tugs. Having no crew aboard may cause the tugboat superstructure to become superfluous, which will reduce the impact of wind on the vessel’s operation and reduce aerodynamic drag. In the case of autonomous units, there will be no need to organize work and rest areas too.
A similar situation of technological changes took place at the end of the 20th century regarding the evolution of electric cars. Initially, the same vehicle bodies were offered for the internal combustion, hybrid and electric drive. Only in the following years, when sales of electric vehicles grew, models with new bodies, specially adapted to the new generation of the drive began to appear. The introduced differences for vehicles with electric drive mainly concerned the minimization of aerodynamic resistance (smaller drag coefficient and frontal area), reduction of the vehicle weight by the use of composite and aluminum materials, and the installation of narrower tires with a lower rolling resistance coefficient. The situation is similar on the market of new vessels, which electric drive port tugboats undoubtedly are.
Trends related to the design of innovative hull structures for port tugs can already be observed in structures implemented by Damen Shipyards, for example the Damen RSD-E TUG 2513 tug [
21] or the RAMORA concept designed by Robert Allan Ltd. (Vancouver, BC, Canada) [
22].
This article assumes that the tug in question will be a zero-emission tug, equipped with an electric energy storage based on LFP cells, which, through inverters, will power two electric propulsion motors that transmit their torque to thrusters.
2. Port Tugboat Work Profiles
A typical work profile of a port tug consists of three stages: approach to the assisted unit, assistance, and departure from the vessel to its berth. In most cases, assistance is performed for a vessel entering or leaving the port. This means that either the assistance starting or ending point is close to the berthing place of the tug, while the other point is further away. It is obviously related to the distance from the ship’s berth to the roadway, where assisting tugs join or leave the assisted vessel.
It is difficult to consider the energy consumption during the assist maneuver itself, because it depends, among other things, on the size and mass of assisted vessel itself and its cargo, the weather, and the experience of the captains participating in the assist maneuver. The multitude of these factors makes each assist maneuver unique. On the other hand, the stages of approach and departure from the assisted vessel are much more repeatable, because during them the tug maintains a constant speed, often close to the maximum speed. This allows for a fairly accurate estimation of the energy consumption at these two stages of tugboat operation.
There are publications describing the degree of load of the tug’s engines during operations [
8], but there is no information available on the time distribution of tugboat speed.
In order to collect statistical information on the speed of movement of the tugs, publicly available data from the automatic identification system (AIS) message monitoring was used, including information on the name and identification number of the craft, its location, speed and course [
23].
The study was based on the data emitted by tugboats operating in the three areas with large ports: London, Tokyo Bay and the port of Houston. Six vessels active in given waters were randomly selected, three operating in the Port of London area, two serving Tokyo Bay ports, including the ports of Yokohama and Yokosuka, and one in the Port of Houston. The data was collected during one week in May 2021. The parameters of the selected tugs are presented in
Table 1.
Four of the chosen tugboats use an ASD drive, while the Svitzer Meridian tug uses an ASD variant called an azimuth tractor drive (ATD), which consists of two azimuth thrusters at the front of the hull and a fixed stabilizing fin at the stern. The last of the tugs, Capt. Frank W. Banta, has a classic two-screw drive.
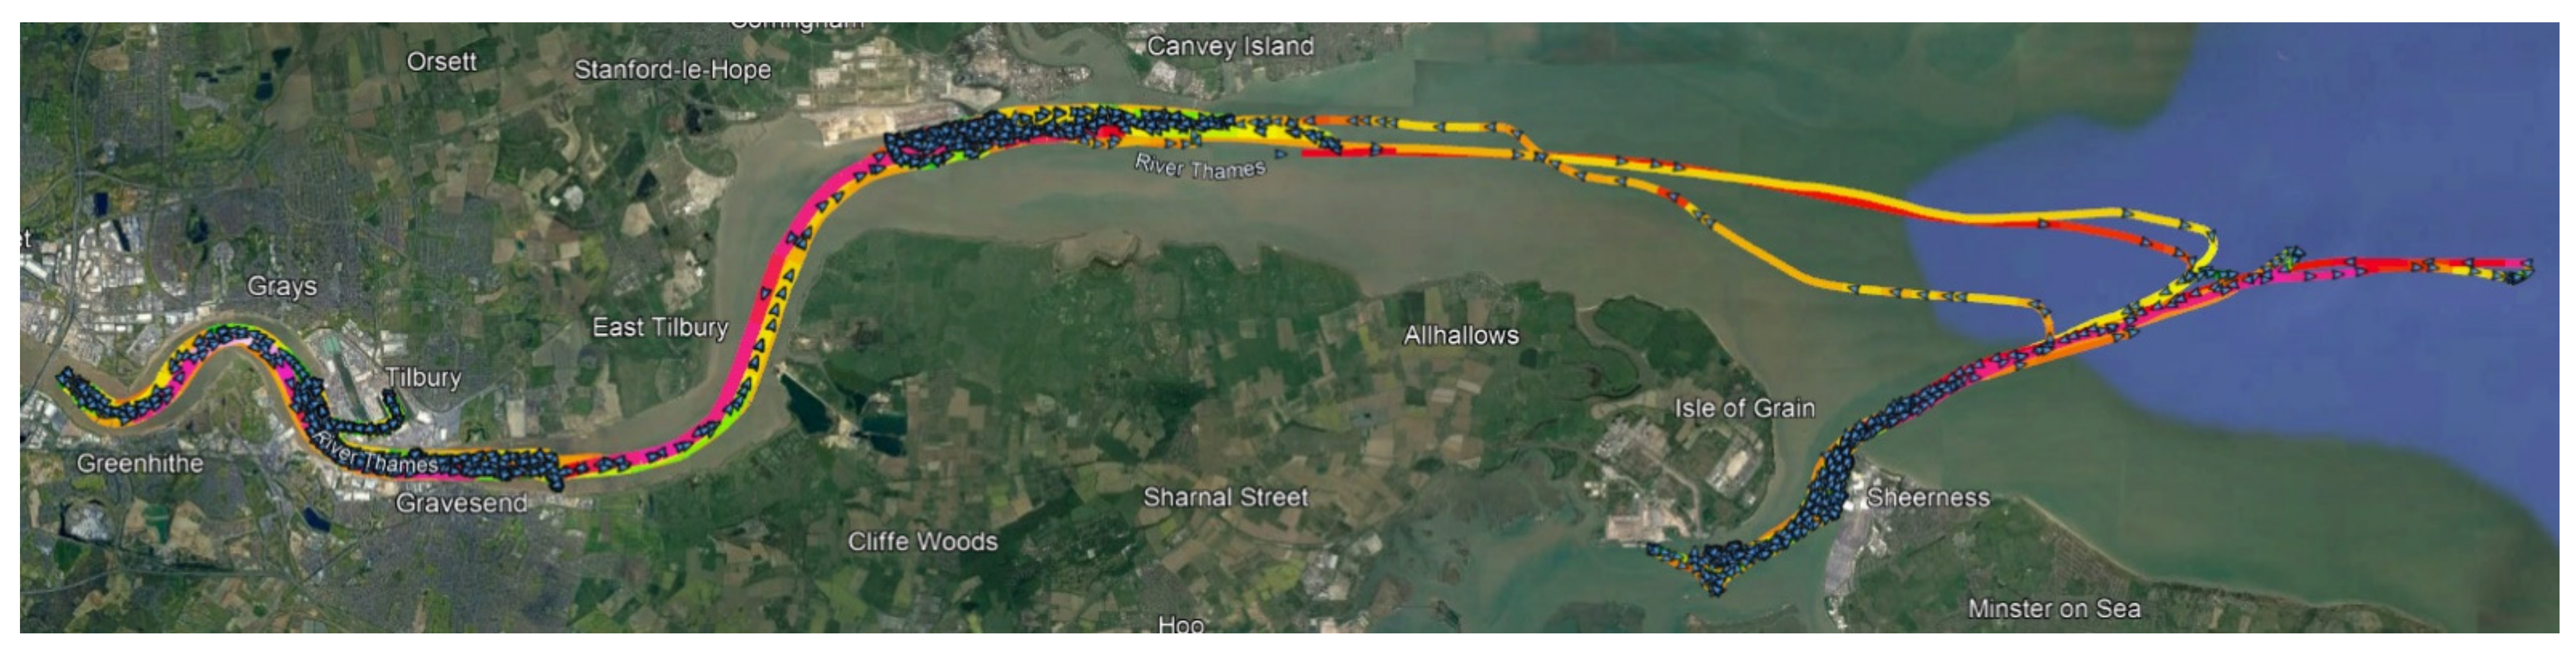
Figure 2,
Figure 3 and
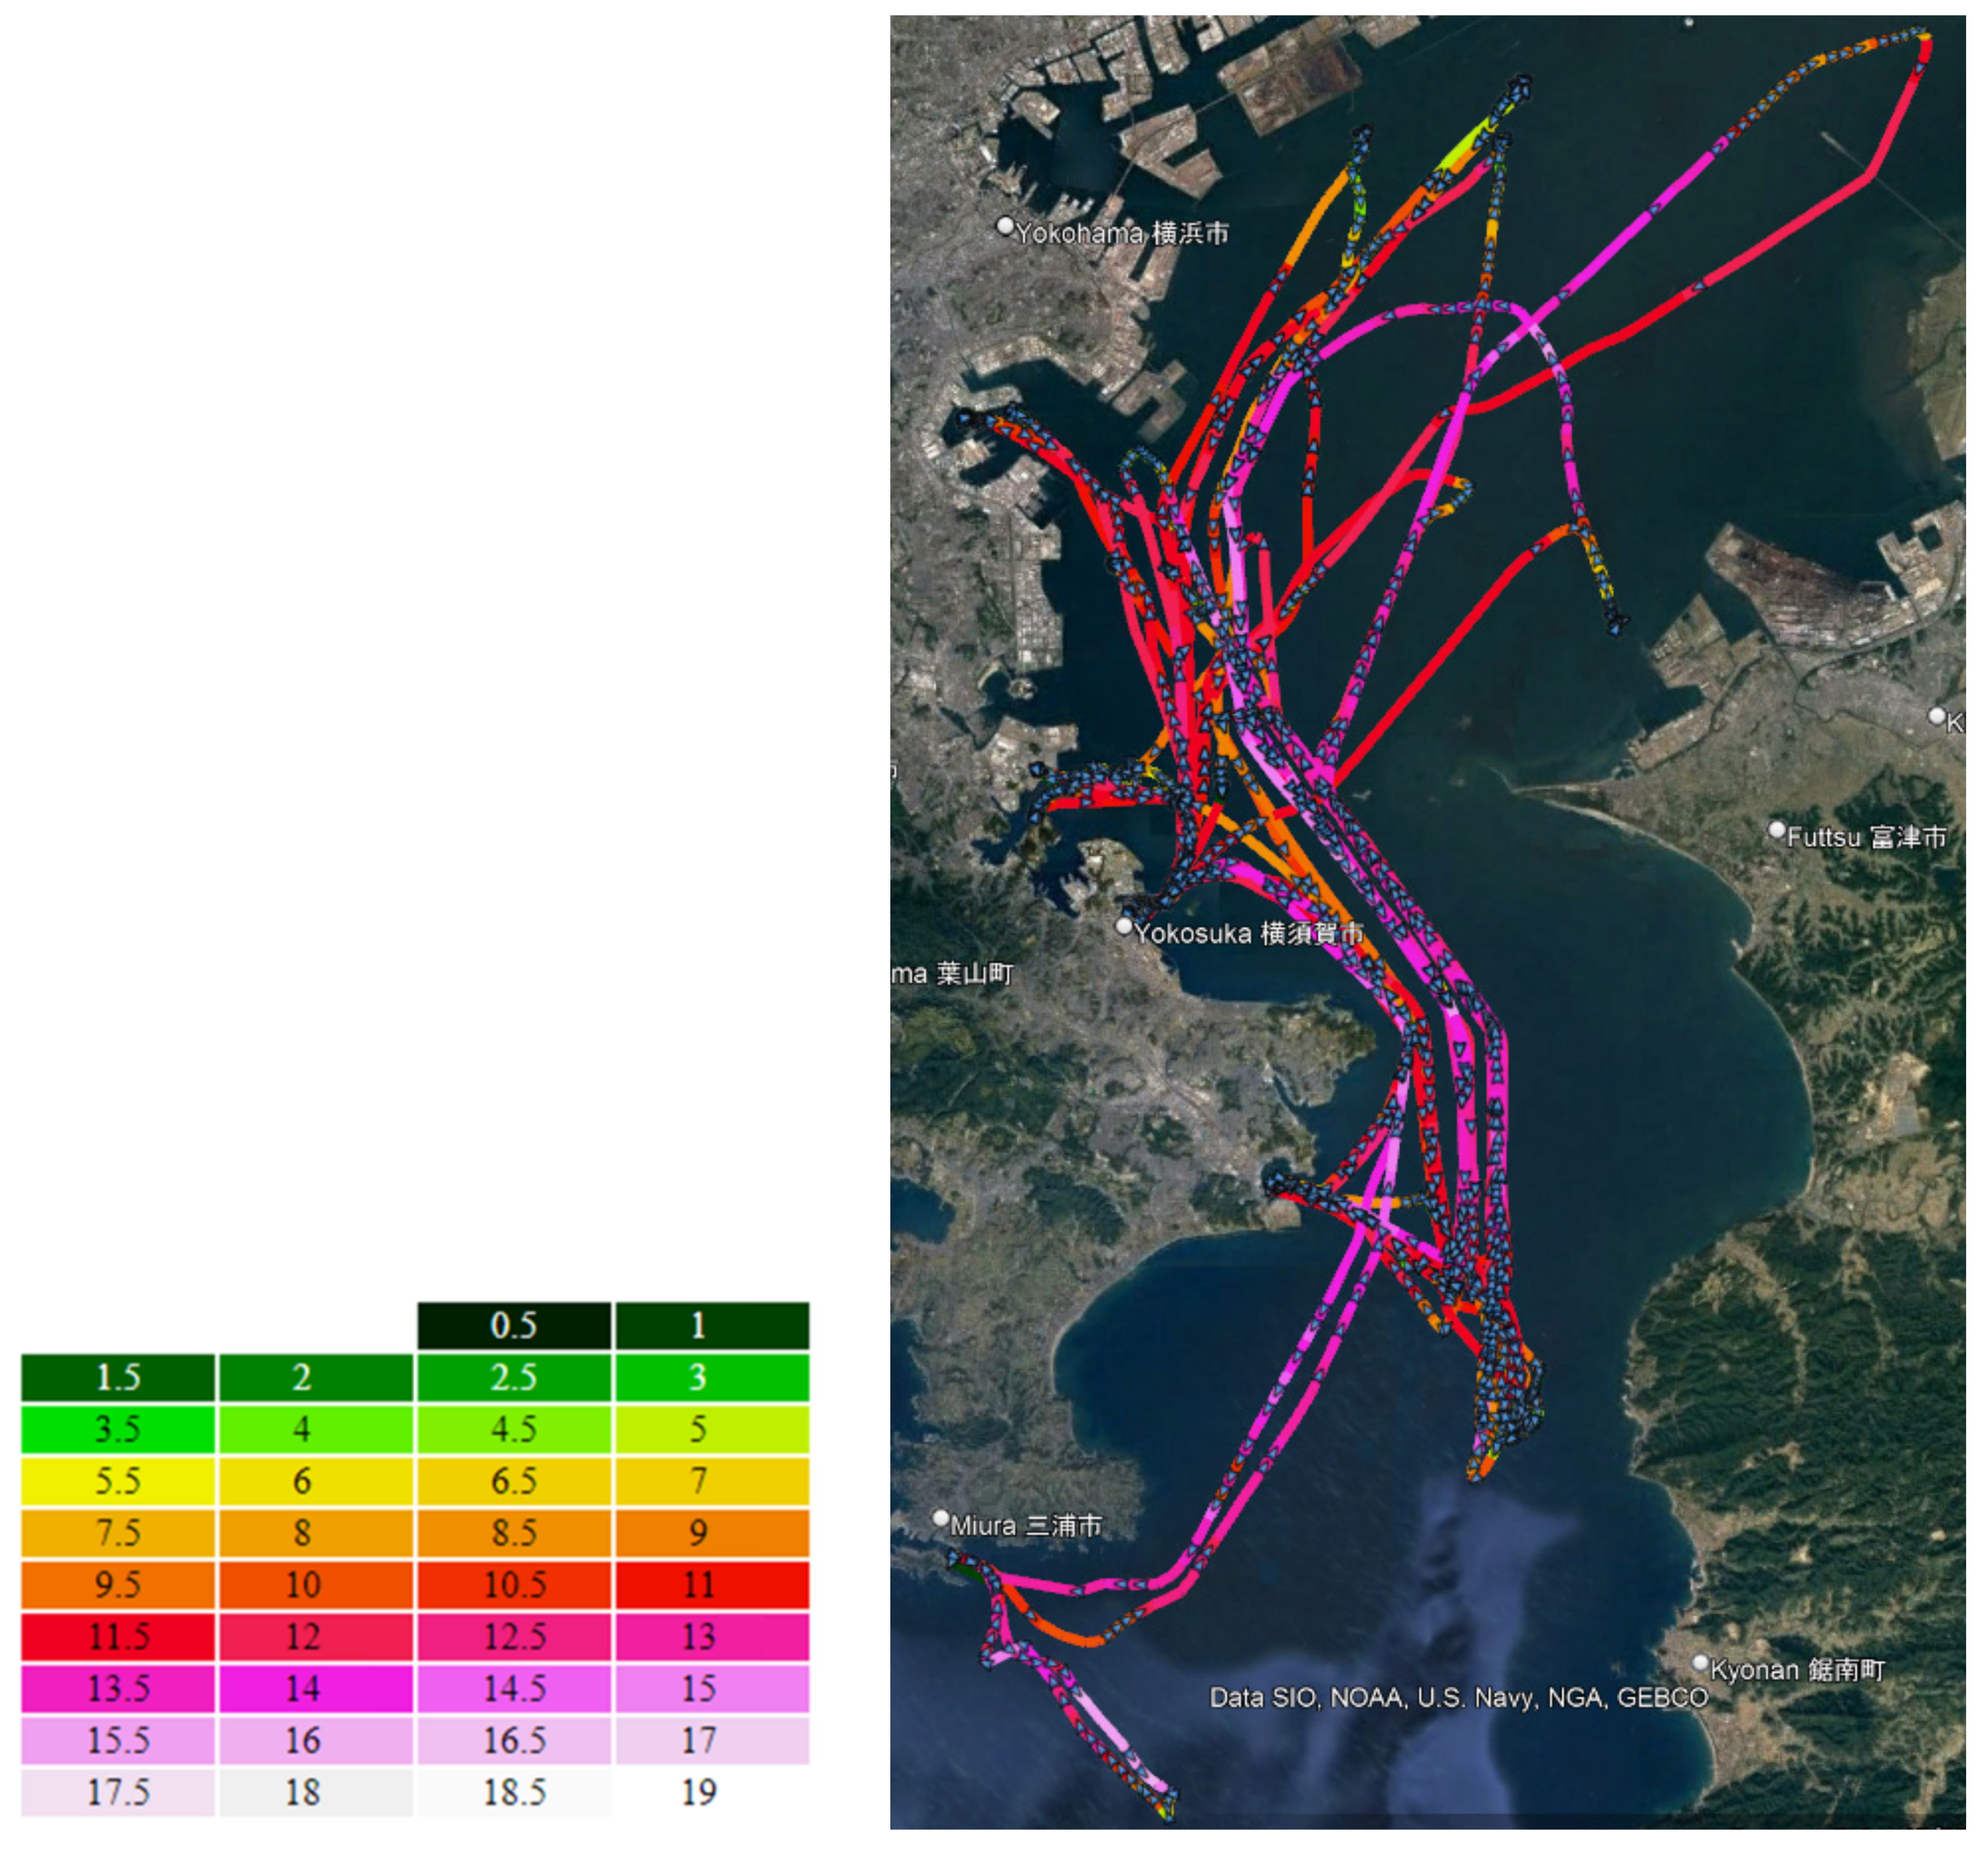
Figure 4 show maps of the selected waters, namely the Port of London (
Figure 2), Tokyo Bay (
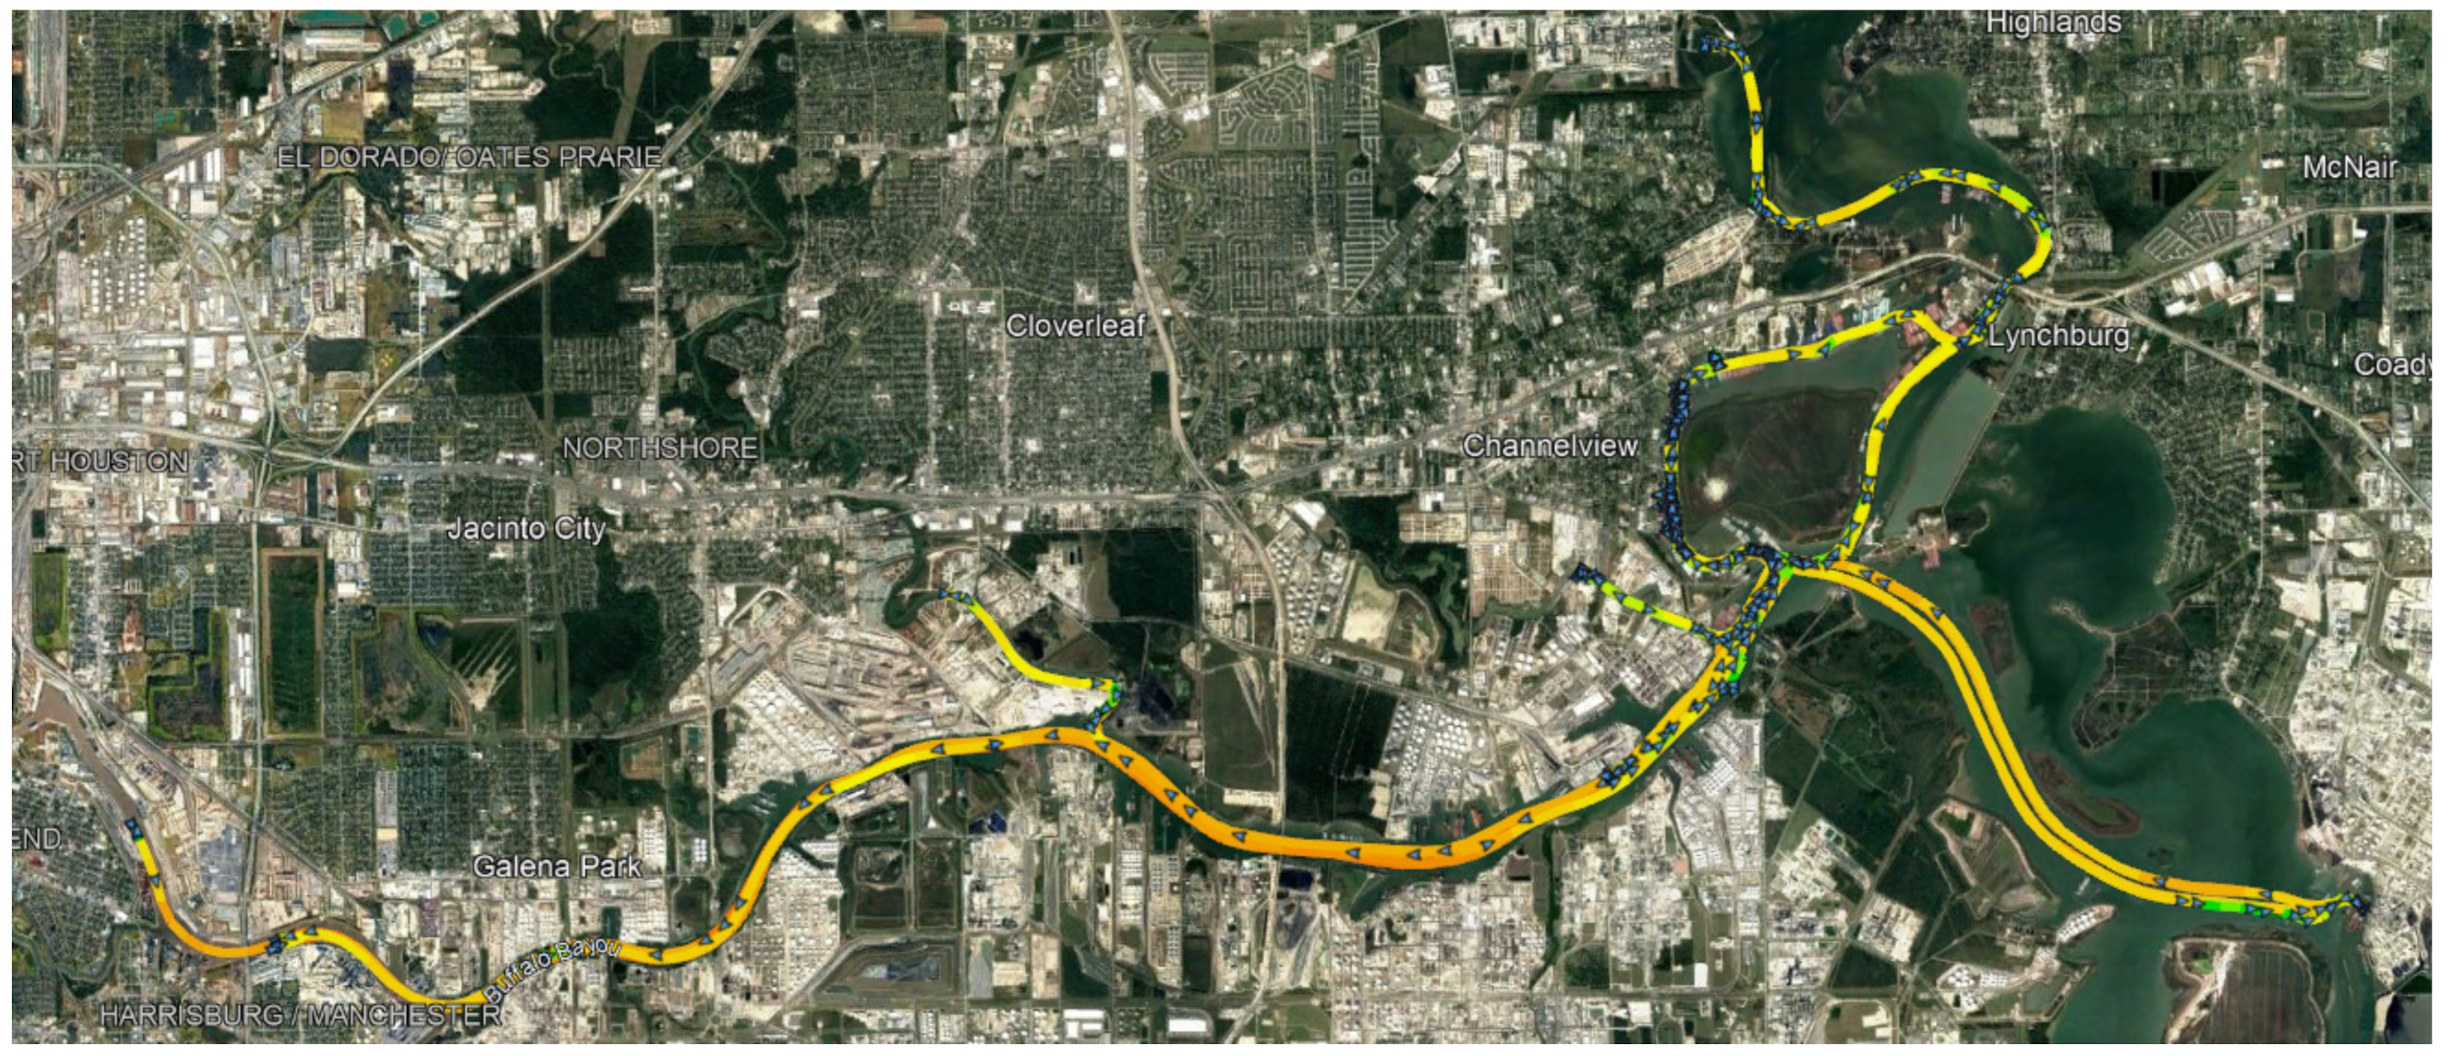
Figure 3), and the Port of Houston (
Figure 4), drawn using the Google Earth package, with the superimposed routes obtained from AIS data. Each line on the map, colored according to the color scale shown in
Figure 4, represents a data segment during which the tugboat was moving at the specified speed.
Each segment covers a speed range with a resolution of 0.5 knots. The end of one segment is also the beginning of the next one, and its geographic coordinates correspond to the location of the icon in the form of a blue arrow on the map. The direction indicated by the arrow is consistent with the tugboat course reported by the AIS data at the given point.
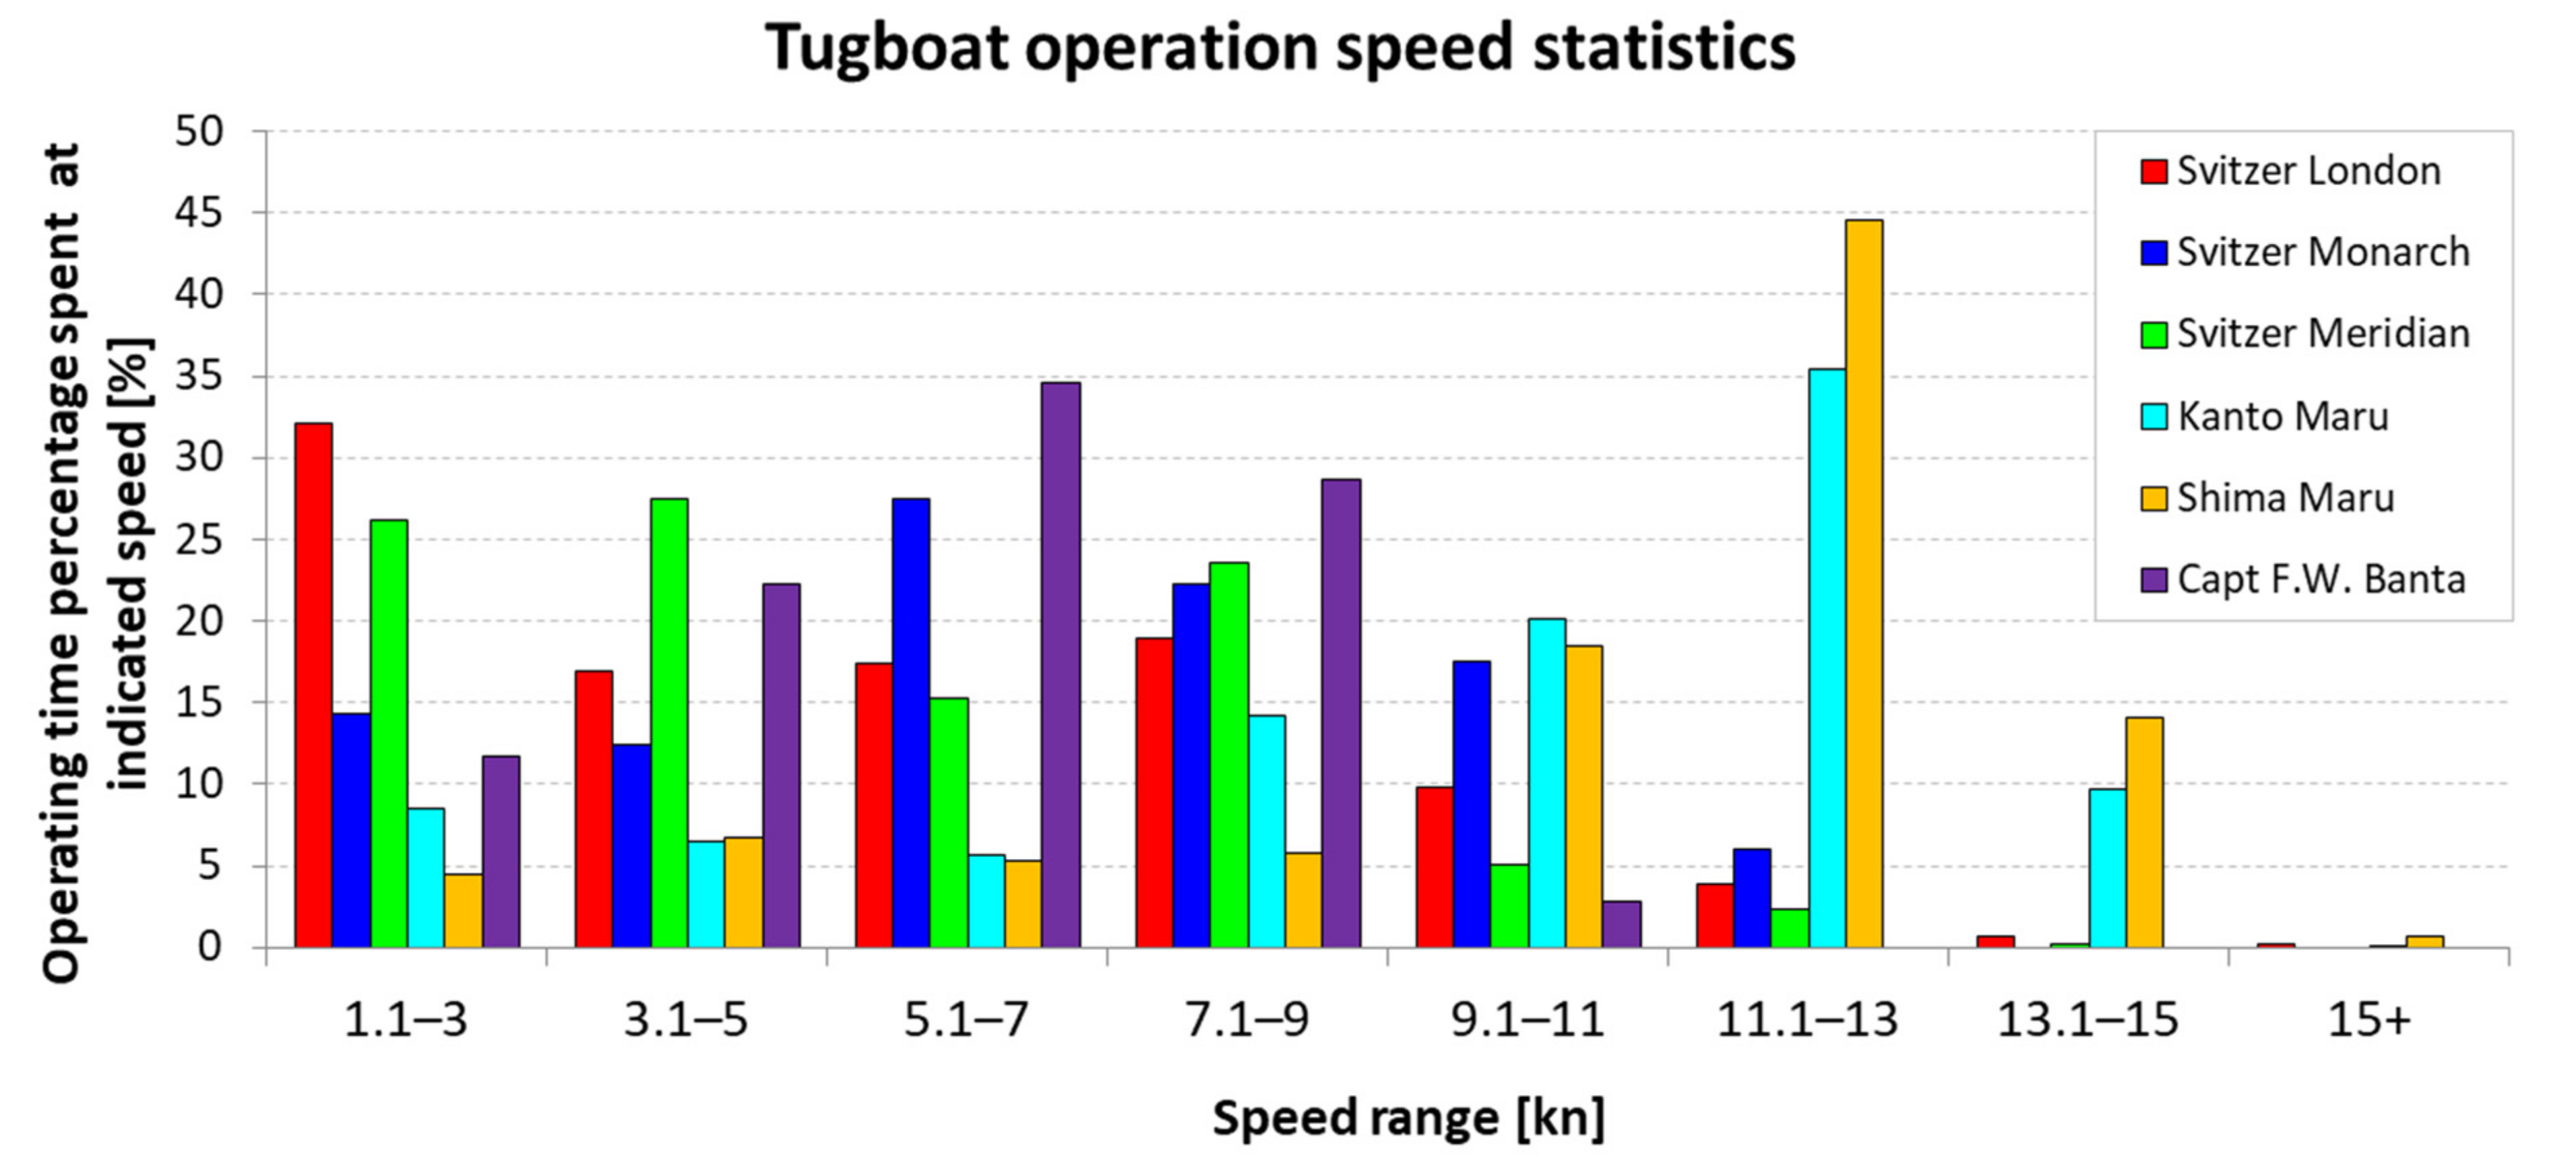
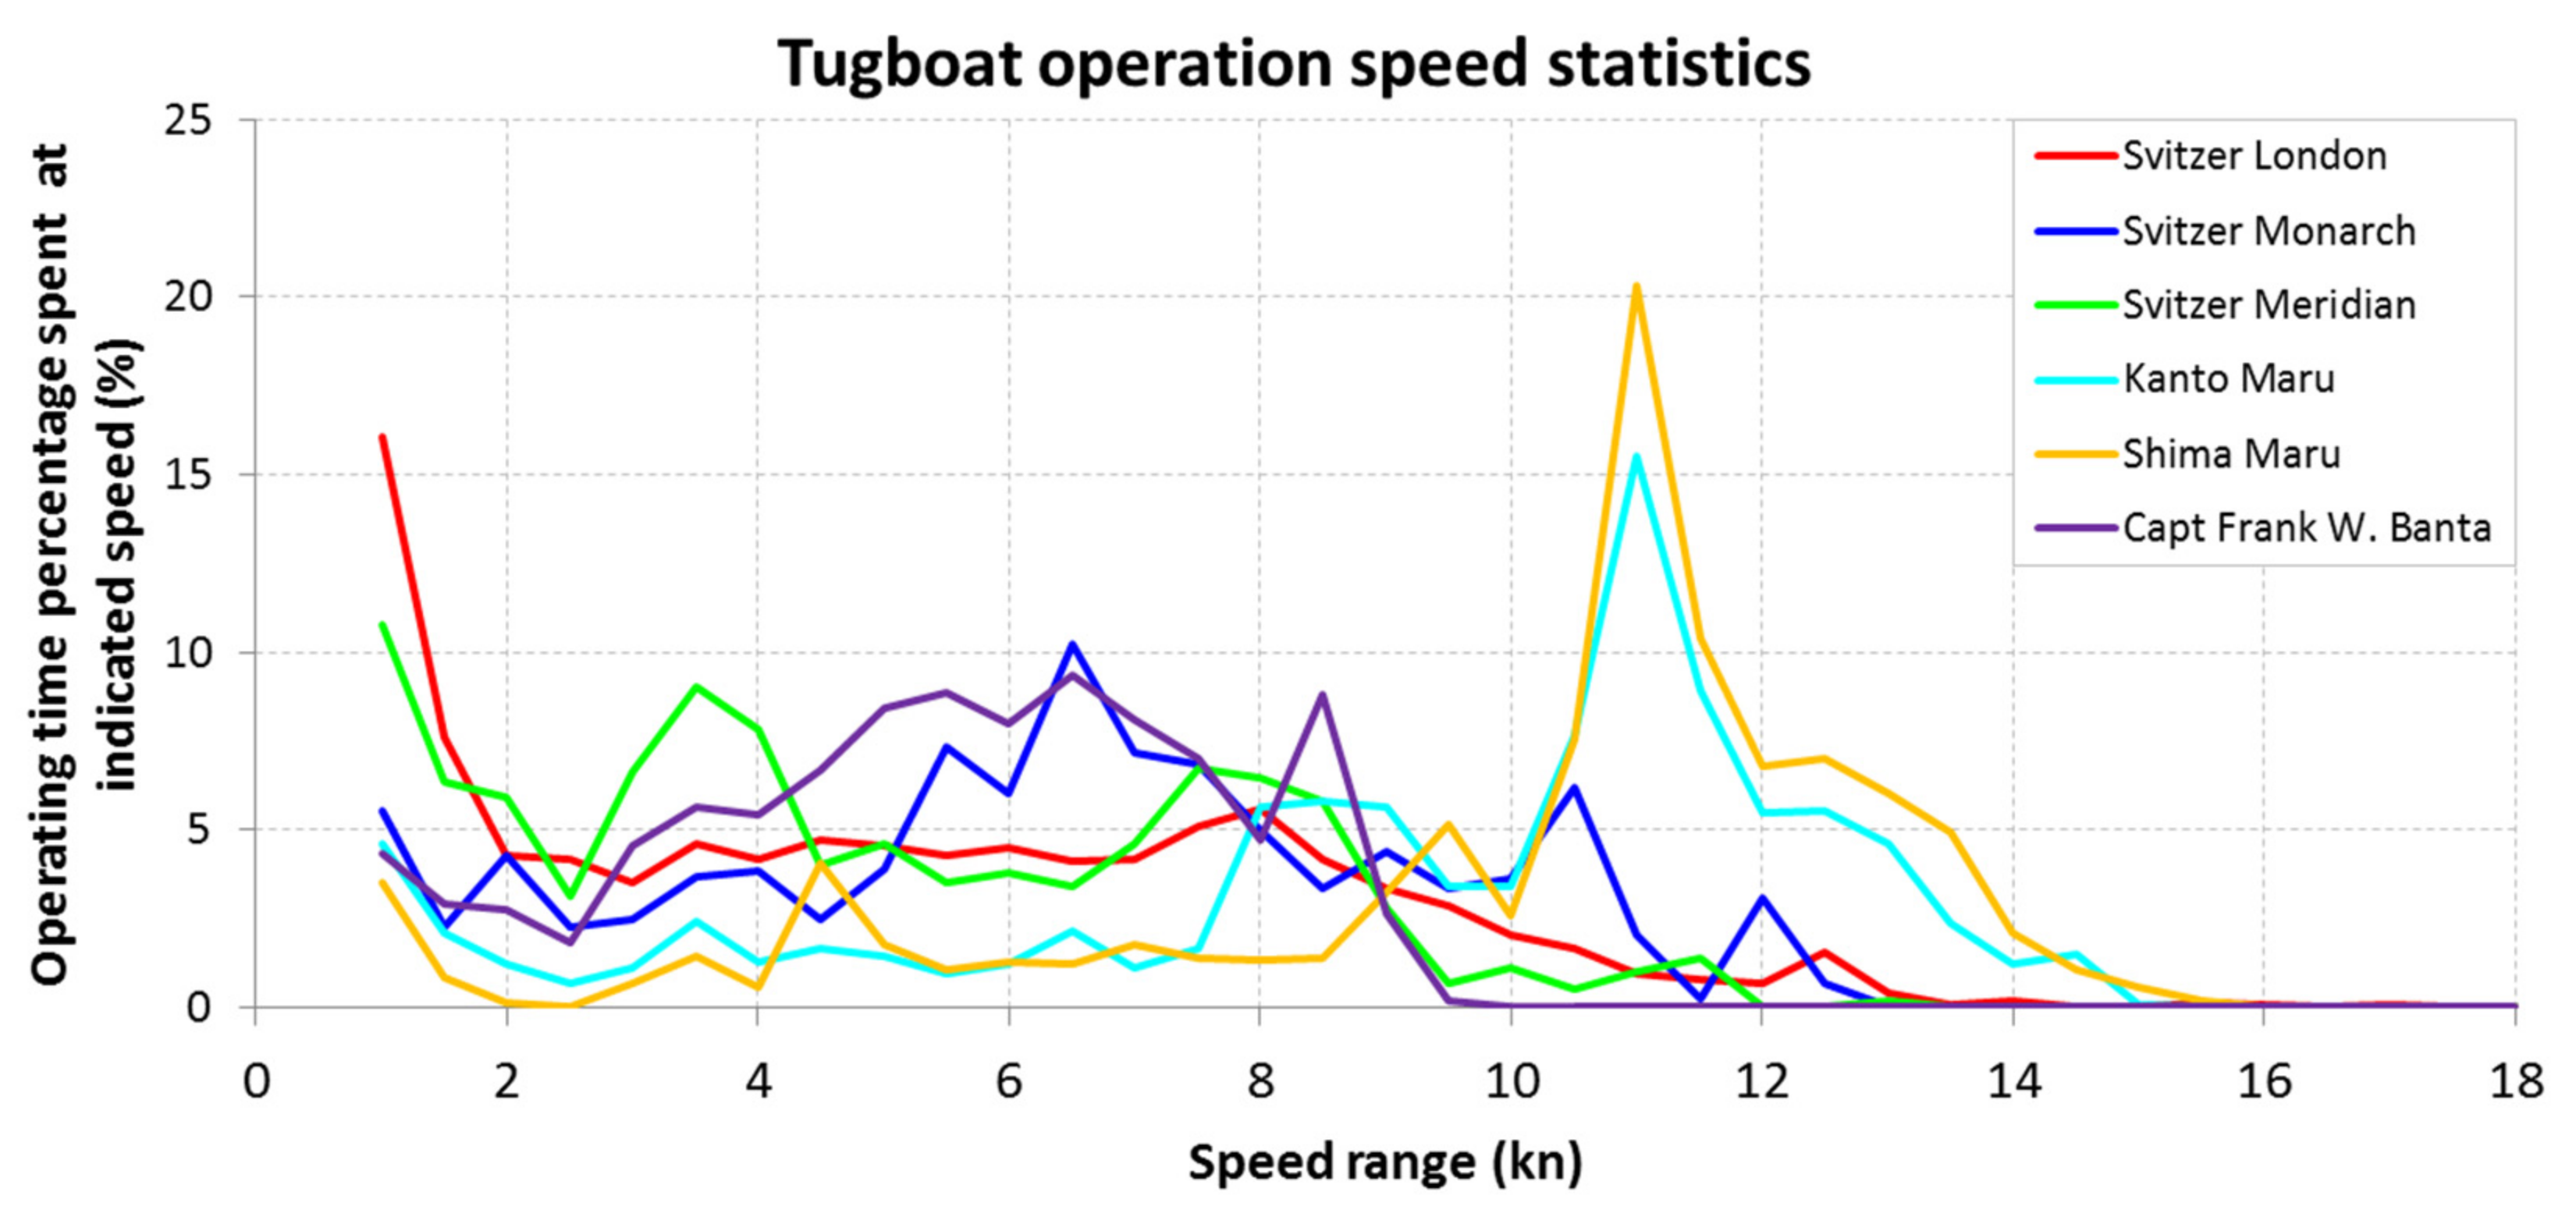
The data presented in
Figure 5 shows that the tested tugs rarely exceed a speed of 16 knots. These tugboats have a total engine power of approximately 3–5 MW. In the case of tugs operating in the London area, it must be taken into account that the speed measurements transmitted by the AIS system used in the research indicate the speed above the ground. The current flow velocity of the Thames River can typically be up to 4 knots [
32], which, depending on the direction in which the tug is moving, may cause an up to 4 knot difference between the speed in relation to the water and the speed reported by AIS.
It can be seen that both Tokyo Bay tugboats have a distinct peak in the speed distribution plot around 11 knots. This is due to the regulations limiting the speed of ships in the Uraga Channel to 12 knots. The Uraga Canal is a highly congested waterway due to the fact that it is the only connection between the Pacific Ocean and many major Japanese ports, including the Port of Tokyo, the Port of Chiba and the Port of Kawasaki.
Speed data from the AIS system was analyzed with division into ranges having a width of 2 knots, starting from the speed of 1 knot. It was assumed that a speed of more than 1 knot meant that the tug is working. The work time
Wtk at the k-th speed range was summed up according to the equation:
where:
Wtk—Total work time spent at k-th speed range,
n—number of AIS data points,
tki—i-th time period spent working at k-th speed range.
The total work time
TWt is the sum of the work times in
Wtk from all eight speed ranges:
The percentage share of the k-th speed range
WPk is defined as a fraction of the total work time:
Figure 6 and
Table 2 present the
WPk values derived from the analysis of information from the AIS transmissions of each of the tugboats, arranged according to the speed ranges.
As the results above show, most tugs do not exceed a speed of 15 knots. The maximum speed will be limited not only by physical factors, such as the total engine power or the length of the hull, but also organizational factors, such as regulations in force on a given body of water.
On the other hand, the speed during the assistance maneuvers in the port generally does not exceed 5 knots [
33], which makes it possible to estimate what percentage of the working time is spent on moving. Based on the data in
Table 2, it is possible to determine what percentage of the tugs’ working time was spent traveling at a speed of more than 5 knots. For the Svitzer London tug it was 51.0%, for Svitzer Monarch 73.3%, for Svitzer Meridian 46.3%, for Kanto Maru 85.1%, for Shima Maru 88.8%, and for Capt. Frank W. Banta 66.0%.
For all tested tugboats except the Svitzer Meridian, more than half of the working time is devoted to traveling at a speed where the shape of the hull can have a significant impact on energy consumption.
3. Port Tugboat Energy Consumption
The power required to run a ship at a given speed is one of the basic parameters determined at the design stage. It is no different with the tugboat, although in the case of diesel-powered tugboats, the power–speed characteristics are not at priority as in the case of, for example, merchant ships.
Unlike in tugs powered by conventional fuel, in the case of an all-electric tug, energy consumption directly translates into the available operating time in the periods between replenishment of the energy storage, which is the tug’s main source of energy. Each improvement that reduces the amount of energy required per time unit not only leads to financial savings, but also extends the period between recharges of the energy storage, prolonging the time when the tugboat is available. Taking into account the possibilities offered by modern design methods, it seems advantageous to optimize the shape of the hull in order to reduce the energy consumption for the normal movement of the tug, which allows more energy to be reserved for use during operation.
The basic tools used in the design of the hull shape are regression methods. For commercial ships, the classic method of this kind is the Holtrop method [
34], however, its application to the analysis of the tug hull is insufficient due to the low ratio of length to width of the tugs, amounting to between 2.4 and 4.4 for the tugs analyzed in the previous chapter.
The appropriate method seems to be the Van Oortmerssen method [
35], intended for small vessels, such as fishing vessels or tugboats. There are also other, dedicated methods, such as the Compton method [
36], intended for fast ships such as patrol units or warships. Choosing the right method is a significant matter, because with the same input parameters, it can yield significantly different results.
According to the method proposed by van Oortmerssen [
35], it is possible to estimate the total resistance encountered by a moving ship as the sum of the resistance RW resulting from the waves generated by the ship’s hull and the frictional resistance RV of the water against the hull:
where:
RT—total force of hydrodynamic drag acting on the ship in (N),
Fn—Froude number (-),
Rn—Reynolds number (-),
p1...pn—statistical parameters specific to a given hull,
RW—wave resistance force in (N),
RV—water friction against the hull resistance force in (N).
The Froude number is used to compare the resistance of hulls of similar shape but of different sizes [
19], and is given by the expression:
where:
v—vessel speed (m/s),
g—standard gravity (m/s2),
L—hull length (m).
There is a range of applicability for the van Oortmerssen method, expressed as a maximum Froude number of 0.5 [
37], which for the 32 m tug under consideration corresponds to a maximum speed of 17.2 knots.
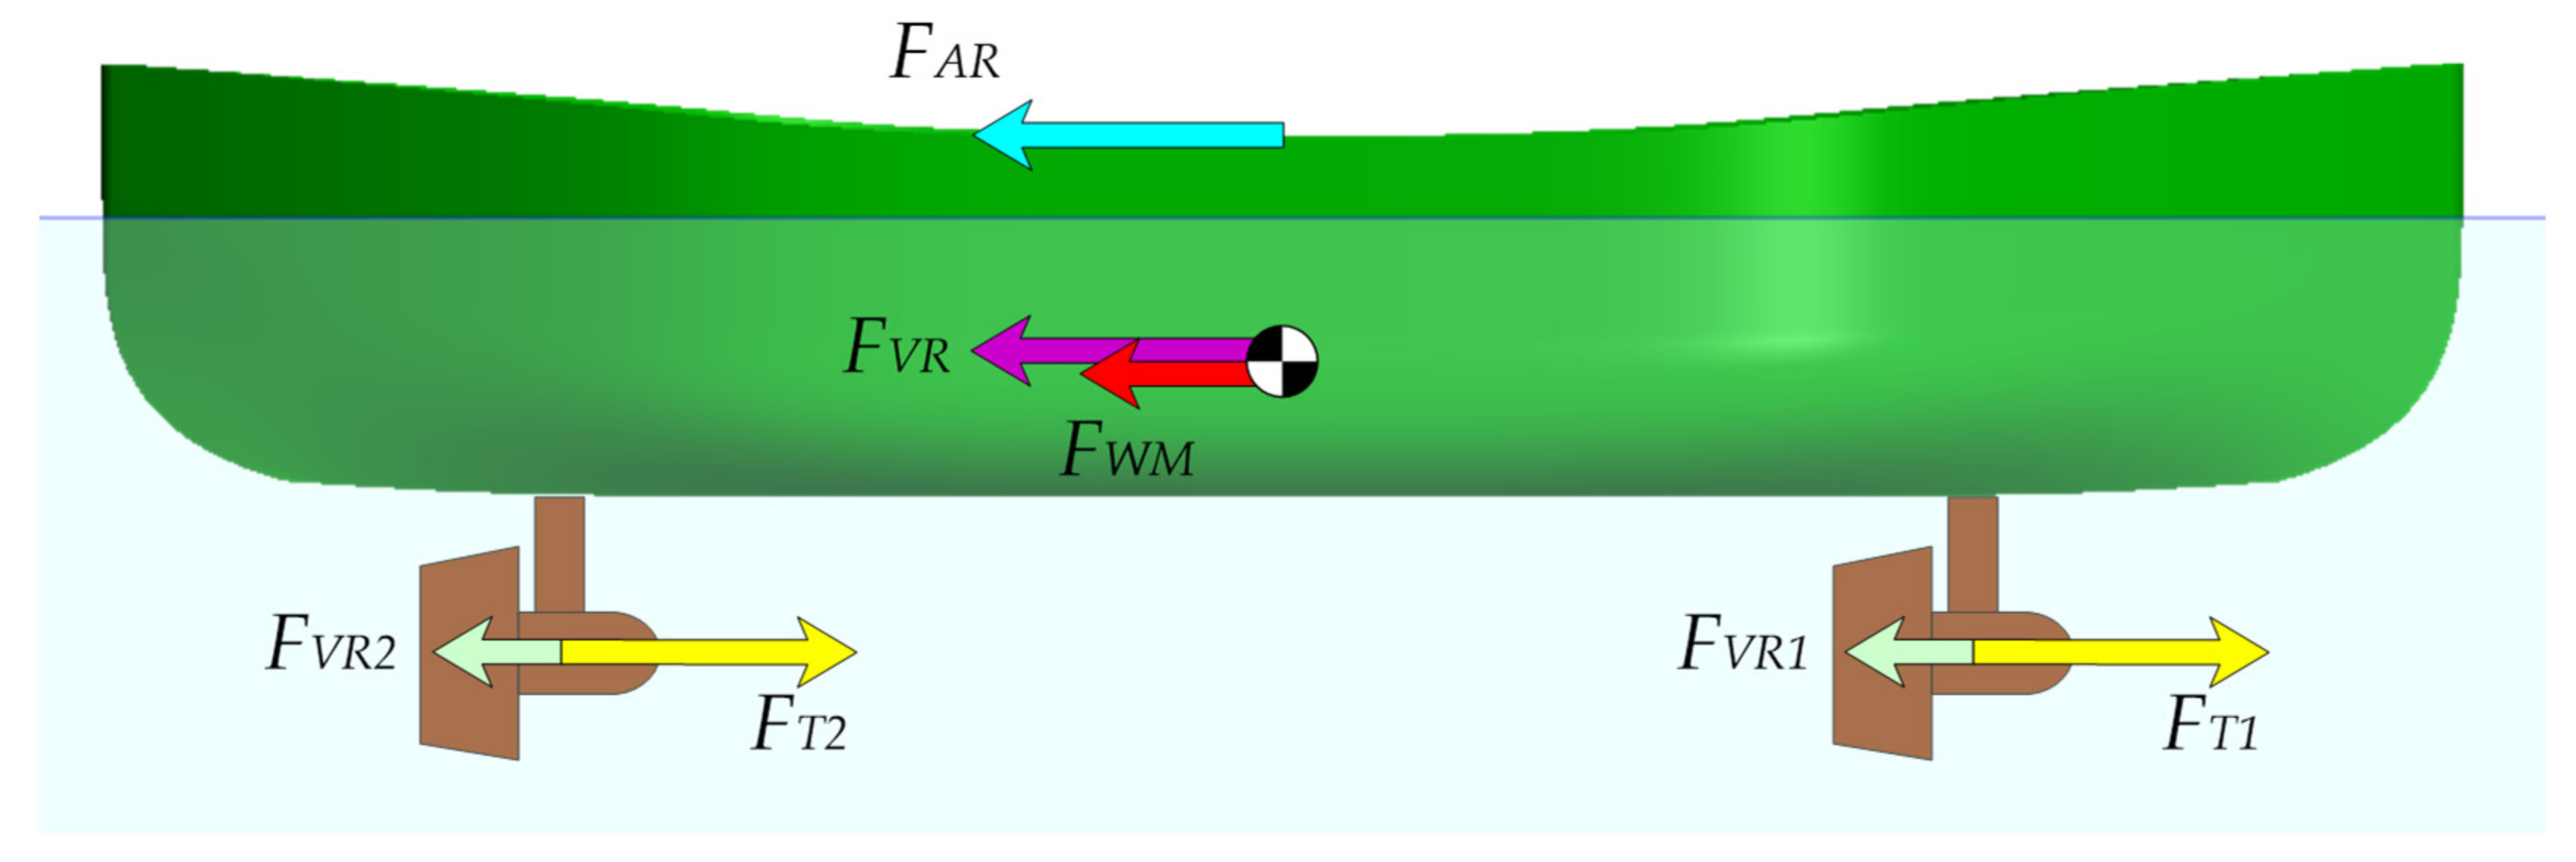
In the case of a tug equipped with two azimuth thrusters, one close to the stern and the other close to the bow, the water friction force against the thrusters should also be considered. Thus, the hydrodynamic resistance
FTH can be described by the following equation:
where:
FTH—sum of main hydrodynamic resistance,
FWM—wave resistance related to the hull,
FVR—water frictional resistance related to the hull,
FVR1–water frictional resistance related to the fore (bow) thruster,
FVR2–water frictional resistance related to the aft (stern) thruster.
When comparing similar ship hulls, the thrusters protruding under the hull can be treated as additional elements of the hull (appendages) with a similar effect on resistance, such as: rudder or stabilizing fins, heeling keels or transverse propulsors tunnels [
19]. This allows their influence on drag to be considered regardless of the hull shape.
Finally, the upper part of the hull is affected by an aerodynamic drag in relation to the speed relative to the surrounding air. These resistances are usually a small fraction of hydrodynamic resistances due to the much lower viscosity of air compared to water [
19].
The total
FTOT resistances of a moving ship can therefore be described as:
where:
FTOT—total resistances to ship motion expressed in (N),
FAR—force related to aerodynamic drag, expressed in (N).
For a ship moving with a constant speed, the forces generated by the ship’s propellers are balanced by the drag forces, as presented in
Figure 7:
For a typical tug, the forces of wave resistance FWM and frictional resistance FVR, both depending on the hull shape, are the dominant forces in the above equation.
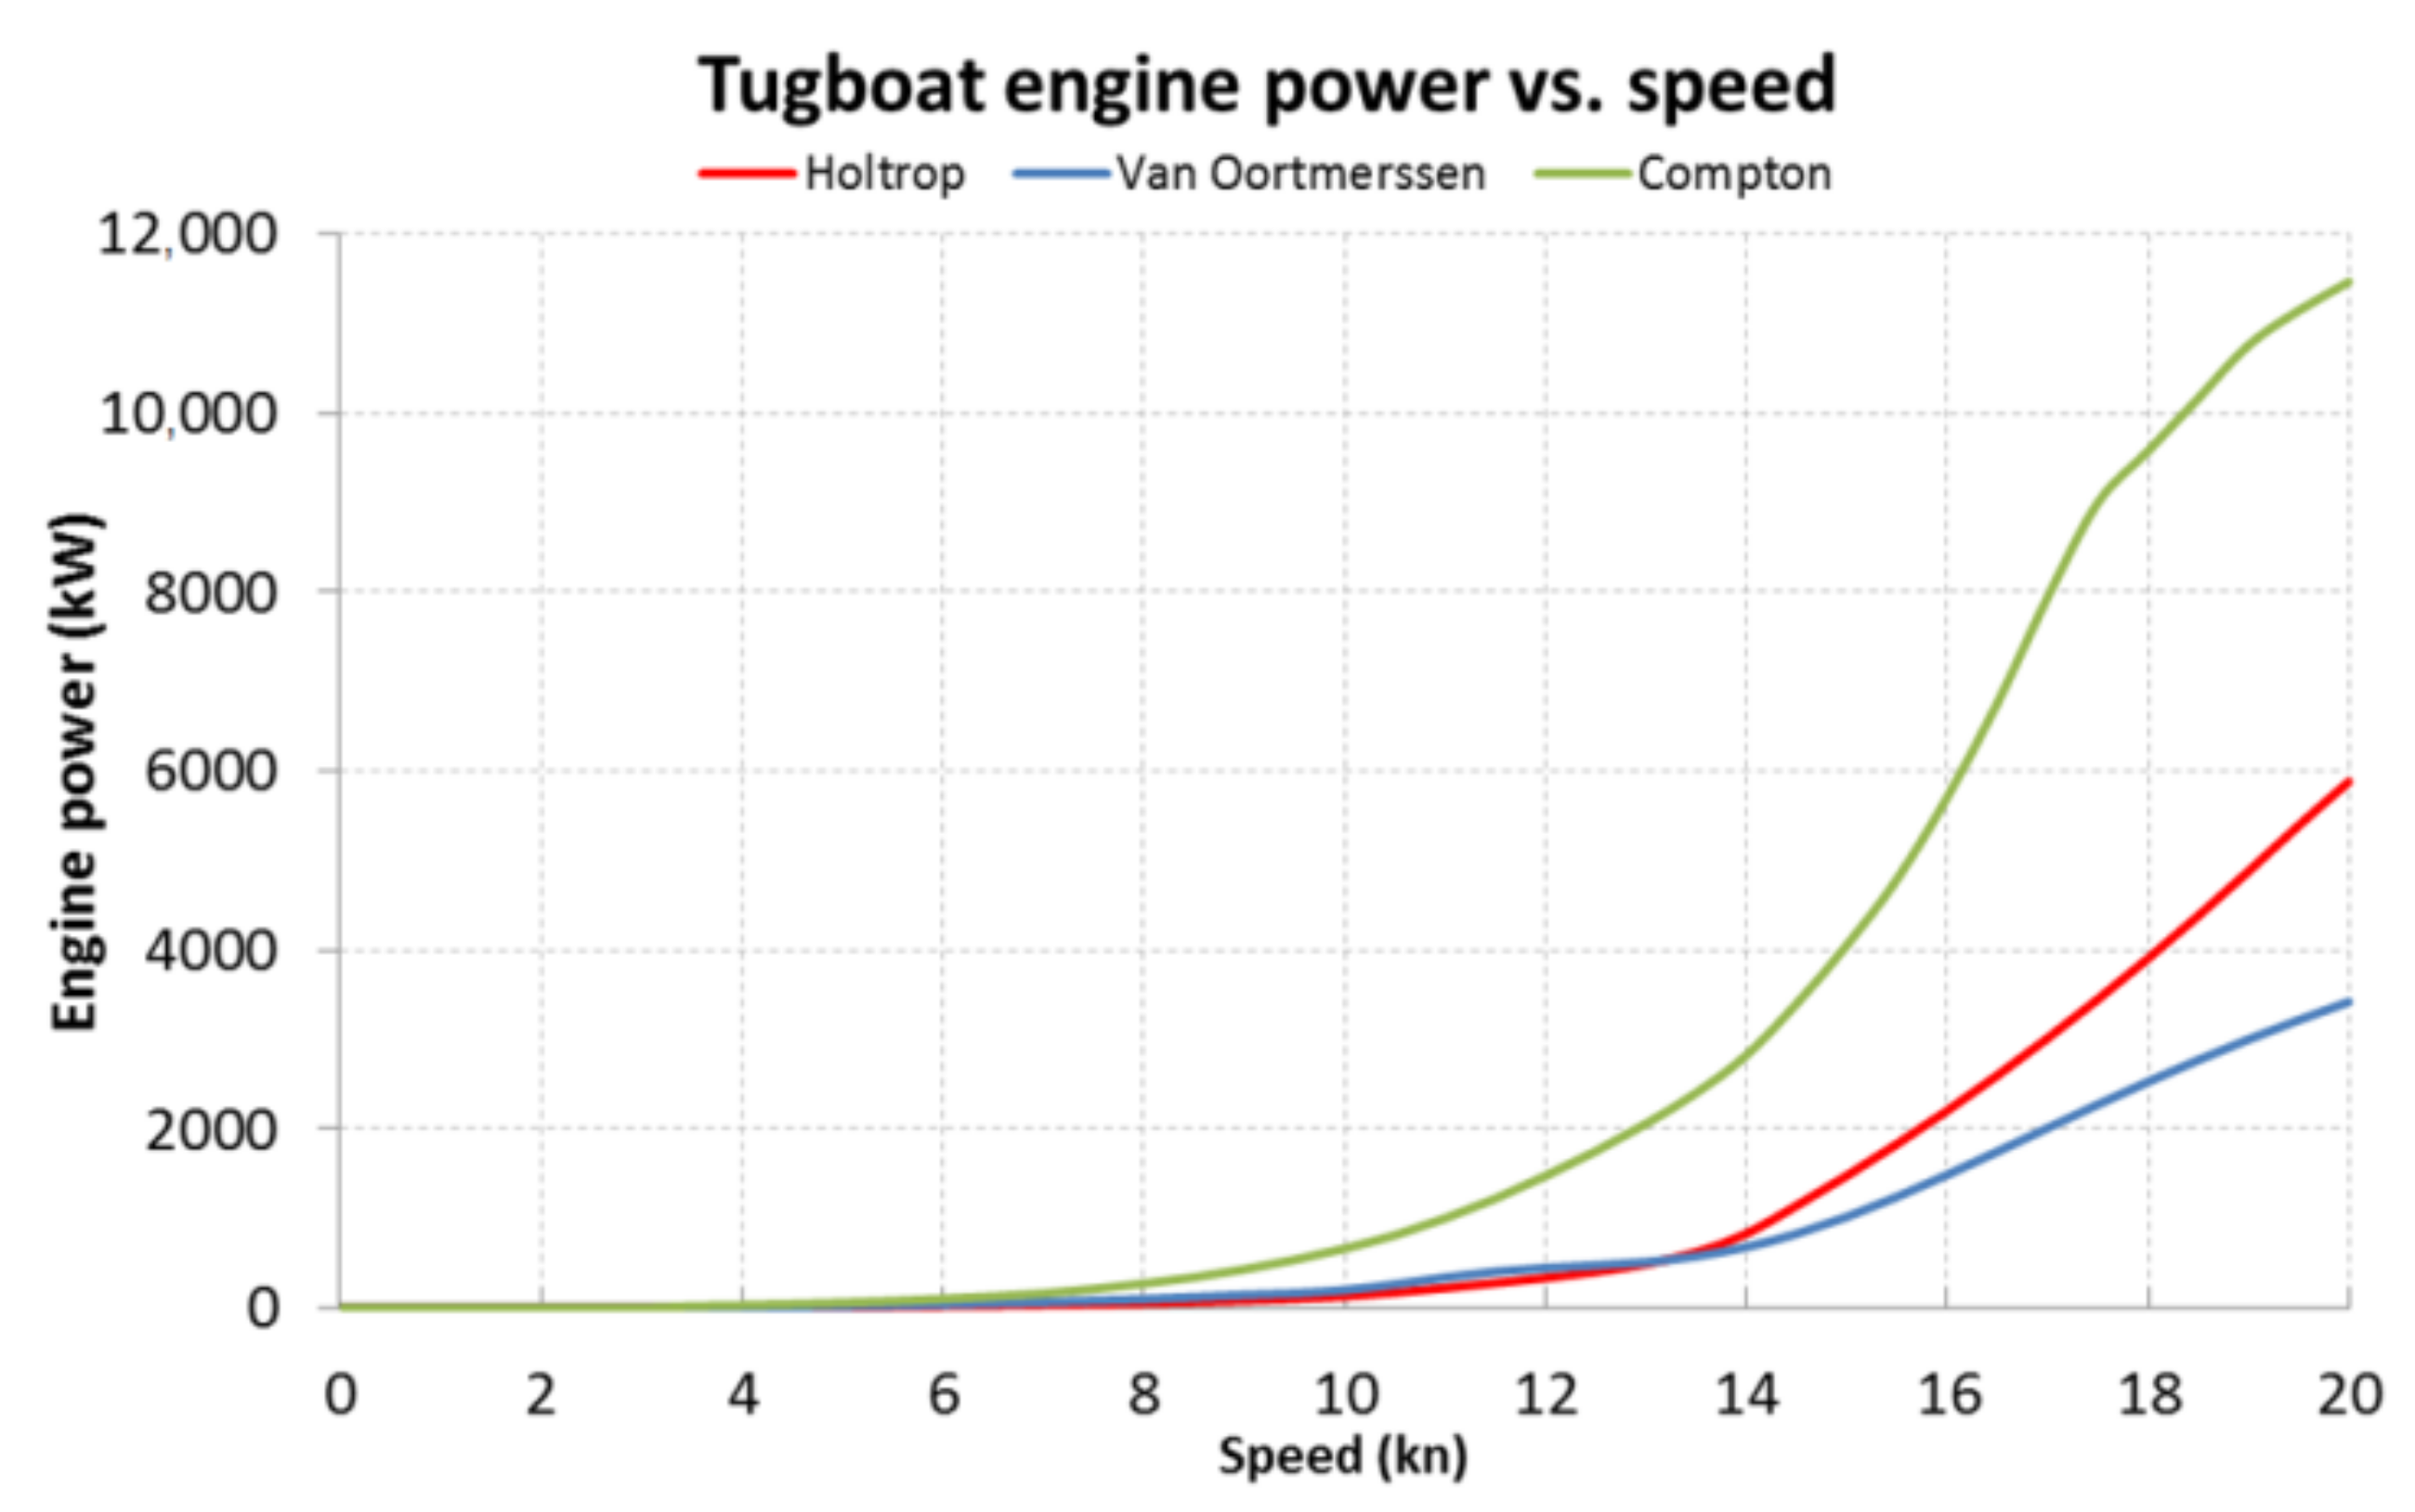
Figure 8 shows the plot of the total power demand on the engines depending on the speed of the vessel for three mentioned calculation methods. All calculations were carried out for the same hull of the tug, for which the basic parameters are presented in
Table 3.
The data in
Figure 8 seem to confirm the correctness of the choice of the Van Oortmerssen method for the analysis of the tugs’ resistance with the dimensions given in
Table 3. For the given power range of 3–5 MW, it gives a maximum speed between 14 and 16 knots, consistent with the data observed on real tugs of similar dimensions.
Port Tug Electric Propulsion System
The use of an electric drive system on the tug puts high demands on its components. Due to its purpose of securing larger vessels, the tug must be reliable. Additionally, just like conventionally propelled tugboats, an electric tugboat requires a propulsion system with great power. The only technology currently available on the market that can supply a power of several megawatts is a chemical source of electricity in the form of lithium batteries. The limited volume inside the hull of the tug requires cells with high energy density, and the amount of energy requires cells with the lowest possible cost. The cells must be organized into an electrical energy store, equipped with the necessary control and safety systems.
The cells that can meet the above assumptions are LFP cells (Lithium Iron Phosphate, LiFePO4), successfully used, for example, in electric drive city buses. Cells of this type are characterized by low cost in relation to the stored energy, the possibility of quick charging within one hour, and a large number of charge/discharge cycles counted in thousands. The second candidate may be related cells of the LTO (Lithium Titanate) type, which offer even greater durability of tens of thousands of cycles but have a lower energy density.
The need to combine the high power of drive motors with the highest possible efficiency at the same time clearly indicates the validity of using PMSM (permanent magnet synchronous motor) drive motors.
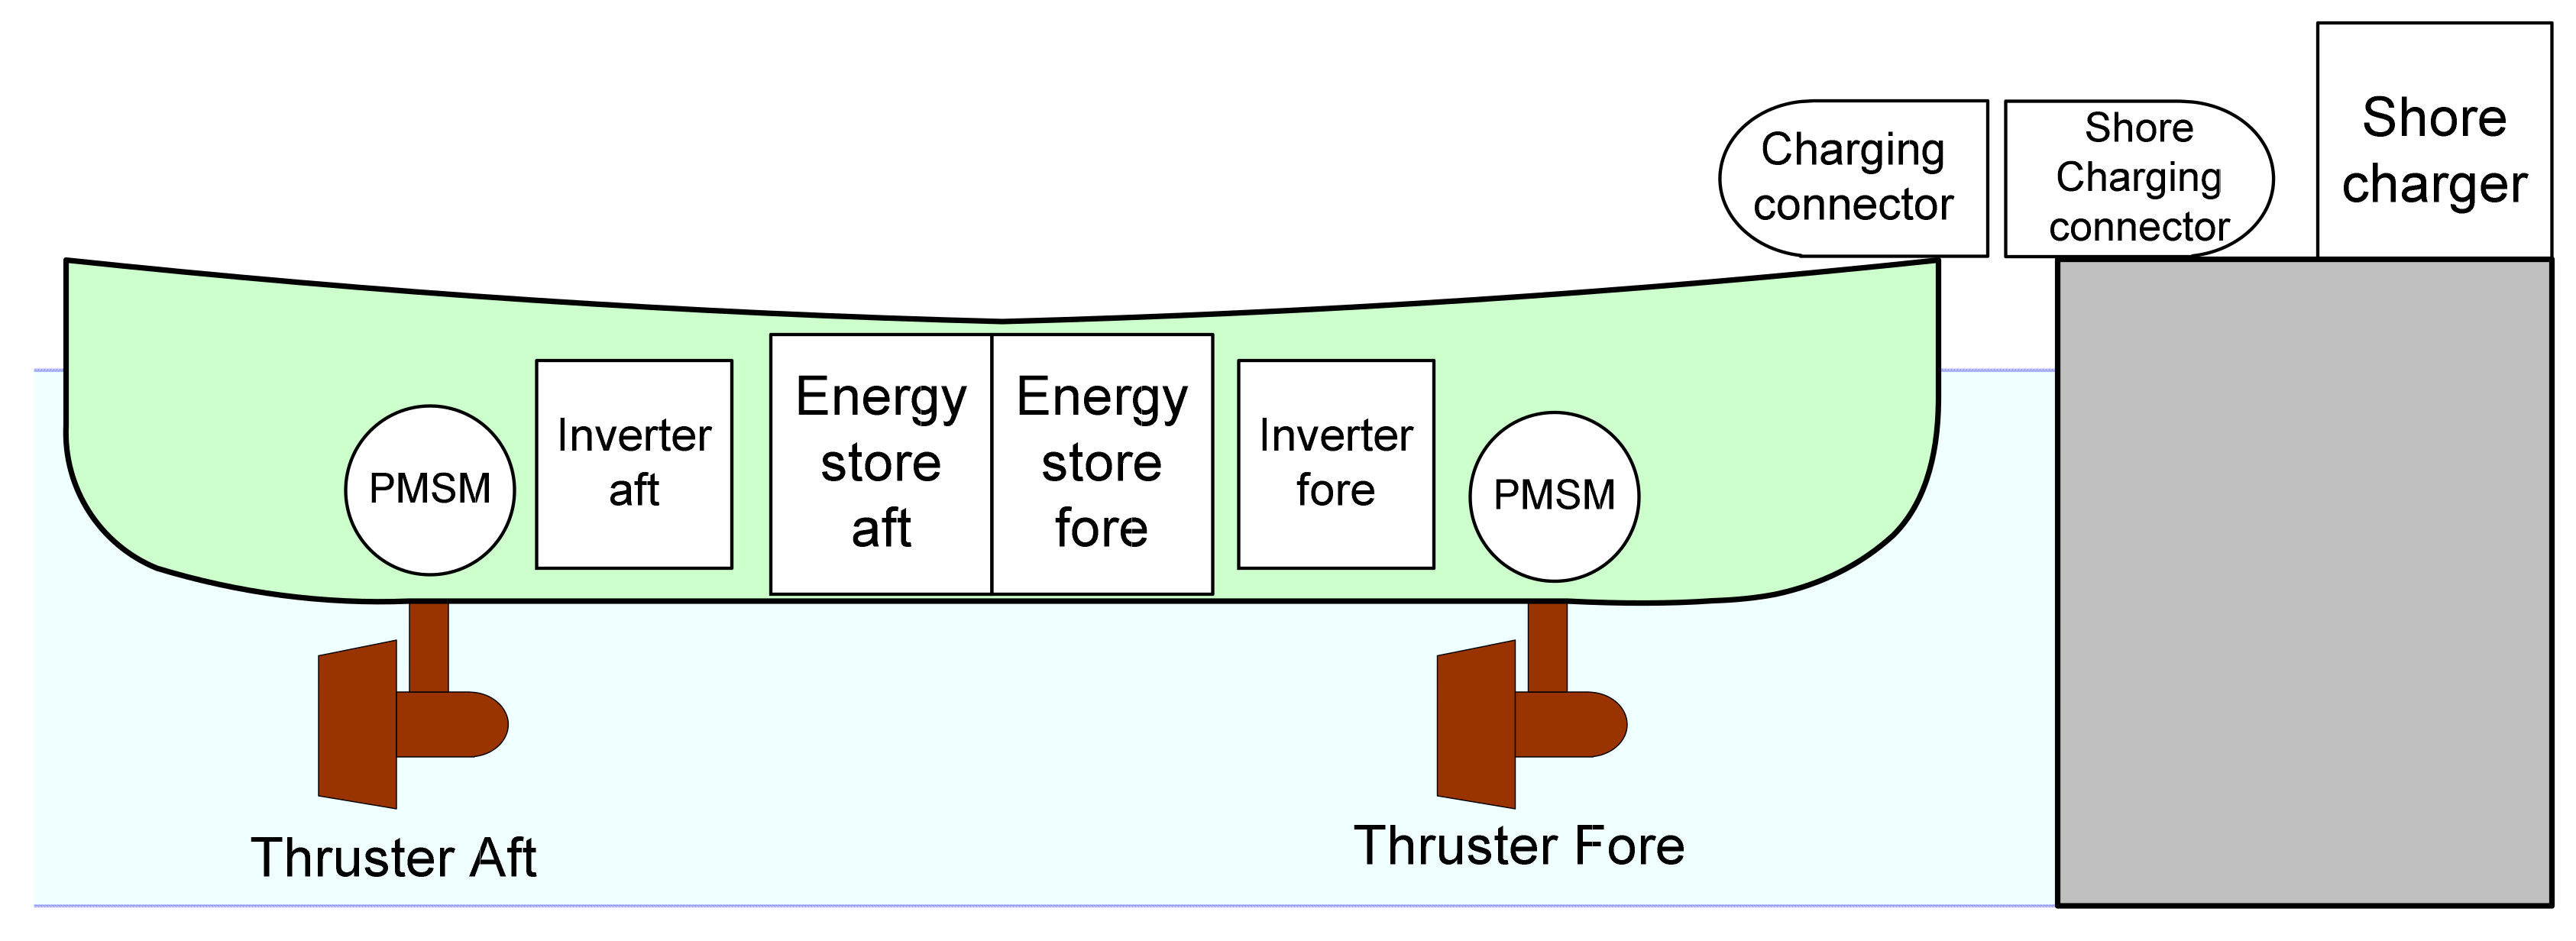
The proposed power parameters and the configuration of the propulsion system of the electric tugboat are based on the propulsion used in the Rotor Tug ART 80-32 [
38] tugboat by Damen Shipyards. ART 80–32 is a tug equipped with three azimuth thrusters driven by diesel engines with a power of 1800 kW each. The proposed electric tug configuration uses only two thrusters, one on the stern and one on the bow. Taking into account that the proposed tug has 2/3 of the ART 80–32 tug’s power, similar dimensions and uses a similar arrangement of thrusters, it can be estimated that the bollard pull will be close to 2/3 of that of the tug on which it is modeled. The towing force value of an electric tug was assumed to be 52T. The arrangement of the elements of the electric drive system of an electric tugboat is shown in
Figure 9.
The capacity of the tugboat’s energy storage system has a decisive influence on the working time possible between successive recharges. As an initial value in determining the energy amount of the store for a given tug, one can consider, for example, the volume of the fuel tank in a similar tug with classic drive.
According to [
39] a typical port tug has a fuel tank with a volume between 38 and 114 m
3, which with the density of light fuel used by the tug’s engines corresponds to a mass between 32 and 98 T. Assuming the energy density of typical LFP cells at 110 Wh/kg [
40] this means that energy storage with the equivalent mass of the fuel tank would store between 3.6 MWh and 10.7 MWh of energy.
The shore charger will be responsible for replenishing the energy in the tugboat’s energy store. Due to the local nature of electric tug operations, it always stays in the vicinity of its home port, so it is possible to install the charger outside of the ship itself. Placing the charger on land has a number of advantages, such as:
No space inside the hull or superstructure is taken,
No additional weight increases the tugboat draft,
No need to protect the charger components against contact with sea water,
No need to connect the tugboat directly to the onshore supply network, which mitigates the risk of electric shock,
Possibility of one charger being used by several tugboats,
Possibility of direct use of renewable energy sources, such as photovoltaic panels, without the need for double energy conversion using the AC power grid.
The connection of the tugboat with the shore charger will be performed by a DC charging connector equipped with main current contacts, a communication interface and appropriate security mechanisms. The charging connector will be placed on the bow of the tugboat.
For each tugboat, a dedicated berth protected against waves can be established in the immediate vicinity of the shore charger. It is possible to organize this berth in the form of pens for each tug in a given port. The pens could be equipped with an automatic mooring mechanism and a mechanism connecting the tug with the charger. This would allow for easy mooring with a quick and safe electrical connection with the charger in order to refill the energy in the tugboat’s energy store.
The rated power of the charger should be matched to the capacity of the tugboat’s energy store so as to enable its quick recharging in the event of assist need. When there is no necessity for urgent energy replenishment, limiting the charging power may contribute to extending the service life of an energy store based on LFP cells [
40].
If the solution using tugs with energy storage became popular in the future, the issue of the proper scheduling of charging time for port tugs would become important from an economic point of view.
It is possible to equip the tug with removable energy storage, which would minimize the downtime required for charging. Unfortunately, this would entail higher costs of equipping the tug with removable storage, the expense of redundant stores required for replacement and the need to modify the traditional tugboat deck layout. Most of the tugs have a raised superstructure in the middle of the deck, which is an ideal place for the captain to observe the entire space around his tug. In addition, the remainder of the deck is occupied by winches used to connect the tug to the assisted vessel with heavy-duty towing lines.
4. Tugboat Hull Shape
The impact of the hull shape on energy consumption was analyzed using the Maxsurf software package with the Hullspeed component [
41]. The Maxsurf program allows designing the hull shape from scratch, based on the existing design documentation, using the basic elements built into the program, or by editing example files containing complete hulls.
The Hullspeed component allows the analysis of hull designs saved by Maxsurf, using statistical methods such as the Holtrop, Compton or Van Oortmerssen methods and using analytical methods such as the “Slender Body” method.
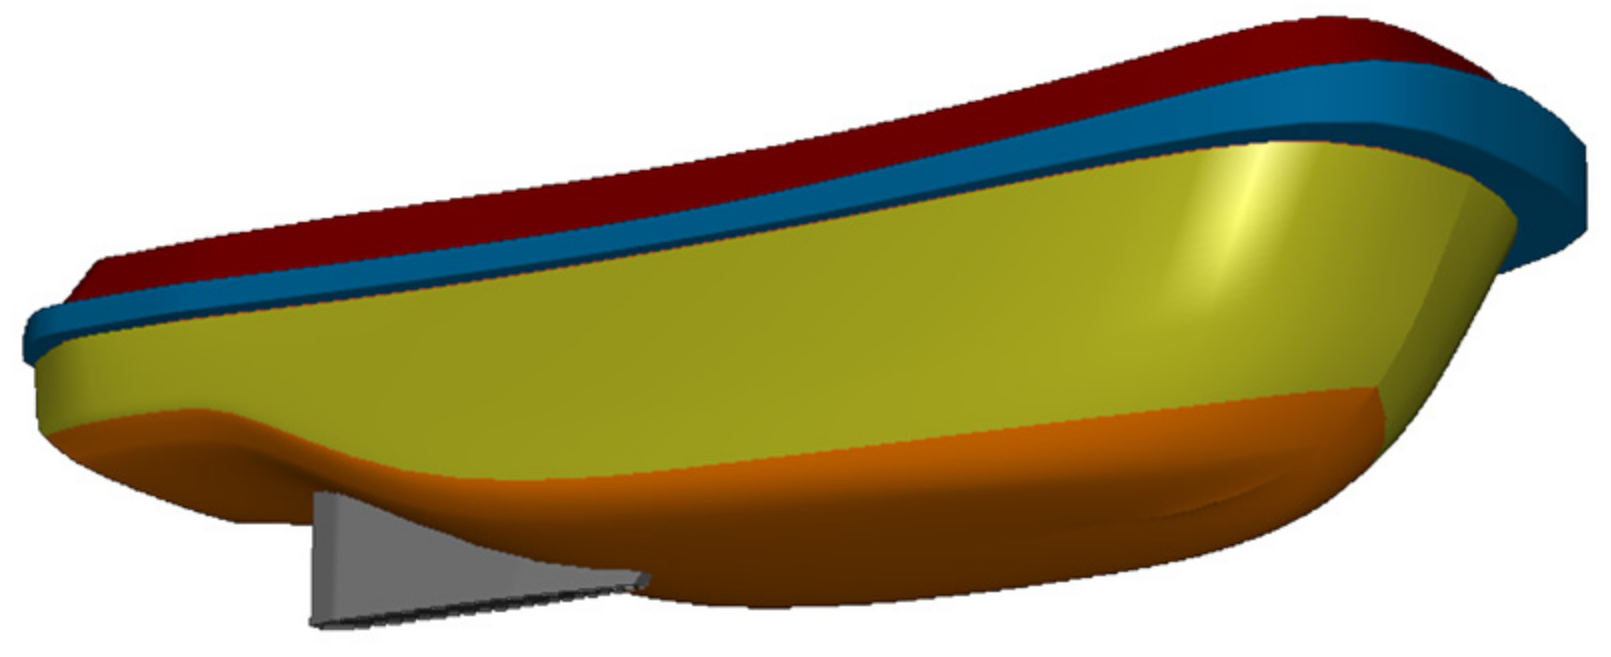
The database of Maxsurf hulls includes two tugboat hulls, which will be the basis for research on the impact of the hull shape on energy consumption. The first hull has the shape of a tug with classic propulsion and single screw, the second is the equivalent of the currently popular ASD class tugs.
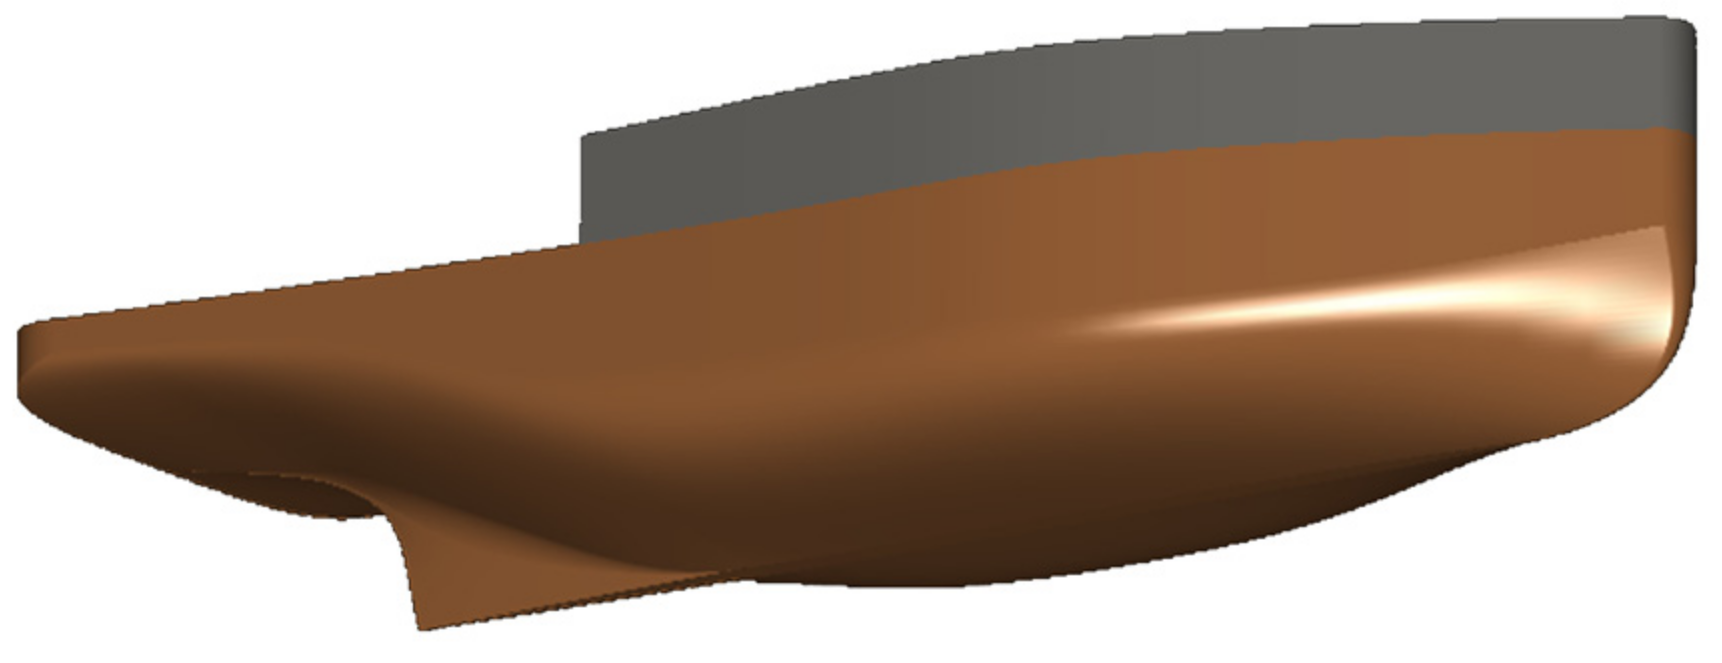
As the tugs with propellers located at the stern and bow have a slightly different shape of the hull—there is no clear undercut for the propellers in the aft part—a new hull model was made on the basis of the front part of the classic tug model, symmetrical in form with respect to the plane crossing the ship’s hull in the middle. This model corresponds to a tug with azimuth thrusters suspended under the fuselage. An example of a real tug of this type is the Rotor Tug ART 80–32 (
Figure 1, right).
The first three values presented in
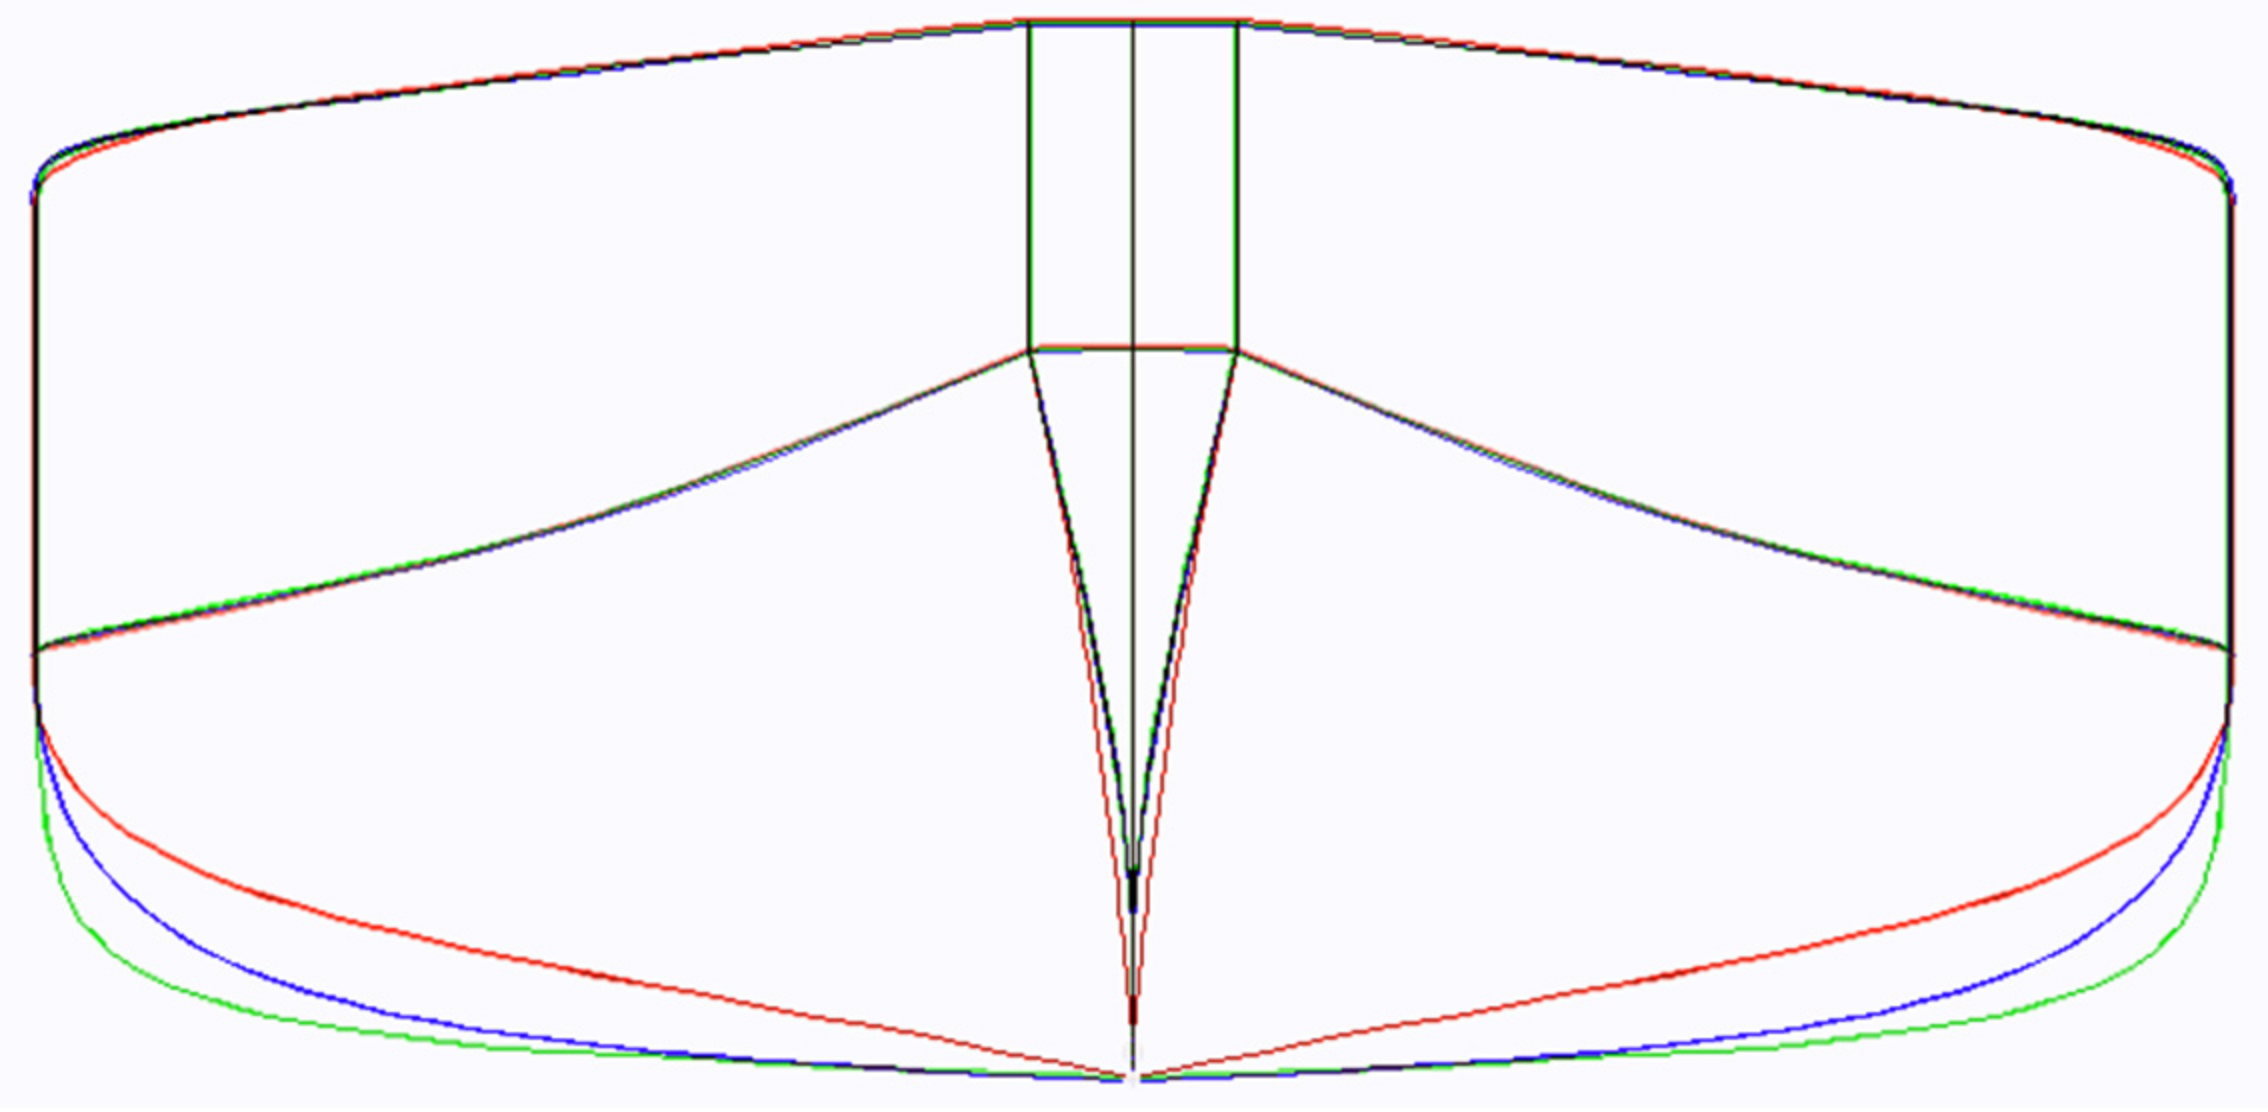
Table 3, i.e., the geometrical dimensions of the hull and the displaced water volume, were adopted as the basis for the hull comparison. It was assumed that each of the compared hulls will have the same length and width, and that it will displace a constant volume of water. This will allow the comparison of energy consumption by hulls of various shapes, while maintaining the same dimensions and load capacity.
For the analyzed hull structures of the tugs shown in
Figure 10,
Figure 11 and
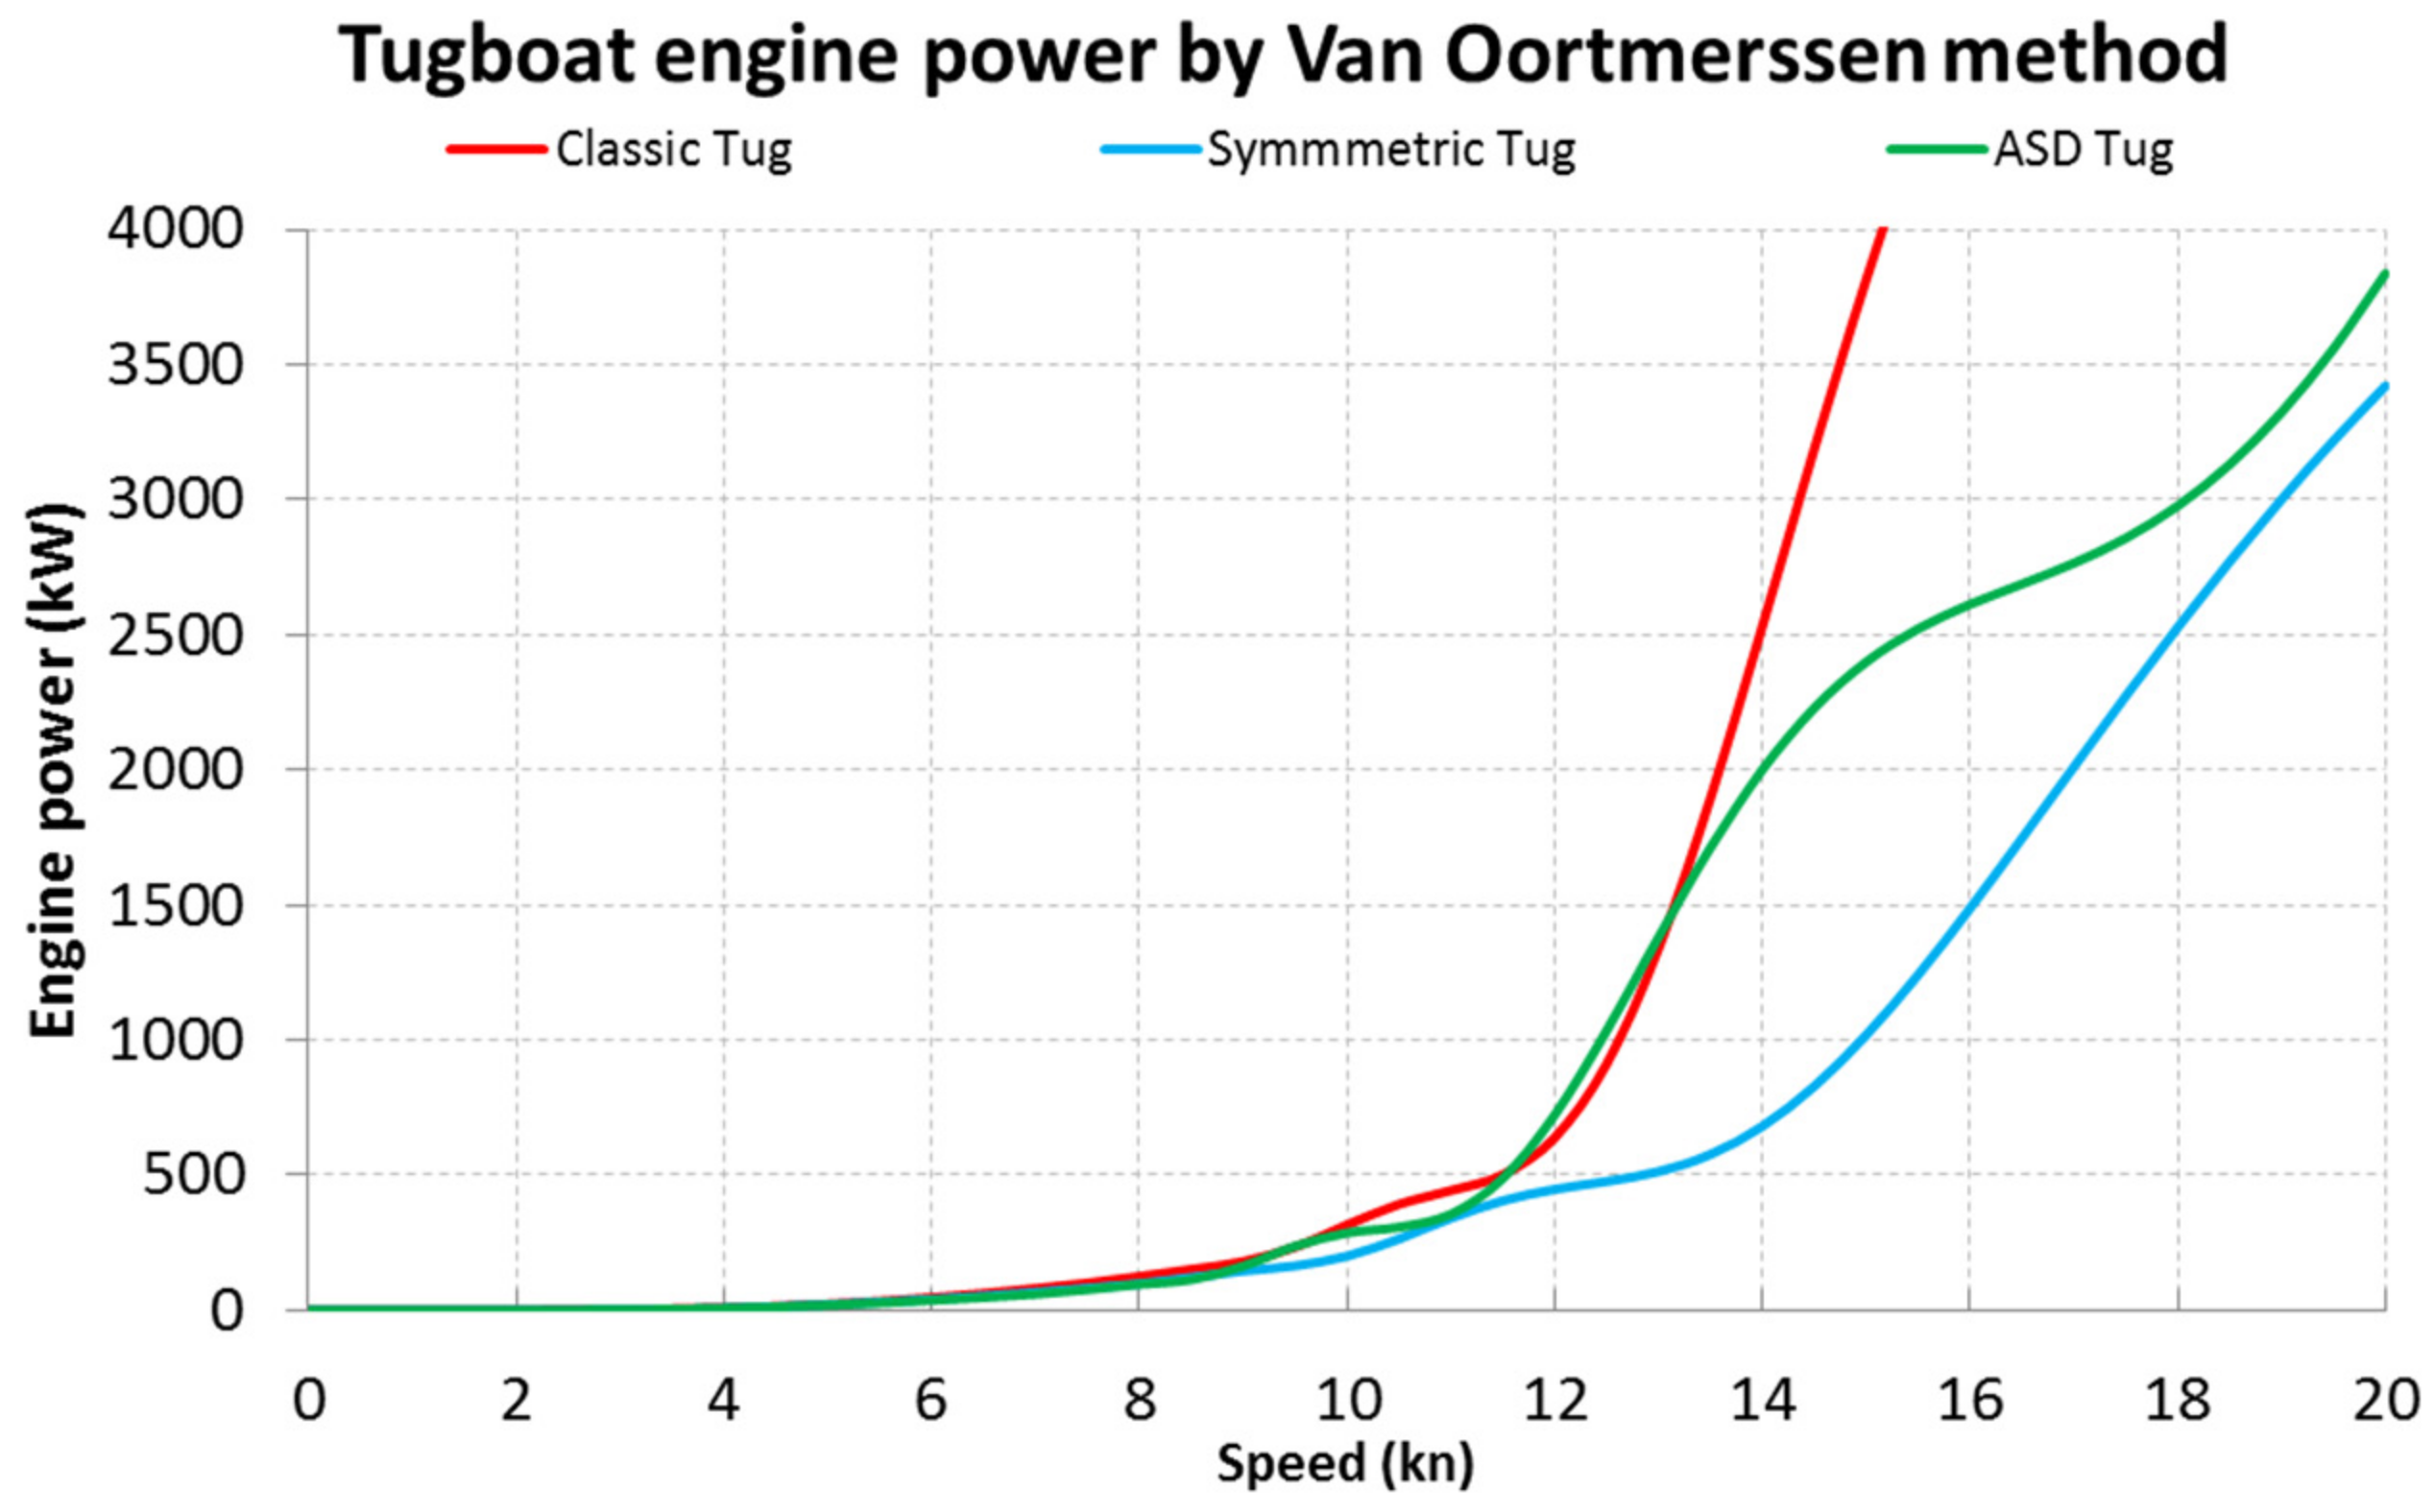
Figure 12, preliminary calculations were carried out on the basis of which the engine power necessary to achieve a specific operating speed was estimated as shown in
Figure 13.
The analysis of the waveforms shown in
Figure 13 shows no noticeable difference in the power required to reach a speed of about 9 knots for all three hull shapes. Then there are some differences in the range from 9 to 11.5 knots, followed by significant differences for speeds above 12 knots.
The symmetrical shape of the tug hull shown in
Figure 12 turns out to require much less propulsion power in the speed range of 9 to 15 knots compared to other hull designs, which which resulted in this shape being chosen for the process of further optimization.
5. Hull Shape Optimization
To optimize the shape of the tugboat hull, the Particle Swarm Optimization (PSO) method was used, already employed for this purpose by [
42,
43]. For optimization purposes, the constraints are introduced, granting invariability of the geometric parameters presented in
Table 3, i.e., length, width and volume of displaced water.
The value of the objective function subject to minimization depends on the value of the power necessary to travel at a given speed, resulting from the hull shape. The obtained speed characteristics of the tugs, shown before in
Figure 5, were used as reference values for the speed profiles.
The total energy index,
Et, was determined for a given combination of the hull and the speed profile of the actual tug. This value can be determined as the sum of the products of all values of resistance power
P at a given speed
v, and the time
t for which the tug was moving at the speed
v:
where:
Et—indicator of the total energy used to overcome the hydrodynamic resistance,
P—power of hydrodynamic resistance at a given speed,
v—speed,
t—time spent travelling at speed v,
n—number of speed samples.
The calculations used the available speed data reported by AIS with a resolution of 0.1 knots, grouped into intervals 0.5 knots wide, identical to the speed intervals used in
Figure 2,
Figure 3 and
Figure 4.
By determining
Et for the six velocity profiles, it is possible to calculate
Eta, the average value of the total energy index:
The value of the
Eta index with the given changes to the hull geometry, symbolized by the vector
is the objective function in the process of optimization (value minimization) using the PSO method:
The change of the three components of the
vector value causes a change in the hull geometry by affecting three dimensions: the ratio of the midsection length to the total length,
x1; the degree of curvature of the bow/stern, x
2; and the change of the flare angle of the bottom shell,
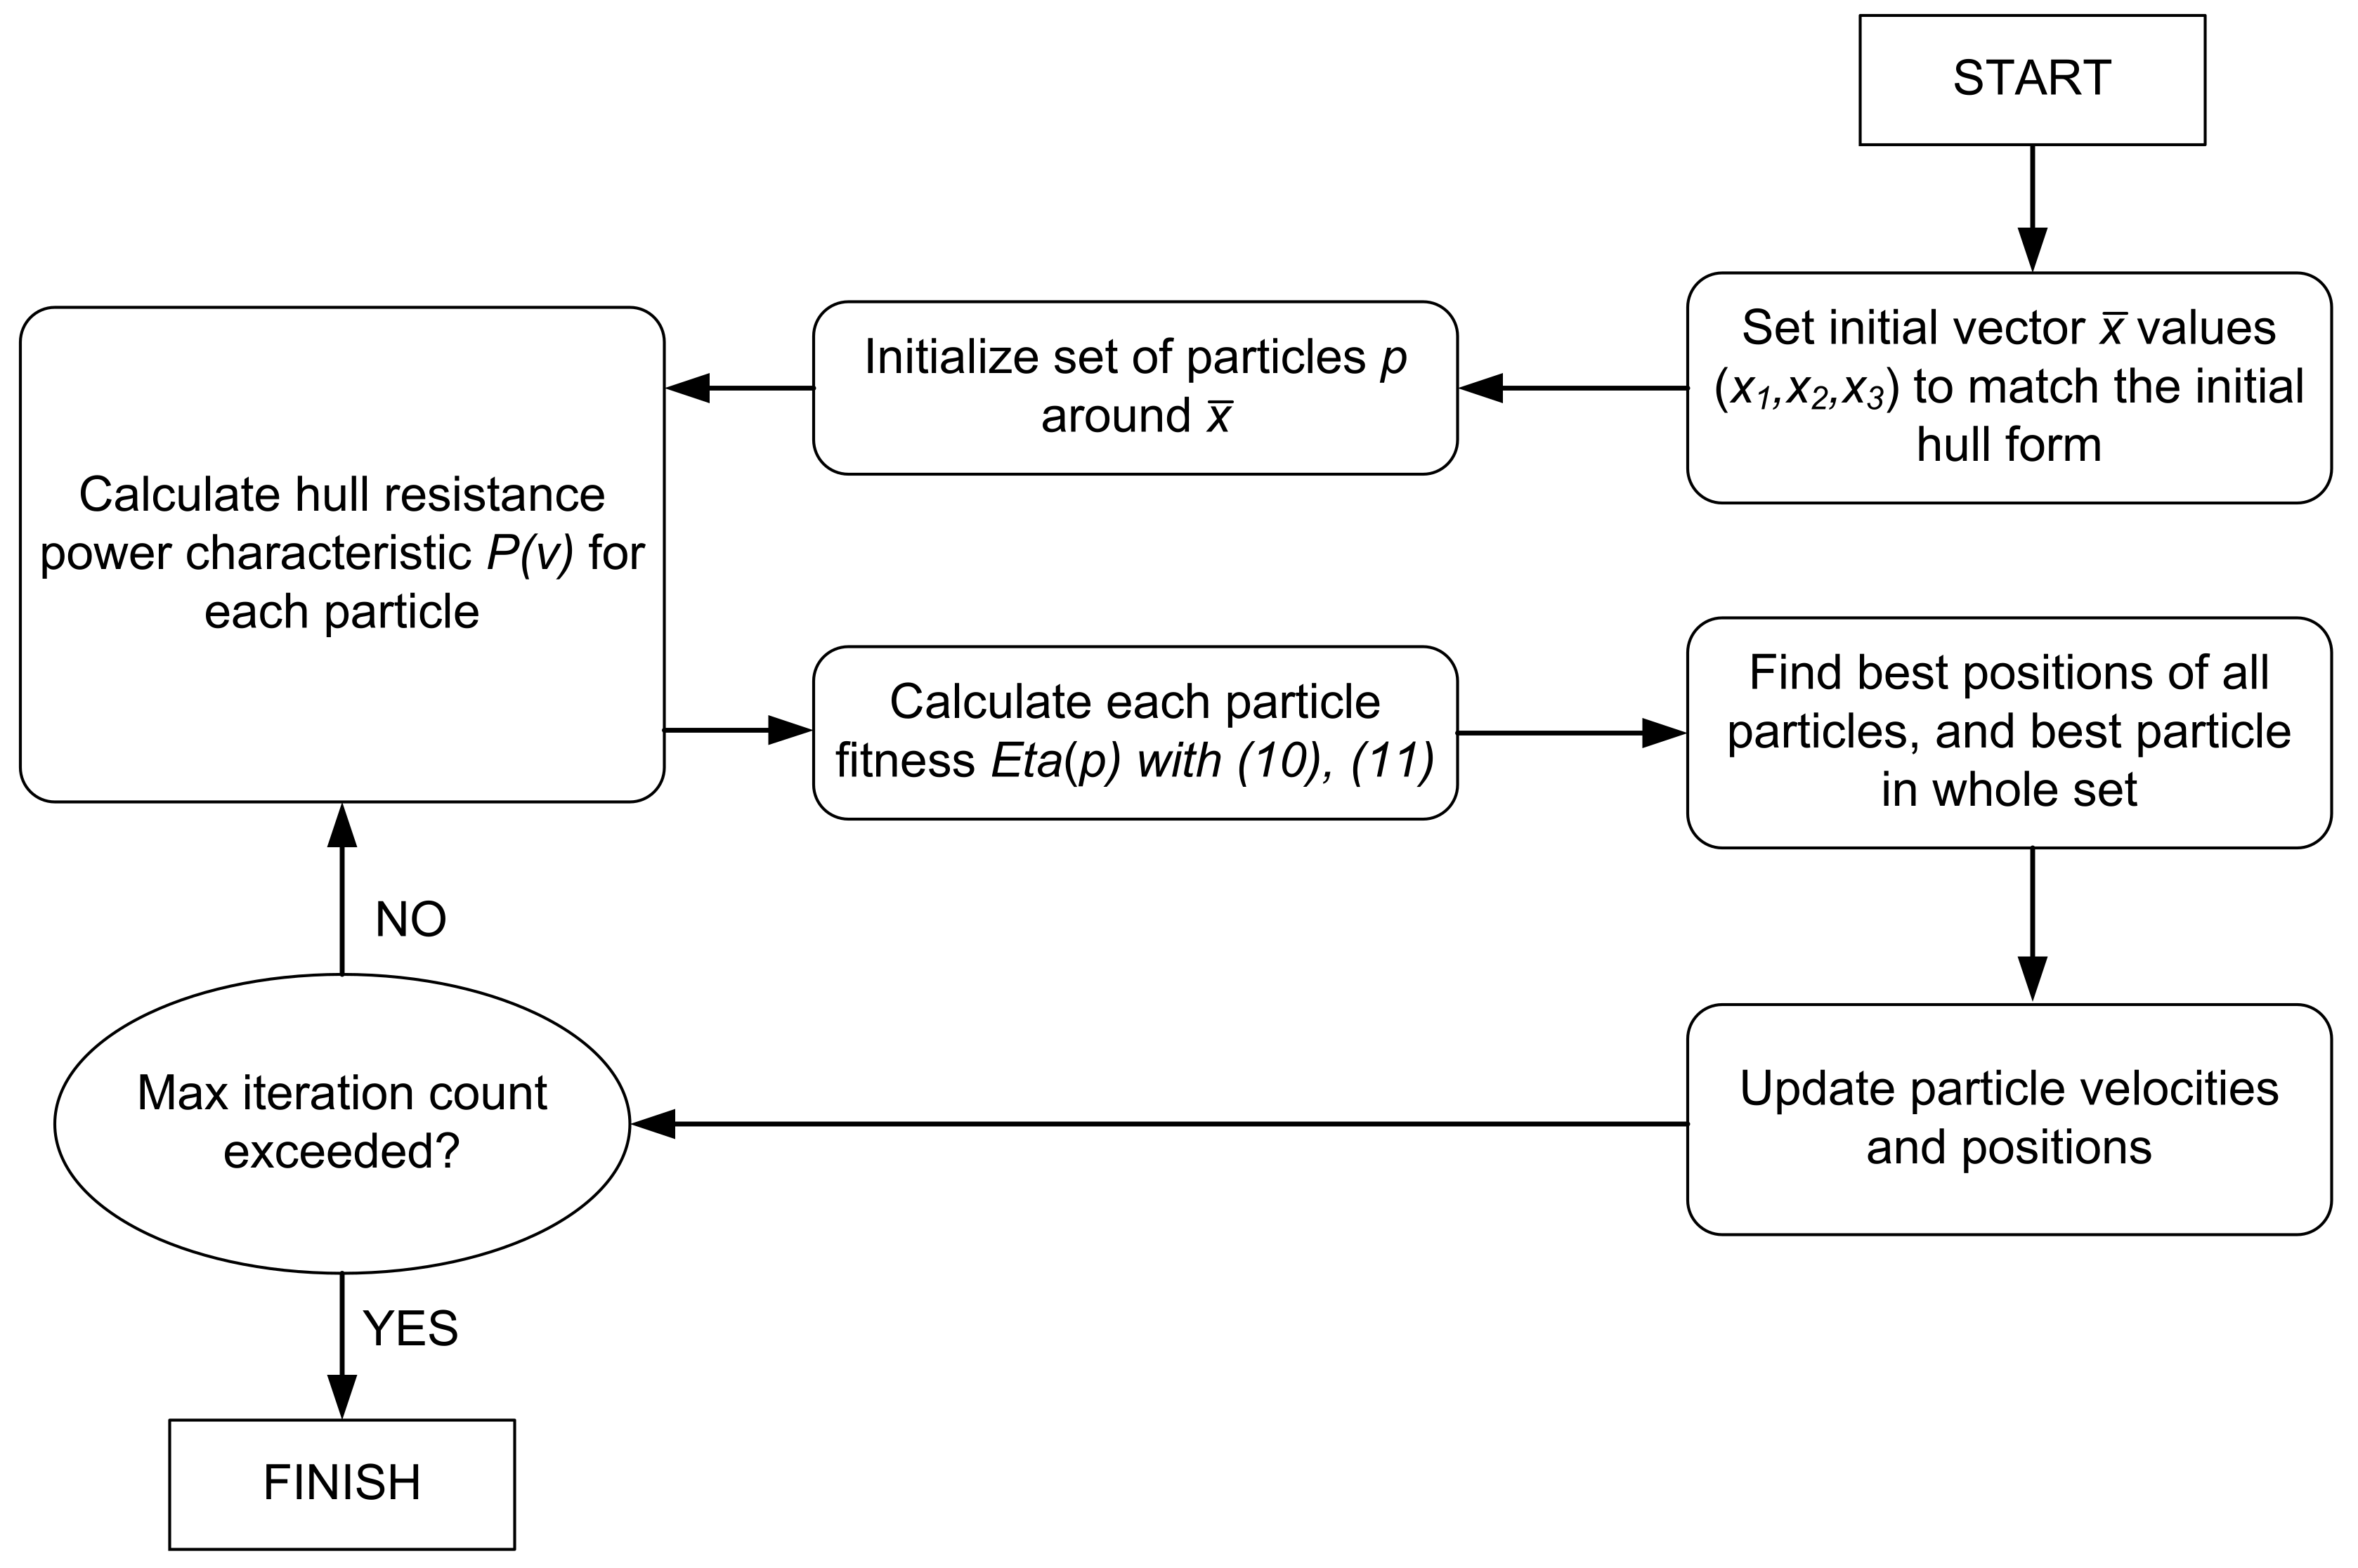
x3. The diagram of the optimization algorithm is shown in
Figure 14.
The starting point of the optimization algorithm is the shape of the fuselage as in
Figure 12, and the related components of the vector
. Then, in the vicinity of this vector values, the set of particles
p is initialized.
In subsequent iterations further steps of the algorithm are performed. The hull resistance P(v) is calculated with the help of the Maxsurf package. The calculated resistance characteristics allow using Equations (10) and (11) to calculate the Eta index for each particle, i.e., the value to be minimized according to Equation (12). The particles with the best values are then searched for, and the positions and velocities of the remaining molecules are updated. After the last iteration is completed, the results are read.
Table 4 presents five variants of the hull shape modification resulting from the optimization process.
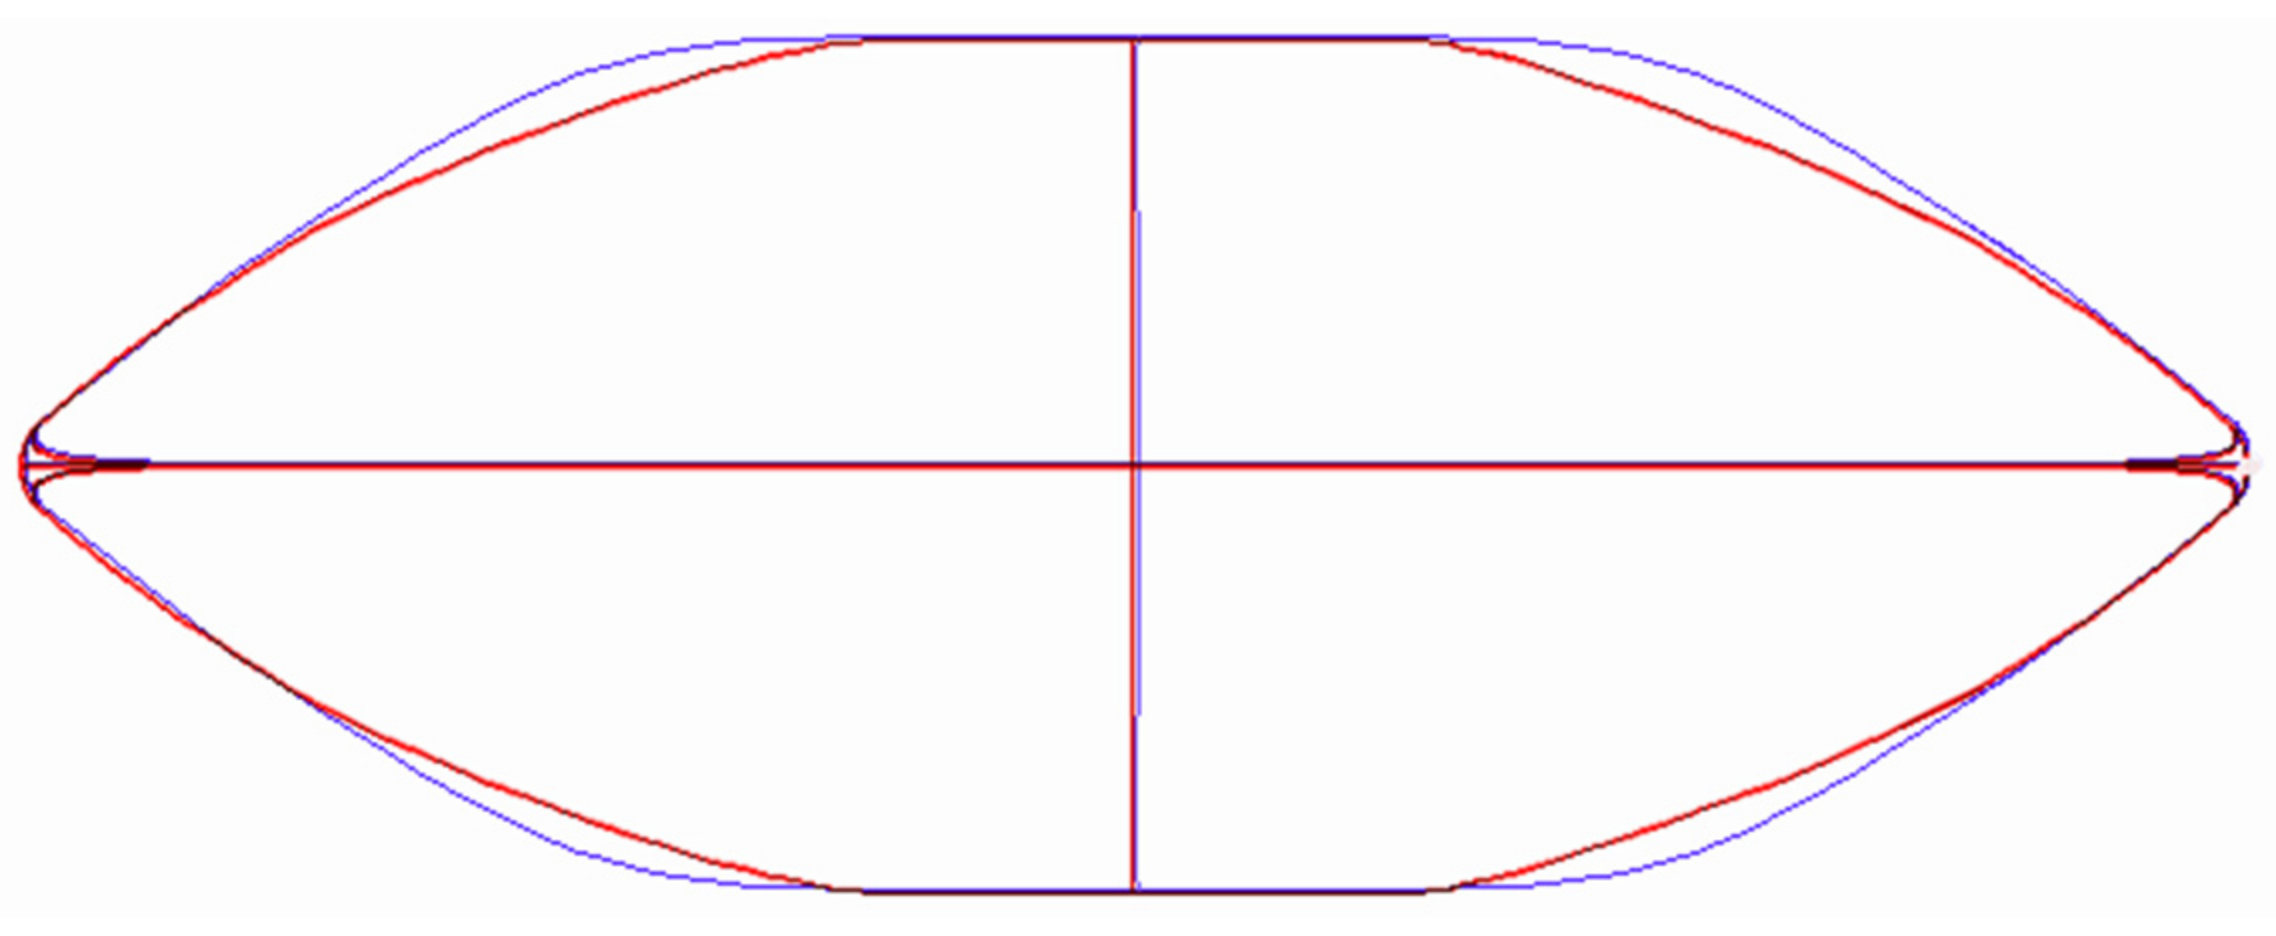
Figure 15 shows the change marked as “A” in
Table 3, consisting of the shortening of the central part of the hull (
x1) from the original length of 11.8 m to the length of 8.1 m, while maintaining the width of 12.5 m. Shortening the middle part of the hull makes the transition of the sides in the fore and aft parts smoother.
Figure 16 shows the alteration “B” controlled by the variable
x2, in which the bottom at the bow and stern are profiled in order to reduce the abruptness of the transition of the vertical bow to a flat bottom.
Figure 17 shows the effect of applying changes to “C” and “D” controlled by the variable
x3. The change in variant “C” causes the reduction of the angle of the bottom shell, sharpening its shape to look more like the letter V. The effect is to reduce the volume of the hull at the keel height, which entails increasing the draft while maintaining a constant amount of displaced water. Variation “D” is the opposite of “C” and increases the fullness of the hull which reduces the draft at constant displacement volume.
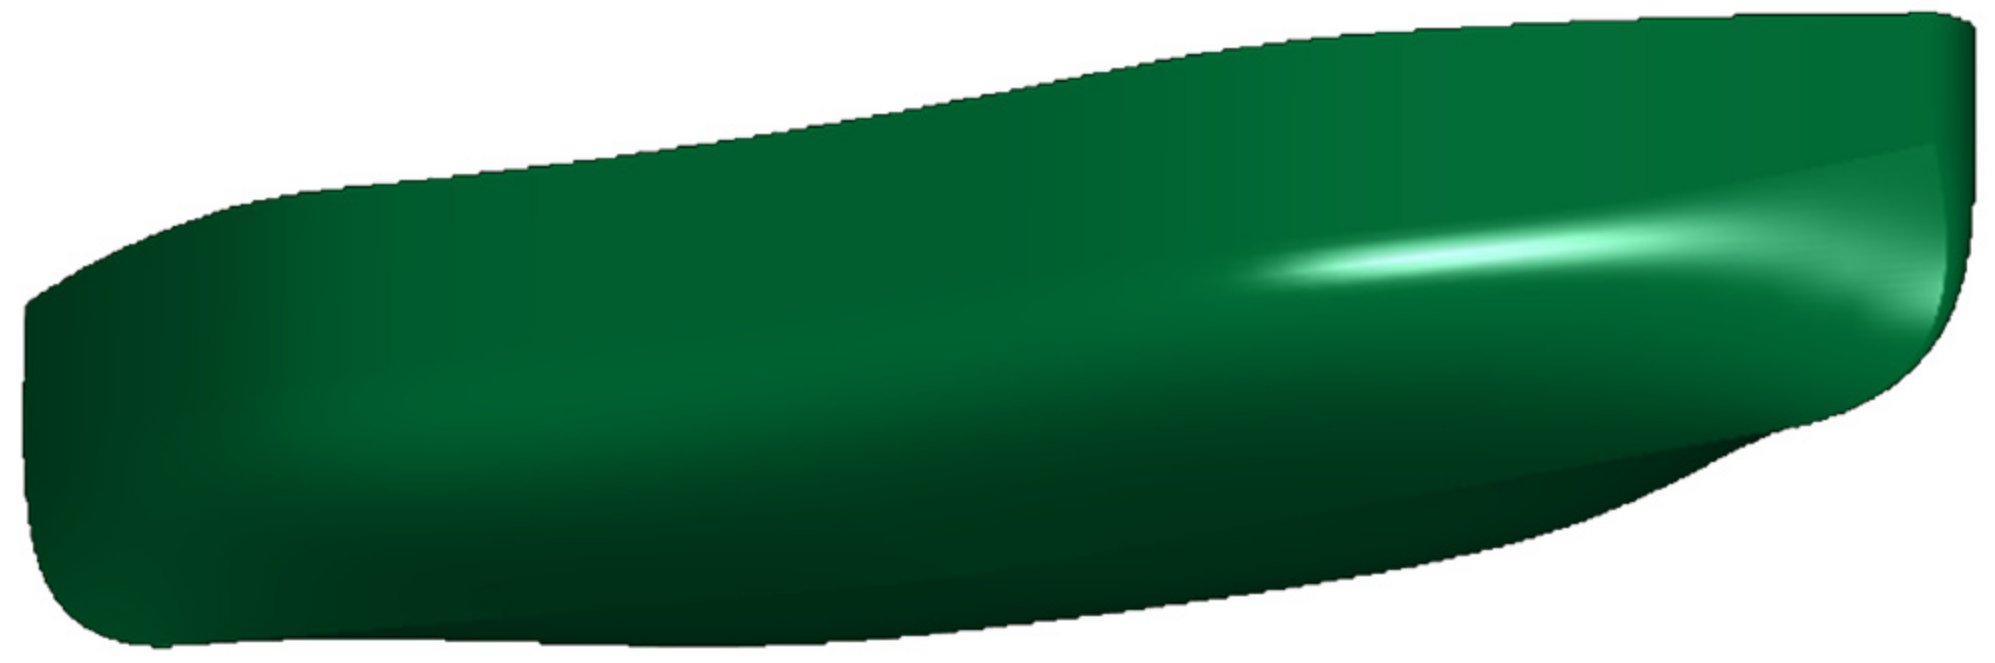
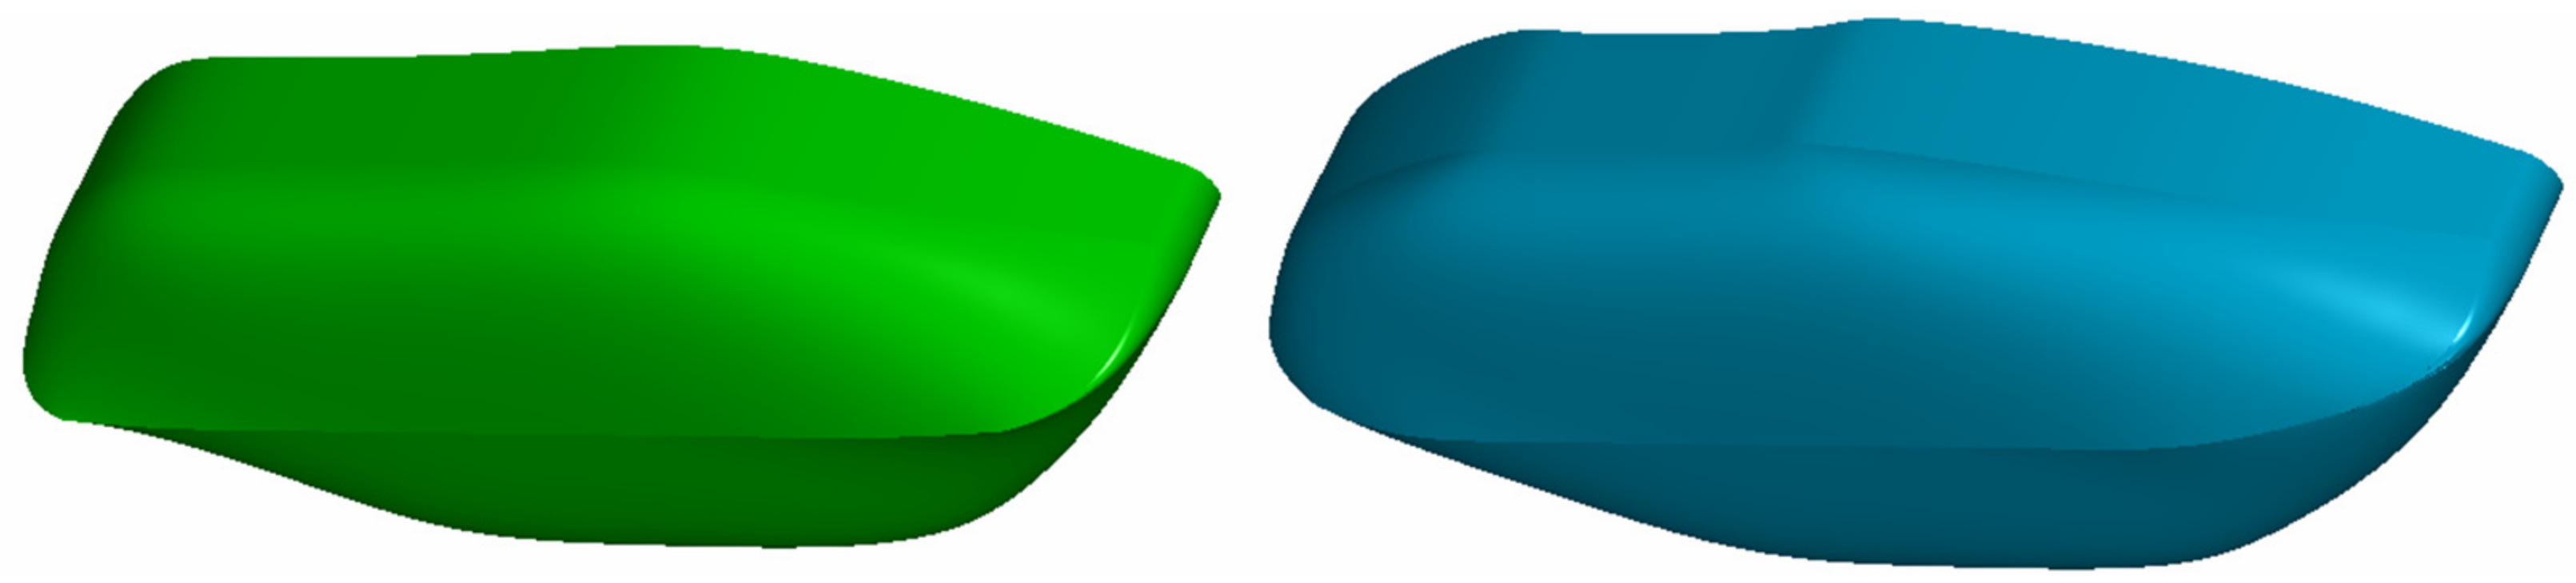
Figure 18 shows a comparison of 3D views of a symmetrical hull before the optimization process and after it has been carried out and the option that provides the best reduction of energy consumption for all tested shapes.
Figure 19,
Figure 20,
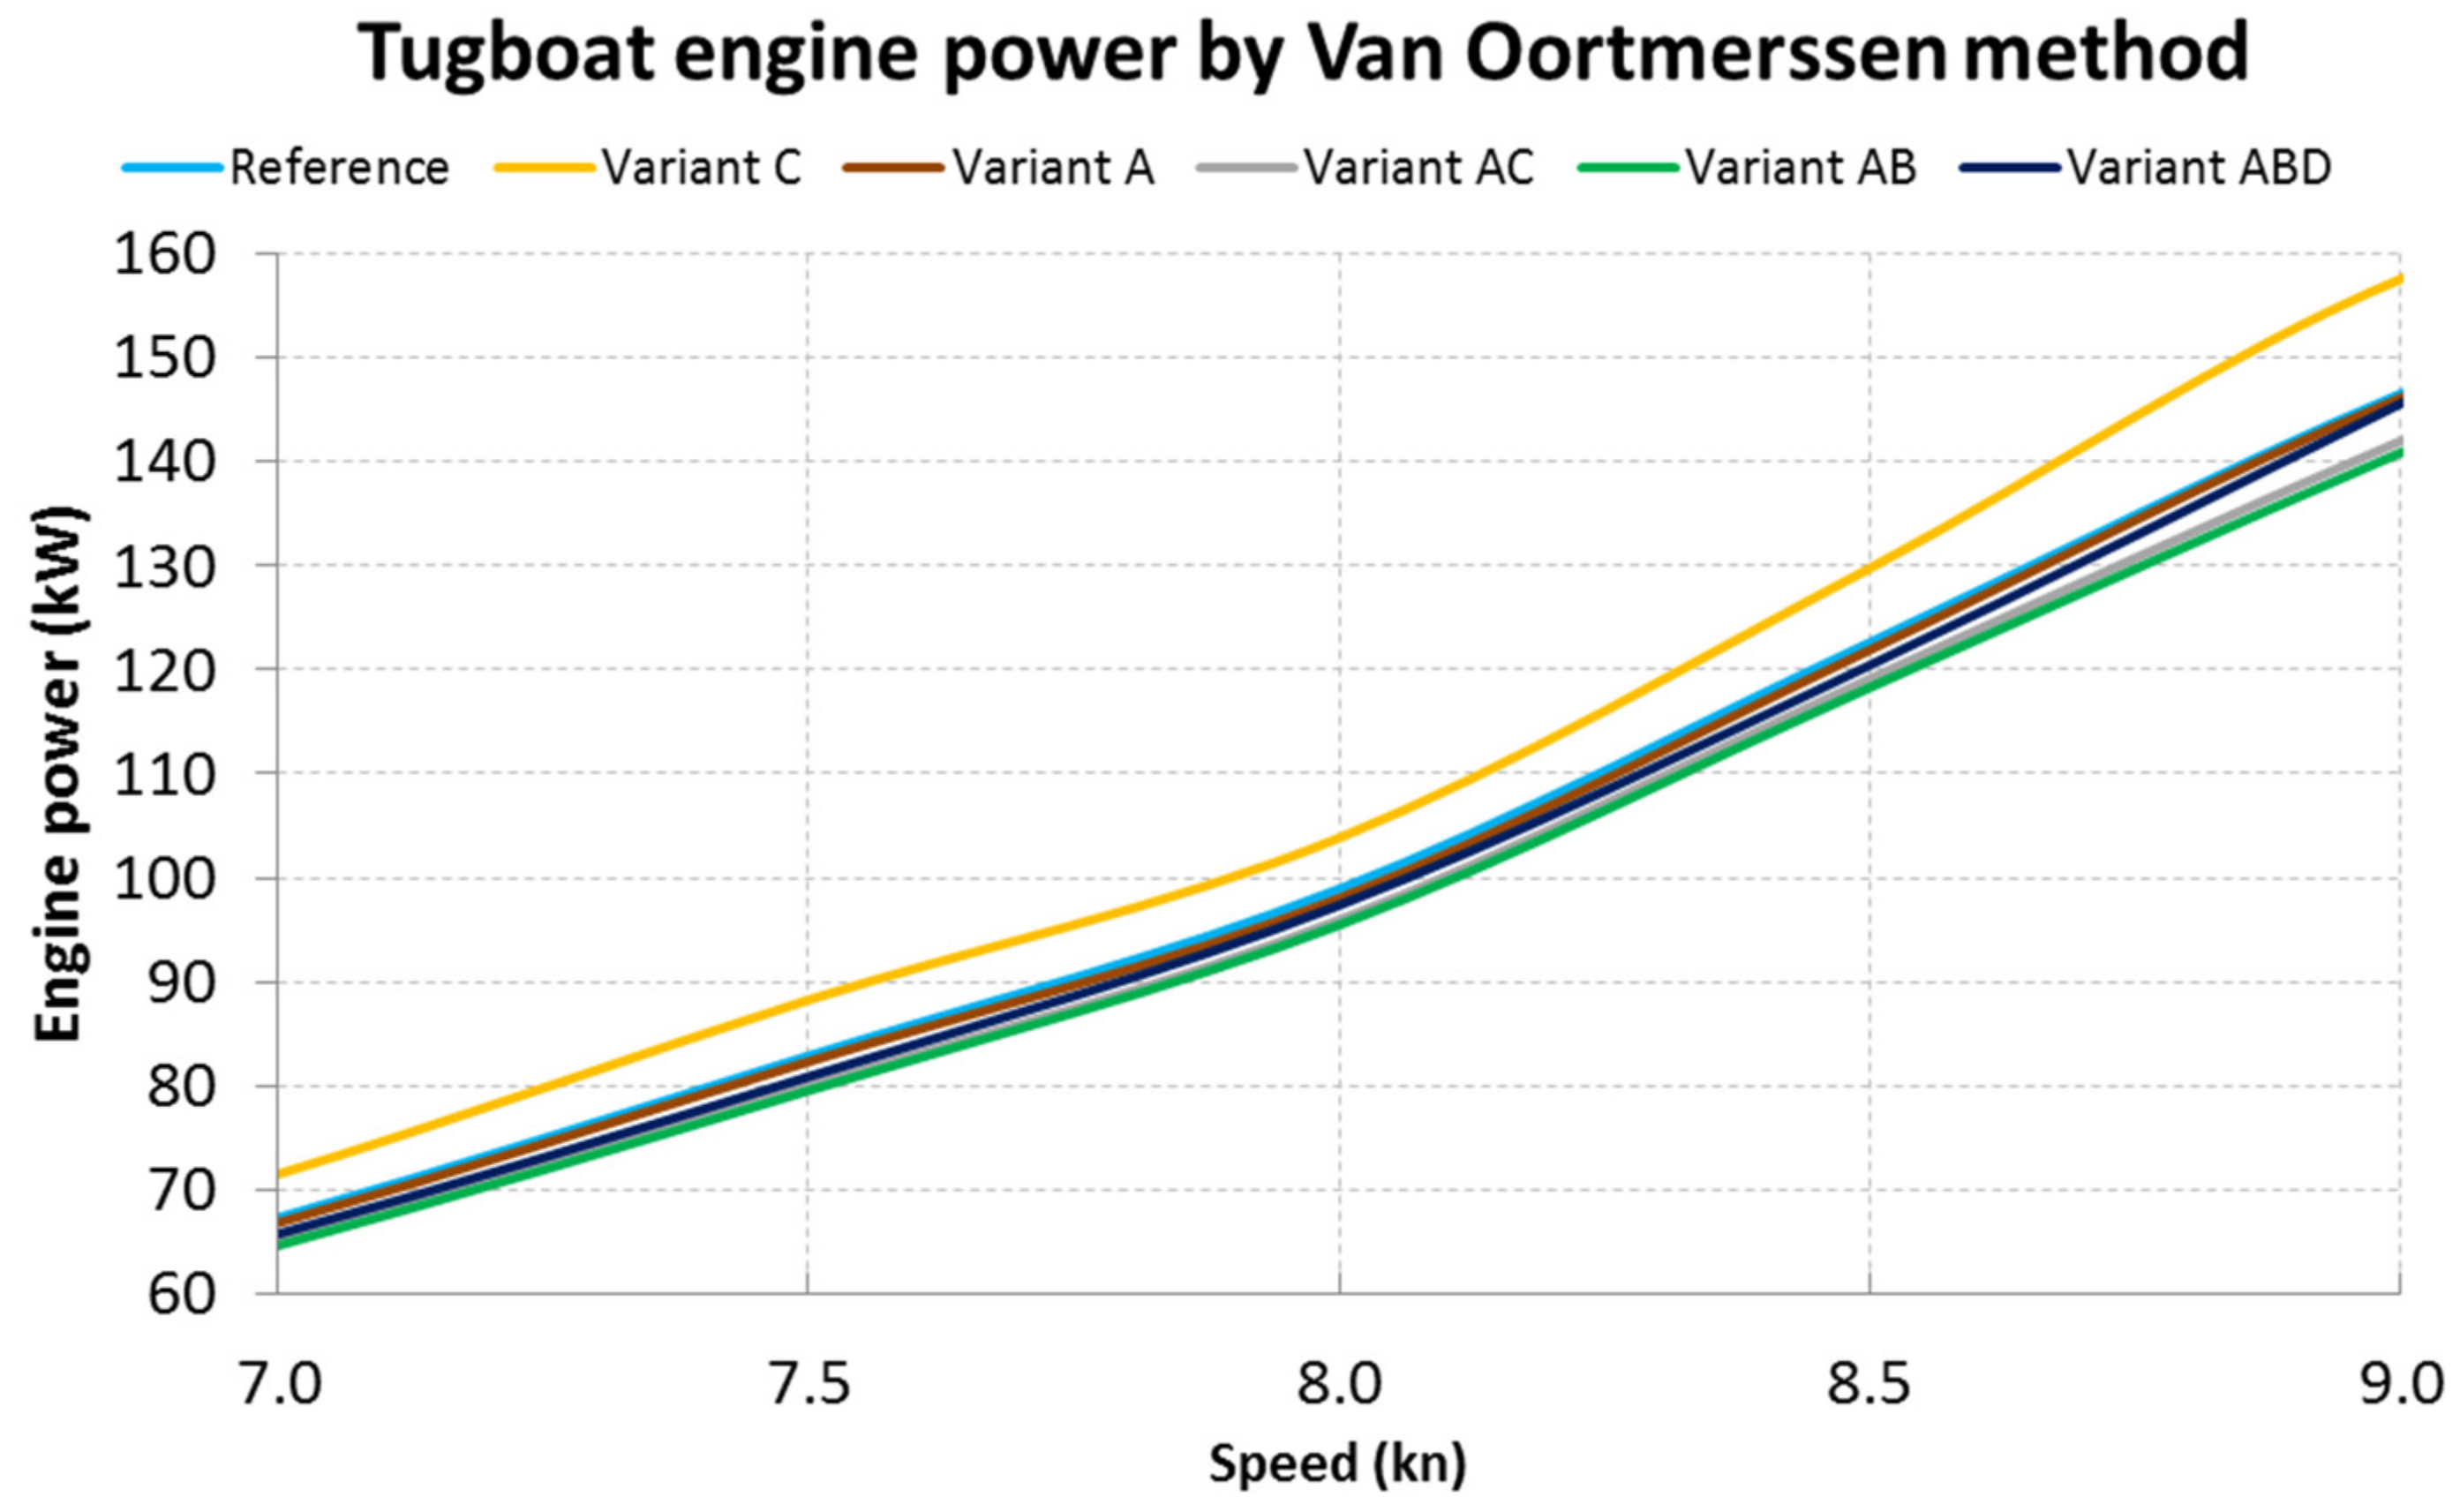
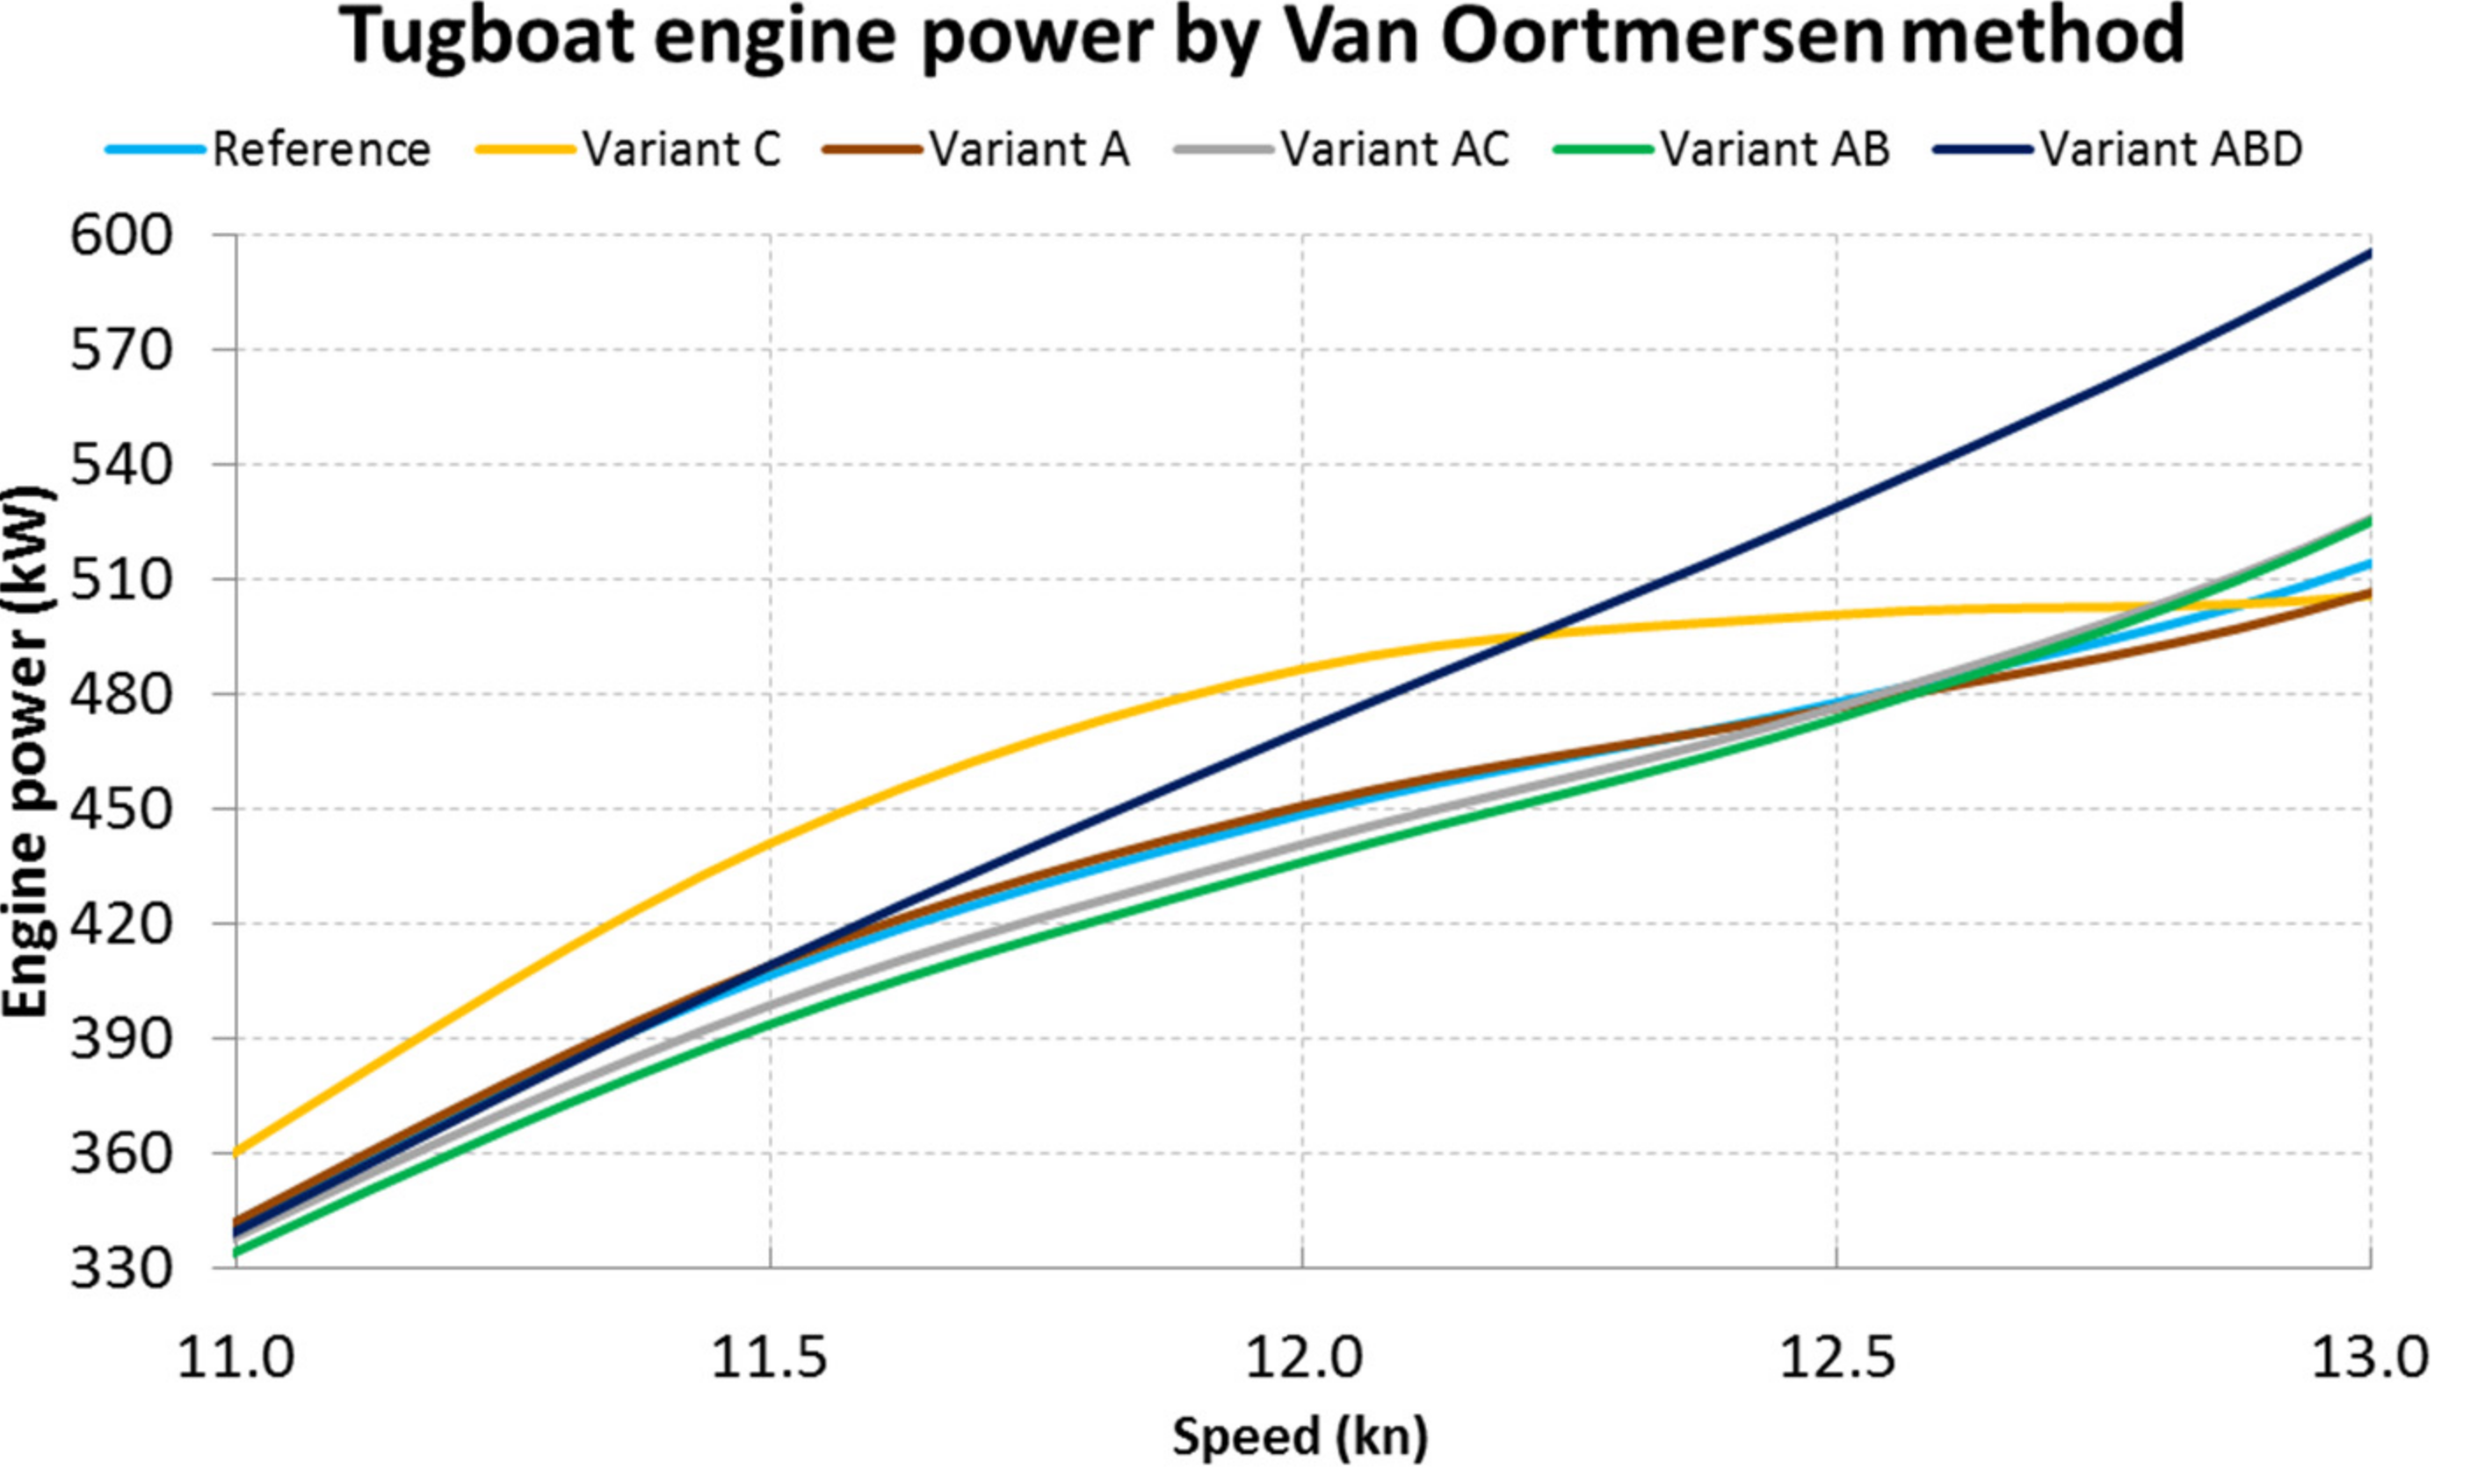
Figure 21 and
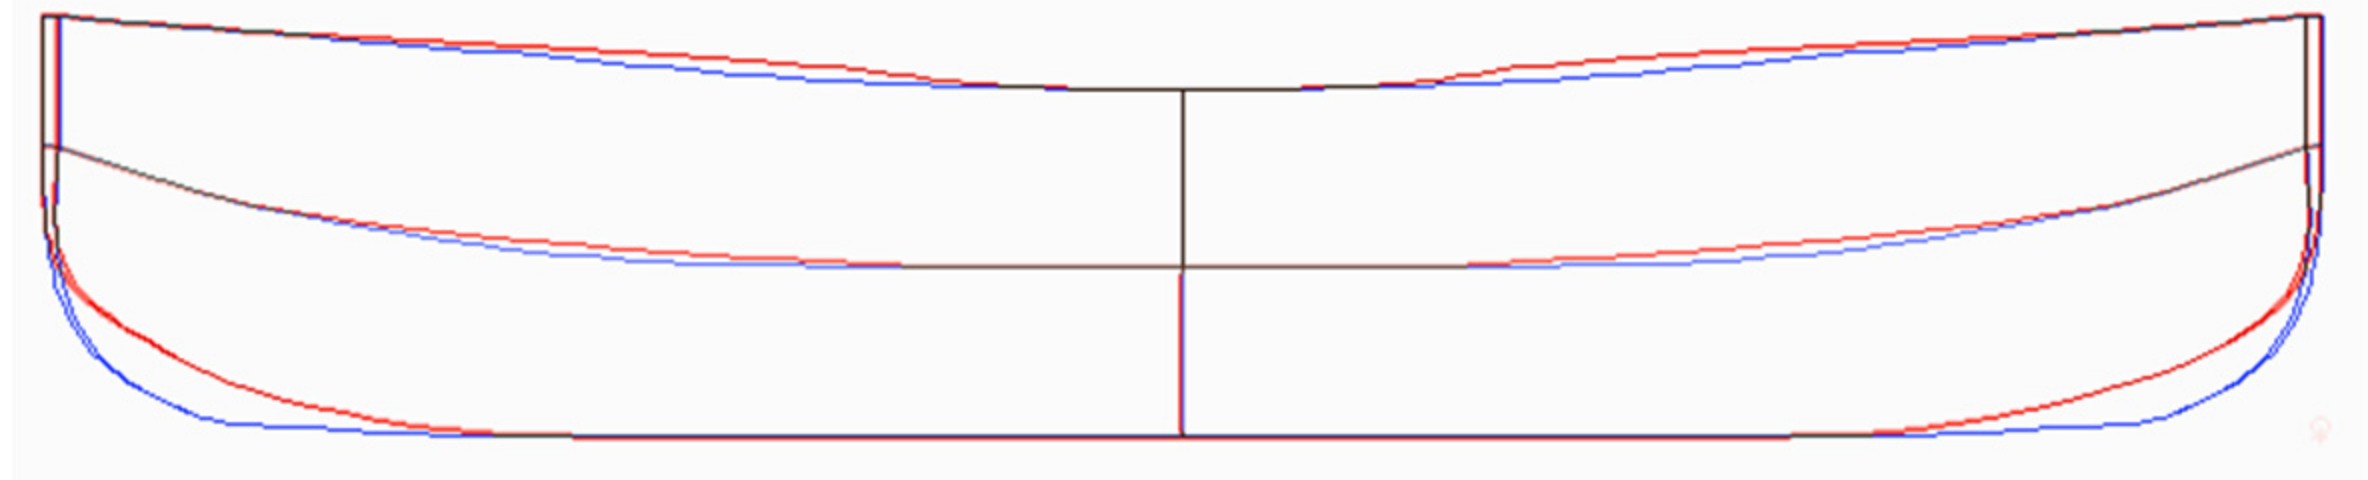
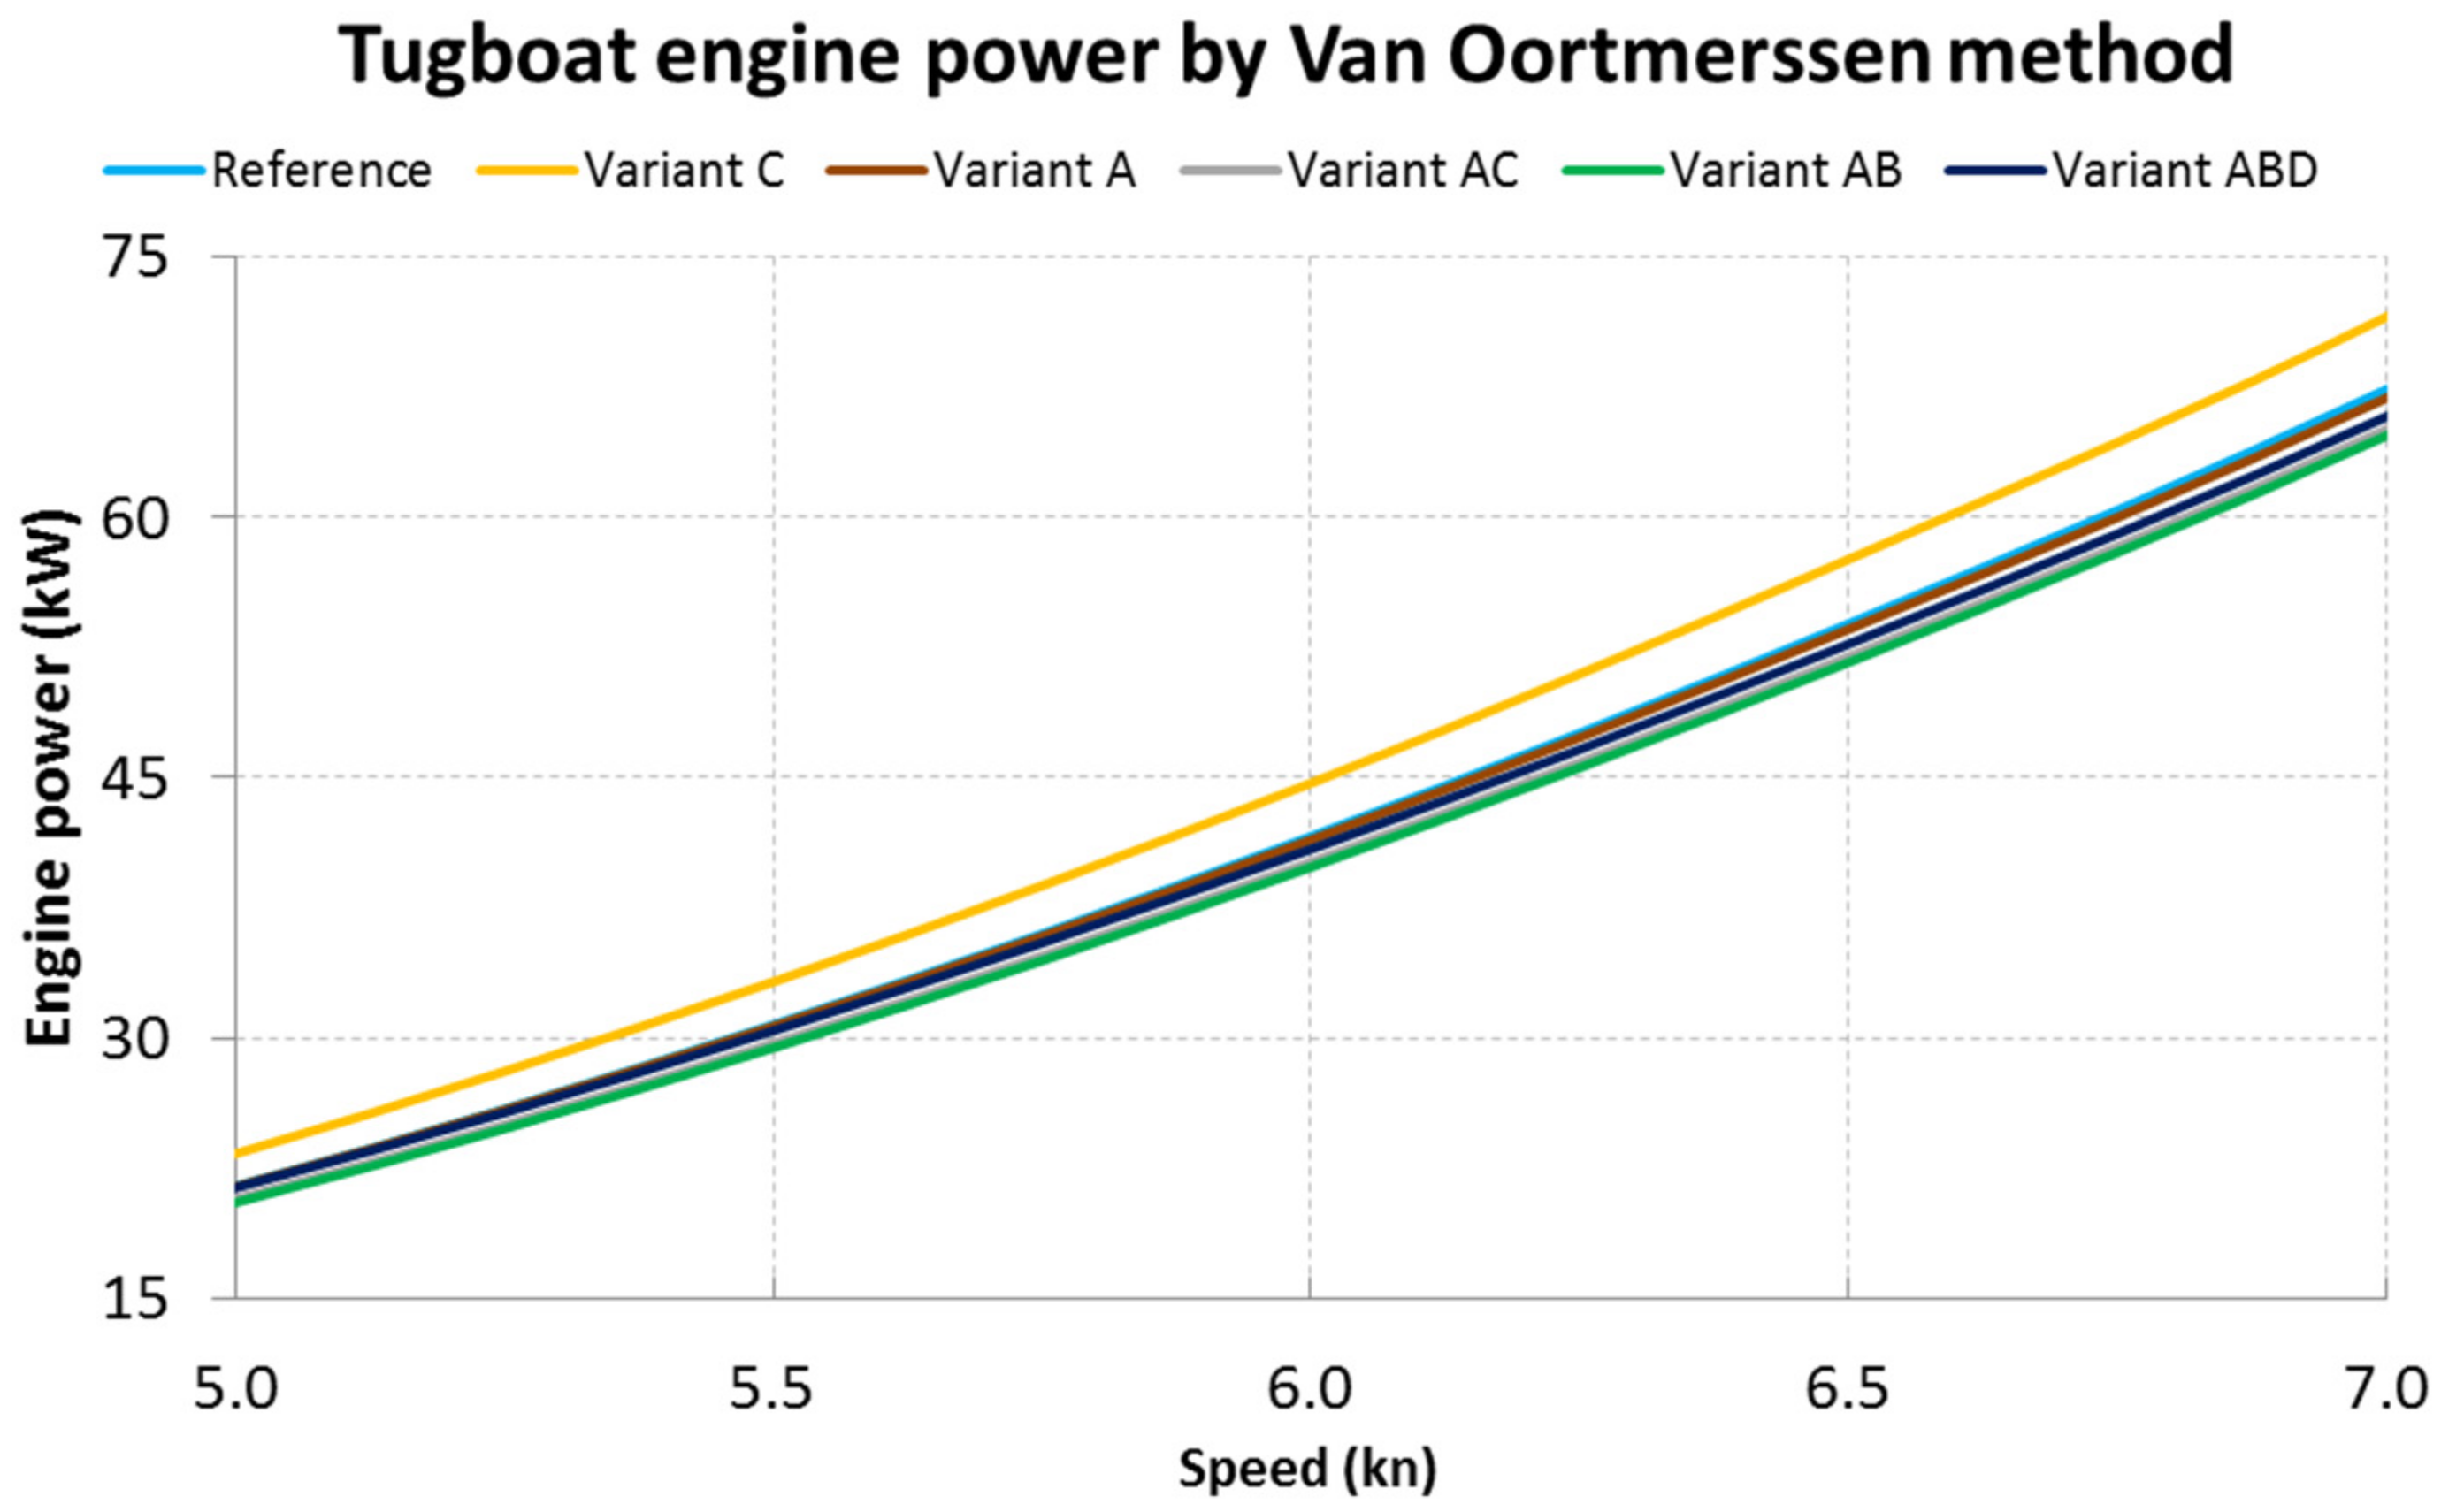
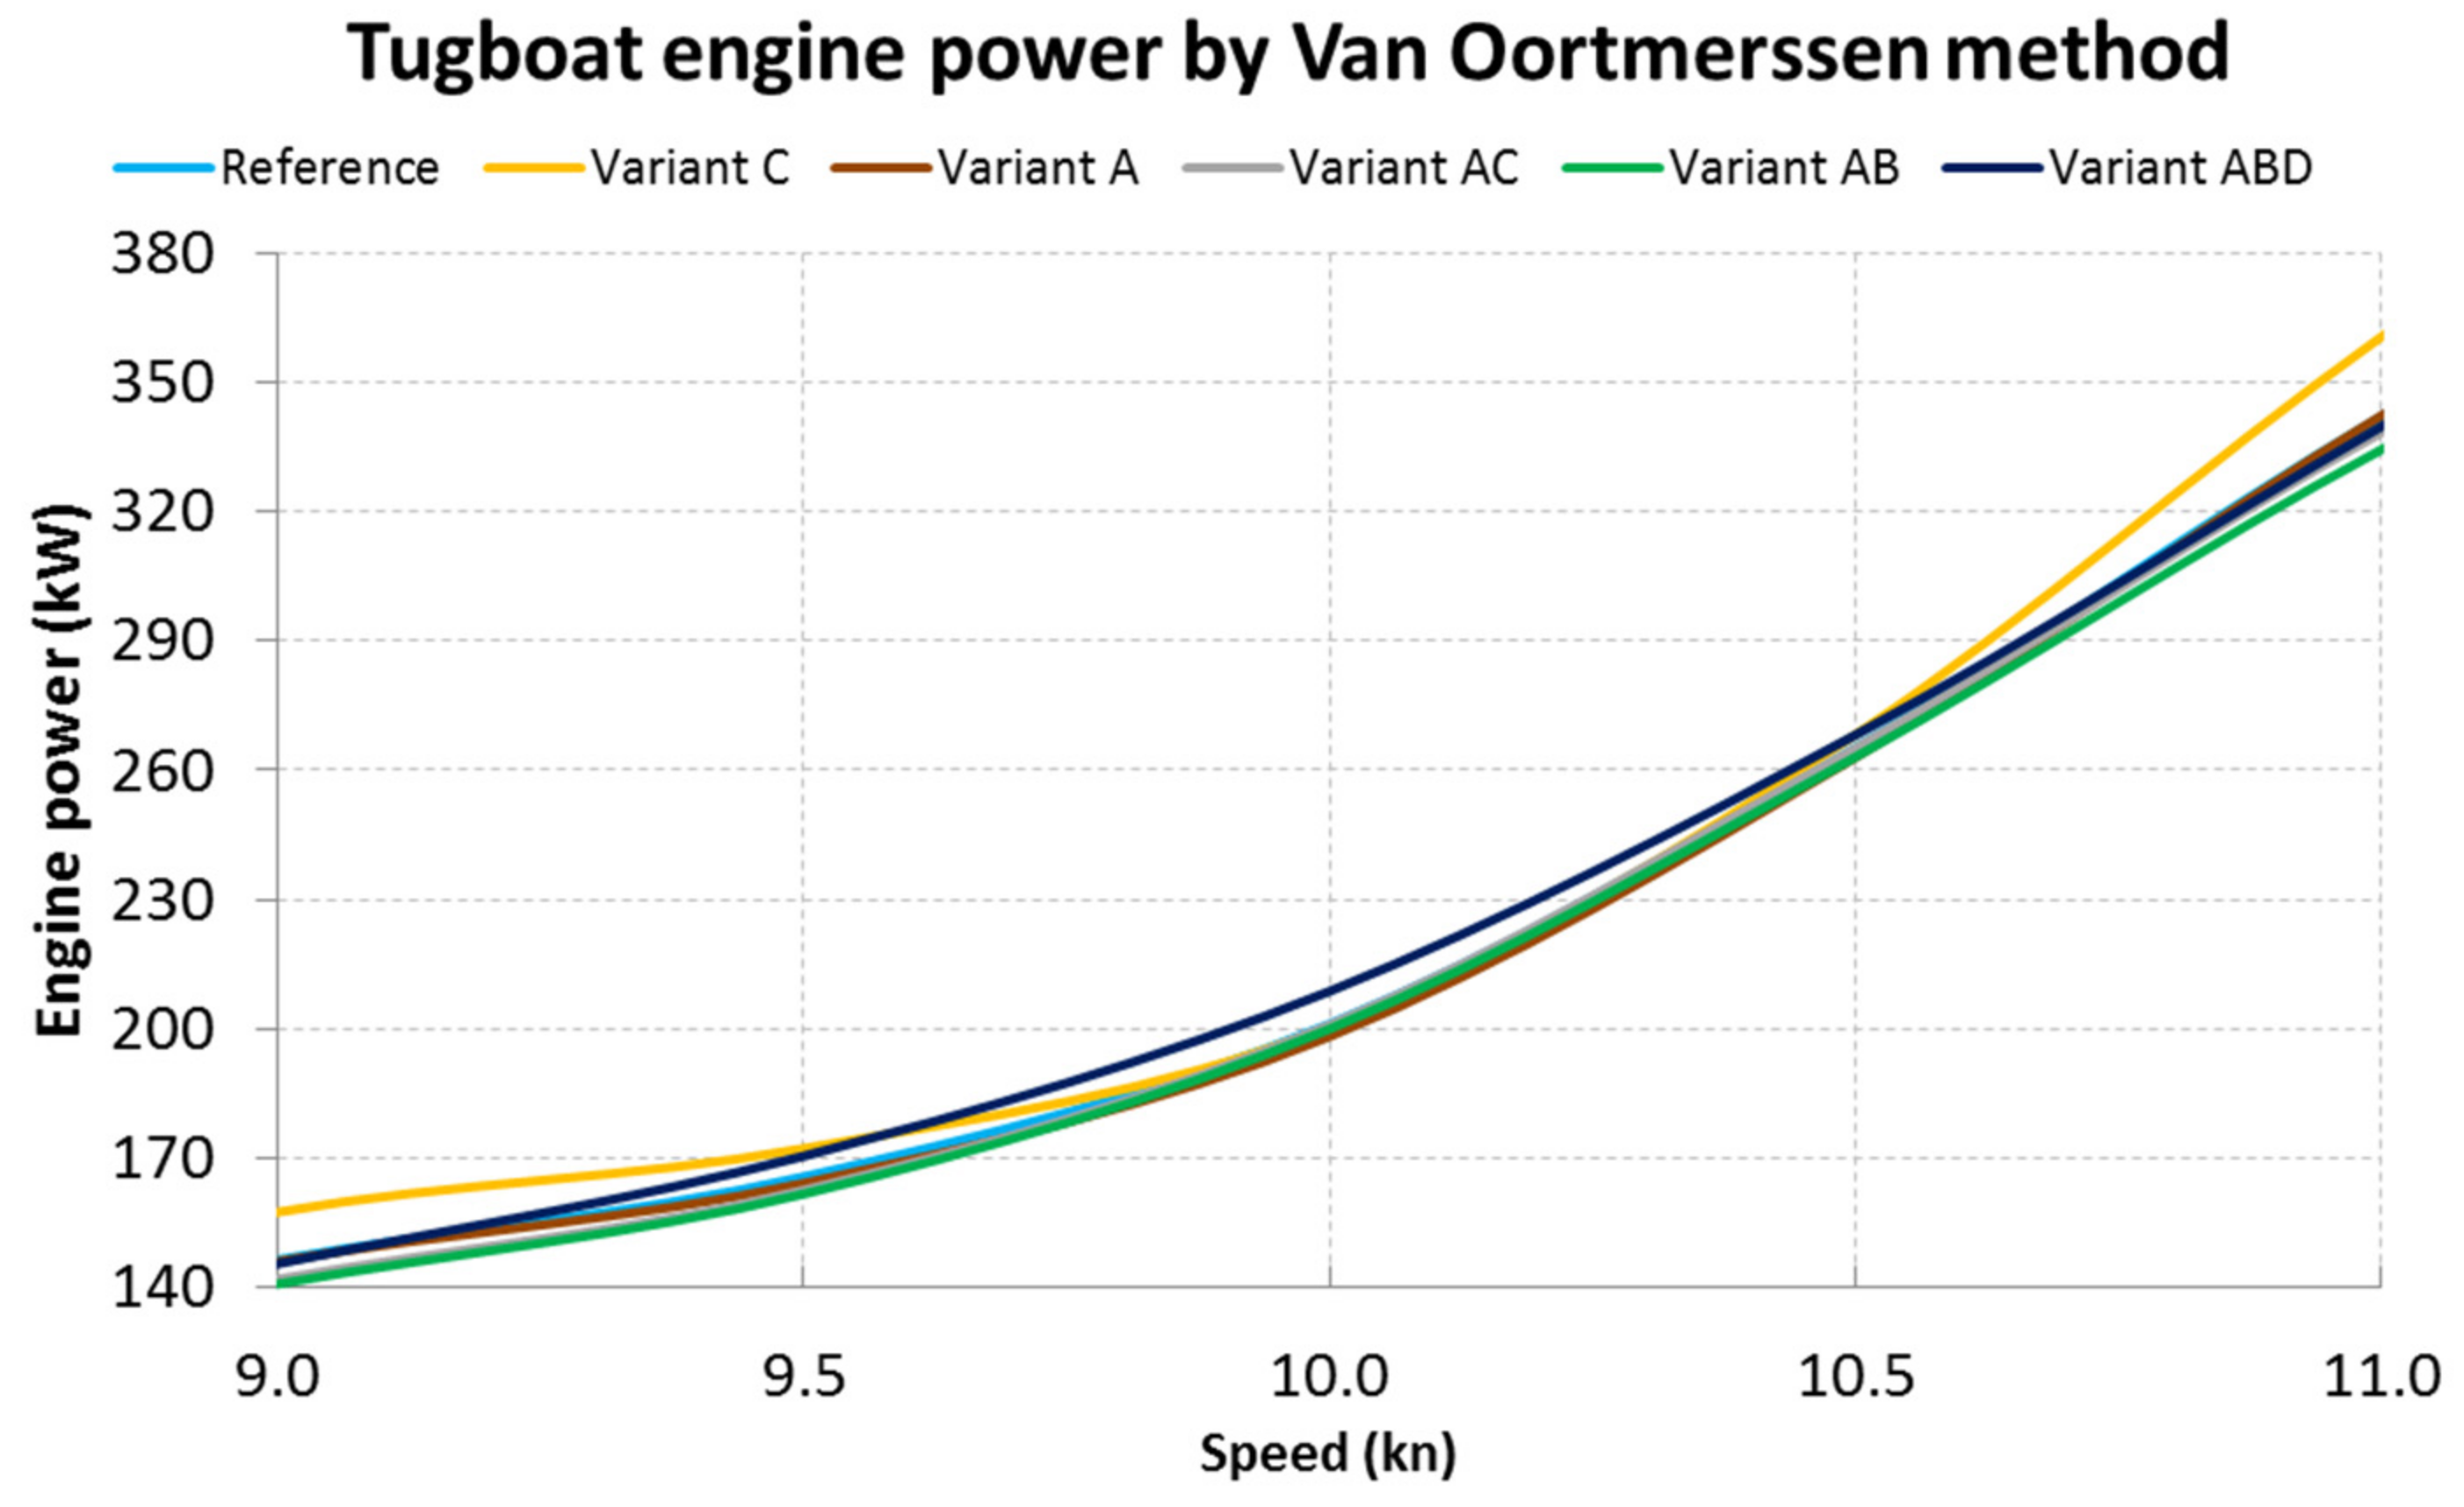
Figure 22 show detailed graphs of the engine power required to run at a given speed for each variant of the tested hulls from
Table 4. It can be seen that up to a speed of approximately 12 knots, Variant C is the shape requiring the highest engine power, compared to other hulls. This is due to increased draft caused by changing the bottom shape. The unfavorable increase in the drag power between Variant AB and ABD probably results from the reduction of curves at the point of transition of the hull sides to its bottom, which is shown in
Figure 16.
The percentage value of the total energy,
Et, indicators for the symmetrical hull at the start of optimization process was taken as the reference value
Etref for the other hull
Etn indicators, according to the following formula:
Table 5 presents the results of comparing the energy consumption indicators for individual hull variants and the actual speed profiles of the tugs.
It can be seen that for each of the tugs, the Variant C optimized hull shows an increase in energy consumption, which is disadvantageous. This is confirmed by the observation of the corresponding plots of the resistance power, shown in
Figure 19,
Figure 20,
Figure 21 and
Figure 22. The combination of variants A and C is also energetically unfavorable, except for the case when the tugboat does not develop high speeds.
The remaining cases—A, ABD and AB—offer correspondingly increasing energy benefits when the average of the data of all six actual tugs is tested. For a tugboat moving for long periods at a speed of more than 10 knots, such as the tested Kanto Maru and Shima Maru tugs, the best energy gain is obtained with the hull shaped as in variant A. For tugs with slightly lower operating speeds, variant AB offers the best reduction of energy consumption from 2.07% to 3.87%, compared to the non-optimized hull.
In addition, the analysis of the efficiency of drive systems shows the superiority of electric drive systems over combustion systems. This is especially noticeable in situations where the internal combustion engine is not fully loaded, which happens especially when port tugs are waiting for their tasks to begin. As an example of the above statements, the efficiency of the electric drive system is practically the same in the full load range and is the product of the efficiency of individual drive system components (energy storage efficiency 0.94, inverter efficiency 0.98, electric motor efficiency 0.92) and is over 80%. However, in the case of internal combustion diesel engines, the efficiency depends strongly on their load and reaches a maximum value of 0.45 at a load of 85%. However, in situations when the unit is not loaded, the efficiency of the drive system decreases to approximately 0.35 [
44].
6. Summary
This publication presents the results of research related to the optimization of the hull shape of an electric port tug. The proposed solution of an electric-powered port tug, by reducing emissions within the port, is in line with the environmental protection policy adopted during the COP24 climate summit.
Based on the statistical analysis of the speed profile data of typical port tugs, it was shown that the optimization of the shape of the tug’s hull can contribute to the reduction of energy consumption by 2% to approximately 3.8%. Thanks to this, it is possible to reduce the energy consumption for the tug’s movement, which in turn extends the time available for proper tug operation. This time is limited due to the amount of energy available in the on-board energy storage, which must be replenished in a charging process that is not instantaneous.
In addition, the reduced power consumption from the energy storage contributes to increasing its service life and thus extending its service life.
The use of an electric propulsion system in a port tug also reduces the local emission of CO2 and other gases such as sulfur oxides (SOx), nitrogen oxides (NOx) and particulate matter (PM). This allows for a further reduction of emissions in the port area in combination with other solutions serving a similar purpose, such as mandatory use of shore power by berthed vessels.


