1. Introduction
To produce emulsions from two immiscible liquids, it is necessary to disperse one phase into the other. However, this process is counteracted by forces that occur at the interface in the form of interfacial tension. Two factors are usually necessary to overcome these forces. The first is the use of an emulsifier, or surfactant, with which the thermodynamic equilibrium in the system can be altered. The second factor is the application of mechanical work [
1]. The type of emulsifiers (surfactants) selected and the method of energy delivery to the system can determine the type of emulsion (oil-in-water or water-in-oil), the volume fraction of droplets, their average size, and their size distribution. These parameters determine most of the properties of emulsions, especially their stability [
2]. In order to create a stable emulsion system, it is necessary to maximize the contact area between the phases, i.e., to produce a large number of as small droplets as possible. However, in many cases, it is difficult to produce small droplets and the cost of the necessary energy and/or emulsifiers used is very high [
3]. This can be explained by the Laplace pressure drop
pL, defined as the difference between the pressure prevailing outside and inside the droplet, which can be written by the dependence:
where:
σ—tension between oil and water phase,
R1 and
R2—radii of curvature of the droplet. For a spherical droplet,
R1 = R2 = d/2, where
d is the diameter of the droplet. For a droplet to break into a smaller droplet, it must be strongly deformed, and any deformation causes an increase in
pL. Consequently, the stress required to deform the smaller droplet is greater. As stress is generally transmitted through the surrounding fluid by excitation, higher stress requires more vigorous excitation, and so a greater energy [
4].
There are many different methods and mechanisms for forming emulsions such as by static mixing [
5], high-pressure homogenization [
6], ultrasound [
7], membranes [
8], pumps, and many others [
9]. These methods differ in several aspects. The process can be periodic or continuous. In many types of apparatuses, droplets are formed by breaking up larger droplets into smaller droplets, but in some cases, some fragmentation of droplets is already required to form emulsions [
10]. In each method, the most important mechanism is the one in which the droplets are fragmented. This is accomplished by external forces that generally act through the continuous phase. In many cases, these forces come from mechanical, chemical, or electrical energy [
11,
12].
Energy delivery can take many forms; mixing and ultrasound are two classic methods [
13,
14]. Nowadays, the most commonly used equipment for this (so-called homogenizers) often uses repeated forced flow through narrow openings. Under such conditions, turbulent flow usually occurs, the hydrodynamics of which is quite complex to analyze [
15]. However, it should be kept in mind that in conducting all dispersion methods, in addition to the disintegration of the droplets, merging, or coalescence, will also occur. At steady state, a certain droplet size distribution will be achieved, and the average droplet size will depend on the power input: the higher the power input, the smaller the average droplet size [
16]. This means that obtaining small emulsion droplet sizes requires very high energy expenditures. This carries a high cost, both financially and environmentally. Therefore, it becomes important to obtain emulsions characterized by small droplet sizes by using alternative methods, where such high energy inputs are not required.
A good approach turns out to be to subject the pre-made emulsion, characterized by large droplet sizes, to a natural process of imbibing into a porous structure. The imbibition process is defined as a spontaneous liquid movement through a porous structure driven by the capillary pressure and counterbalanced by a viscous drag force and, in many cases, also by the gravitational acceleration [
17,
18]. The capillary force appears as a result of the surface energies interchanging during the solid porous medium wetting with a penetrating liquid [
19]. The imbibition process is observed in the case when the adhesion force between a permeant and a pore wall surface is stronger than the cohesion force between molecules in a liquid.
Imbibition is a fundamental phenomenon in the scientific and industrial community due to its wide application in numerous technological processes and frequent occurrence in nature. This knowledge is important to recover oil from fractured reservoirs [
20,
21] and to remove its splits on the water and soil surface by applying synthetic or natural sorbents [
22,
23]. It also has particular interest in chemical engineering [
24,
25,
26], absorbing materials production, and the investigation of fabrics’ behavior in the presence of liquids [
27,
28]. The phenomenon is a relevant issue for medicine production, pharmacology, the food industry, and other branches [
29,
30,
31].
In many of the mentioned branches of industry, the imbibition process in porous media refers not only to homogeneous substances, representing a single phase, but also to mixtures of various substances forming the multiphase system. In the present years, there has been increasing attention in the study of porous structure imbibition with single-phase liquids such as water and organic compounds: dimethyl silicone oil, kerosene, hexadecane, diethyl ether, dodecane, etc. [
32,
33,
34]. A variety of mathematical models was proposed and discussed in the literature to figure out and predict the process of the mentioned liquids wicking in capillaries and porous media with the different structural properties [
35,
36,
37,
38]. These models consider a wide range of variation in influential factors and the effect of the dynamic contact angle: structural peculiarities of the porous media, i.e., porosity, tortuosity, shape and size of pore voids, effective radius, fractal characteristics of pore network; interactions between liquid–gas phases; saturation level, and others.
However, the process of imbibing porous materials with dispersion systems is a more complicated issue and, due to its importance in many areas of life, requires deeper analysis. In the work [
39,
40,
41,
42,
43], the kinetics of the process of the imbibition of emulsion systems was presented, as well as the analysis of changes in emulsion concentration with the height of imbibition. However, there is a lack of quantitative studies on changes in the distribution of inner phase droplet diameters with imbibition height. This is important because, considering the forces acting on the droplet during the imbibition process, droplet size is of great importance. The smaller the droplet, the lighter its weight, and, theoretically, subjected to capillary forces, it can climb higher during imbibition. However, it should not be forgotten that an emulsion is a dispersion system in which each droplet can interact with the other and influence its movement. Therefore, the analysis of the transport of individual droplets of the emulsion dispersion phase in relation to their size during the soaking process requires detailed experimental studies, which has been undertaken in this work. The focus was on the practical aspect of this research, i.e., where it might find application. The natural segregation of oil emulsion droplets due to the imbibition process was considered to have great potential as a method for obtaining emulsions with small droplet sizes and low polydispersity.
This paper presents a detailed characterization of emulsion structure changes along with imbibition height for two emulsion systems with different types of oil phase and at three internal phase concentrations. This allowed us to present the effectiveness of droplet segregation by using the imbibition process. An example of the application of the method is also presented.
2. Experimental Part
The research of this work focused on the investigation of the imbibition process of emulsions and the influence of physicochemical properties of penetrating dispersions, structures, structure parameters, and the wettability of a porous medium. The porous medium was represented by nonwoven fibrous materials, and the obtained results gave the possibility to predict the imbibition processes occurring in synthetic sorptive porous media, bio-structures, papers, and artificial textile materials.
Measurements of the investigated liquids’ viscosity were carried out using a shear rheometer Bohlin CVO-120 (Malvern Instruments, Malvern, UK). The stability, structure, and concentration of emulsions were measured by using an optical analyzer TurbiscanTM LAB (Formulation Inc., Toulouse, France) and microscope Leica DMI3000B (Leica Microsystem GmbH, Wetzlar, Germany) equipped with the digital video camera Lumenera Infinity (CMOS). The distribution of size droplets of emulsion was measured using the Particle Size Analyzer PSA 1190. The device has been designed to measure a wide range of particle or droplets sizes in liquid dispersions (0.04–2500 μm in liquid mode) or dry powders. PSA equipment through laser diffraction technology measures droplet size distributions by measuring the angular variation in intensity of light scattered as a laser beam passes through a dispersed particulate sample. The angle of the laser beam and droplet size have an inversely proportional relationship, where the laser beam angle increases as droplet size decreases and vice versa. The instrument works with high-resolution detectors to provide accurate and reproducible measuring signals that are used to calculate droplet size distributions based on the Fraunhofer and Mie theories. Measurements of the studied emulsion systems were performed in liquid mode. This consisted of introducing emulsion drops into a chamber filled with a liquid (in this case, with water, i.e., the continuous phase of the emulsion). Obscuration was monitored, which is the percentage of incident light that is attenuated by scattering or absorption by the droplets. Too small a sample (too low an obscuration) would give too weak a signal to reliably determine the composition of the sample; too many droplets in the optical system (high obscuration) could cause a situation in which a beam of light scattered on one droplet would be further scattered on subsequent droplets encountered on its way. When the device detected a sufficient level of obscuration (5–30%), the measurement began. The results, thanks to the software, were processed into a droplet distribution of the internal phase of the emulsion. The surface tension of liquids and interface tension were measured by means of a tensiometer KRUSS K12 (KRUSS GmbH, Hamburg, Germany).
The oil-water emulsion was used as liquids penetrated in the porous structures as a result of the capillary pressure. In the first set of experiments, the internal phase was composed of kerosene Shellsol D-60 (Chmenia-Łódź S.A., Łódź, Poland) and further denoted as a KO type of dispersion. Kerosene represented low-viscosity oil products such as diesel oil, light crude oil, and gasoline. The main advantage of Shellsol D-60 was its relative nonvolatility that minimalized physicochemical property changes during the investigation. In the second set of experiments, the emulsion consisted of the vegetable oil (“Złota Kraina”, Polska sp.z o.o., Kostrzyn, Poland) and was denoted as a VO type, which was a model liquid of high-viscous oil products. The main physicochemical characteristics of these liquids are given in
Table 1.
The oil-water emulsions were prepared according to the standard procedure. The defined volume of the distilled water, as a continuous phase, was mixed with an emulsifier in the 2% vol. fraction. After that, one of two oleic substances (
Table 1) as the dispersed phase was added in the proper concentration, i.e.,
φd of 10% vol., 30% vol., or 50% vol. In each case, the total volume of obtained emulsion was 200 mL. A Rocated O7 (RO) (PCC Exol S.A., Brzeg Dolny, Poland) was used as the emulsifier, composed of ethoxylated oleic acid with given physicochemical parameters: density 908.0 ± 2.7 kg/m
3, viscosity 50.21 ± 0.62 mPas, surface tension 36.2 ± 1.8 mN/m, and HLB number 10.6. The immiscible phases and surfactant were mixed by means of a high shear laboratory homogenizer with revolutions of 20,000 min
−1. The time of homogenization processes was equal to 600 s. The stability of the obtained systems was confirmed experimentally by nephelometric tests.
The experimental setup consisted of a stand with a suspended strip of fibrous material, and a reservoir with the liquid, in which the tip of the material was wet. For the experimental purpose, the strips of material were cut from nonwoven polypropylene sheets. Commercial nonwoven polypropylene (PP) sheets (Sintac Polska Sp. z o.o., Warszawa, Poland) were used as the porous medium. This material is known as an appropriate sorbent of the different oil products and characterized by a high level of physical and chemical resistance, reusability, and possibility to recover the absorbed liquids. Nonmodified oleophilic/hydrophobic was used. It consisted of webs created by the consolidation of fibers, which comprised individual filaments. The physicochemical parameters of this material are presented in
Table 2.
The contact angle between the surface of the PP-O material and oil was equal to 36.2°, and between kerosene and water, it was 38.8° and 98.5°, respectively.
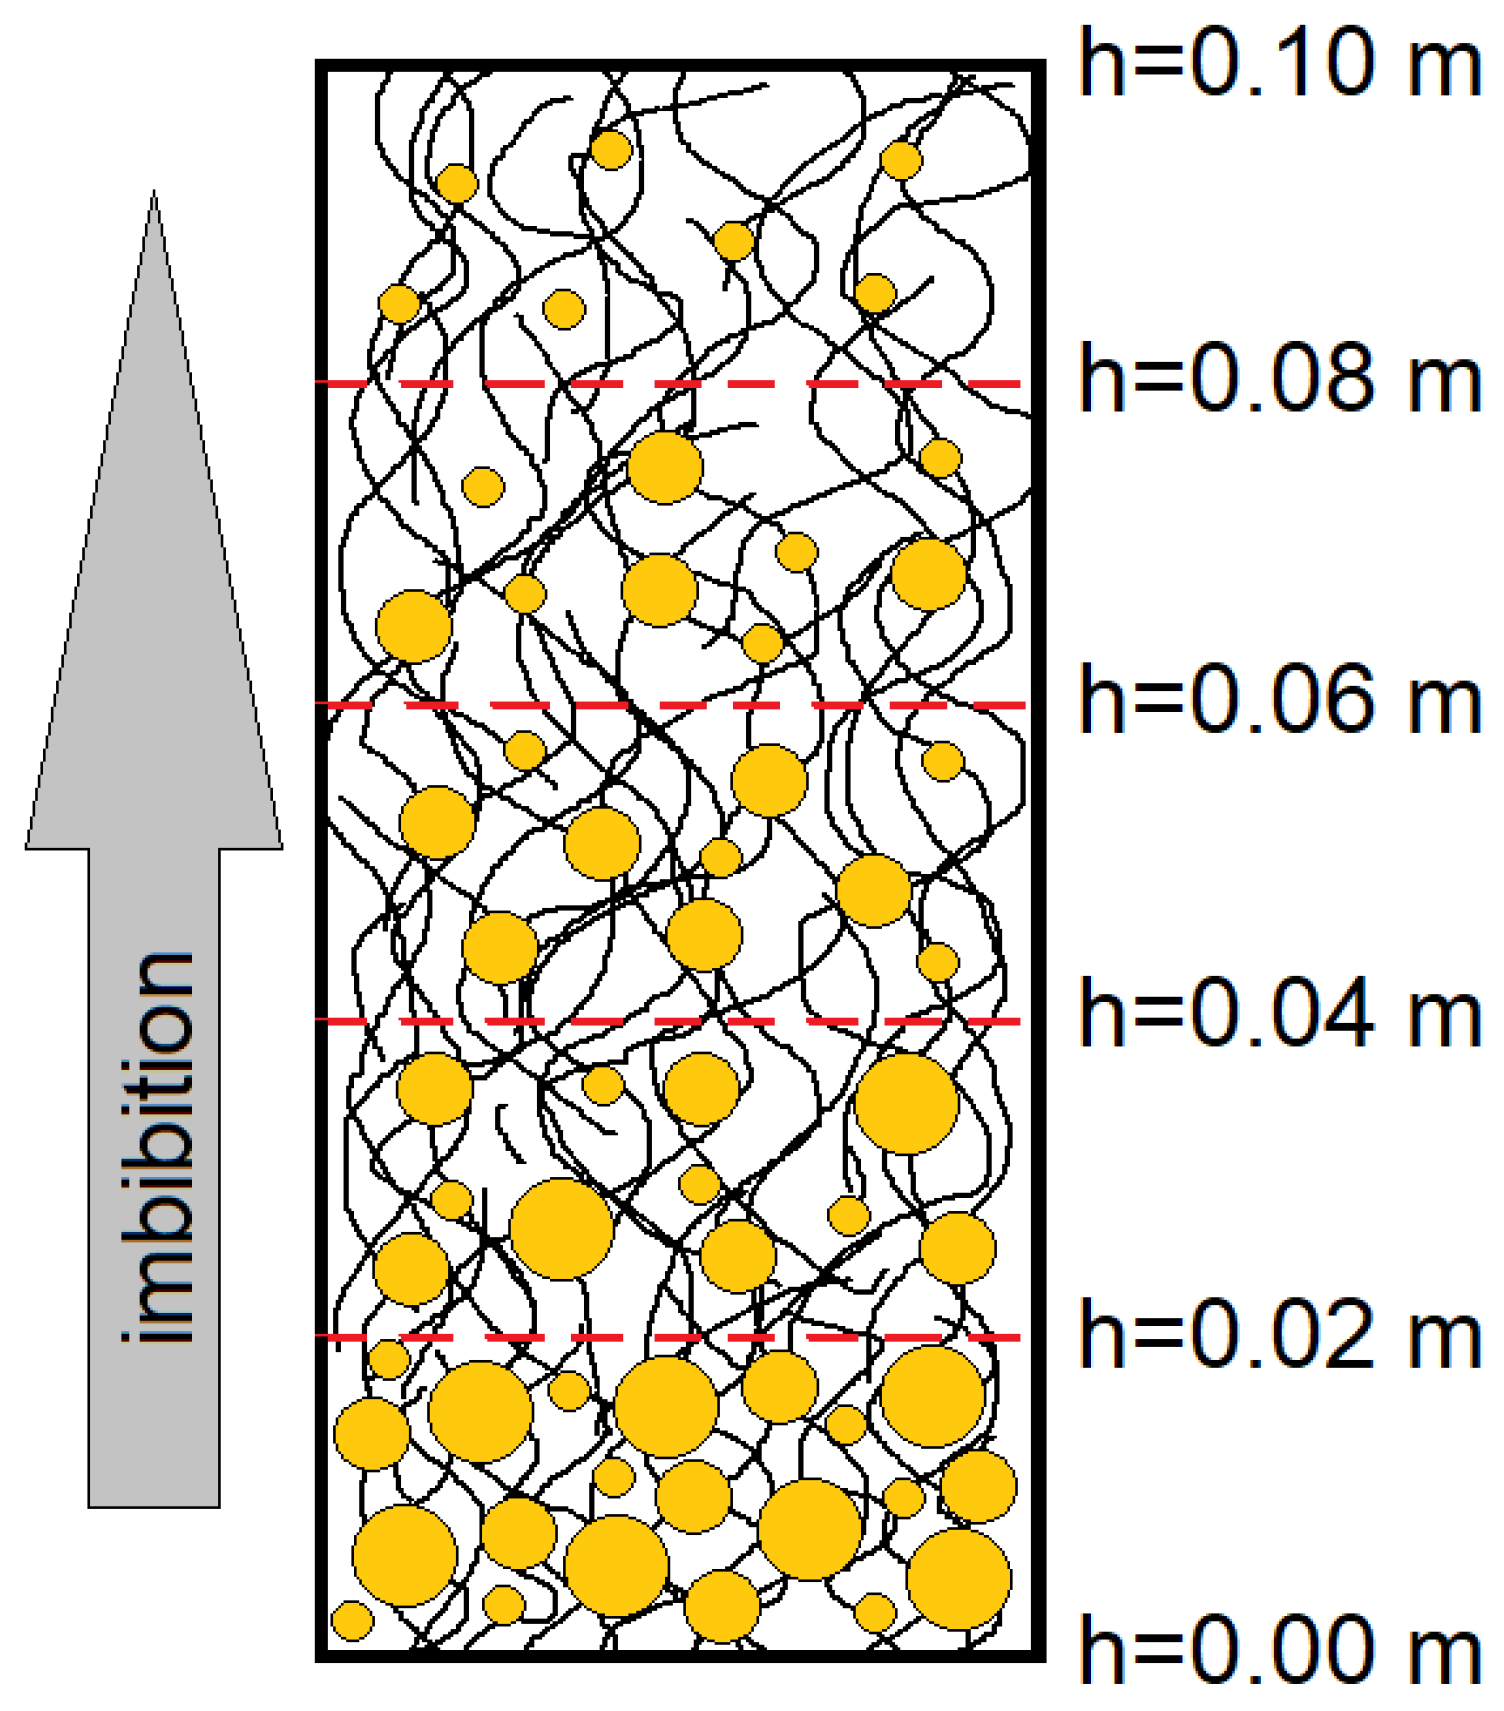
For the experimental purpose, the strips were cut from nonwoven polypropylene sheets. The sheets had the same size: width 0.035 m, height 0.2 m. After preparation, the emulsion was poured into a 250 mL beaker. A strip of polypropylene was directly immersed with one end into the tested emulsion at a depth of 0.02 m. The contact area of fibrous material with an emulsion was equal to 0.0014 m
2. The imbibition process continued for 1800 s. After this time, the strip of material was taken out of the liquid and divided into fragments of 0.02 × 0.035 m in size, which is schematically presented in
Figure 1. The mechanism involved the partition of material into equal pieces, which were subjected to washout after the imbibition process. The exact dividing lines of the material were marked before it was immersed in the investigated emulsion, and the cutting itself was performed with forceps and a scalpel. The emulsion washout procedure consisted of placing each fragment of material in a vessel and pouring 10 mL of distilled water over it. Then, a magnetic stirrer (Velp Scientifica MSL 50, Bohemia, NY, USA) was thrown into the vessel and the system was stirred for 5 min, set at 30 rpm. It should be emphasized here that the role of the magnetic stirrer was only to excite the movement of the liquid and intensify the washing out of the oil droplets from the material, and the rotational speed was low enough not to disturb the structure of the oil droplets. The use of this stirrer was intended to speed up the washout process, but in order to save energy, its use can be omitted. In this situation, it would be necessary to leave the fragment of material in the washing liquid for some time.
After 5 min, the material fragment was removed from the liquid, suspended on a rack above the container and left to drain for 30 min. The resulting liquid was subjected to analysis of the diameter size distribution and concentration. To check for residual emulsion in the material, the fragment was repeatedly flooded with 10 mL of water and stirred for 5 min. This was repeated until a clear effluent was obtained. Each liquid obtained from successive effluents was subjected to turbidimetric analyses to determine the content of oil droplets. The results obtained from successive leachates were included in the calculation of emulsion concentration. The method of concentration assessment was described in detail in several publications [
40,
44]. A PSA 1190 Particle Size Analyzer was used to obtain accurate distributions of the diameters of the droplets washed from successive fragments of the material. With these measurements, it was possible to determine how the concentration of the emulsion changes with the height of the imbibed material and how the droplet size distribution of this emulsion changes with height.
2.1. Analysis of Results
According to the test procedure presented above, the imbibition process took 1800 s. After this time, the porous material was divided into fragments and the liquid was washed away. This fluid was then subjected to analyses. These analyses were designed to show changes in the structure of the emulsion, that is, its droplet size distribution and concentration, with the height of the material into which it imbibed. These changes were determined as a function of emulsion concentration and the viscosity of the oil phase of the emulsion.
2.2. Oil Droplet Size Changes with Imbibition Height
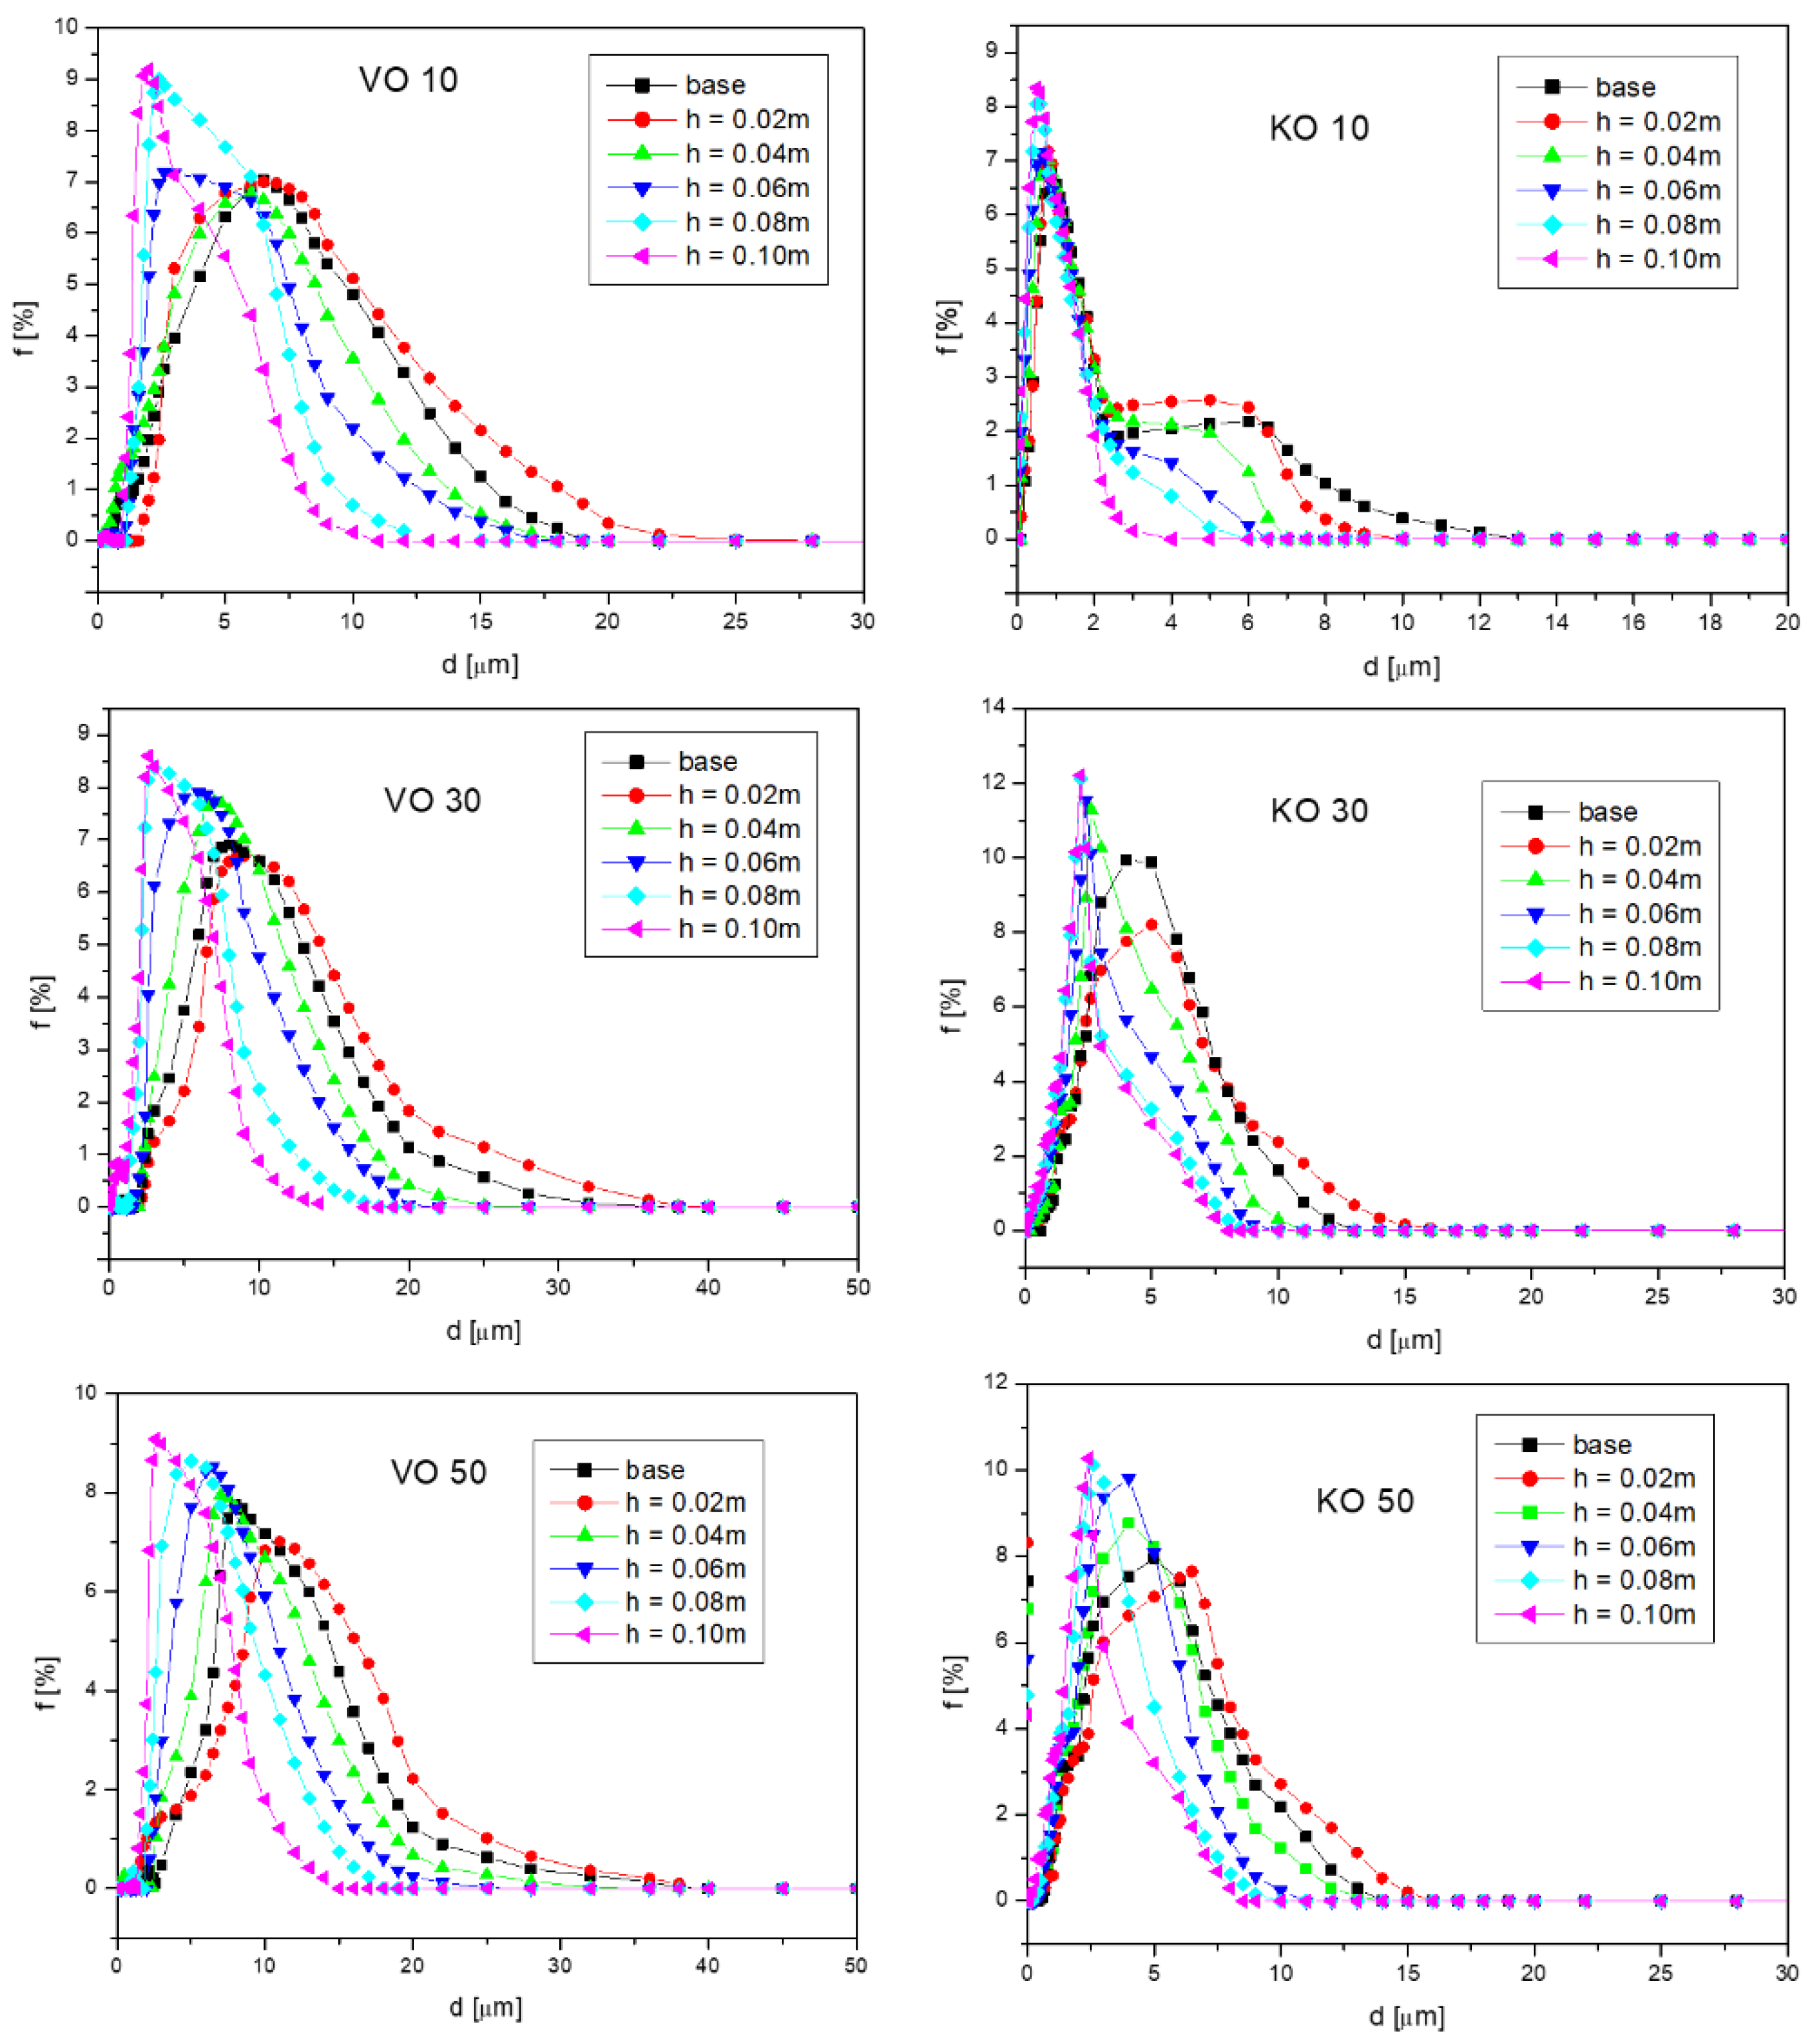
Figure 2 presents the diameter distributions obtained from the analyses of the emulsion washed from the different fragments of the fibrous material. The symbol VO refers to the vegetable oil emulsion, while KO refers to the kerosene emulsion. Emulsions with three different initial concentrations were presented: 10, 30, and 50%.
As can be observed in
Figure 2, the diameter size distributions obtained for the emulsion eluted from the fragments of porous material located lower were wide, which means that the droplets were of different sizes. This indicates that there were fewer and smaller droplets at higher altitudes. For comparison purposes, apart from the diameter distributions of the droplets washed out of the fibrous material, the diameter size distribution for the emulsion before the imbibition process, i.e., the emulsion produced mechanically by the homogenizer, was also included. This distribution has been denoted as “base” in
Figure 2. As can be seen, the size distribution for the base emulsion (the one that was in the beaker with the imbibing liquid) was narrower and shifted more toward smaller diameters compared to the distribution of the emulsion washed from the fragment corresponding to a height of
h = 0.02 m. This means that at the lowest height of the fibrous material, the droplet size was larger than for the emulsion in the beaker. This indicates that the large emulsion droplets, due to their weight and diameters, generated such a high flow resistance that capillary forces were unable to move them to higher levels. As a result, the large drops were trapped at the lowest height. Smaller droplets, on the other hand, climbed higher. At a height of 0.04 m, the resulting droplet diameter distributions were narrower and shifted towards smaller diameters than for the base emulsion. Thus, there was a segregation of droplet sizes. The higher the height the droplets traveled during the imbibition process, the smaller their size was. At a height of 0.1 m, the diameter distributions obtained were the narrowest and most shifted toward small diameters.
Comparing the diameter distributions obtained for emulsions where the dispersed phase was vegetable oil with emulsions where the oil phase was kerosene, it can be seen that, in general, the droplet sizes obtained for kerosene emulsions were smaller. This is due to the lower viscosity and lower surface tension of kerosene than vegetable oil. By supplying the same mixing energy to the system, for the same time, it was possible to obtain finer droplets. The proportion of the oil phase of the emulsion was also important. The lower it was, the obtained emulsions were characterized by smaller sizes.
The observed trend of changes in diameter distributions was common to all systems studied. However, in order to be able to draw more quantitative conclusions from the results presented, the mean
dav diameter was calculated for each distribution from the formula:
where:
di—diameter of oil droplets in a given range,
ni—number (share) of droplets with diameter
di.
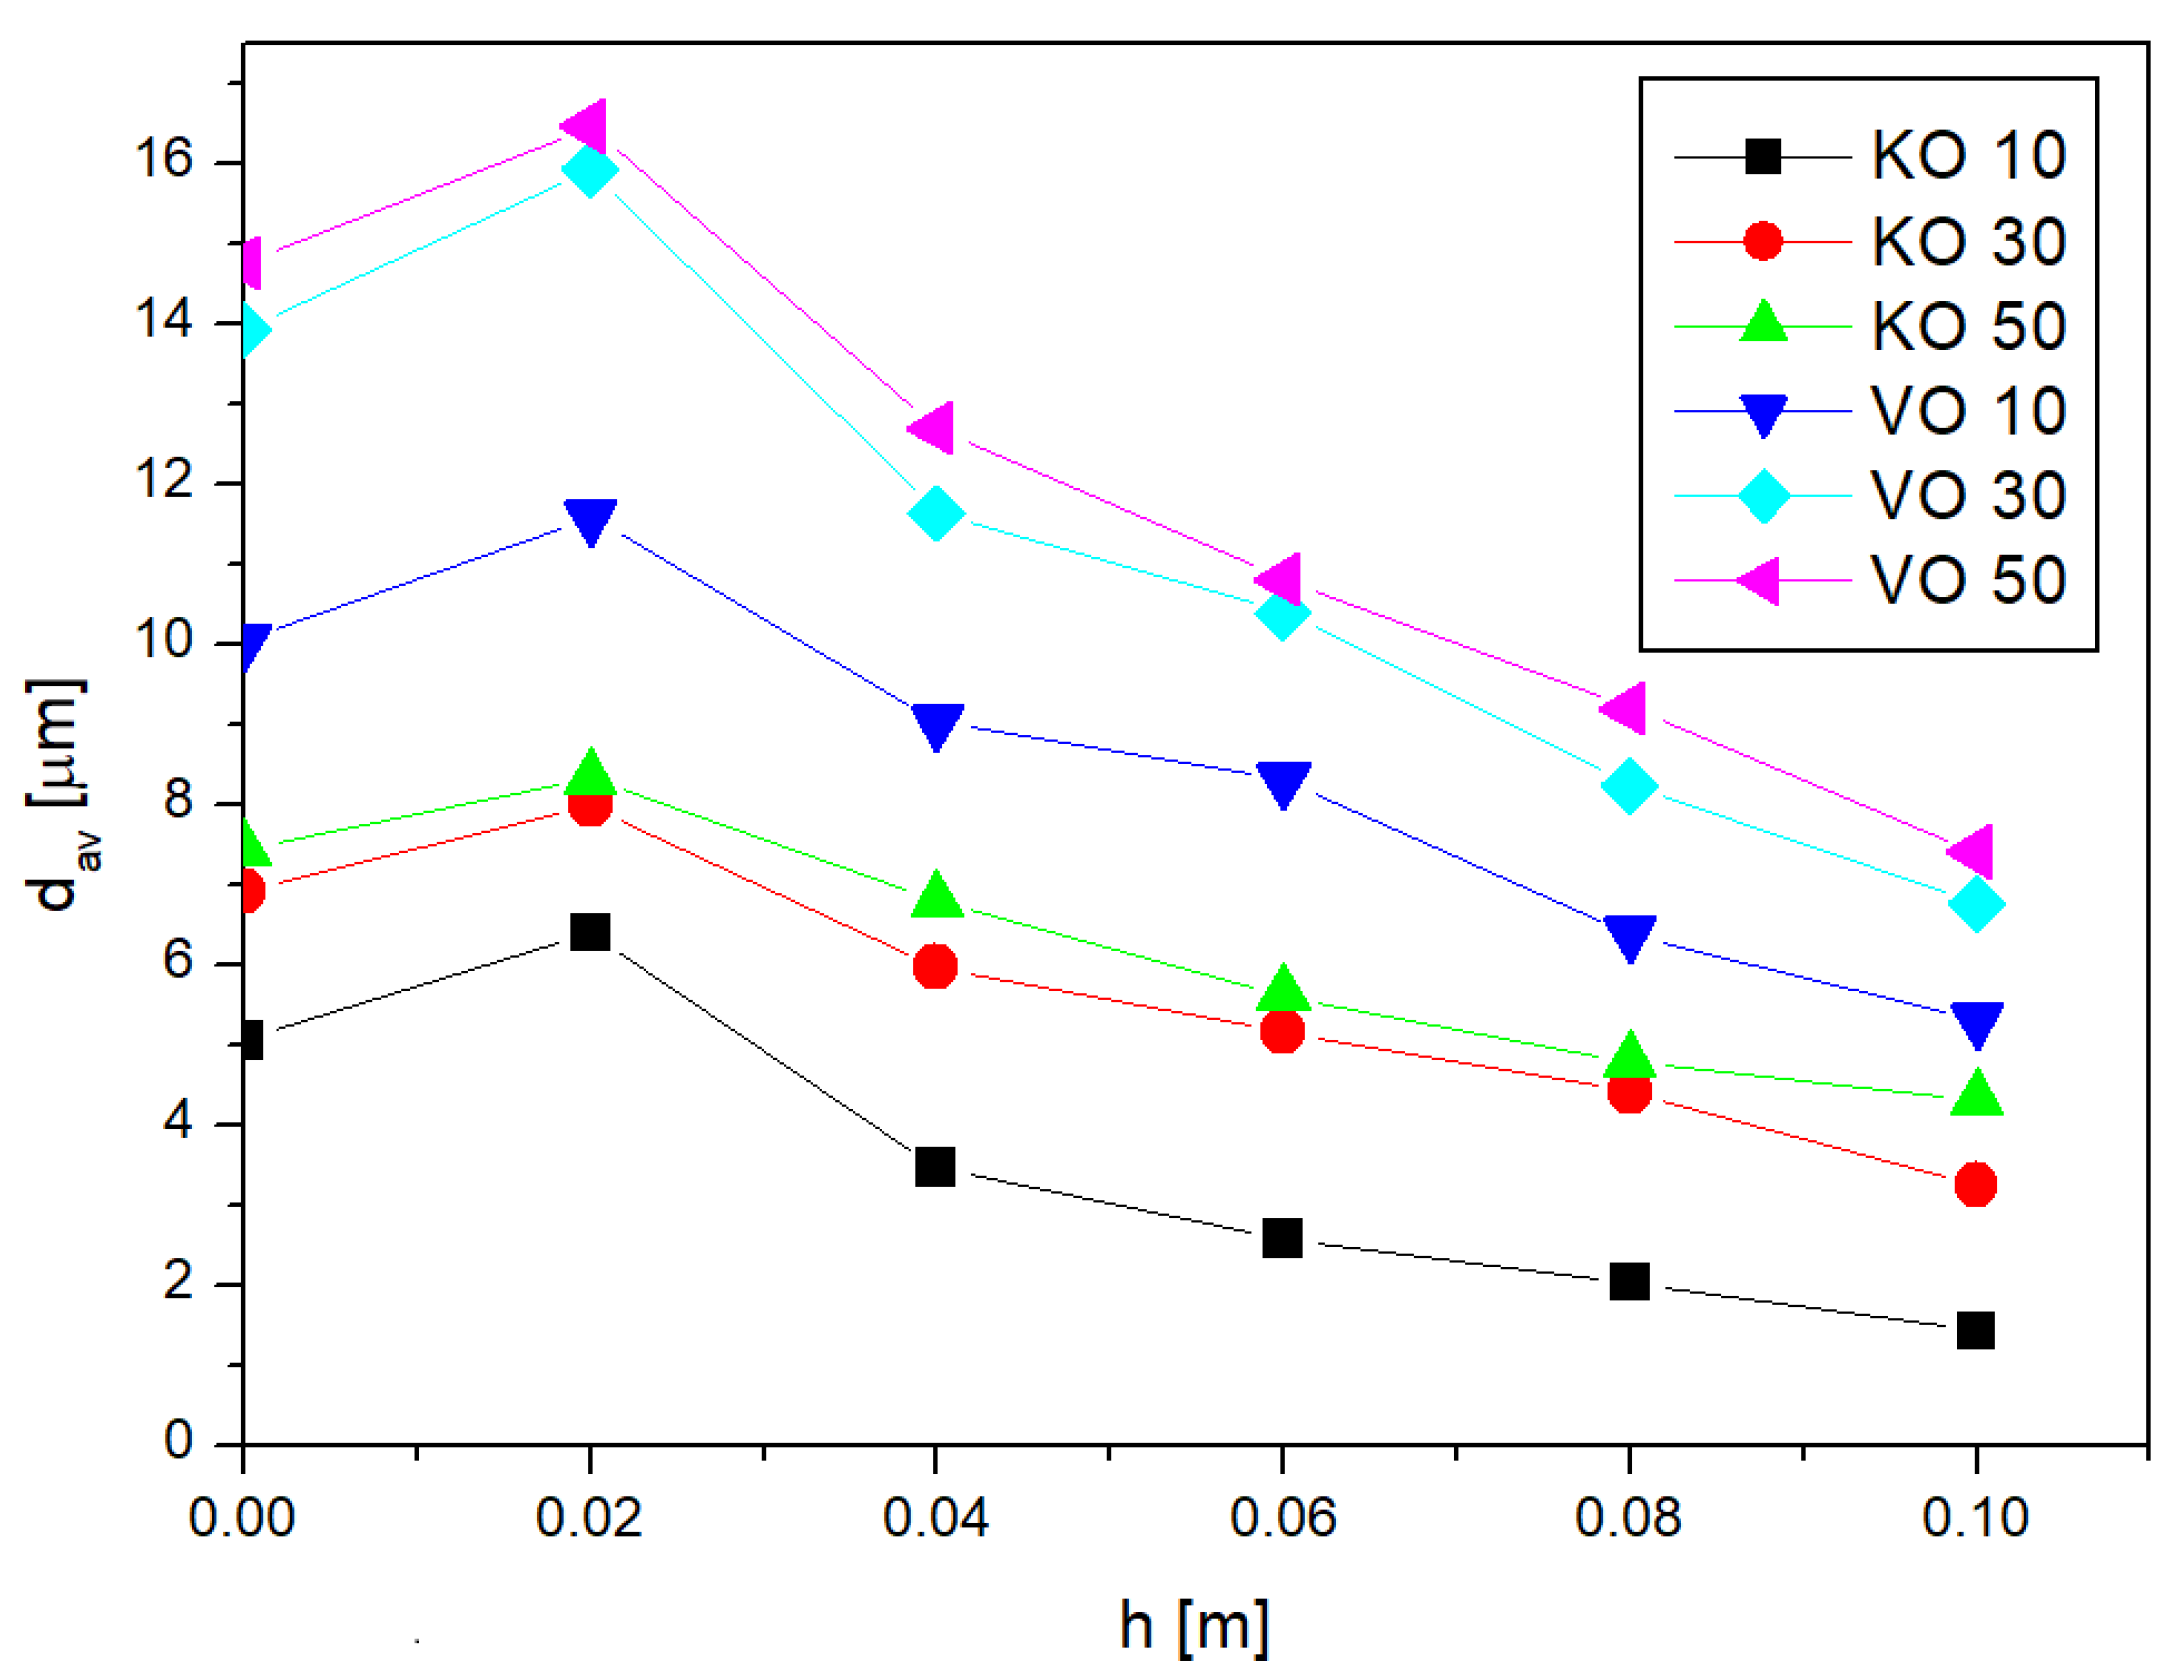
Figure 3 shows the dependence of the average diameter of emulsion oil droplets from the height of the fragment from which the emulsion was washed. The height
h = 0 on the graph corresponds to the average droplet diameter obtained for the base emulsion (the one that was subsequently imbibed).
As can be seen, the values of the average diameter for the first fragment (located lowest h = 0.02 m) were, in each case, higher than the value of the average diameter for the base emulsion. The largest differences were observed here for the emulsions with the lowest concentration—in the case of vegetable oil emulsion VO 10, the mean diameter at h = 0.02 m was about 15% larger than the value of the mean diameter of the base emulsion, while, in the case of kerosene oil emulsion KO 10, it was larger by as much as 25%. For the most concentrated emulsions (50%) for both types of internal phases, the mean diameter at the considered height was larger than the mean diameter of the base emulsion by about 11%. For the next height h = 0.04 m, the average droplet diameter was smaller than the dav of the base emulsion by about 10–15% on average. The exception here is the K0 10 emulsion, where the average diameter decreased relative to the base emulsion by as much as 30%. At subsequent heights, a further decrease in mean diameter values was observed, which remained at 10–15% relative to the dav value of the measured base emulsion. For the highest fragment (h = 0.1 m), the washed emulsion had the smallest average diameter. Comparing with each other the dav values obtained at this height with those measured for the base emulsion, it can be seen that for the vegetable oil emulsion, the mean diameters were almost half the diameters of the base emulsion. In the case of the kerosene emulsion, for the 10% emulsion, the obtained diameter values were as much as 72% smaller than the average diameters of the base emulsion, while for the 30% and 50% emulsions, dav values were 53% and 41% smaller than the values obtained for the base emulsion.
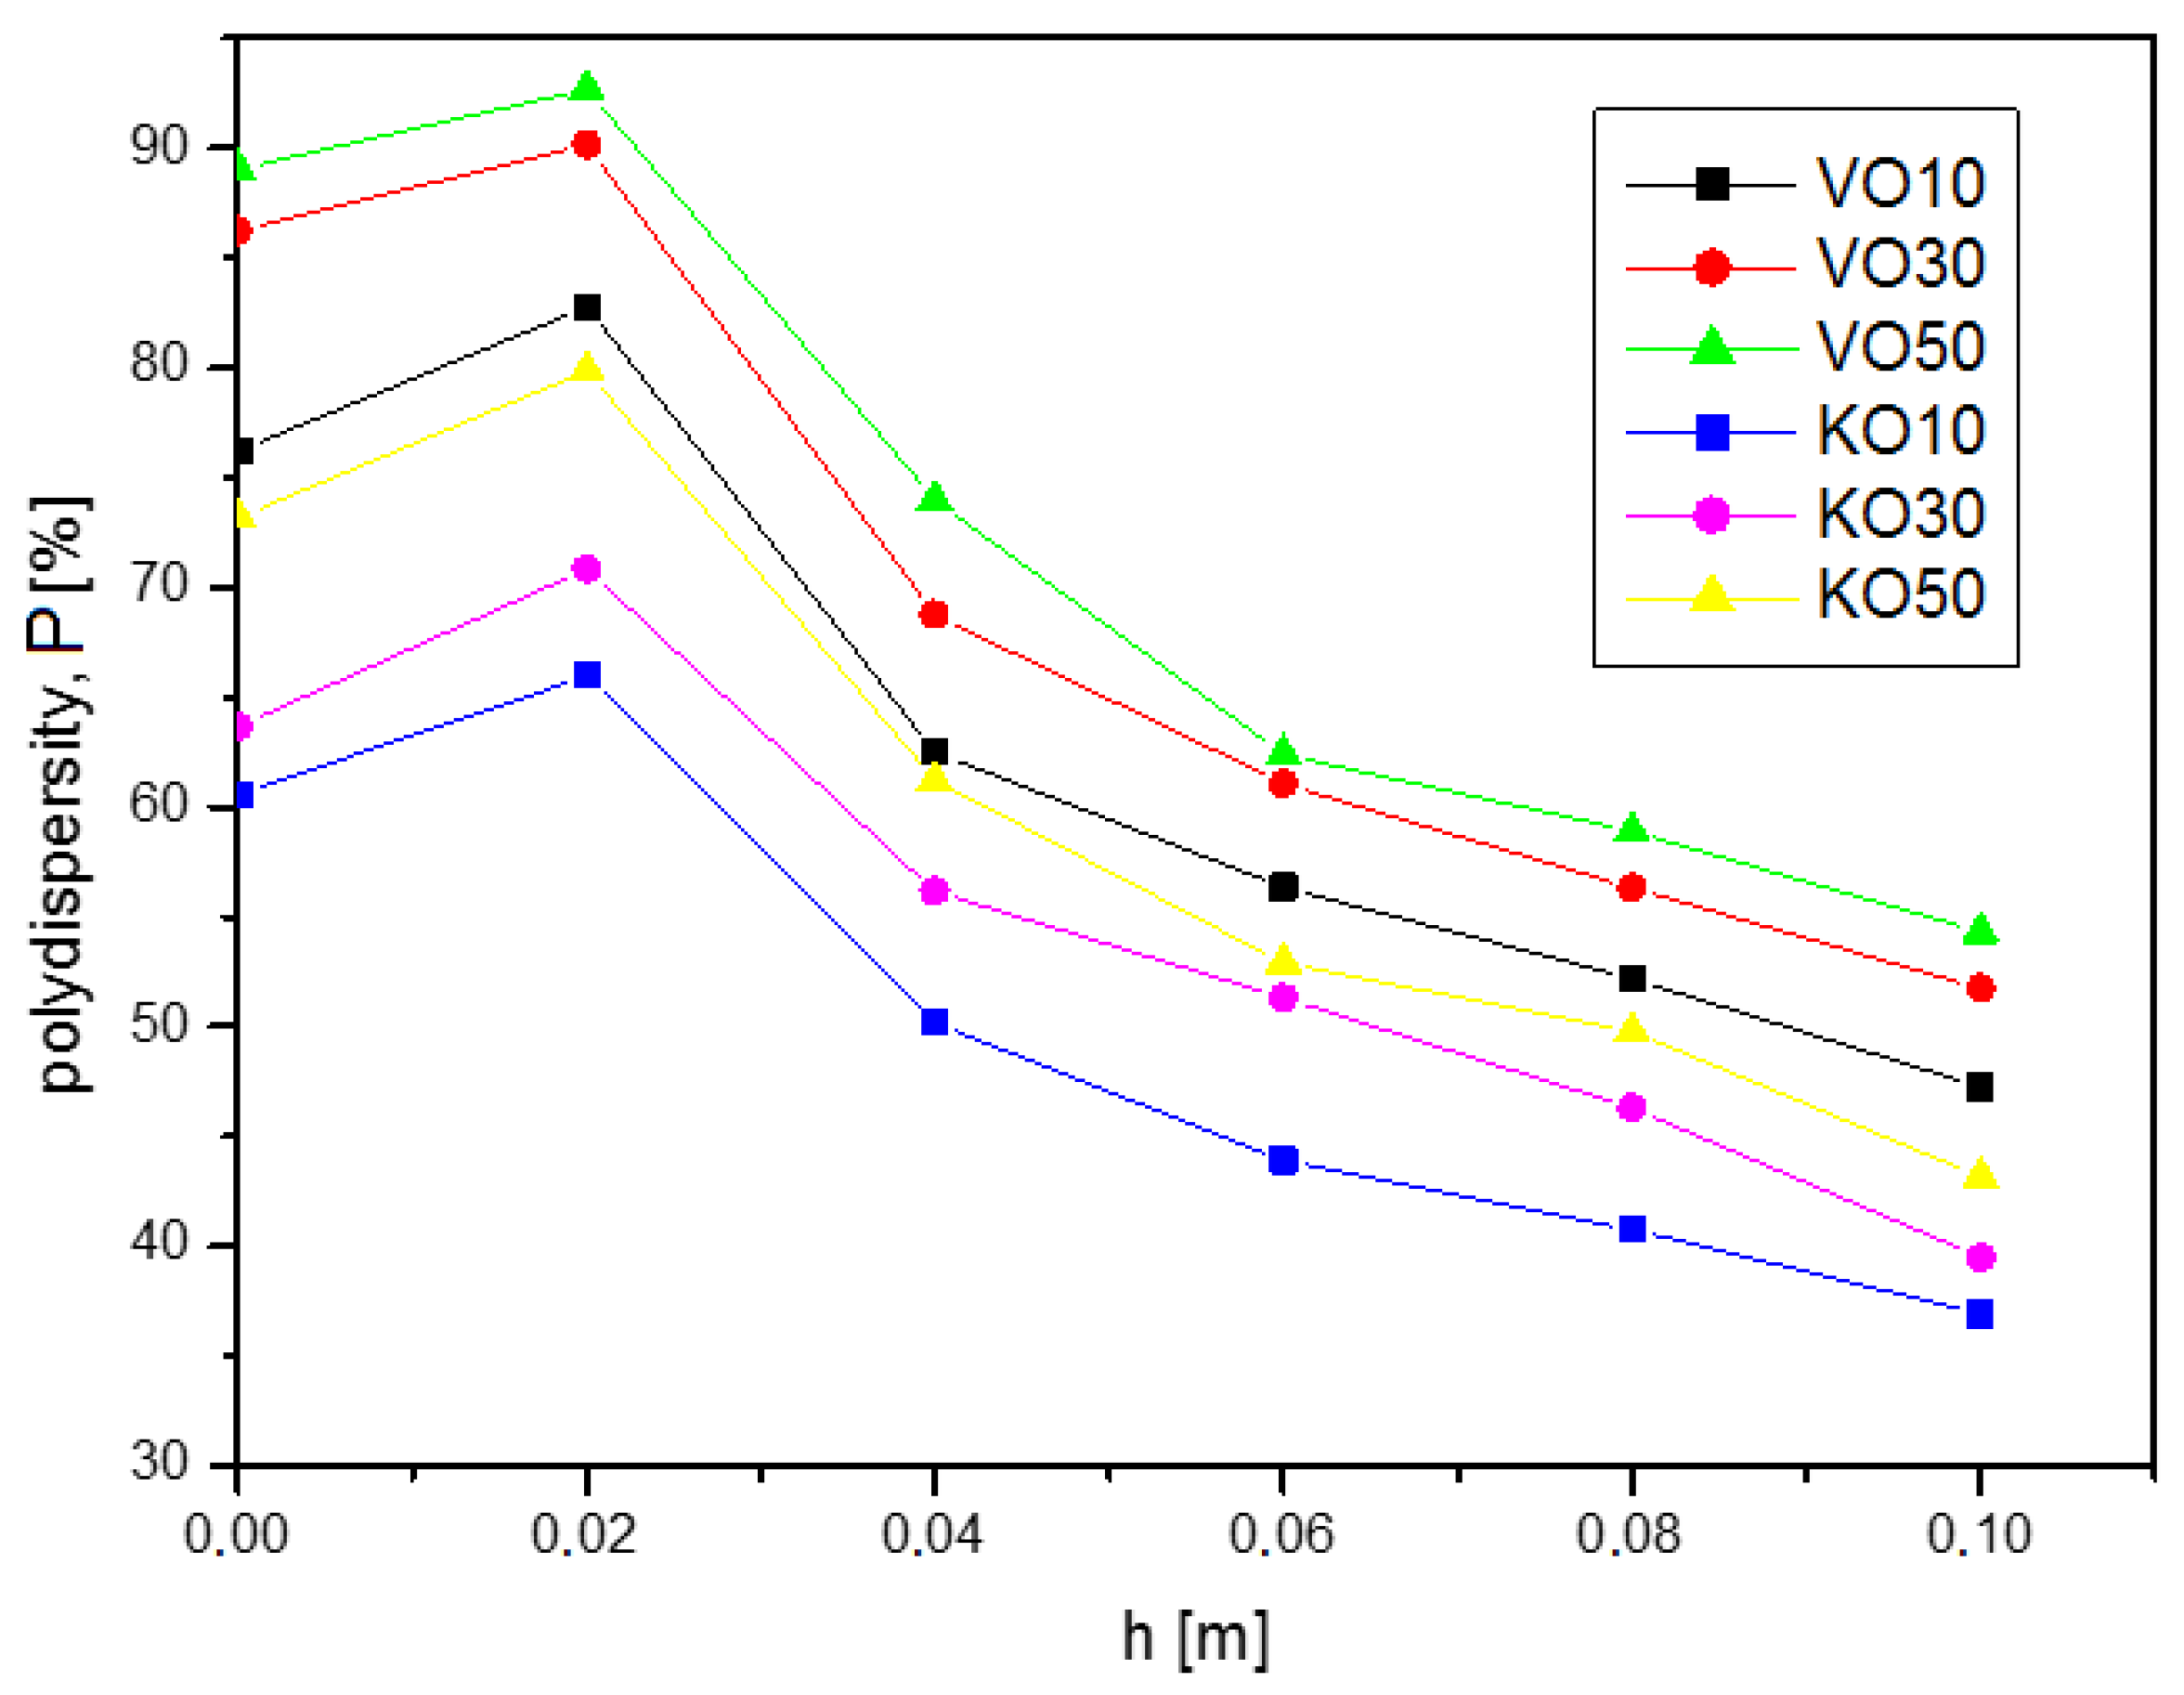
The polydispersity
P is an important parameter, the values of which are shown in
Figure 4. The imbibition process, which led to emulsion oil droplets segregation, ended with the polydispersity reduced by about 40% with regard to the initial system. The parameter
P was calculated on the basis of the following equation [
45]:
where:
—the median diameter (the diameter for which the cumulative undersized volume fraction is equal to 50%).
By tracking the changes in the values of polydispersity as a function of imbibition height (
Figure 4), a similar trend can be observed as for the changes in the values of average diameters from
h. In the first section (at height
h = 0.02 m), the polydispersity was slightly larger than for the base emulsion (
h = 0 m). However, for higher heights, there was a decrease in the value of
P. Finally, at the highest height (
h = 0.1 m), the polydispersity relative to that of the base emulsion was, on average, 40% smaller for both types of emulsion (VO and KO).
2.3. Changes in Emulsion Concentration with Imbibition Height
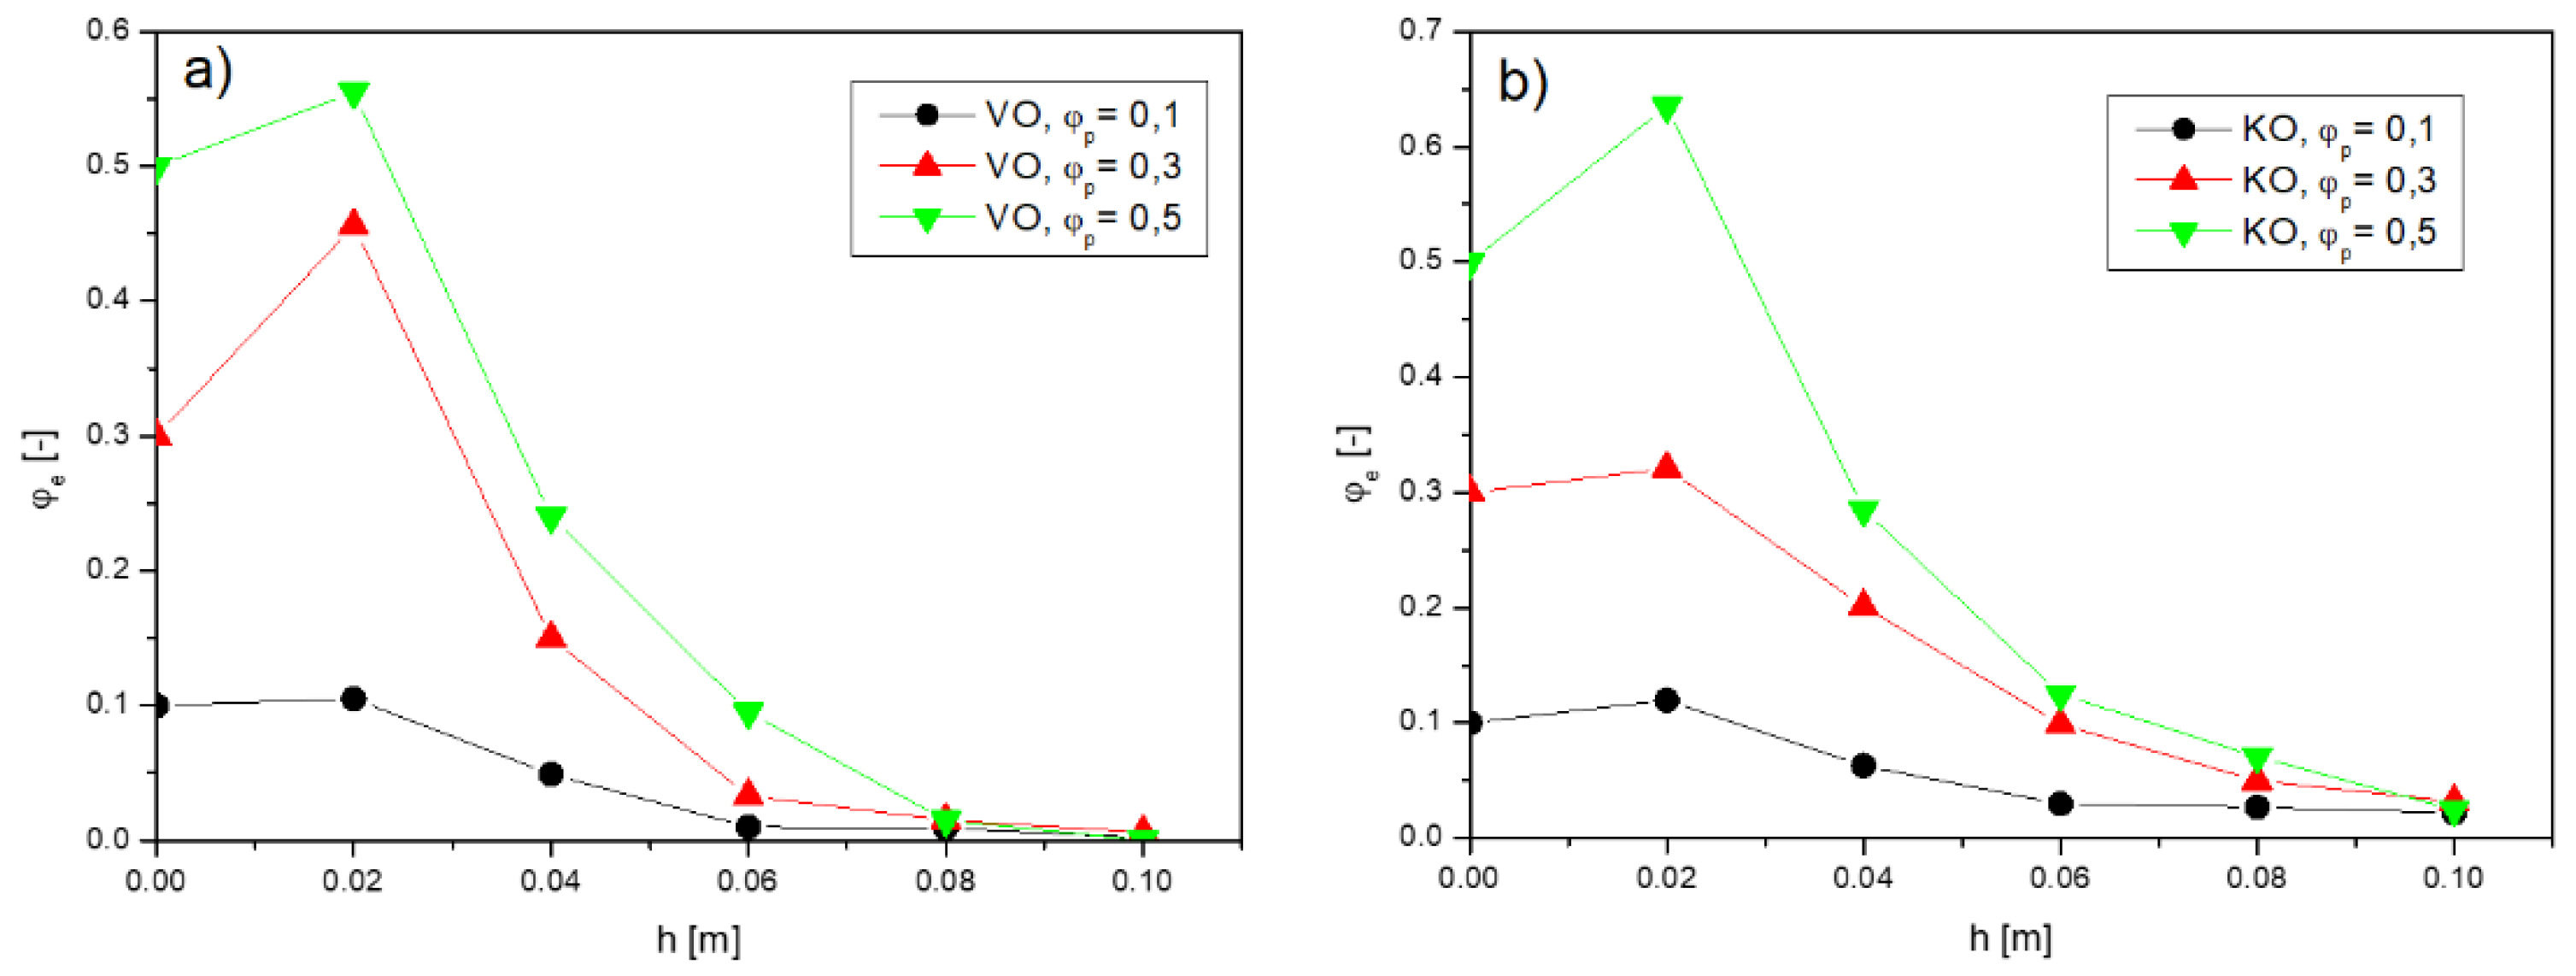
Considering the structure of the dispersion system, besides the size of the inner phase droplets, an important parameter is also the volume fraction of this phase in relation to the whole solution, i.e., concentration. For this reason, the analyses of the eluted liquid from individual fragments of fibrous material were also carried out in terms of the concentration of oil phase
φe.
Figure 5 presents the dependence of changes in the emulsion concentration
φe with the height of the imbibed material
h, where
Figure 5a refers to the vegetable oil emulsion and
Figure 5b to the kerosene emulsion.
In the graph of
Figure 5, for height
h = 0, the concentration values corresponding to the initial concentration, i.e., as it was in the beaker, were deposited. Subsequent values refer to the concentrations measured for the emulsion washed from the section of material relating to a given height. As can be seen, in the first section (
h = 0.02 m), i.e., located at the lowest level, the concentration of emulsion exceeded the initial concentration in each case. This means that in this section, a larger volume of oil phase accumulated than would have resulted from the proportion of this phase in the emulsion before the imbibition process (base emulsion
h = 0). This may suggest that some of the oil droplets were trapped in the porous structure and could not penetrate higher up. The capillary forces forcing the imbibition process, in this case, were too small to overcome the flow resistance and droplet weight, causing a significant number of droplets to stop at low levels. As shown earlier, based on droplet size analyses, there were many large droplets. The weight of such droplets and their size opposed the capillary forces that pulled them upward. As a result, these droplets were trapped at this height. The large number of large droplets must have affected the concentration value, understood as the volume fraction of the oil phase.
The emulsion concentrations for successive material fragments decreased with height and were close to zero at h = 0.1 m. This means that in the last fragment of porous material, located the highest (h = 0.1 m), the emulsion was very dilute and contained droplets of small size.
2.4. Changes in the Number of Oil Droplets with Imbibition Height
To draw more quantitative conclusions, the values of the obtained average droplet diameters were combined with the concentration values by determining the number of droplets per 0.1 mm3 of porous material at a given height.
Knowing the proportion of the internal phase of the emulsion at each tested height, it is possible to determine what proportion of the emulsion volume will be occupied by the oil phase
Vo according to the relation:
In turn, the average volume of a single drop of emulsion can be calculated as:
By dividing the volume of the oil phase
Vo, calculated from Relation (4), by the average volume of a single droplet
Vk from Relation (5), it is possible to calculate the number of droplets
N, i.e.,:
Assuming that all void spaces in the material during imbibition are occupied by liquid, it can be determined that in
Vm = 1 mL of material, there will be
Ve = 0.93 mL of emulsion. By substituting the values of emulsion concentrations obtained for given heights and the corresponding values of average diameters into Relation (6), it is possible to calculate the number of drops per 1 mL of fibrous material at a given height.
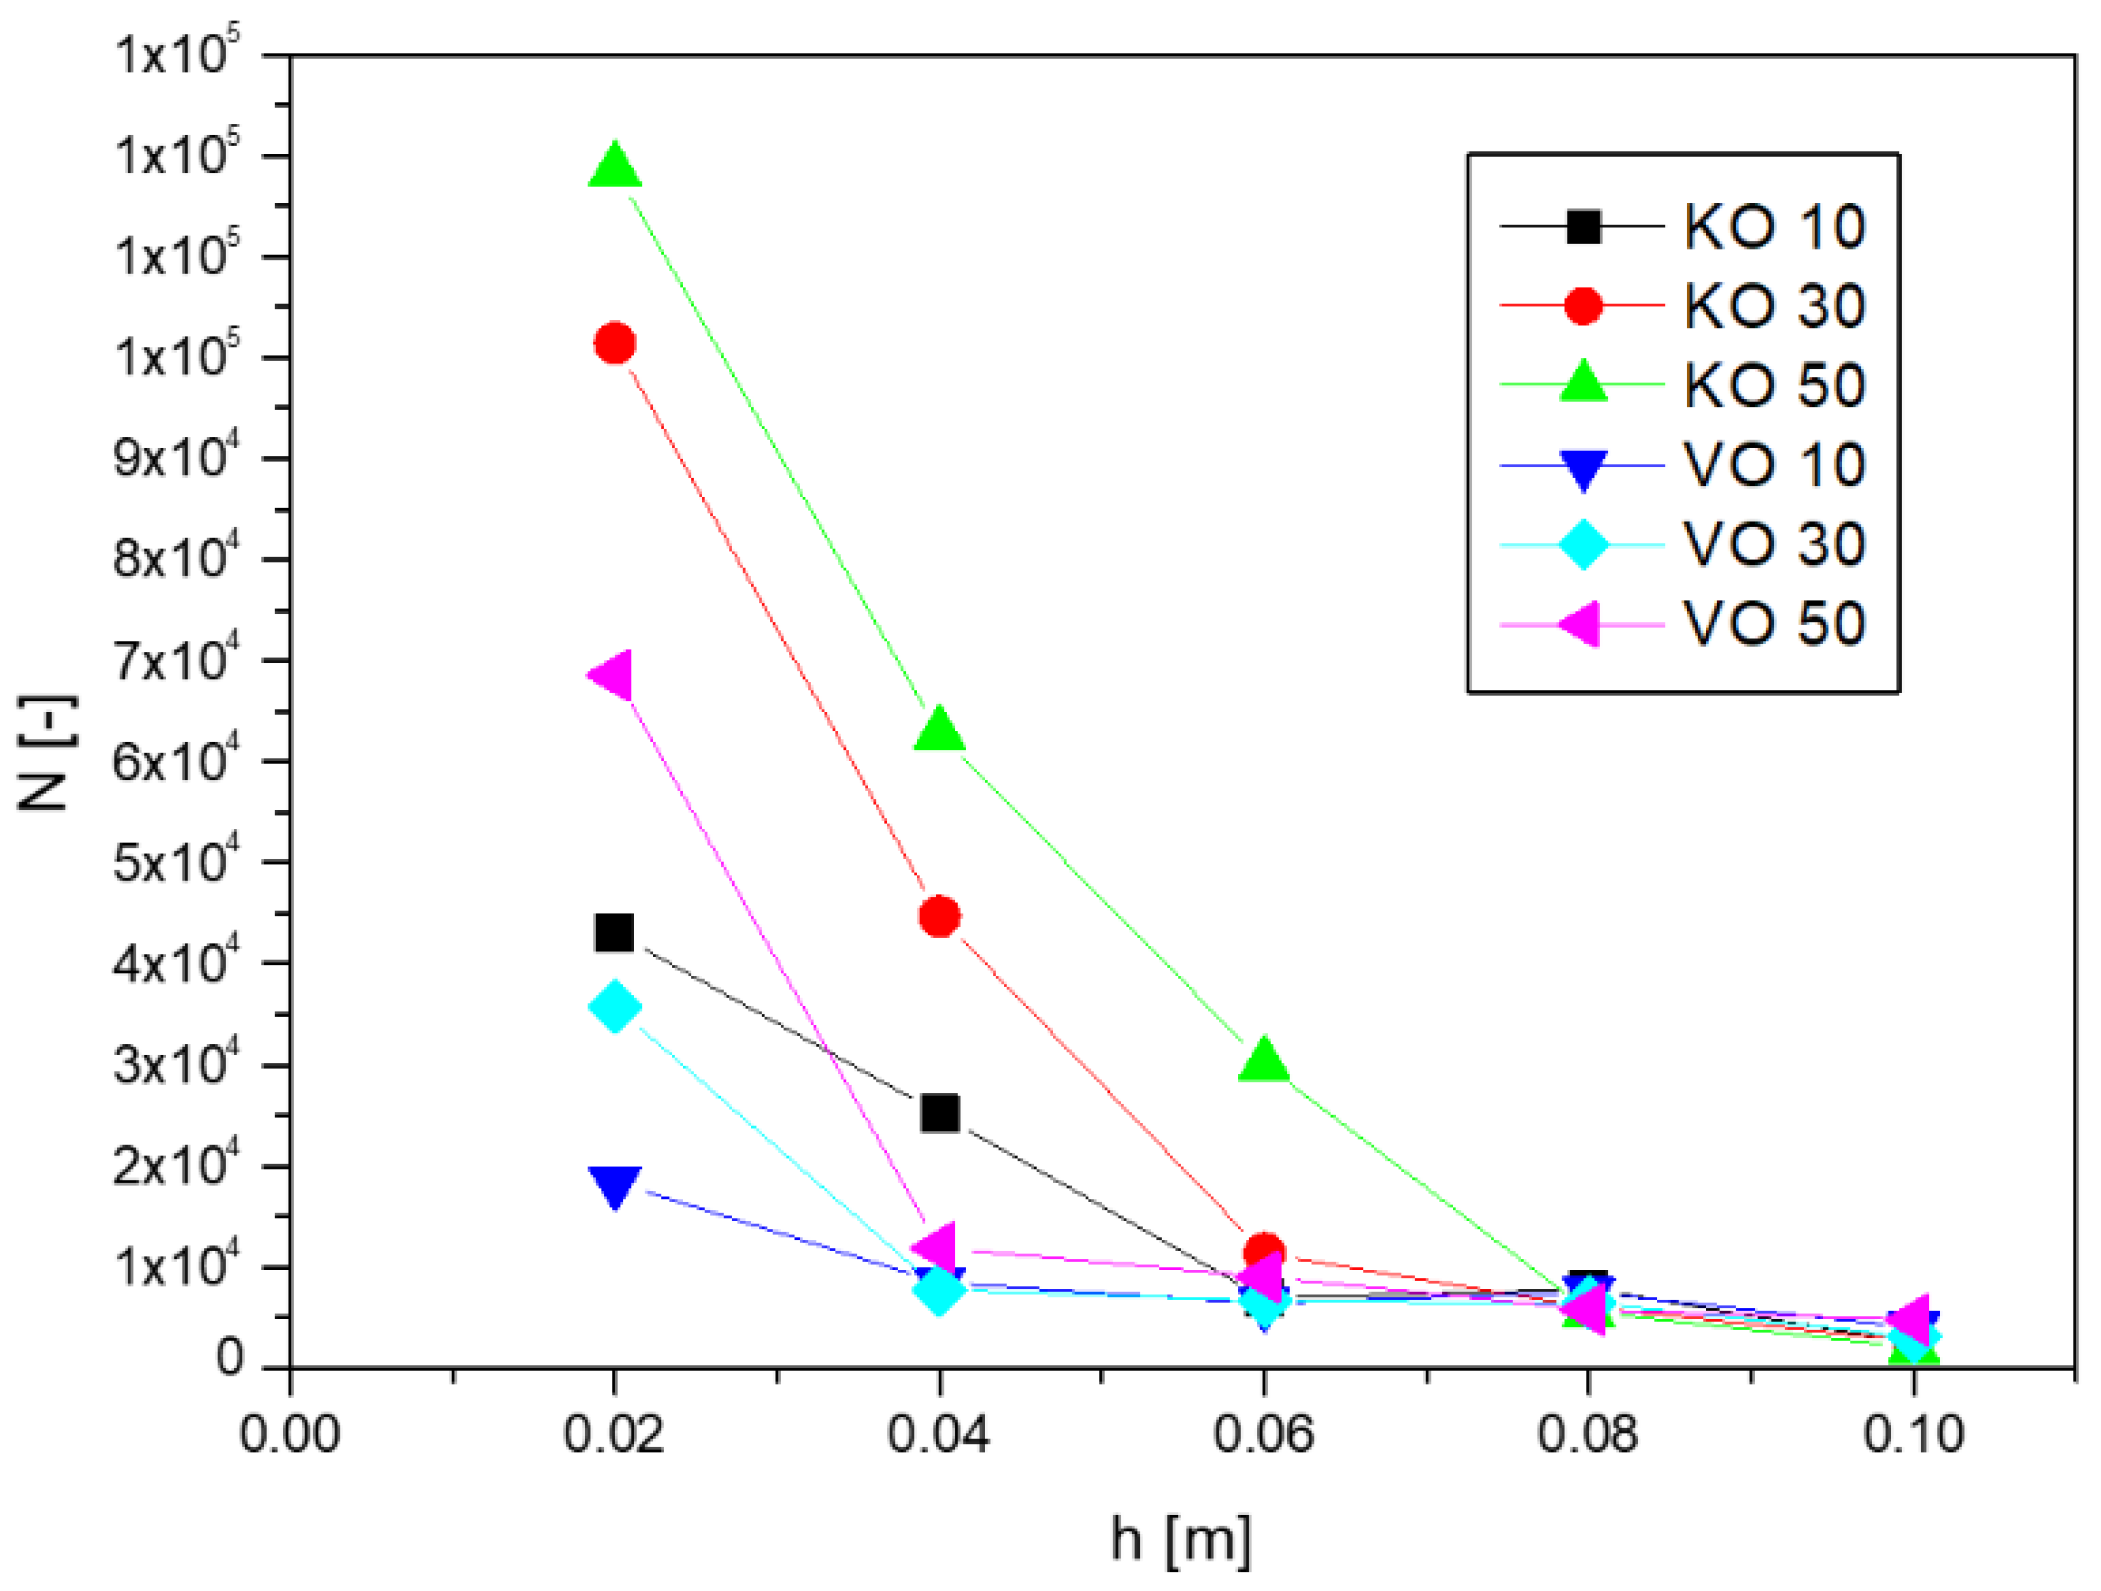
Figure 6 shows the dependence of the calculated number of droplets
N on the imbibition height
h.
As can be seen from
Figure 6, the number of droplets decreases with imbibition height. In the first section of fibrous material (
h = 0.02 m) from which the emulsions were washed out, the majority of oil droplets could be observed. For subsequent sections, placed higher, the number of droplets decreased dramatically. Finally, for the section corresponding to a height of
h = 0.1 m, the number of oil droplets per 1 mL of porous material was of the order of several thousand.
In the porous material, more oil droplets were recorded for the kerosene emulsion than for the vegetable oil emulsion. This was due to the overall smaller droplets obtained for this type of emulsion, resulting in larger droplet numbers at similar concentration values. For the vegetable oil, fewer droplets were observed, but they were larger. For emulsions with a higher proportion of oil phase, higher droplet numbers were observed.
It should be added that the above analysis is based on mean droplet diameters; however, having droplet size distributions, it is possible to accurately calculate the number of droplets of specific sizes. This can provide valuable information regarding the characteristics of the systems obtained.
3. Benefits and Applications of the Droplet Segregation Method
The process of oil droplets segregation by using the imbibition process allows one to obtain systems with average diameters about a half smaller than for the emulsion before the process. Moreover, the obtained polydispersity was up to about 40% smaller than that of the initial system. The process took place spontaneously by capillary and gravity forces. However, the method required an elaborate technique to wash the oil droplets out of the fibrous material.
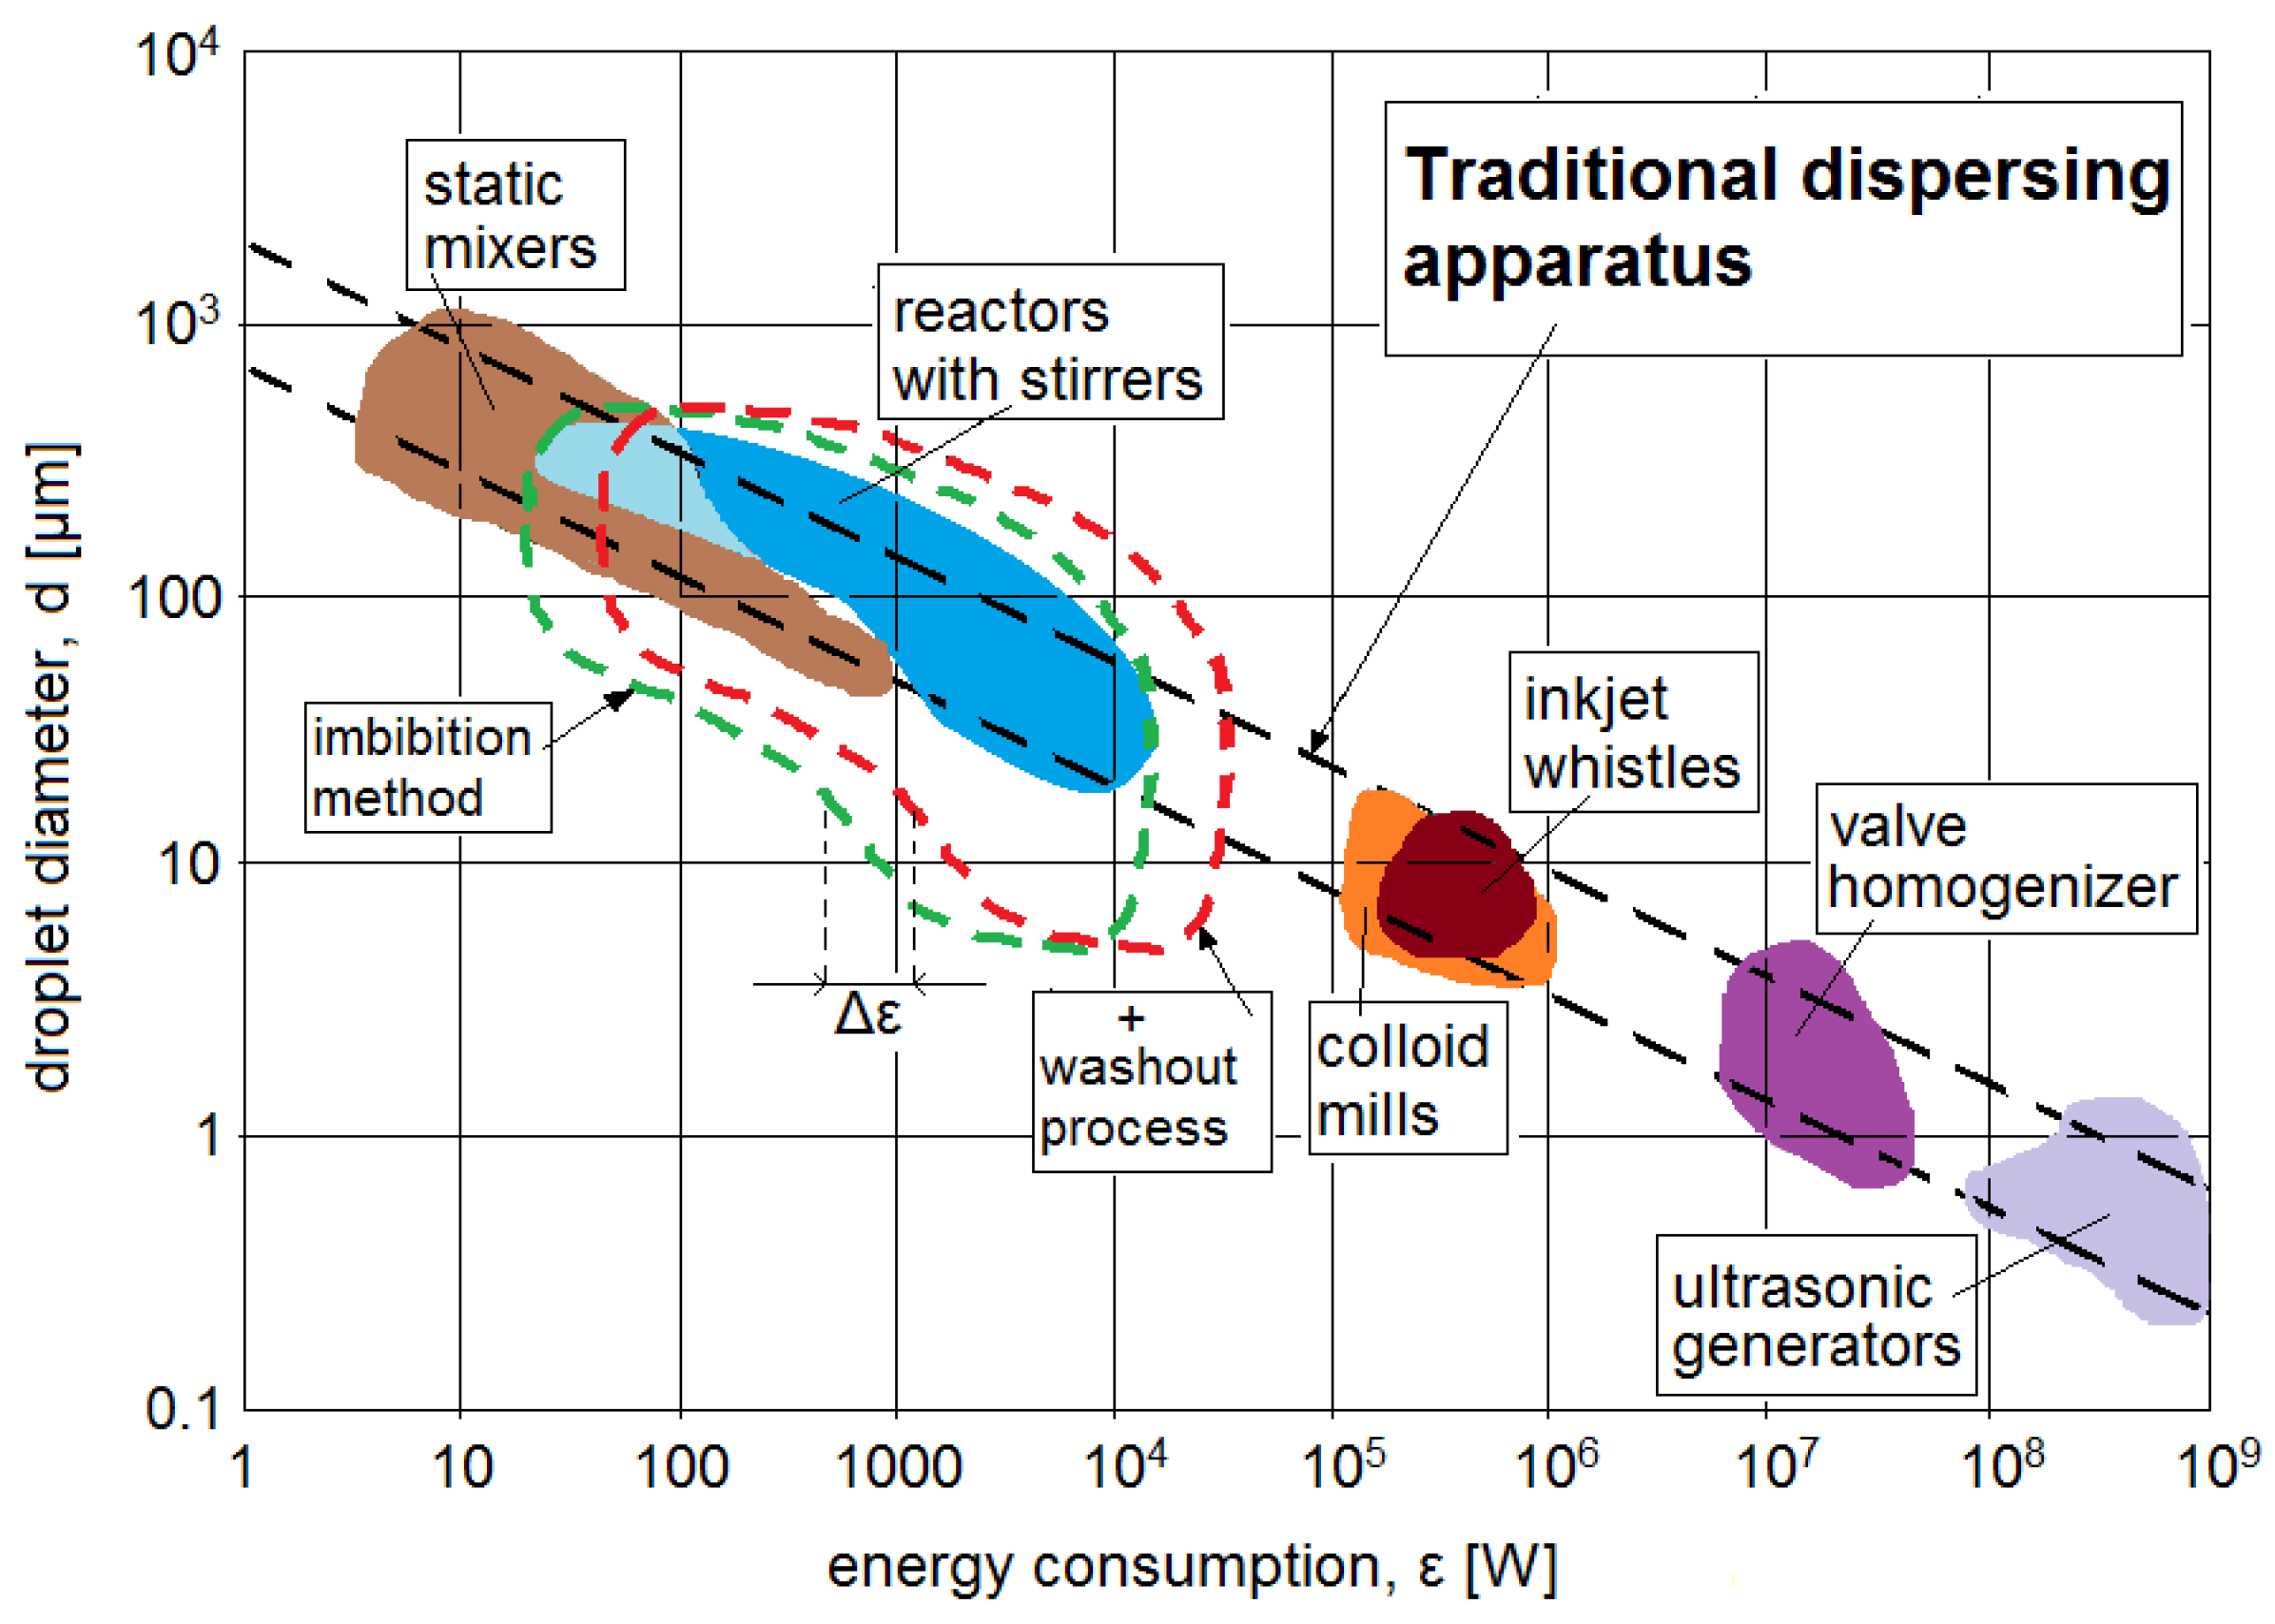
The main advantage of using such a method is energy saving. However, in order to present this advantage, this method was presented in the context of energy consumption of other traditionally used methods of emulsion formation. The data provided in the work [
46] were used. The authors of this work presented the energy consumption ε for each method in order to obtain emulsions with specific average droplet diameters, as shown graphically in
Figure 7. As the “reactor with stirrer” method was used to form the base emulsion, it was the method used as the starting point for comparison. Using the imbibition process allowed us to increase the range of average diameters obtained, so the area of utility of this base method increased. In
Figure 7, this is shown as an enlargement of the “reactor with stirrer” area in mainly the lower-diameter direction and gently in the higher-diameter direction. This area in the figure is represented by the area bounded by the green dashed line. Based on the results presented in this work, the emulsions obtained by the imbibition method had the smallest average diameters of oil droplets of the order of several micrometers and the largest average diameters of 10–15% larger than those of the base emulsion, hence such a scale of enlargement of the applicability range in
Figure 7. As a result of the increase in this applicability range using such energy inputs, it would be possible to obtain emulsions with droplet sizes that are possible to form using methods with energy requirements two orders larger (inkjet whistles, colloid mills).
However, the application of the imbibition method may generate some additional energy consumption due to the application of washout techniques. This may result in a shift in the applicability area of the method to the right—see the area marked by the red dashed curve in
Figure 7. The magnitude of this shift Δε will depend on the scale of the process and the washout methodology adapted to it. For a small laboratory scale, additional washout devices can be omitted (material should be left to washout spontaneously), in which case the Δε shift to the right will be zero. However, for larger scales, additional devices may be recommended to intensify the process. Various solutions are possible here, for example, the use of periodic or continuous mixing in the tanks using slow-speed stirrers. It is also possible to flush the material by passing liquids through it, i.e., to use gentle filtration. Each of these solutions obviously generates additional energy consumptions. An assessment of the energy consumption for each solution would require tests and calculations on a case-by-case basis and should be performed on an individual basis. However, even the use of low-speed mixing will always have a lower energy requirement than the use of, for example, inkjet whistles or colloid mills methods to obtain emulsions with the required small droplet diameter.
A certain limitation is that at high altitudes where the finest droplets occur, their concentration is also low. The resulting emulsion is dilute there. In order to obtain more concentrated emulsions, it would be necessary to use additional concentration increase techniques in this case. For a smaller-scale process, gravity drainage through microfilters can be used, while, at a larger scale, more efficient techniques would be required, which could further increase energy requirements.
The presented droplet segregation method was used to obtain emulsion systems for testing flows in capillary structures in other experimental works. Emulsions with the same parameters but different droplet distributions were needed. Using conventional mechanical energy emulsification techniques did not give good results, especially when one wanted to obtain very fine droplets. Using the proposed method, on the other hand, it was possible to obtain suitable emulsion systems.
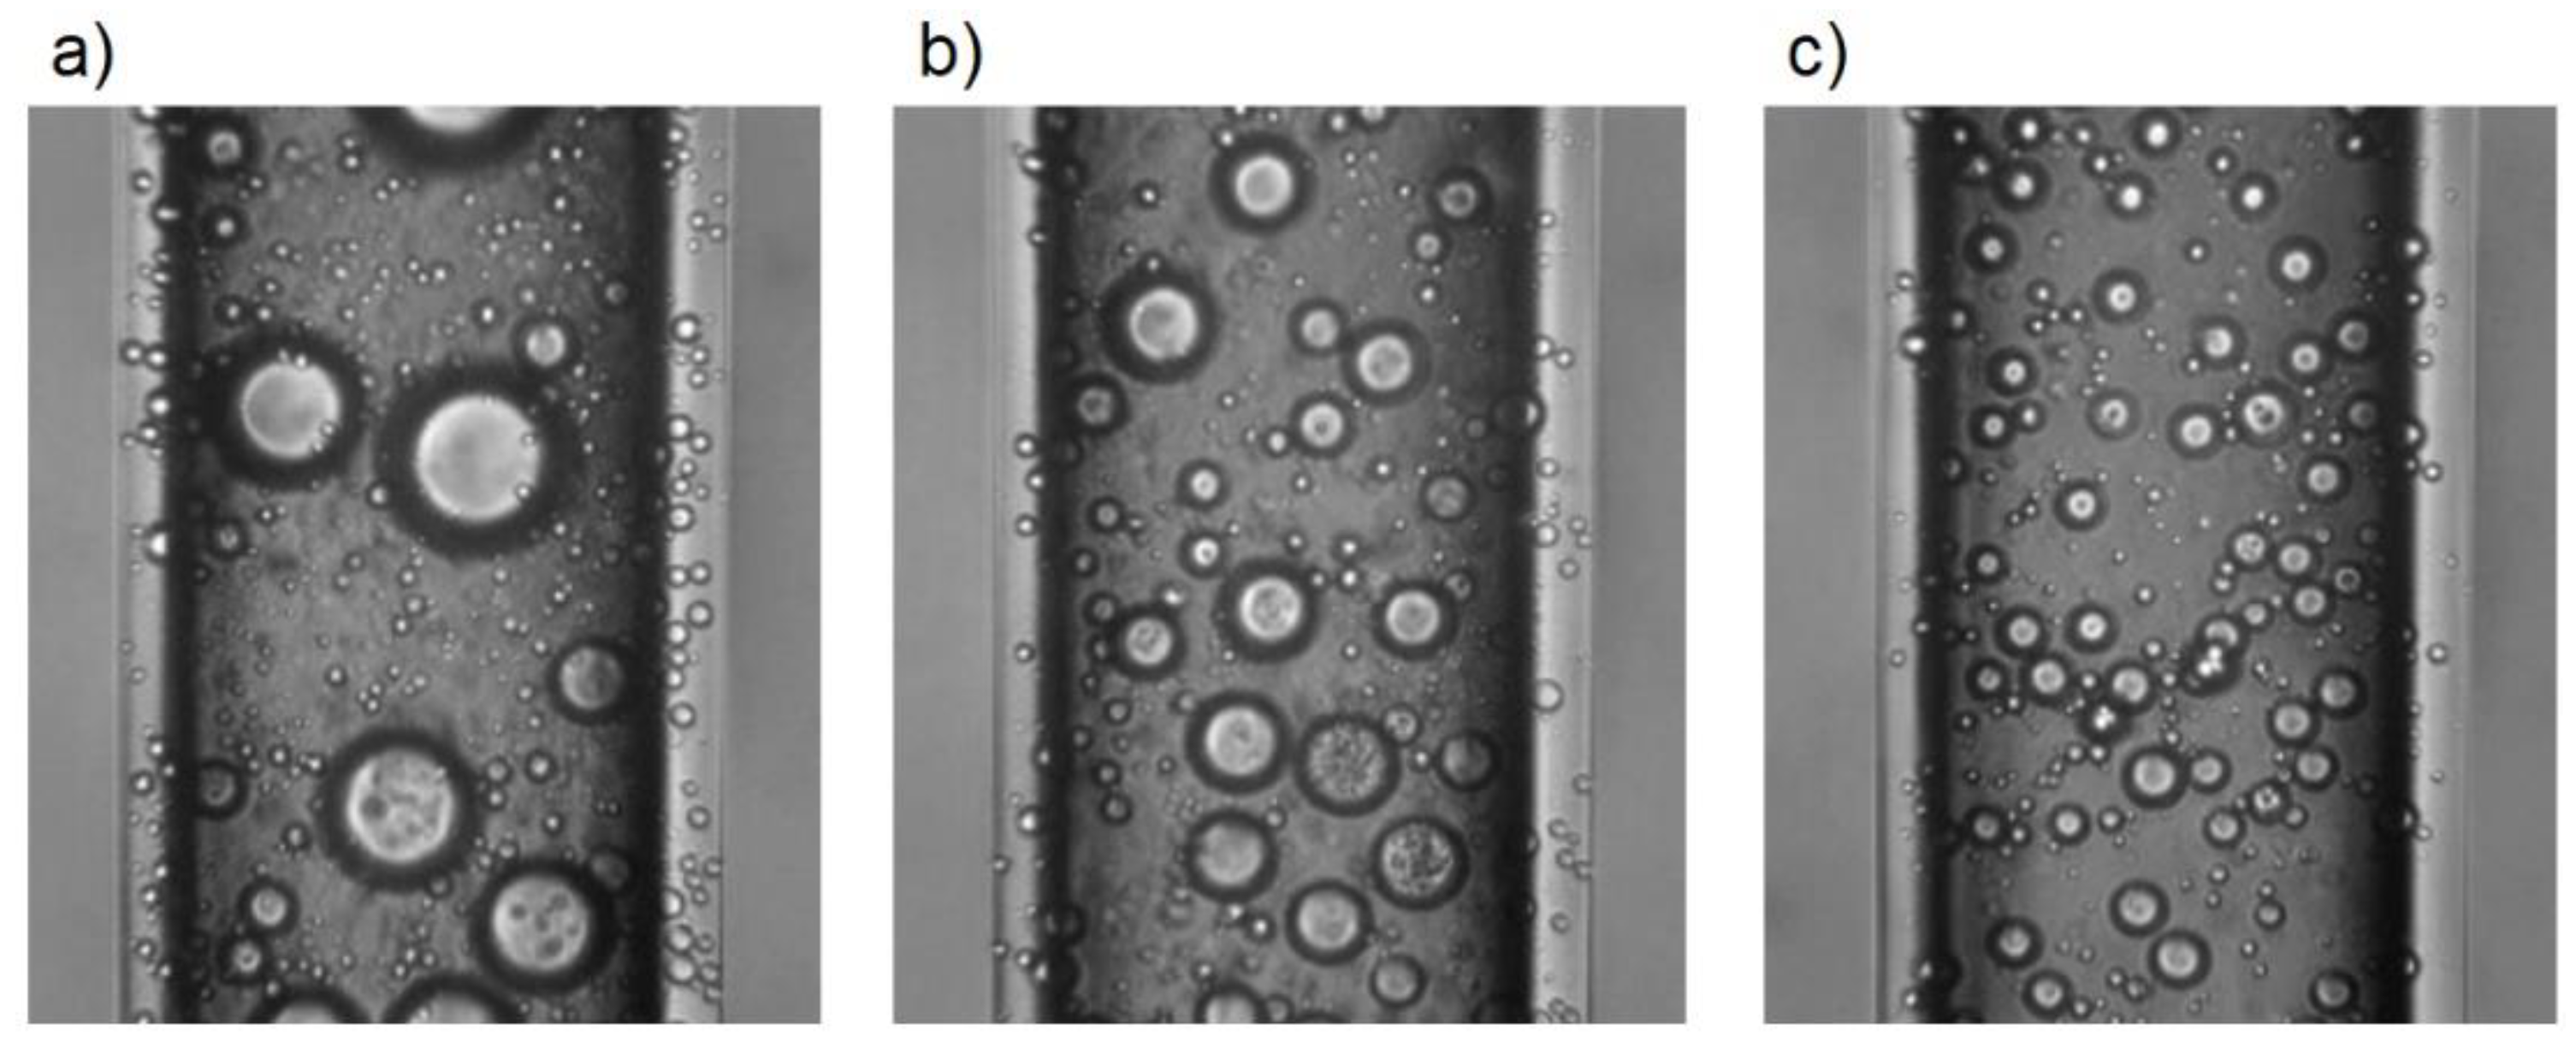
Figure 8 shows example microscopic images showing capillaries filled with emulsion systems obtained by the presented method.
Figure 8a refers to the emulsion extracted from the first fragment, where the droplet size was larger than in the emulsion produced by mixing.
Figure 8b refers to the emulsion obtained from the third fragment, while
Figure 8c refers to the mixture obtained from the last two fragments.
4. Conclusions
In this paper, we used the imbibition process in porous structures as a way to segregate oil emulsion droplets. A fibrous material was used as the porous structure. Emulsions of oil-in-water-type, in which vegetable oil or kerosene was the oil phase, were tested. Tests were conducted for emulsions with concentrations of 10, 30, and 50 vol%. After subjecting the emulsions to the process of imbibition into the fibrous material for 1800 s, the technique of the elution of emulsions from particular fragments of the material was applied. The washed-out liquid was analyzed to determine the droplet size distribution and concentration. This allowed us to determine how the emulsion structure (its size and concentration) changes with the height of imbibition. It was determined that the droplet size distribution became narrower and shifted toward smaller diameters with the height of the fragment from which the liquid was extracted. The exception was the distribution obtained for the fragment placed at the lowest height. There, the droplet size distribution was wider and shifted toward larger diameters in relation to the base emulsion distribution, in each analyzed case. For emulsions obtained from fragments located higher, a decrease in average diameters was observed. In the case of emulsions obtained from the highest situated fragments, the average droplet size was smaller by almost half in comparison to the base emulsion.
The imbibition process allows one to obtain emulsion systems with oil droplet average diameters about a half smaller than those for the emulsion before the process of segregation. The analysis proves the effectiveness of the imbibition process and obtaining systems with small droplet sizes without the need to use energy-consuming methods. This method may find a number of applications and may provide potential for the segregation of dispersive systems at smaller scales, where energy inputs are even greater. In addition, the obtained polydispersity decreased about 40% in relation to the initial system.
This method was used to create emulsions for the study of transport of dispersion systems in capillary systems. It allowed us to obtain emulsions with average droplet sizes significantly smaller than those created using mechanical homogenization methods. The purpose of this work was not to present a new full emulsion formation technique, but to indicate the potential of using spontaneous imbibition methods.


