1. Introduction
There is broad consensus of a strong need to increase the pace and scale of forest restoration in California to combat declining forest health conditions following a century of fire suppression and forest management practices that created overgrown and overcrowded forests [
1,
2,
3]. Widespread high-severity wildfire and insect-induced mortality have increased substantially, threatening California’s critical watersheds, carbon stores, recreation opportunities, and other ecosystem services the state’s forestlands provide [
4,
5].
With roughly half of the state’s forestland under federal management at 15.5 million acres total, the State of California and US Forest Service (USFS) jointly identified in August of 2020 a need to scale up forest restoration treatments on National Forests in California to one million acres per year by 2025, including thinning excessively dense stands, mechanical fuel reduction, prescribed fire, grazing, and reforestation [
5,
6]. This builds upon a series of executive actions taken by California Governors in recent years to combat widespread tree morality, wildfire, and forest management challenges [
3]. Similarly, the National Cohesive Wildland Fire Management Strategy identifies a need to restore and maintain landscapes, particularly fire-adapted landscapes under federal management, to reduce hazardous fuels in and around communities to lessen the risk of high-severity wildfire [
7]—this need for action, thus, extends outside of California to throughout the US West.
Restoration treatments that involve thinning and mechanical fuels reduction require removal of small-diameter trees and biomass material. However, this work is often expensive and uneconomical due to the unmerchantable nature of biomass material in traditional forest products markets, and the scale of restoration projects taking place is a fraction relative to the overall need [
2,
4]. Restoration activities, such as mechanical fuels reduction, in mixed conifer forests of the Sierra Nevada can cost anywhere from
$300 to
$1200 (or more) per acre, excluding administrative planning costs [
4]. Contractors view biomass removal as a net cost rather than a net benefit, resulting in biomass removal often being deemed as optional under standard USFS timber sale contracts. Without sufficient markets for biomass material, biomass material is often piled on site and, typically, burned later when air quality, moisture, and weather windows allow [
8].
The high costs of forest restoration and lack of markets for biomass therefore have posed major barriers to accomplishing mechanical fuels reduction treatments across the landscape at a pace and scale needed to achieve resiliency among California’s forested landscapes. Despite this challenge, a variety of opportunities have emerged to work toward breaking down these barriers and advancing treatments across the landscape, including implementation of USFS Stewardship Authority and development of community-scale wood utilization campuses in forested communities amongst California’s National Forests.
1.1. Using Integrated Harvesting and Stewardship Authority for Forest Restoration
Bundling removal of biomass with harvesting of sawlogs is a common method to cost effectively perform fuels reduction activities as the revenue can partially cover expenses associated with extracting biomass [
9]. This is referred to as integrated harvesting, where forest biomass is removed in a single-pass operation along with conventional forest products; the harvesting system to cut, skid, and deck biomass would be the same for both sawlogs and biomass trees—a feller buncher cuts and piles material, a skidder pulls the trees to the landing, where a loader or processor receives sawlogs and biomass and bucks or sorts them by value [
10].
In current wood products markets, and without state subsidy into the work or without high price premiums offered by local biomass energy facilities, integrated harvesting is one of the only ways to make removal of biomass be economically feasible [
9]. In fact, most biomass delivered to biomass plants from USFS land in California is produced in conjunction with sawtimber harvest, as biomass alone rarely pays its way out of the woods by itself [
11]. Both the technical literature and on-the-ground experience conclude integrated harvesting to be the most economically attractive option to accomplish thinning of small-diameter trees [
12,
13].
Integration of biomass harvesting into an active logging operation could reduce the cost of producing biomass by utilizing the equipment that is already on site for multiple products and minimize the amount of tree handling [
14]. For example, a logging operation that may have occurred regardless of biomass removal can absorb fixed costs for treatment, such as prep work and layout, mobilization of equipment, landing construction, road watering and road maintenance, fire safety equipment, and taxes.
An emerging opportunity to utilize integrated harvesting for removal of biomass on USFS lands is USFS Stewardship Authority and stewardship contracting [
15]. To balance high costs of restoration treatments, momentum is gaining among timber management officers in California to use Stewardship Authority for offering restoration work through stewardship or service contracts, especially following the USDA’s commitment to establishing shared stewardship agreements through its 2018 Shared Stewardship Investment Strategy [
16]. Stewardship contracts provide unique ways for federal agencies and community members to design, package, and offer innovative forest stewardship treatments [
17].
Stewardship contracts differ from traditional timber sales in that they allow for the trade of goods for services, and timber sales and service work can be combined in one contract package under the responsibility of one contractor. When the value of goods is greater than the cost of services, the revenue is maintained as “retained receipts” and can be into re-invested into future restoration projects within that national forest [
15]. Stewardship contracts can be long-term, with the 2018 Consolidated Appropriations Act allowing for contracts to be up to 20 years in length [
18].
While USFS Stewardship Authority, along with other authorities such as Good Neighbor Authority, is an important tool for performing forest restoration and fuels reduction activities on USFS land, whether markets for biomass and small-diameter trees exist locally plays a critical role in feasibility of restoration work. For example, the Lassen National Forest was able to sell projects with a biomass component of up to 25% of the total volume removed as of 2016 due to established biomass outlets at Burney Forest Power and Honey Lake Power. Conversely, the Shasta-Trinity National Forest, to the east, was unable to find buyer for sales that included biomass work. The Shasta-Trinity is therefore mostly pile burning their biomass material [
19].
Even if USFS includes a timber sale component to help with restoration and biomass removal costs, the value of these sawlogs might be insignificant relative to overall amount of low-value biomass material on the landscape, and subsequent costs of treatment and hauling [
9]. Furthermore, some areas of National Forest may not even contain enough merchantable timber to warrant an integrated sawtimber and biomass harvest. The existence of outlets for low-value biomass material, particularly biomass energy, therefore plays a critical role in ensuring success of increasing the pace and scale of restoration in California.
1.2. Biomass Energy Context in California
Biomass energy has long had a prominent role in California’s renewable energy portfolio, with close to 1000 MW of biomass power generating capacity in the state by the mid-1990s [
20]. A number of these facilities have had their power purchase contracts expire and not renewed in the late 2000s due to utilities switching to other renewable energy sources for their price advantages; thus, many biomass power plants sat idle following contract expiration [
20].
Following widespread tree mortality in the state, former California Governor Brown issued an emergency proclamation in 2015 requiring the California Public Utilities Commission to extend contracts on existing forest biomass electricity facilities provided they procure feedstock from CAL FIRE High Hazard Zones (areas of the state representing high risk for wildfire and falling trees following severe drought and bark beetle infestations) or sustainable forest management activities [
13,
21]. Contracts for seven biomass plants were therefore extended through the Bioenergy Renewable Auction Mechanism (BioRAM) program.
With the launch of BioRAM and the High Hazard Zone feedstock requirement, the price for delivered biomass fuel sourced from High Hazard Zones and sustainable forest management activities rose to almost
$60/bone dry ton (BDT) in 2018, on average. Prior to BioRAM, the average cost of delivered fuel was
$35.95/BDT [
13].
Without the High Hazard Zone feedstock requirement, biomass power facilities would likely be more inclined to purchase feedstock from less costly sources, such as sawmill residue or logging residue from more profitable timber harvesting activities on private land [
13]. This would result in less material being utilized from USFS land, further weakening the link between federal forest restoration and utilization of biomass by power plants.
Continued operation of BioRAM power facilities in California may support federal forest restoration initiatives on USFS land, but price offered by BioRAM biomass facilities for biomass can be volatile and there is no guarantee their contracts will be extended beyond the maximum total of 10 years. Additionally, there is little evidence to conclude that BioRAM facilities are utilizing feedstock directly from forest health projects on USFS land where fuels reduction is the primary objective. This poses the question of if BioRAM is an effective mechanism to cover the range of costs associated with forest restoration treatments aimed at promoting ecosystem health and resiliency to wildfire, especially on USFS land.
Another downside to counting on BioRAM facilities to serve as a primary outlet for biomass material is that facilities are generally in distant locales from supply sources, such as in Central Valley or Great Basin regions. For example, Honey Lake Power, located in Wendel, CA, is a primary outlet for biomass material from the Plumas National Forest, but harvest sites can be more than 60 miles (97 km) haul distance from the facility.
1.3. Community-Scale Biomass Energy and Wood Utilization Campuses
In order to couple biomass utilization with economic development in rural forested communities, many community groups in the Sierra are advancing community-scale integrated wood utilization campuses based in close proximity to potential restoration treatment areas, allowing for shorter haul distances and stronger local community benefit [
22] This effort was in part incentivized by creation of the Bioenergy Market Adjusting Tariff (BioMAT) program, established by California Senate Bill 1122 in 2012.
California Senate Bill 1122 requires California’s public utilities to procure a minimum of 250 MW of bioenergy annually from small-scale (3 MW or less), low emissions bioenergy facilities close to feedstock sources. A total of 50 MW must be procured from bioenergy facilities using byproducts of sustainable forest management, including material sourced from High Hazard Zones. However, it is well recognized that 3 MW is a challenging scale and that electricity sales alone are not enough to cover costs of generating energy, especially with market prices for biomass feedstock at
$40/BDT [
23]. Thus, most groups planning development of BioMAT facilities are advancing models of integrated product development to improve economics of small-scale power generation [
22].
At integrated product yards, contractors can haul logs, limbs, or other woody biomass material to be sorted based on the value-added stream to which it is dedicated to, generating a variety of products on-site. Examples of potential wood products businesses that can be integrated together include firewood, post and pole, and clean wood chips [
22]. Co-located businesses can also utilize low-grade waste heat from the bioenergy generation process, whether for kiln-drying wood products or for some other on-site heat need, improving the economics of electricity generation. With efficiencies gained through co-located business and improved electricity generation with waste-heat utilization, successfully developed campuses may be able to pay a higher premium for feedstock than the regional market [
24]. Furthermore, maintaining a biomass harvesting operation close to markets (or biomass energy facilities) reduces the total harvesting costs by improving system balance and reducing total haul distances [
25].
Development of wood utilization campuses in rural communities surrounded by USFS forestland also presents an important opportunity to promote rural economic development and create jobs for local communities still struggling to recover from the decline of the timber industry [
22]. Doing so at a community-scale (rather than industrial-scale and locating a campus in a more urban area) allows for local physical and human capital that are otherwise ideal to be revitalized and to generate stronger benefits to the local community directly [
26].
1.4. Biomass Removal: What Does It Really Cost?
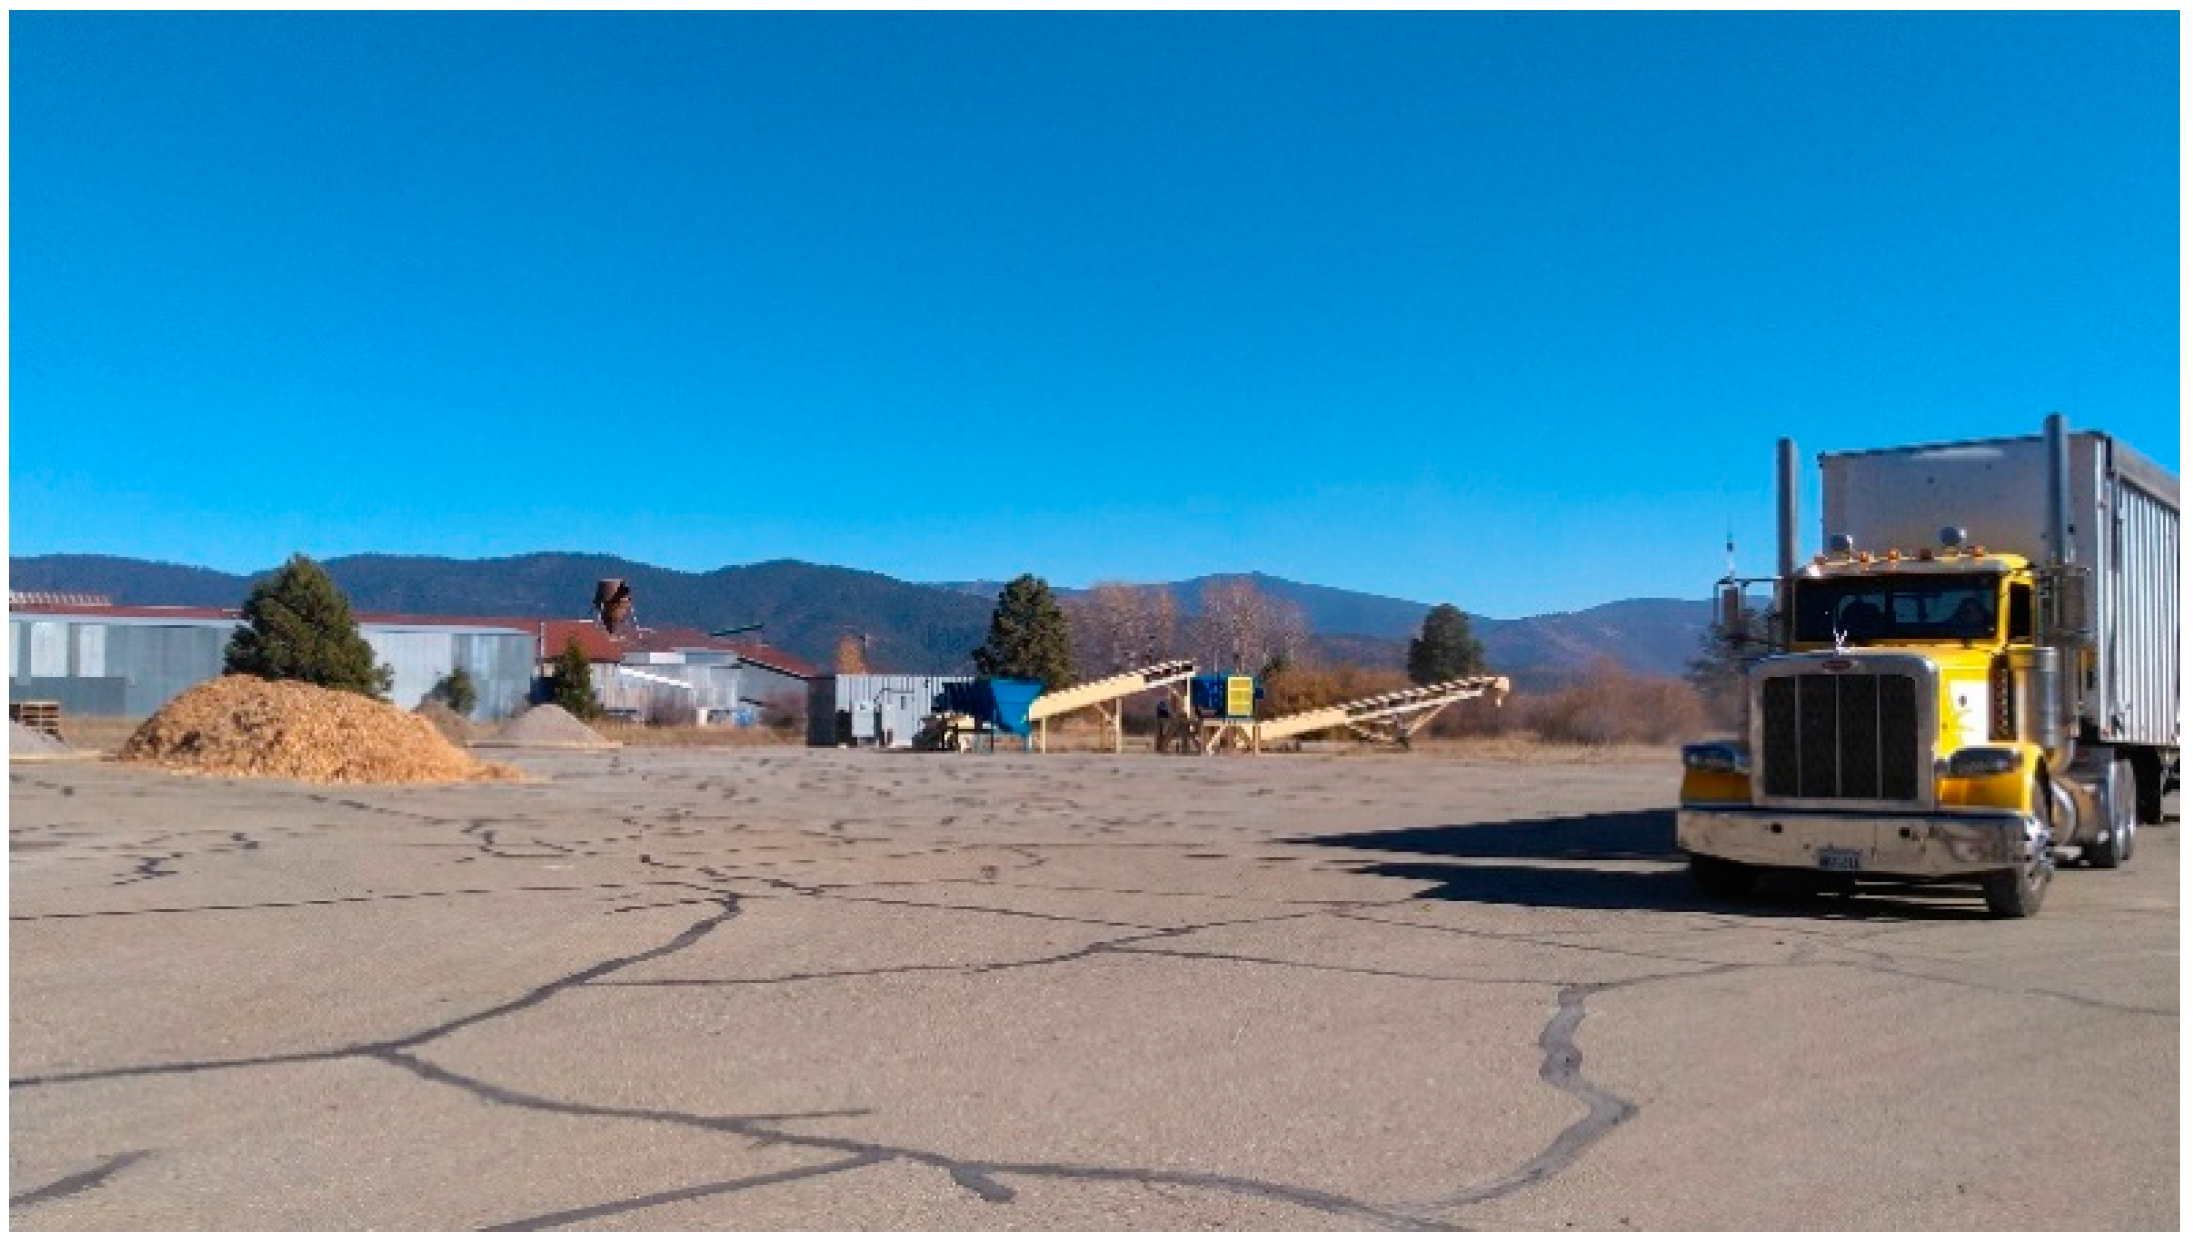
One example of an integrated product campus in California is the Crescent Mills Wood Products Campus (Crescent Mills Campus) based in Plumas County in the northern Sierra Nevada (see
Figure 1 and
Figure 2), developed and managed by a local non-profit organization [
22]. The campus’s purpose is to accept biomass material and generate value-added products for bioenergy, biomass heat, and other wood products. A 3 MW BioMAT facility is also planned for development on-site. With 75% of forestland in Plumas County under USFS management [
5], a primary goal of the Crescent Mills Campus is to incentivize increased forest restoration treatments on surrounding National Forest lands by developing a local market for restoration byproducts. However, a current question facing campus managers is what price the Crescent Mills Campus needs to pay for biomass to improve the economics of federal forest restoration locally, and to effectively incentivize increased restoration on the nearby National Forests.
There is no one-price-fits-all when it comes to harvesting, chipping, and hauling biomass to a power facility. Studies have estimated these costs using multiple biomass production categories, equipment technologies, harvesting objective, site conditions, and hauling distance to a biomass outlet [
9]. As a result, estimates in the literature for stump-to-truck costs to process and chip biomass into chip vans range anywhere from
$23.52/BDT to
$55.27/BDT, not including haul costs [
25,
27,
28,
29]. Furthermore, there are few studies that identify costs of removing biomass specifically from mixed-conifer forest stands of California under USFS management in the context of forest restoration and fuels reduction treatments [
27].
While a more all-encompassing effort to estimate the costs of forest restoration across the state could be helpful for informing groups working toward implementing statewide policy on advancing forest restoration, region-wide estimates do little to help a specific site, such as the Crescent Mills Campus, in its effort to understand how to adequately support federal forest restoration locally—thus, this study takes a case study and site-specific approach to quantify these costs.
The aim of this study is to quantify costs of federal forest restoration and biomass hauling within the northern Sierra region, and subsequently to determine adequate local market prices for biomass to ensure implementation of cost-effective forest restoration treatments. Specifically, it analyzes: (1) stump-to-truck costs for biomass harvesting, to better understand the cost to contractors to cut, skid, deck, chip, and haul biomass under three harvest scenarios for three harvest units; and (2) biomass haul distances, which impact the cost of raw material. This study is unique because no other studies have quantified forest restoration costs on USFS land based on harvesting systems utilized by local operators, a range of typical harvesting scenarios, and specific haul distances to nearby biomass facilities in this region as well as a comparison of haul costs between various facilities. Results can be implemented by the Crescent Mills Campus to directly support local efforts to increase the pace and scale of restoration work and increase utilization of woody biomass in the northern Sierra region. Results will also inform state and federal agency personnel and policy makers working to address the high costs of performing forest health activities on USFS land in California.
2. Materials and Methods
2.1. Harvest Unit Data and Prescription
US Forest Service staff provided harvest unit data in the form of cruise reports from three recent harvests on the Mount Hough Ranger District of the Plumas National Forest. Each harvest utilized some form of stewardship authority (such as Integrated Resource Service Contracts, Integrated Resource Timber Contracts, or Master Stewardship Agreement) where forest restoration and fuels reduction were primary management objectives. Forest type in this region is mixed-conifer, with predominant tree species consisting of ponderosa pine (Pinus ponderosa), sugar pine (Pinus lambertiana), Douglas-fir (Pseudotsuga menziesii), Jeffrey pine (Pinus jeffreyi), lodgepole pine (Pinus contorta), red fir (Abies magnifica), white fir (Abies concolor), and incense-cedar (Calocedrus decurrens).
Each harvest utilized certified silvicultural prescriptions that sought to restore stand structure to pre-European settlement conditions, either variability density thinning or thinning-from-below. Each harvest unit primarily involved removal of sawlogs, but also included removal of all biomass trees less than 10 inches (25.4 cm) in diameter at breast height (DBH), which are considered nonmerchantable in current sawlog markets. White fir (Abies concolor) is the primary biomass tree species removed for all three harvest sites.
Data on each harvest site is provided in
Table 1. Sites were selected based on date harvested (prioritizing most recent), silvicultural prescription (must be restoration or fuels reduction) type, and if the contract required biomass to be both removed and hauled away; all three harvest units involved biomass being hauled to the closest biomass power facility accepting material—either Honey Lake Power in Wendel, or Loyalton Biomass in Loyalton, both of which are operating under the BioRAM program. See
Figure 3 for a map of harvest site locations and biomass power facilities. This study focused on biomass removal only and does not include costs of harvesting sawlogs.
2.2. Harvesting System and Equipment
This project modeled each harvest unit under three harvesting scenarios to fully account for costs to cut, skid, deck, chip, and haul biomass in the Plumas National Forest area: (1) Integrated harvesting, where removal of timber/sawlogs is included in the project contract (Scenario 1); (2) Fuels reduction only-mechanized, where only biomass trees <10″ DBH are harvested and removed (Scenario 2); and (3) Fuels reduction only, hand-thin, same as Scenario 2, but biomass trees are hand-felled (Scenario 3).
Harvesting systems for integrated harvesting and fuels reduction-only scenarios are standard ground-based, mechanized, whole-tree harvesting systems, including: (1) a feller-buncher that fells and bunches sawlogs and biomass at the same time, placing them in separate piles along skid trails; (2) two rubber-tired grapple skidders to skid trees to landing; (3) a loader to sort and deck biomass, and then later used to load the chipper; and (4) a whole-tree drum chipper. For the hand-thin scenario, the feller-buncher is replaced by a ten-member hand crew using 36” bar chainsaws.
Harvesting machinery used in this study match what is used for standard ground-based harvesting by local operators in the Plumas National Forest area. Machine makes and models used in this study also loosely match that of local operators. All scenarios assume three sub-systems: (1) Cut: feller-buncher/chainsaw cuts independently, generally working several days in advance of subsequent logging machines; (2) Skid and deck: two skidders pull biomass to the landing, where a loader sorts and decks biomass (cold-decking); (3) Chipping, where a loader feeds biomass to the chipper, chipping directly into chip vans (standard 12.5 BDT holding capacity).
2.3. Hourly Machine Costs
This study estimated hourly machine costs measured in dollars per scheduled machine hour (
$/SMH) by using a standard machine rate calculation method developed by Miyata (1980) [
30]. Machine specifications and inputs were obtained from the literature (from studies utilizing similar machines), from Brinker et al., (2002) [
31], and from machine manufacturers and contractors directly. Specifications include price, horsepower, interest, insurance, taxes, fuel use rate, lube cost, maintenance and repair cost, and utilization rate (except for chipper). Wages and fringe benefit values were selected based off standard logging equipment operator wages from the Bureau of Labor Statistics. Machine specifications can be found in
Table 2.
Utilization rate for the chipper was calculated based on the amount of chipper down time as a product of haul distance and the number of chip vans in the harvesting fleet, with a maximum possible utilization rate of 70% to account for mechanical and operator delays [
32]. The same number of chip vans was applied for each haul destination (Crescent Mills vs. BioRAM facility) to adequately compare costs, based on how many chip vans are needed to maximize utilization rate when biomass is hauled to Crescent Mills, the closer destination (see
Table 3).
2.4. Machine Productivity Analysis
For each harvesting scenario under each harvest unit, system productivity of harvesting biomass trees in units of bone-dry tons per scheduled machine hour (BDT/SMH) is assessed. There are abundant machine cost and time and motion studies in the literature for whole-tree, ground-based harvesting systems; these time and motion studies develop predictive regression equations for individual machine productivity based on several operating variables. Following a literature review, predictive regression equations from existing studies were selected based on similarities to the harvesting scenarios, silvicultural prescriptions, and forest type of this study [
12,
25,
27,
33]. Predictive regression equations for each machine are listed in
Table 4. Inputs for each equation were derived from cruise data, and from assumptions about each harvest unit.
Productivity of the system in this analysis is broken into three primary processes: (1) cutting; (2) skidding and decking; and (3) chipping. The feller-buncher or hand-fallers (depending on the harvesting scenario) begin cutting several days in advance of subsequent logging operations, allowing them to work independent of subsequent systems. Biomass is then skid to the landing where it is decked until chipping operations can begin. Then, a chipper is brought to the landing where it chips biomass directly into chip trucks. This decoupling allows each system to work independent of the other’s productivity to achieve maximum efficiency and productivity during the harvest.
After the delay-free cycle time is obtained and converted to cycles per productive machine hour (PMH), each machine’s productivity is calculated by multiplying total cycles per PMH by the estimated number of biomass trees processed per each machine’s cycle and by the estimated number of BDT per tree (average BDT removed per acre and dividing it by the number of biomass trees per acre, per cruise reports). Machine productivity in BDT/SMH is calculated by multiplying BDT/PMH by the base utilization rate identified in
Table 2.
The utilization of each function is calculated as system productivity (BDT/SMH), or the bottleneck productivity of each system, divided by machine productivity in BDT/PMH, times number of machines. The utilization function is used to calculate operating costs (
$/SMH) for each machine based on the harvest scenario and harvest unit, instead of the utilization rates identified in
Table 2.
2.5. Biomass Transportation Cost Analysis
Harvesting and transportation costs ($/BDT) for each harvest unit were calculated based on location of the biomass facility—either Crescent Mills or the closest biomass power plant (Loyalton or Honey Lake Power). Haul costs include loading and unloading the chip van, and time travelled to harvest area to biomass power plant and back.
Total distance was obtained from the harvest unit to the biomass facility from Google Maps. Travel time on forest road type (dirt) was calculated based on estimated average truck speed and distance to pavement. Travel time from beginning of the pavement to biomass facility destination was derived from trip estimates on Google Maps, due to the variety of speed limits on roads along the way. For each haul, a 15% logging truck delay factor and 30-min for unloading were applied. Time to load chip van was calculated based on productivity of chipper in productive machine hours (BDT/PMH) and holding capacity of chip van (12.5 BDT), and added to the total time for one hauling cycle. Truck rates are assumed to be $110/hour, which is the typical contract rate offered for the Plumas County area.
2.6. Total Harvesting Costs
Hourly machine cost and system productivity were calculated for each harvest unit under each harvest scenario and biomass haul destination to determine: (1) Harvesting and processing cost (variable and fixed costs) per bone dry ton ($/BDT); (2) transportation cost, based on biomass destination (closest biomass facility or Crescent Mills) ($/BDT); (3) biomass delivered to facility cost ($/BDT), or the sum of the harvesting and hauling costs.
3. Results
3.1. Machine Costs and Productivity
Individual machine rates, productivity, and unit production costs assuming delivery to Crescent Mills are listed in
Table 5. As expected, machine productivity of using a chainsaw to fall trees is significantly less productive than a feller-buncher. On average over the three harvest units, a single chainsaw falls 0.79 BDT/SMH, whereas a feller-buncher produces 17.10 BDT/SMH. Furthermore, the chainsaw productivity assumes that felled trees are left as is and not hand-piled for skidder, so we can reasonably expect average cycle time for a skidder to increase in a hand-thinning operation, given time needed to grab biomass trees with its grapple. While the individual machine rate of a chainsaw is low relative to other machines, its low productivity results in chainsaws having the highest average unit production cost of
$42.19/BDT. The hand-thin scenario therefore assumed a crew of 10 working to fall trees to account for low individual machine productivity. Similarly, machine rate for a feller-buncher is high at
$155.45/SMH, but its high productivity allows for a relatively low unit production cost of
$9.30/BDT.
Skidding has the highest average cycle time, at 9.28 min to retrieve biomass piles and return to the landing, assuming an average skidding distance of 500 feet (152 m). Skidding has a slightly higher unit production cost than a feller-buncher, at $11.99/BDT. To improve overall system productivity, mechanized harvesting scenarios assumed use of two skidders in the system.
Machine rate, productivity, and unit production costs of the chipper are kept in a separate table (
Table 6) because chipper utilization rate is related to availability of chip vans [
32]. Availability of chip vans in this study is a product of haul distance from the landing to the biomass facility. Findings from this study show that longer haul distance results in more chipper down time as it waits for chip trucks to return, therefore lowering its utilization rate and increasing its unit production cost. Chipper utilization rate on average is 64% when Crescent Mills is the destination, compared to 32% when a BioRAM facility is the destination, assuming the same number of chip trucks in the fleet. Thus, hauling shorter distances is important in achieving maximum chipper utilization rate and productivity to keep unit production costs down (see
Table 6).
Even when additional chip vans were added to lessen the amount of chipper down time when biomass is hauled to a BioRAM facility, the overall cost to deliver biomass was still higher than if material is delivered to Crescent Mills.
3.2. Overall Harvesting System Costs
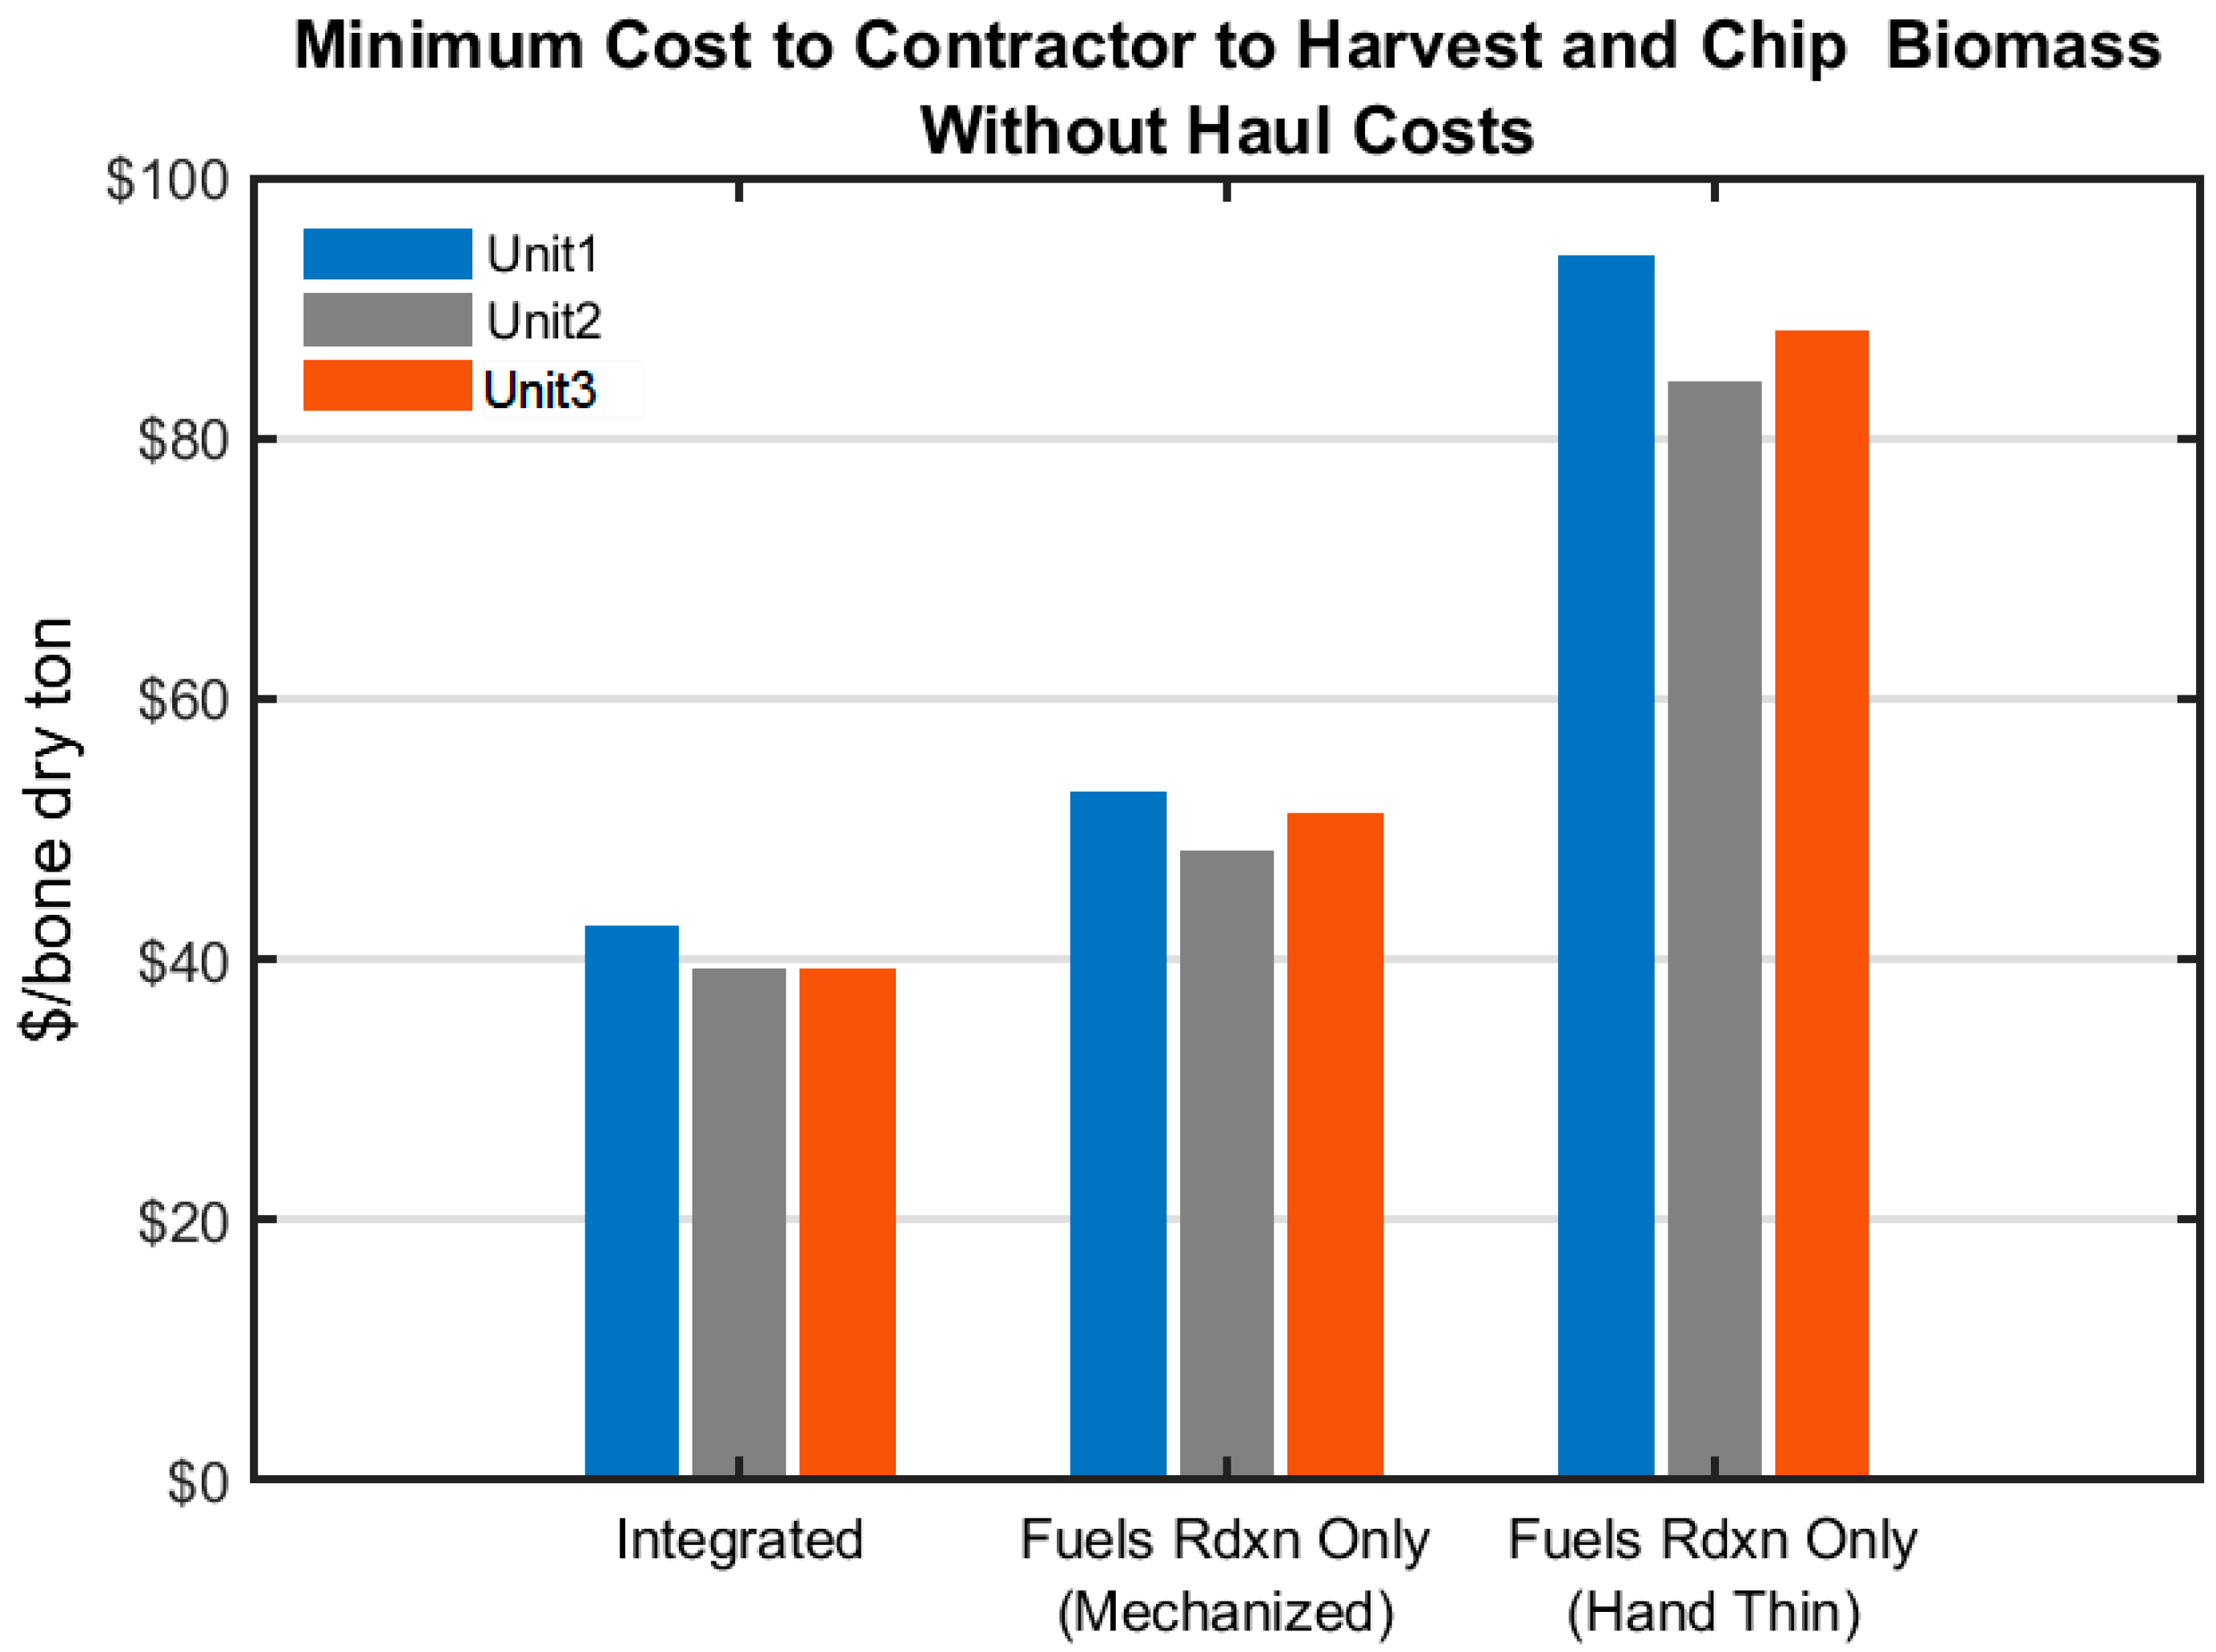
The range of costs to the contractor to harvest, chip, and haul biomass to Crescent Mills on a BDT basis is included in
Table 7. These values do not include contractor overhead, profit, or contingency, and they assume no subsidy from the USFS (which is typical under Integrated Resource Service Contracts where the contractor is paid per acre to cut and remove material). A breakdown of costs for each harvesting scenario is also provided in
Table 7.
Integrated harvesting allows for the lowest possible harvesting costs because fixed (or background) costs are absorbed by the sawlogs in the harvesting operation. Without sawlog removal as part of a contract, the biomass harvest must also account for these costs, which added
$9.16–
$11.97/BDT to the total unit production cost under Scenario 2 (Fuels Reduction Only-Mechanized). This is illustrated in
Figure 4.
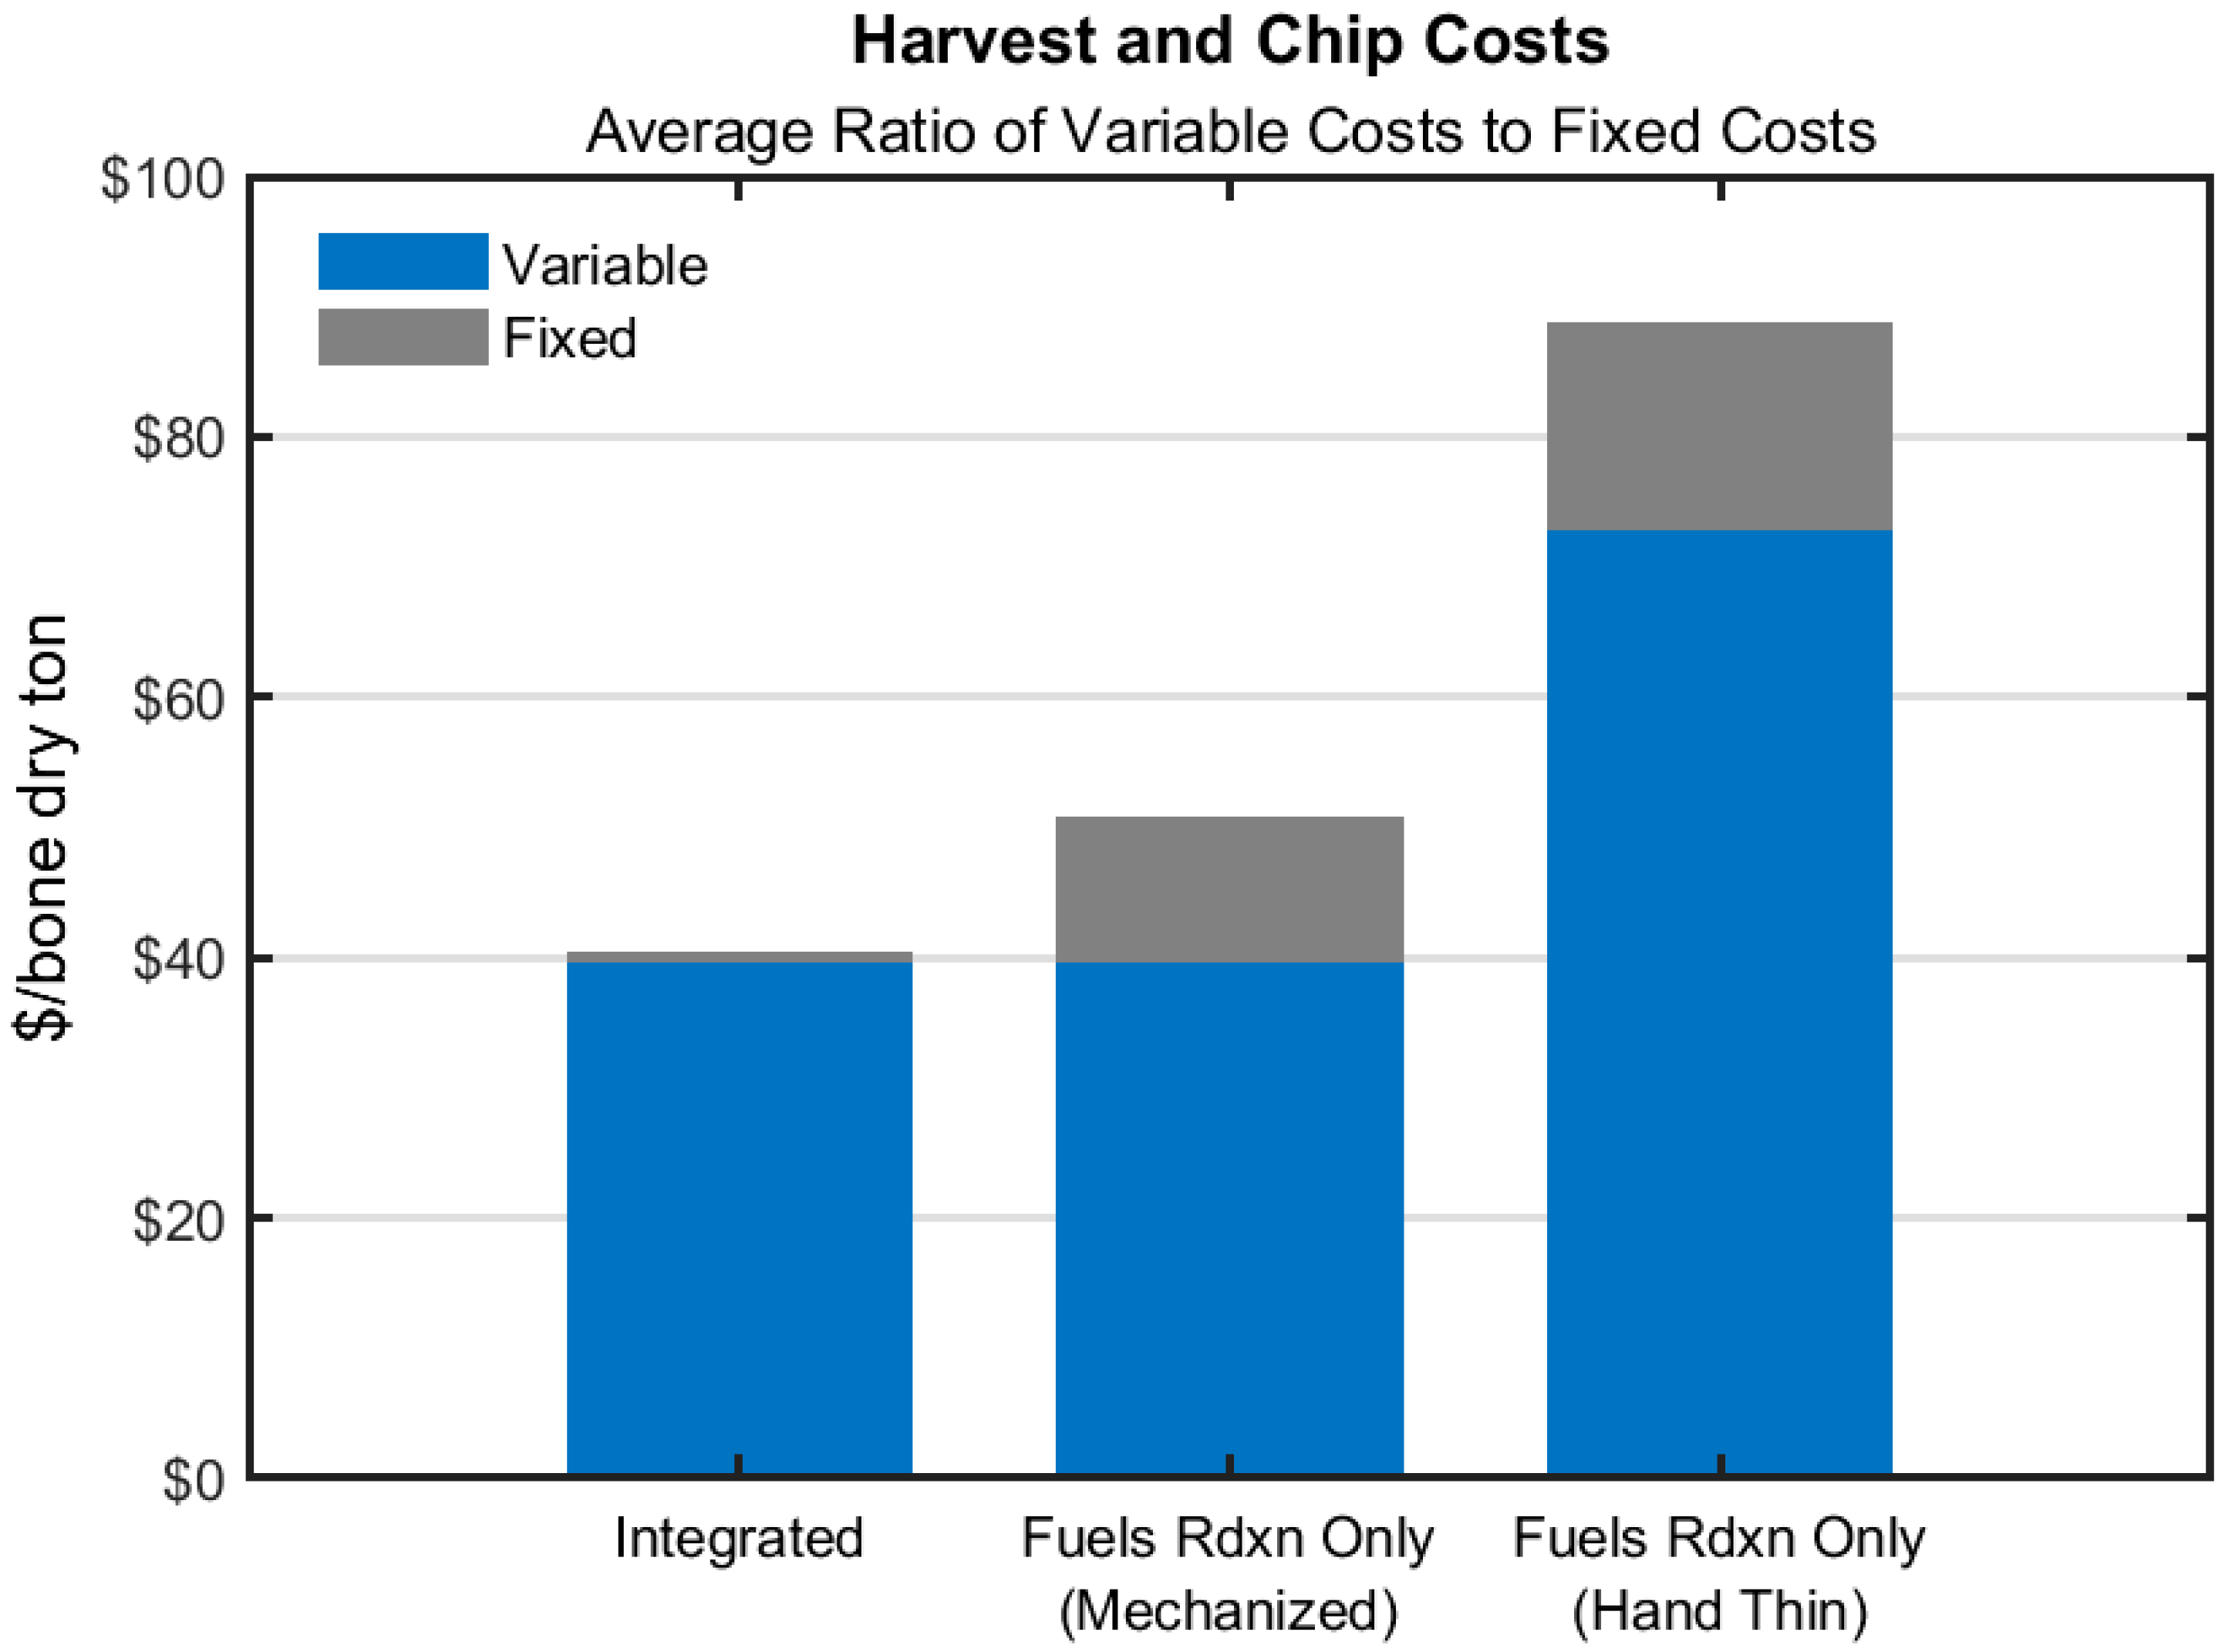
Fixed or background costs could include landing construction, road watering, unit layout, moving equipment in and out of the project site, moving equipment between landings, firefighting equipment, and other project on-site administrative tasks. These costs are typically budgeted for under the timber component of a contract as the stumpage value of logs can cover such costs—thus, if biomass is removed at the same time as sawlogs, it is in sort “snuck out”. Road construction costs were not included in this analysis and are assumed to be paid for by the USFS, but if road construction costs were to be the responsibility of the contractor, it is reasonable to conclude it would further increase the fixed costs under the Fuels Reduction Only scenarios—Scenario 2 and Scenario 3.
Figure 5 demonstrates ratio of variable costs to fixed costs under each harvesting scenario.
Otherwise, there is no change in variable costs between Integrated Harvesting and Fuels Reduction Only Mechanized scenarios since the rate of production does not change. This analysis does not model productivity changes in the feller-buncher if it is cutting both sawlogs and biomass versus biomass only, but the change in unit production costs should be minimal because regardless of if sawlogs are also cut, since each machine cycle is dedicated to only sawlogs or biomass. Costs can therefore be allocated to either sawlog or biomass removal functions depending on the type of work being performed [
10,
27].
Hand-thinning is, as expected, the most expensive harvesting system in this study—both variable and fixed costs per BDT are higher than Scenario 1 and Scenario 2. Hand-falling and use of a chainsaw drastically lowers the harvesting productivity and therefore increases the unit production costs (see
Table 5). As a result, the total time to complete the project increases, which stretches background costs such as road watering over a longer period of timing and adding costs.
3.3. Transportation Costs
The two primary outlets for biomass from the Plumas National Forest are Honey Lake Power in Wendel and Loyalton Biomass in Loyalton. These facilities are, on average, a 64-mile one-way haul from harvest units (see
Table 8). Conversely, the Crescent Mills site is on average a 16-mile one-way haul from harvest units. This difference in haul distance impacted total haul costs for biomass by a factor of 2, on average; the average
$/BDT to deliver to a BioRAM facility is
$40.32 (assuming round trip), whereas it is
$19.74/BDT to more nearby Crescent Mills. This finding is consistent with the Beck Group’s (2019) estimate for haul costs to biomass facility [
13]. The unit production costs to haul biomass to its destination are compared in
Table 8, and do not include any profit, overhead, or contingency to the contractor. These results make clear the cost benefit of hauling to local, community-scale wood utilization campuses in that they can reduce costs to the contractor to transport biomass.
3.4. Biomass Delivered to Facility Cost
The total delivered to facility cost for each harvesting scenario to either Crescent Mills or the closest BioRAM facility is displayed in
Figure 6. Results in
Figure 6 once again reiterate the benefit of hauling to biomass facilities close to the harvesting site. Under integrated harvesting scenarios, for example, biomass hauled to a distant BioRAM facility has haul costs that make up 42% to 45% of total delivered biomass costs, compared to a range of 26% to 36% when delivered to Crescent Mills. Furthermore, a longer haul distance also increases treatment costs by lowering the chipper utilization rates (as identified in
Table 6), therefore increasing the unit production cost of generating chipped biomass material.
4. Discussion
There are few studies in the scientific literature that quantify treatment and biomass haul costs for fuels reduction on mixed-conifer forest stands of California under USFS management, and this study sought to broaden knowledge in the literature of forest restoration costs in this context. Studies that do exist found stump-to-truck costs (without transportation) for biomass removal and processing to range anywhere from
$29.16/BDT to
$52.41/BDT [
25,
27,
28,
29]. Factors contributing to this range of costs primarily include silvicultural prescription and distance to biomass facility (as haul distance affects the chipper or grinder utilization rate due to wait time between chip hauls); all studies found system balancing, or reducing operational delays due to long wait times, to improve productivity of harvesting and lower production costs.
Findings from our study for treatment only costs in integrated harvesting systems fall within this range, at $39.15/BDT to $42.46/BDT. It is challenging to compare our findings for haul cost to previous studies because haul costs are dependent on distance from harvest sites to biomass facilities, which various from region to region. Thus, the costs for harvesting, processing, and hauling biomass are highly case specific, so this study uses a site- and case-specific approach to quantify these overall costs.
Benefits of this site- and case-specific study are that its results can be directly implemented to achieve realistic community benefits locally; in addition, locally-specific results could help in fostering buy-in and support from stakeholders in the surrounding community when implementing results. That said, this model and these results are site- and case-specific; the costs of harvesting, chipping, and hauling biomass can vary based on a wide variety of factors, including harvesting system, machine types, site conditions, silvicultural prescription, skidding distance, and haul distance to a facility [
25,
34]. Cost models rely on several specific assumptions, such as a consistent average skidding distance and that the estimates for total biomass in USFS cruise reports is accurate, so the actual cost of performing this work is only ever really realized by the contractor.
Some key takeaways from this study can still be applied more broadly, however, and are consistent with established literature. Together, they can be used to inform other efforts to increase utilization of biomass from USFS restoration projects across the state:
4.1. Higher Price Offerings Are Needed to Cost Effectively Obtain Supply from and Incentivize US Forest Service Restoration Projects
Increasing the pace and scale of forest restoration on federal land in California will require considerable investment since forest biomass lacks sufficient value in traditional forest products markets [
2,
8]. This study finds that on average, the cost to a contractor for harvesting, chipping, and hauling biomass to nearby Crescent Mills is at least
$55/BDT but can range up to
$118/BDT depending on the harvesting system or haul distance. It is reasonable to expect the higher costs in some instances, such as when sites are harder to access and hand crews are required due to sensitive species present, for example.
For comparison, the regional market in California for delivered biomass sourced from High Hazard Zones in 2018 was on average
$59/BDT, and that is on the high end relative to markets for biomass material sourced from more profitable timber harvests on private land or from sawmill residues [
13]. But even with more favorable prices offered, the delivery of biomass to a biomass power plant seldom pays for itself [
13]. Findings from this study make it clear that current market prices for biomass in California do not cover the high costs of harvesting, chipping, and hauling biomass under federal forest restoration projects.
Values identified in this study do not include any profit, overhead, or contingency to the contractor, so a price for delivered biomass to Crescent Mills must be higher than the values reported to ensure a consistent supply chain from local contractors. If an industry standard of 30% is added to account for profit, overhead, and a contingency, the resulting values range from
$71/BDT for Scenario 1 to upwards of
$153/BDT for Scenario 3 (see
Table 9), which exceeds the current market prices for delivered biomass in the northern Sierra.
If the BioMAT program and other integrated wood products campuses are to succeed in linking wood utilization with federal forest restoration, local markets for biomass must be robust and capable of offering higher price premiums than otherwise anticipated. However, the prices identified in
Table 9 are likely not viable to the business economics of small-scale wood utilization campuses, particularly if a BioMAT facility is planned as these systems are already challenged by poor economics related to the cost of energy production for a small-scale system—contract prices offered through BioMAT are not high enough to cover all costs of producing energy plus high feedstock costs [
23,
35].
Thus, results from this study make clear that a larger investment in the landscape is needed to ensure California can achieve the “one million acres per year” target identified by Region 5 of the USFS this past year. USFS stewardship contracts and subsidies can help pay for restoration and lower costs to the contractor, but funding for this work is limited as it is often funded by grants, such as by forest health grants from CAL FIRE or the Sierra Nevada Conservancy [
36]. CAL FIRE’s forest health grant programs are funded by the state’s California Climate Investment funds, which has not been renewed for the 2020/2021 funding cycle, therefore grant subsidies for biomass removal on federal land cannot always be counted on.
Beyond public or philanthropic funding to pay for forest restoration, another potential mechanism for investment is through payment for ecosystem services schemes. For California, such a scenario might involve downstream residents or beneficiaries of ecosystem services provided by a forest (such as water, carbon, air quality, or recreation) investing in continued provision of these services, therefore funding forest restoration [
37]. This sort of model has been implemented in Denver, Colorado, through the Forests to Faucet program, and in Santa Fe, New Mexico, through the Watershed Investment Program, both funded by local water agency’s or by water utility ratepayers [
38,
39]. The success of this model in other regions suggest that state officials and agencies should strongly consider implementing a similar model in California.
4.2. Integrated Harvesting Lowers Treatment Costs but Is Not Always Feasible
Ideally, biomass removal can be bundled with timber harvests so that the sawlog revenues can help offset some of the harvest costs. In fact, most biomass delivered to biomass plants from USFS land is produced in conjunction with sawtimber harvests [
13].
Figure 5 demonstrates that with integrated harvesting, fixed costs to implement a treatment, such as landing construction, road maintenance, or firefighting equipment, are avoided. This study does not account for biomass supply provided on-site in the form of residues from timber harvesting, such as tops and limbs remaining after a tree is bucked into logs to be sent to the mill—this residue material gets a “free ride” under whole tree logging systems, so it is reasonable to expect slightly improved economics of integrated harvesting.
When the union of existing forest stand conditions and management objectives permit, such integrated harvesting can be key to adequately increase the pace and scale of restoration treatments across National Forest System landscapes. This demonstrates the importance of advancing more widespread stewardship contracting or use of Stewardship Authority to implement projects that bundle fuels reduction with removal of sawlogs by the same contractor, allowing for integrated harvesting systems where both products are removed in a “single pass”. Such activities are often offered under Integrated Resource Timber Contracts (IRTCs), when the value of timber exceeds the value of service work, or Integrated Resource Service Contracts (IRSCs), when the value of service work exceeds the value of timber. Fortunately for the Crescent Mills Campus, the Plumas National Forest has the highest number of IRTC and IRSC contracts awarded among all National Forests in California, suggesting a higher potential for USFS subsidy to pay contractors to remove biomass, allowing Crescent Mills to pay on the lower range of estimated costs for feedstock [
40].
However, integrated harvesting may not always be feasible in all areas needing restoration treatments given stand conditions and management objectives (for example, an insufficient amount of merchantable sawtimber to help offset costs of biomass removal). Furthermore, integrated harvesting assumes the local sawmill is purchasing green logs from federal land and not just prioritizing timber from its own privately-owned land or from post-wildfire salvage projects. When integrated harvesting is not feasible, it should be expected that the Crescent Mills site and similar facilities in the region should pay in the $87–$153/BDT range to procure feedstock from USFS restoration activities, depending on the haul distance, harvesting system, and other site-specific conditions as explored previously.
4.3. Outlets Close to Biomass Supply Reduce Haul Costs and Production Costs
Haul distance can have a major influence on costs of delivered biomass, as demonstrated by this study (see
Figure 6). This study found that when hauling biomass to a more distant BioRAM facility, haul costs can account for up to 45% of the overall cost per unit (
$/bdt) to harvest, process, and deliver biomass to a facility. For some scenarios, the haul costs alone exceed what a facility will pay for delivered biomass.
Longer hauls to more distant locales for biomass facilities obviously results in increased transportation costs, but this study also demonstrates that it lowers productivity of harvesting and chipping in the woods as the chipper experiences more down time waiting for chip vans to return.
There are many studies that identify system imbalance due to trucking constraints to be the cause of higher production costs for chipping, due to a longer wait time between chip vans returning to the landing, therefore lowering the chipper utilization rate [
25,
27,
28,
29,
32,
34]. Results from this study are consistent with this notion—more down time for the chipper due to longer haul distances and a longer wait time for chip vans to return increased the unit production cost of chipping. The unit production cost of a chipper if chip vans are delivering biomass to Crescent Mills was on average
$9.24/BDT with a 64% utilization rate for the chipper, whereas if the same number of chip vans in a fleet are delivering to a more distant biomass facility, the chipper unit production cost is on average
$15.21/BDT with a 32% utilization rate. Sometimes this lowered productivity for long distance hauls can be addressed by adding additional chip vans to a fleet to reduce wait time, but this study also found that even with the addition of more chip vans, the cost to deliver biomass to a more distant biomass facility still exceeds that of a closer, local campus, such as Crescent Mills.
While improved schedule coordination efforts by the contractor can provide some opportunity to reduce delays and improve productivity in on-site operations [
34], a long-distance haul will still end up costing more than a shorter haul in the overall picture of what it costs to deliver biomass.
Figure 6 makes it clear that shorter haul distances to the Crescent Mills Campus versus a BioRAM facility reduce transportation costs by sometimes more than half.
With a more cost-efficient manner of disposing of biomass close to a harvest site, contractors may therefore be more inclined to bid on an “optional” biomass component of a timber sale, avoiding biomass remaining in a pile in the woods to be burned at a late date when moisture and air quality constraints allow. Local integrated wood products campuses close to harvest sites could therefore play an important role in reducing biomass haul costs, increased efficiencies of in-woods chipping, and therefore ensuring utilization of biomass from USFS restoration projects.
4.4. Local Wood Utilization Campuses Will Play a Key Role in Supporting Increased US Forest Service Restoration Work
Finally, local, community-scale wood utilization campuses will be important in supporting increased forest restoration in many areas given their central location close to supply. The Crescent Mills Campus, for example, is situated amongst a vast amount of USFS land, with some areas more than 70 miles (113 km) from the closest biomass power facility that accepts biomass material, making it an ideal alternative for disposing of biomass removed from the landscape under USFS restoration projects.
Development of community-scale wood utilization campuses also represents an opportunity to promote rural economic development in forested communities that are still struggling to recover from the decline of the timber industry [
22,
26]. Wood utilization campuses can therefore benefit both the local forestland and community, a refreshing approach that challenges the “jobs vs. environment” paradigm that is all too common in natural resource management.
5. Conclusions
This study quantified costs of federal forest restoration and biomass hauling in the Northern Sierra to identify an adequate local market price for biomass that can incentivize increased forest restoration in the northern Sierra region of California. No other studies have quantified regionally-specific forest restoration costs on USFS land based on harvesting systems utilized by local operators, a range of typical harvesting scenarios, and specific haul distances to nearby biomass facilities as well as a comparison of haul costs between various facilities.
Maximizing efficiency and productivity is integral to any commercial logging operation—it is in the logging contractors’ best interest to do so—and the literature offers ample opportunities for bringing unit production costs down. However, a few dollars of savings in unit production costs for harvesting and chipping biomass in the woods is trivial relative to the overall high costs of most forest restoration projects. This model for the Crescent Mills Campus suggests that the cost to a contractor to cut, skid, chip, and haul biomass in this region ranges anywhere from $55–$118/BDT, depending on the harvesting system and distance to the campus. Thus, the Crescent Mills Campus should anticipate paying, at the very least, $71/BDT for biomass to ensure material sourced from federal forest restoration projects makes its way to the site while considering necessary profit, overhead, and contingency to the contractor. Such a price for biomass is not feasible, however, for a sustainable biomass business operation, particularly if these campuses are planning on development of a small-scale biomass power facility through the BioMAT program. Most planned BioMAT facilities are already challenged by poor economics related to the cost of energy production for a small-scale system that purchasing feedstock at more than roughly $40/BDT will further challenge their financial feasibility—contract prices offered through BioMAT are not high enough to cover all costs of producing energy plus high feedstock costs.
In summary, the cost of harvesting, chipping, and hauling biomass (particularly in the absence of integrated harvesting) far exceeds the market prices for this material, and without proper investment in forest health, restoration work on USFS landscapes will not get done at a pace and scale that matches statewide or national goals. Thus, if California is to meet its goal of treating one million acres per year, additional payment mechanisms need to be developed to adequately pay for forest restoration activities. One potential investment mechanism is a payment for ecosystem services scheme where beneficiaries of forest ecosystem services pay for continued provision of these services—this model has been pursued in other regions of the West with successful results.
Lastly, results from this study that highlight the gap between costs of forest restoration and current market prices for delivered biomass suggest that local contractors should be further engaged in regional conversations about the need to increase the pace and scale of forest restoration on the landscape. If the treatment of one million acres per year by 2025 is to be achieved, those who will be performing this work across the landscape are a critical stakeholder group. Thus, involvement of local contractors and operators in forest collaborative groups and in more regional conversations on these issues will not only help close the gap between wood utilization and forest restoration, but also could be an avenue for fostering buy-in and allowing for local communities that are still struggling to recover from the timber industry’s decline to re-gain trust in federal forest management.
Author Contributions
Conceptualization, C.S., J.B., W.C.; formal analysis, C.S.; investigation, C.S.; methodology, C.S., W.C.; project administration, C.S.; supervision, J.B.; validation, W.C.; writing—original draft, C.S.; writing—review and editing, J.B., W.C. All authors have read and agreed to the published version of the manuscript.
Funding
This research received no external funding.
Institutional Review Board Statement
Not applicable.
Informed Consent Statement
Not applicable.
Data Availability Statement
For access to additional data and modeling used for this study, please contact the primary author.
Acknowledgments
The authors acknowledge work done by the Sierra Institute for Community and Environment as owners and developers of the Crescent Mills Wood Products Campus, a central focus of this research, and for contributions to previously released related reports that informed development of this research as well as general guidance by Jonathan Kusel and Kyle Rodgers. Mindy Crandall provided guidance as a graduate committee member to the primary author. Jared Pew, Zack Pew, Karl Baumann, and Austin Finster supported authors in ground-truthing inputs to the model used to estimate costs, and Geoff Newsted of Plumas National Forest provided cruise data for harvest sites used in this study.
Conflicts of Interest
The authors declare no conflict of interest.
References
- Little Hoover Commission Fire on the Mountain: Rethinking Forest Management in the Sierra Nevada; Report #242; Little Hoover Commission: Sacramento, CA, USA, 2018.
- Taylor, M. Improving California’s Forest and Watershed Management; California Legislative Analyst’s Office: Sacramento, CA, USA, 2018.
- Newsom, G. Executive Order N-05-19; State of California: Street Sacramento, CA, USA, 2019.
- North, M.; Collins, B.M.; Stephens, S. Using fire to increase the scale, benefits, and future maintenance of fuels treatments. J. For. 2012, 110, 392–401. [Google Scholar] [CrossRef]
- Christensen, G.A.; Waddell, K.L.; Stanton, S.M.; Kuegler, O. California’s Forest Resources: Forest Inventory and Analysis, 2001–2010 (General Technical Report PNW-GTR-913); US Department of Agriculture, Forest Service, Pacific Northwest Research Station: Portland, OR, USA, 2016.
- State of California. USDA Forest Service Pacific Southwest Region Agreement for Shared Stewardship of California’s Forest and Rangelands. Available online: https://www.gov.ca.gov/wp-content/uploads/2020/08/8.12.20-CA-Shared-Stewardship-MOU.pdf (accessed on 20 October 2020).
- Wildland Fire Leadership Council. The National Strategy: The Final Phase in the Development of the National Cohesive Wildland Fire Management Strategy; Wildland Fire Leadership Council: Washington, DC, USA, 2014.
- Cordery-Cotter, S. Biomass in the Sierra Nevada: A Case for Healthy Forests and Rural Economies; Sierra Business Council: Truckee, CA, USA, 2020. [Google Scholar]
- Lord, R.; Ehlen, C.; Stewart-Smith, D.; Martin, J.; Kellogg, L.; David, C.; Stidham, M.; Penner, M.; Bowyer, J. Biomass Energy and Biofuels from Oregon’s Forests; Prepared for the Oregon Forest Resources Institute, 2006. [Google Scholar]
- Puttock, G.D. Estimating cost for integrated harvesting and related forest management activities. Biomass Bioenergy 1995, 8, 73–79. [Google Scholar] [CrossRef]
- The Beck Group; Mason Bruce & Girard. High Hazard Fuels Availability Study; Prepared for The High Hazard Fuel Study Committee and PG&E Natural Resource Management Contract #C9333, 2019. [Google Scholar]
- Watson, W.F.; Sabo, R.F.; Stokes, B.J. Productivity of in-woods chippers processing understory biomass. In Proceedings of the 9th Annual Council on Forest Engineering Meeting, Mobile, Alabama, 29 September–2 October 1986. [Google Scholar]
- Aman, A.L.; Baker, S.A.; Greene, W.D. Productivity and Product Quality Measures for Chippers and Grinders on Operational Southern US Timber Harvests. Int. J. For. Eng. 2011, 22, 7–14. [Google Scholar] [CrossRef]
- Harrill, H.; Han, H.-S. Productivity and Cost of Integrated Harvesting of Wood Chips and Sawlogs in Stand Conversion Operations. Int. J. For. Res. 2012, 2012, 893079. [Google Scholar] [CrossRef]
- USDA Forest Service Stewardship Contracting: Basic Stewardship Contracting Concept. Available online: https://www.fs.fed.us/restoration/documents/stewardship/stewardship_brochure.pdf (accessed on 26 October 2020).
- USDA. Forest Service toward Shared Stewardship Across Landscapes: An Outcome-Based Investment Strategy; USDA: Washington, DC, USA, 2018.
- Shively, R.; Hardigg, K.; Plawecki, R. From Ideas to Action: A Guide to Funding and Authorities for Collaborative Forestry; Rural Voices for Conservation Coalition, 2017. [Google Scholar]
- Rural Voices for Conservation Coalition Omnibus Policy Update. 2018. Available online: https://www.ruralvoicescoalition.org/blog/2018/4/2/omnibus-policy-update (accessed on 26 October 2020).
- Fall River Resource Conservation District; TSS Consultants. Advancing Fuel Supply Agreements for the Burney-Hat Creek Bioenergy Project; McArthur, CA, USA, 2016. [Google Scholar]
- Tittmann, P. The wood in the forest: Why California needs to reexamine the role of biomass in climate policy. Calif. Agric. 2015, 69, 133–137. [Google Scholar] [CrossRef]
- Jacobson, E. Advice 4822-E: Submission of Protocol and Appendices for a Solicitation Using the Renewable Auction Mechanism Targeted at Facilities That Utilize Fuel from High Hazard Zones Pursuant to Resolution E-4770; Pacific Gas & Electric Company: San Francisco, CA, USA, 2016. [Google Scholar]
- Kusel, J.; Goulette, N.; Swezy, C. Economic Development and Wood Utilization in Rural California Communities: A Need and an Opportunity; Sierra Institute for Community and Environment: Taylorsville, CA, USA, 2017. [Google Scholar]
- Black & Veatch Small-Scale Bioenergy: Resource Potential, Costs, and Feed-in-Tariff Implementation Assessment; Prepared for the California Public Utilities Commission: Sacramento, CA, USA, 2013.
- Davis, E.J. Stewarding Forests and Communities: The Final Report of the Dry Forest Zone Project. 2014. Available online: http://hdl.handle.net/1794/19056 (accessed on 7 May 2021).
- Pan, F.; Han, H.S.; Johnson, L.R.; Elliot, W.J. Production and cost of harvesting, processing, and transporting small-diameter (≤5 inches) trees for energy. For. Prod. J. 2008, 58, 47–53. [Google Scholar]
- Crandall, M.S.; Adams, D.M.; Montgomery, C.A.; Smith, D. The potential rural development impacts of utilizing non-merchantable forest biomass. For. Policy Econ. 2017, 74, 20–29. [Google Scholar] [CrossRef]
- Vitorelo, B.; Han, H.S.; Elliot, W. Productivity and cost of integrated harvesting for fuel reduction thinning in mixed-conifer forest. For. Prod. J. 2011, 61, 664–674. [Google Scholar] [CrossRef]
- Bolding, M.C.; Kellogg, L.D.; Davis, C.T. Productivity and costs of an integrated mechanical forest fuel reduction operation in southwest Oregon. For. Prod. J. 2009, 59, 35–46. [Google Scholar]
- Anderson, N.; Chung, W.; Loeffler, D.; Jones, J.G. A productivity and cost comparison of two systems for producing biomass fuel from roadside forest treatment residues. For. Prod. J. 2012, 62, 222–233. [Google Scholar] [CrossRef]
- Miyata, E.S. Determining Fixed and Operating Costs of Logging Equipment; General Technical Report NC-55; USDA Forest Service: Washington, DC, USA, 1980.
- Brinker, R.W.; Kinard, J.; Rummer, R.; Lanford, B. Machine rates for selected forest harvesting machines. Circular 296 2002, 32. [Google Scholar]
- Spinelli, R.; Visser, R.J.M. Analyzing and estimating delays in wood chipping operations. Biomass Bioenergy 2009, 33, 429–433. [Google Scholar] [CrossRef]
- Han, S.K.; Han, H.S. Productivity and cost of whole-tree and tree-length harvesting in fuel reduction thinning treatments using cable yarding systems. For. Sci. Technol. 2020, 16, 41–48. [Google Scholar] [CrossRef]
- Conway, S. Logging Practices: Principles of Timber Harvesting Systems; Revised; Miller Freeman Publications, Inc.: San Francisco, CA, USA, 1976. [Google Scholar]
- The Beck Group. California Assessment of Wood Business Innovation Opportunities and Markets (CAWBIOM): Phase II Report; The Beck Group: Dallas, TX, USA, 2015. [Google Scholar]
- McCann, H. Paying for Forest Health Projects. Available online: https://www.ppic.org/blog/paying-for-forest-health-projects/ (accessed on 20 October 2020).
- Greenwalt, T.; McGrath, D. Protecting the City’s Water: Designing a Payment for Ecosystem Services Program. Nat. Resour. Environ. 2009, 24, 9–13. [Google Scholar]
- Denver Water Watershed Protection & Management. Available online: https://www.denverwater.org/your-water/water-supply-and-planning/watershed-protection-and-management (accessed on 2 December 2020).
- City of Santa Fe Municipal Watershed Plan. Available online: https://www.santafenm.gov/municipal_watershed_plan (accessed on 2 December 2020).
- Darlington, C.; Stevenson, C. An Overview of US Forest Service Contracting Practices in California: Produced for the California Forest Management Task Force; CLERE, Inc.: Rocklin, CA, USA, 2020. [Google Scholar]
Figure 1.
Biomass storage at the Crescent Mills Campus in Plumas County (photo credit: Sierra Institute for Community and Environment).
Figure 1.
Biomass storage at the Crescent Mills Campus in Plumas County (photo credit: Sierra Institute for Community and Environment).
Figure 2.
Map of Crescent Mills Campus in Northeastern California (photo credit: Sierra Institute for Community and Environment).
Figure 2.
Map of Crescent Mills Campus in Northeastern California (photo credit: Sierra Institute for Community and Environment).
Figure 3.
Harvest sites and eligible biomass power facilities around the Plumas National Forest in Northeastern California.
Figure 3.
Harvest sites and eligible biomass power facilities around the Plumas National Forest in Northeastern California.
Figure 4.
Comparison of treatment costs to harvest and chip biomass across scenarios for each harvest unit—haul costs are not included.
Figure 4.
Comparison of treatment costs to harvest and chip biomass across scenarios for each harvest unit—haul costs are not included.
Figure 5.
Comparison of the average ratio of variable costs to fixed costs for each harvesting scenario.
Figure 5.
Comparison of the average ratio of variable costs to fixed costs for each harvesting scenario.
Figure 6.
Changes in total costs of delivered biomass across scenarios and harvest units owing to biomass destination change from Crescent Mills to closest BiomRAM facility. S1, S2, and S3 represent Integrated Harvesting, Fuels Reduction Only (Mechanized), and Fuels Reduction Only (Hand Thin), respectively.
Table 1.
Harvest unit details for three projects in the Plumas National Forest used for this study.
Table 1.
Harvest unit details for three projects in the Plumas National Forest used for this study.
| Harvest Unit Number | Treatment Start Year | Total Project Acres | Silvicultural Prescription | Distance from Crescent Mills | Average DBH (inches) of Biomass Removed | Average Biomass Trees per Acre, Pre-harvest |
|---|
| Harvest Unit 1 | 2020 | 1278 | Variable density thinning | 21 mi
(33.8 km) | 6.5 (16.5 cm) | 140 |
| Harvest Unit 2 | 2020 | 1396 | Variable density thinning | 18 mi
(29.0 km) | 6.5 (16.5 cm) | 180 |
| Harvest Unit 3 | 2017 | 369 | Thin from below | 10 mi
(16.1 km) | 5 (12.7 cm) | 300 |
Table 2.
Machine types and specifications, based on machines used by local operators.
Table 2.
Machine types and specifications, based on machines used by local operators.
| Specification | Feller-Buncher | Chainsaw (for Hand-Thin Only) | Skidder | Loader | Chipper |
|---|
| Model | Tigercat LX 830D | Stihl 064 36” bar | John Deere 748H | Caterpillar 324D FM | Morbark 40/36 Whole Tree Chipper |
| Purchasing Price | $450,000.00 | $1200.00 | $250,000.00 | $280,000.00 | $450,000.00 |
| Horsepower (hp) | 330 | 6.4 | 193 | 188 | 700 |
| Salvage value (%) | 15% | 40% | 15% | 30% | 20% |
| Economic life (years) | 5 | 1.5 | 5 | 5 | 5 |
| SMH/year | 2000 | 2000 | 2000 | 2000 | 2000 |
| Interest rate (%) | 10% | 10% | 10% | 10% | 10% |
| Insurance (%) | 3% | 3% | 3% | 3% | 3% |
| Taxes (%) | 2% | 2% | 2% | 2% | 2% |
| Fuel cost ($/gallon) | 3 | 3 | 3 | 3 | 3 |
| Fuel use rate (gal/hp-hr) | 0.02633 | 0.0454 | 0.028 | 0.02166 | 0.028 |
| Lube cost (%) | 37% of fuel cost | 37% of fuel cost | 37% of fuel cost | 37% of fuel cost | 37% of fuel cost |
| Maint. & Repair (%) | 100% of depr. | 90% of depr. | 100% of depr. | 90% of depr. | 100% of depr. |
| Wages ($/SMH) | $22 | $22 | $22 | $22 | $0 |
| Fringe benefits (%) | 44% | 44% | 44% | 44% | 44% |
| Operator wage and benefit rate | 32 | 32 | 32 | 32 | * |
| Utilization rate (%) | 70% | 80% | 65% | 75% | ** |
Table 3.
Chipper utilization rates based on number of chip vans and biomass destination.
Table 3.
Chipper utilization rates based on number of chip vans and biomass destination.
| Harvest Unit Number | Destination | Distance to Facility (One-Way, Miles) | # of Chip Vans | Chipper Utilization Rate |
|---|
| Harvest Unit 1 | Crescent Mills | 21.0 (33.8 km) | 4 | 69% |
| Closest BioRAM | 52.1 (83.8 km) | 4 | 45% |
| Harvest Unit 2 | Crescent Mills | 18.1 (29.1 km) | 3 | 64% |
| Closest BioRAM | 68.0 (109.4 km) | 3 | 30% |
| Harvest Unit 3 | Crescent Mills | 9.8 (15.8 km) | 2 | 58% |
| Closest BioRAM | 73.0 (117.5 km) | 2 | 21% |
Table 4.
Predictive regression equations for each machine.
Table 4.
Predictive regression equations for each machine.
| Machine Type | Average Delay-Free Cycle Time (Centi-Min) or BDT/PMH for Chipper | Associated Study | Inputs Used |
|---|
| Feller-buncher | ln(DFCT) = 2.8623
+0.3817 × ln(distance to tree)
+0.0960 × ln(distance to bunch)
+0.3441 × ln(trees per cycle) | (Vitorelo, Han, and Elliot 2011) | Distance to tree (ft) | 10 |
| Distance to bunch (ft) | 8 |
| Trees per cycle | 5–7 |
| Skidder | DFCT = 35.28
+0.9841(travel empty distance)
+0.7559(travel loaded distance)
+Skidder size * | (Vitorelo, Han, and Elliot 2011) | Travel empty distance (ft) | 500 |
| Travel loaded distance (ft) | 500 |
| Skidder size | −22.37 |
| Loader | DFCT = 7.902
+0.062 × (number of trees per cycle)
+0.471 × (DBH in inches)
+0.159(swing to grinder degree)
+0.094 (swing back to pile degree) | (Pan et al. 2008) | Trees per cycle | 6 |
| DBH (in) | 5–6.5 |
| Swing to chipper degree | 81 |
| Swing to pile degree | 81 |
| Chipper | BDT/PMH = 22.7
+0.211(DBH in inches)^3 | (Watson, Sabo, and Stokes 1986) | DBH (in) | 5–6.5 |
| Chainsaw felling | =235.497
+0.070 (DBH in cm)^2
+6.340 (move to tree distance in meter)
−59.116 ln(slope in percent)
+78.082 (wedge) | (Han and Han 2020) | DBH (cm) | 12.7–16.51 |
| Move to tree distance (m) | 3.05 |
| Slope (%) | 10 |
| Wedge | 0 |
Table 5.
Average individual machine rates, cycle times, productivity, and unit production costs, if hauling to Crescent Mills. Individual machines only, not system wide.
Table 5.
Average individual machine rates, cycle times, productivity, and unit production costs, if hauling to Crescent Mills. Individual machines only, not system wide.
| Machine | Machine Rate ($/SMH) | Avg Cycle Time | Avg Machine Productivity (BDT/SMH) | Avg Unit Production Cost ($/BDT) |
|---|
| Seconds | Minutes |
|---|
| Feller-buncher | $155.45 | 55.92 | 0.93 | 17.10 | $9.30 |
| Chainsaw | $33.20 | 244.45 | 4.07 | 0.79 | $42.19 |
| Skidder | $100.99 | 556.59 | 9.28 | 8.46 | $11.99 |
| Loader * | $75.07 | 18.96 | 0.32 | 57.38 | $4.62 |
Table 6.
Average distance, utilization rate, machine rate, productivity, and unit production costs for chipper based on haul destination.
Table 6.
Average distance, utilization rate, machine rate, productivity, and unit production costs for chipper based on haul destination.
| Haul Destination | Distance to Facility (Miles, One-Way) | Utilization Rate | Machine Rate ($/SMH) | Machine Productivity (BDT/SMH) | Unit Production Cost ($/BDT) |
|---|
| Crescent Mills | 16.3 (26.2 km) | 64% | $146.26 | 15.83 | $9.31 |
| BioRAM Facility | 64.4 (103.6 km) | 32% | $120.49 | 7.92 | $16.61 |
Table 7.
Harvesting costs and other details under each harvesting.
Table 7.
Harvesting costs and other details under each harvesting.
| Type of Cost | Harvest Unit 1 | Harvest Unit 2 | Harvest Unit 3 |
|---|
| Scenario 1: Integrated Harvesting Costs: Delivery to Crescent Mills |
| Variable Cost $/BDT | $41.94 | $38.80 | $38.74 |
| Fixed Cost $/BDT | $0.52 | $0.35 | $0.41 |
| Treatment Only $/BDT (Cut, Skid, Deck, Chip) | $42.46 | $39.15 | $39.15 |
| Haul Cost $/BDT | $23.66 | $19.82 | $15.75 |
| Total Cost $/BDT Delivered to Crescent Mills | $66.13 | $58.96 | $54.91 |
| Total 10 Hour Days to Complete Project | 77 | 109 | 57 |
| Scenario 2: Fuels Reduction Only (Mechanized) Costs: Delivery to Crescent Mills |
| Variable Cost $/BDT | $41.94 | $38.80 | $38.74 |
| Fixed Cost $/BDT | $10.75 | $9.51 | $12.38 |
| Treatment Only $/BDT (Cut, Skid, Deck, Chip) | $52.69 | $48.31 | $51.12 |
| Haul Cost $/BDT | $23.66 | $19.82 | $15.75 |
| Total Cost $/BDT Delivered to Crescent Mills | $76.35 | $68.13 | $66.87 |
| Total 10 Hour Days to Complete Project | 77 | 109 | 57 |
| Scenario 3: Fuels Reduction Only (Hand-Thin) Costs: Delivery to Crescent Mills |
| Variable Cost $/BDT | $77.83 | $69.93 | $70.77 |
| Fixed Cost $/BDT | $16.03 | $14.34 | $17.29 |
| Treatment Only $/BDT (Cut, Skid, Deck, Chip) | $93.86 | $84.27 | $88.07 |
| Haul Cost $/BDT | $23.66 | $19.82 | $15.75 |
| Total Cost $/BDT Delivered to Crescent Mills | $117.52 | $104.09 | $103.82 |
| Total 10 Hour Days to Complete Project | 153 | 215 | 93 |
Table 8.
Comparison of haul costs between Crescent Mills and the closest BioRAM facility.
Table 8.
Comparison of haul costs between Crescent Mills and the closest BioRAM facility.
| Harvest Unit Number | Crescent Mills | Closest BioRAM Facility |
|---|
| $/BDT | Total One-Way
Distance (mi) | $/BDT | Total One-Way
Distance (mi) |
|---|
| Harvest Unit 1 | $23.66 | 21.0 (33.8 km) | $38.84 | 52.1 (83.8 km) |
| Harvest Unit 2 | $19.82 | 18.1 (29.1 km) | $38.71 | 68.0 (109.4 km) |
| Harvest Unit 3 | $15.75 | 9.8 (15.8 km) | $43.42 | 73.0 (117.5 km) |
| Average | $19.74 | 16.3 (26.2 km) | $40.32 | 64.4 (103.6 km) |
Table 9.
Potential prices for delivered biomass at Crescent Mills, including a 30% markup that considers contractor profit, overhead, and contingency.
Table 9.
Potential prices for delivered biomass at Crescent Mills, including a 30% markup that considers contractor profit, overhead, and contingency.
| Harvesting System | Low ($/BDT) | High ($/BDT) |
|---|
| Integrated | $71.38 | $85.96 |
| Fuels Reduction Only (Mechanized) | $86.94 | $99.26 |
| Fuels Reduction Only (Hand Thin) | $134.97 | $152.77 |
| Publisher’s Note: MDPI stays neutral with regard to jurisdictional claims in published maps and institutional affiliations. |
© 2021 by the authors. Licensee MDPI, Basel, Switzerland. This article is an open access article distributed under the terms and conditions of the Creative Commons Attribution (CC BY) license (https://creativecommons.org/licenses/by/4.0/).


