Abstract
In this paper, we present a mathematical model to predict the evolution of rock permeability depending on effective pressure during oil production. The model is based on the use of the results of well testing data from wells operating in the oil fields of the Perm–Solikamsk region in the north of the Volgo Ural oil and gas province. Dependences of the change in flow characteristics in the reservoir on the effective pressure were established. We performed a comparative assessment using permeability and effective pressure data that were normalized to dimensionless forms of k/ko and P/Po. The factors and their influence on the nature of the change in permeability from the reservoir pressure were determined. Depending on the type of rock, its composition, initial permeability, and bedding conditions, we determined the limits of variation of the constants in empirical equations describing the change in the permeability of rocks from the effective pressure. The mathematical model we developed enables the prediction of the change in permeability of rocks during oil production from reservoirs on the basis of reservoir properties such as initial permeability, initial reservoir pressure, average bedding depth, net-to-gross ratio, and initial effective rock pressure.
1. Introduction
Permeability is an important property of various media [1,2]. Great attention is given to permeability as a property of a medium by the oil and gas industry since it characterizes how efficiently hydrocarbons are extracted. During hydrocarbon production from stress-sensitive reservoirs, the flow properties of containing rocks may change [3]. One of the main reasons for the change in flow properties of a productive formation, and in particular, permeability, is a change in reservoir pressure, which entails a change in effective rock pressure (the difference between reservoir and lithostatic pressures) [4]. The investigation of the nature of the change in permeability with effective rock pressure is mainly carried out under laboratory conditions. During experiments, a rock sample (plug) is placed in a flooding rig and crimped with a cuff. The effective pressure is created by the difference between the confining pressure and the pressure of the fluid pumped through the plug. As a result of such experimental studies, many authors have revealed the nonlinear nature (decrease) of rock permeability depending on the effective pressure. A previous study [5] measured the permeability of sandstone samples with a diameter of 2.5 cm on a Klinkenberg permeameter-porimeter unit and obtained an exponential dependence of permeability on the effective rock pressure. As a result of studying the permeability of Hopeman sandstone with a change in effective pressure, the authors in [6] also obtained an exponential relationship. The exponential nature of the decrease in volumetric permeability of the Clashach sandstone samples (composed of 90% of quartz and 10% of feldspar) depending on the deformation and effective compressional pressure was revealed in [7]. An exponential dependence of permeability on effective rock pressure was also obtained in other previous experimental works [8,9,10,11,12,13].
As a result of laboratory studies in [14], a power law dependence of the permeability of sandstone and shale on the effective pressure was revealed. In [8], the change in the permeability of the Adamswiller, Fontainebleau, Berea, Rothbach, and Boise sandstones, with porosity ranging from 13.6% to 35% depending on the effective pressure, was measured according to a power function. In studies of limestone samples in [15,16], a power law dependence of permeability on the effective crimp pressure was also obtained. It was shown in [15] that with a decrease in effective pressure, permeability is not restored to its original values. To a much greater extent, the change in effective pressure affects the permeability of fractured clastic and carbonate reservoirs [17]. A power law dependence of permeability on effective pressure was obtained in clastic fractured sandstone in [18]. In the study of Xuzhou fractured mudstone samples with a diameter of 50 mm and a length of 100 mm, the authors of [19], using an electro-hydraulic test system with servo control MTS815.02, described the change in permeability from the effective pressure using the power law. When studying the samples of fractured granite Westerly and Chelmsford with porosity of up to 1.1%, the authors of [20] found a logarithmic dependence of rock permeability on effective pressure. Another logarithmic dependence was obtained in [21] when studying samples of low-permeability sandstone E-bei with a porosity of 2.4–10.9%. In experimental studies [22] of dense sandstone with porosity from 1.7% to 6.1%, and shale with porosity from 3.75% to 4.15%, it was found that with an increase in effective rock pressure, permeability decreased logarithmically.
Examining the studies mentioned above shows that empirical methods are widely used to model the change in the flow properties of rocks under the influence of effective pressures. The essence of empirical methods is to find the coefficients of the known equations. The following types of equations have been most widely used to describe the change in permeability with a change in effective pressure [5,6,7,8,9,10,11,12,13,14,15,16,17,18,19,20,21,22,23,24,25,26,27,28]:
- -
- Exponential:
- -
- Power law:
- -
- Logarithmic:
Dimensionless permeability in Equation (1) enables the estimation of how many times the flow characteristics change with a decrease or increase in reservoir pressure. However, in this method, it is necessary to accurately know the values of the initial pressure and permeability. Dimensionless permeability and pressure in (2) facilitate a comparison of results from laboratory studies of rock samples and data from wells producing oil from any reservoirs. Writing the equations of permeability versus the value of the applied load in the form of Equation (3) facilitates the clear description of results from laboratory tests when the permeability of the plug is determined in the initial period of creating a load under conditions close to atmospheric.
Despite the fact that today laboratory studies on core samples are the main source of data on the nature of change in rock permeability related to effective pressure, the determined experimental dependence only characterizes a certain interval (interlayer) in the payzone and the area in which a well (the origin of core material) is located. As a result, the accuracy of predicting changes in formation permeability during oil production decreases.
To obtain the dependence of permeability on effective pressure that could characterize a real productive formation and serve as a basis for predicting production dynamics, one would require production data obtained during tests in wells in addition to laboratory data on the core.
Previous approaches [29,30] used pressure build-up data for calibration with logging data and to determine the true permeability of rock. In [31], the authors used a neural network based on core and logging data from 254 wells, as well as analysis of 600 pressure build-up curves, and forecasted rock permeability in the formation. With the help of such approaches, it is possible to determine the formation permeability at the time of the study. However, predicting the formation permeability after a certain period of time, during which the reservoir has developed, requires further study.
The mathematical model presented in [32] is based on a modified power law model and enables the prediction of the change in the permeability of the rock when the effective pressure changes during hydrocarbon production. The model aimed to generate pressure build-up curves on the basis of the results of the core study that could be adjusted for the existing field data from well tests. However, this approach does not take into account the heterogeneity of the reservoir parameters and can introduce inaccuracies in the result when predicting permeability.
The authors in [33,34,35,36,37] also studied the change in fluid filtration in a reservoir as a result of changes in effective pressure and permeability, as well as how this was related with results of pressure build-ups. However, the study was also performed under ideal reservoir conditions. Under real conditions, heterogeneities of the reservoir affect the fluid flow. Therefore, to predict changes in permeability, in addition to using the known equations, it is necessary to take into account the influence of reservoir properties such as initial permeability, initial reservoir pressure, average bedding depth, net-to-gross ratio, and initial effective rock pressure, among others. For these purposes, together with the mentioned equations, it is worth using the correlation of the dependence of permeability on the effective pressure to reservoir properties.
It is also worth noting that in works [29,30,31,32,33,34,35,36,37], as in many other works, the main attention is paid to the study of changes in the pressure build-up curves of a stress-sensitive formation. These studies show how permeability changes from pressure in situ and the results of historical observations during production are not presented. There are few works devoted to the study of how the formation permeability changes from the effective pressure on the basis of results of well testing during production. Some information is contained in the works [38,39], but there it is mentioned in passing without attempts to disclose the mechanism, and even more so modeling. Therefore, in this paper, we propose a modified method to predict changes in the permeability of rocks in relation to changes in effective pressure during oil reservoir development. This problem is urgent for the oil fields of the Perm–Solikamsk region, because new small fields are being developed in this area, and during the initial period injection into the reservoir is not provided, which leads to reservoir pressure decreases and decreases in the permeability of the reservoirs, causing decreased well productivity and loss of oil. The late implementation of injection is due to the fact that during design, predicting changes in permeability is carried out using core studies, and as shown in [40], the results of these studies do not always correlate with real phenomena occurring in the reservoir. To maintain the productivity of wells, earlier drilling of injection wells is required, which requires additional assessment when designing a field development. In this regard, a more accurate assessment of the change in permeability with a decrease in reservoir pressure is required, which is what this work was devoted to. We planned to use the results of well testing (pressure transient analysis) of a certain stress-sensitive reservoir to formulate a mathematical model that could take into account its reservoir properties and heterogeneities, describe the change in the permeability of the whole reservoir from the perspective of effective pressure changes, and predict the change in permeability on stress-sensitive oil reservoirs with similar reservoir properties.
The rest of this paper is organized as follows: Section 2 describes the well testing data from several stress-sensitive reservoirs. In Section 3, field data are used for an analysis of the equations describing the nature of the change in permeability from the effective pressure. Section 4 provides a mathematical model for predicting rock permeability from effective pressure, and conclusions are provided in Section 5.
2. Field Well Testing Data
During hydrocarbon production, fluids flow from the formation to the well bottomhole. At a relatively large distance from the well, oil or gas moves horizontally in parallel with a uniform front throughout the homogeneous formation. Approaching the well bottomhole, the formation fluid flow lines begin to thicken, and the fluid velocity increases. The area around the well in which the greatest flow resistance occurs is called the bottomhole formation zone (BHFZ). Pressure drawdown in BHFZ forms a cone of depression and is described by a logarithmic law.
During hydrocarbon production, reservoir properties are subjected to various changes due to reservoir pressure decreases, changes in phase permeabilities, clogging, loss of organic and inorganic deposits, etc. The BHFZ is subjected to the greatest changes, which can vary between deterioration in the cases described above, and improvement when various well treatment technologies are implemented. Permeability of the formation far from the well is not subjected to such significant changes and is mainly caused by changes occurring in the formation such as rock deformation due to pressure decrease, gas release from oil, and flooding front displacement. The permeability of the whole formation is of greater interest since it ultimately determines the completeness of the extraction of hydrocarbons from the reservoir. Usually, for the change in permeability from a reservoir deformation to be assessed, the results of laboratory core studies are used; however, this method has a number of disadvantages, the main ones including incomplete reflection of reservoir heterogeneities and violation of the natural stress–strain state when extracting core from the well. In this regard, in order for reliable information on the change in reservoir permeability to be obtained, it is necessary to use well test data.
In this work, the dependence of permeability was determined on the basis of the analysis of the results of field well tests on the wells that exploit fields belonging to the Perm–Solikamsk region. Data from nine fields of the Perm–Solikamsk region were used in this work. Oil reservoirs of the fields have the same geological age and are confined to the deposits C1t, D3fm, C1bb, and C2b, and the occurrence depth is from 1700 to 2500 m. Within the selected fields, these formations are lithologically similar. The formations’ properties are shown in Table 1. We analyzed 2053 well tests carried out in the period from 1995 to 2018. Well tests through a string were carried out during the exploration period and after a short period of well operation. The tests of flowing wells were carried out by the methods of steady-state flow. The pressure and level build-up curves were recorded in the non-flowing wells.

Table 1.
Reservoir properties of the considered Perm–Solikamsk region fields.
The data that were used for the analysis are the results of well tests carried out immediately after well drilling, in the initial period of well operation, and after some time. To identify the true dependence of permeability on effective pressure, we excluded factors that also affect the permeability of the formation. These factors include a decrease in the phase permeability of oil, as well as the fallout of organic and inorganic sediments in the form of salts and paraffins. A decrease in phase permeability occurs when oil flows together with another fluid such as gas or water. Gas in the formation can be presented in a free state or can dissolved in oil. If the gas is in a free state in the form of a gas cap, then the decrease in the pore pressure leads to gas penetration into the oil-saturated formation, reducing oil permeability. If gas is fully dissolved in oil, the pore pressure decreases below the bubble point, leading to gaseous release of oil. To exclude this factor, we needed to select well test data where reservoir pressure did not fall below the bubble point pressure. Another factor that reduces oil permeability is the water saturation of the formation. In this case, it is necessary to comply with the condition that the water cut should not exceed 5%, which means that the well must receive the same fluid as in the initial period of the well operation.
Within one formation of a field, the geological conditions of bedding (permeability, reservoir pressure, depth of occurrence) can vary significantly. For this factor to be taken into account, it is necessary to use data on the relative change in permeability [41,42]. For the analysis, the data of permeability and effective pressures were normalized to dimensionless forms of k/ko and P/Po, where ko is initial reservoir permeability; Po is initial effective pressure; and k and P are permeability and effective pressure determined during well testing, respectively.
The effective pressure (P) was calculated as the difference between overburden pressure and reservoir pressure:
Overburden (lithostatic) pressure (Pc) was calculated as the pressure exerted on the formation due to the weight of the overlying rocks:
where the average density of overlying rocks is ρ ≈ 2500 kg/m3 and h is the depth of the formation top.
Reservoir (pore) pressure Pf is the fluid pressure in the pores of the reservoir. It is known that rocks with different porosities have different compressibility, and their permeability changes in different ways [43,44]. For this factor to be taken into account, the permeability and porosity of the formation in the vicinity of the wells under consideration should be the same. Here, this issue was solved in one of two ways. First, the wells were located in close proximity to each other, and therefore the properties of the formation were approximately the same. Second, for wells that were not close to each other, it was considered sufficient that the properties of the formation in the vicinity of the well were approximately the same. The analysis used data from well tests that were located both in close proximity to each other and in different parts of the field (see Figure 1 and Figure 2). Figure 1 shows that the wells from which the dependence of the permeability on the effective pressure was obtained were located next to each other. This allowed us to conclude that the reservoir properties for the wells under consideration were approximately the same. The change in reservoir pressure occurred in the same way since the wells had a common external supply boundary. Figure 2 shows the wells located at a considerable distance from each other. The change in permeability during oil production for these wells was also the same, as the reservoir properties for the wells under consideration were approximately the same. This fact suggests that the location of the wells in the reservoir does not matter. The most important conditions are that the reservoir properties in the vicinity of the wells are the same, the reservoir pressure during the period under consideration did not fall below the bubble point pressure, and the water cut did not exceed 5%.
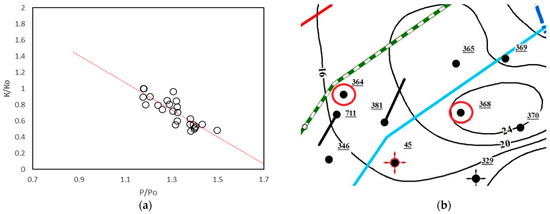
Figure 1.
Dependence of variation of dimensionless permeability on dimensionless effective pressure obtained from the data of well tests (a) and the layout of wells 364 and 368 at one of the Perm–Solikamsk region fields, reservoir C1bb (b).
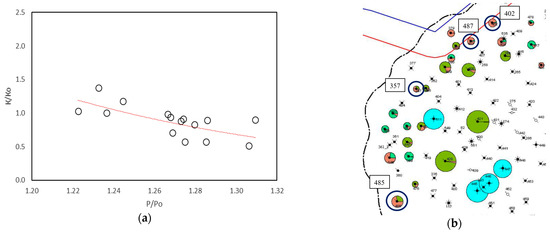
Figure 2.
The dependence of variation in dimensionless permeability on dimensionless effective pressure, obtained from the data of well testing (a) and layout (b) of wells 357, 402, 485, and 487 at one of the Perm–Solikamsk region fields, formation C1t-D3fm.
3. Analysis of Field Well Testing Data
By approximating the results of well tests in MATLAB software, we obtained the dependence of permeability on the effective pressure (Figure 3). To establish the laws of permeability variation, we built the curves with best fit (single and double exponential fitted curves, single and double power law fitted curves, and single and double logarithm fitted curves). On the basis of a graphical assessment of the probability of permeability behavior, when the effective pressure changed the double exponential, we excluded double power law and double logarithm fitted curves from further analysis, since in some cases the curves of these equations contradicted generally accepted laws. For instance, Figure 4c shows that the permeability increased as the relative effective pressure reduced, but in Figure 4f it is shown that the permeability increased with the relative effective pressure. Therefore, out of the best fitted curves, we only retained those that did not contradict the generally accepted laws of change in permeability from effective pressure, which are described by the following equations:
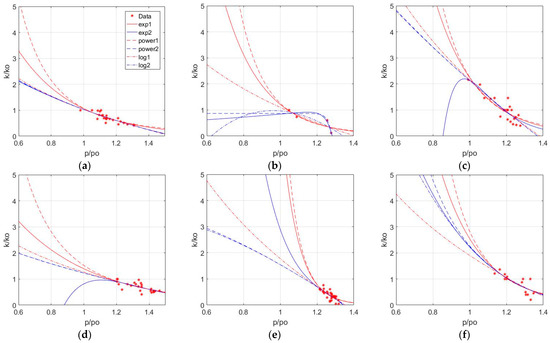
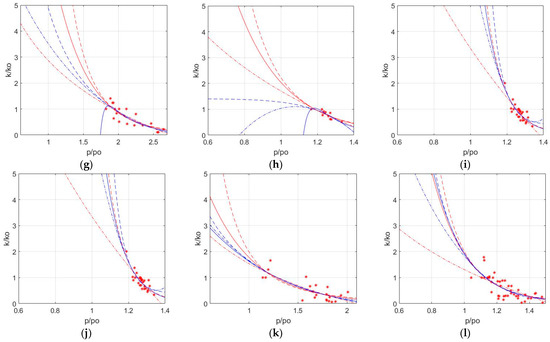
Figure 3.
Results of approximation of test data from wells in the Perm–Solikamsk fields. Field number (formation): (a) 1 (C1bb); (b) 2 (C1bb); (c) 3 (C1bb); (d) 4 UK (C1bb); (e) 4 PK (C1bb); (f) 5 (C1bb); (g) 6 (C1bb); (h) 1 (C1t-D3fm); (i) 3 (C1t-D3fm); (j) 4 (C1t-D3fm); (k) 5 (C1t-D3fm); (l) 3 (C2b). Data—field well tests data; exp1 and exp2—single and double exponential fitted curves, respectively; power1 and power2—single and double power law fitted curves, respectively; log1 and log2—single and double logarithm fitted curves, respectively.
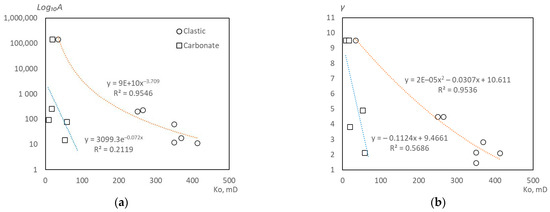
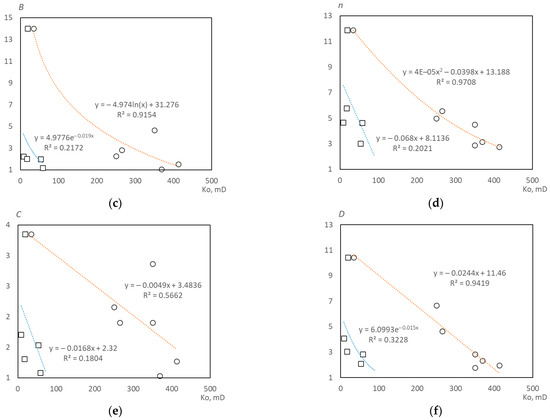
Figure 4.
Dependences of coefficients A (a), B (c), C (e), D (f) exponents γ (b), n (d) of Equations (6)–(8) on the initial permeability of the rocks of the Perm–Solikamsk region fields. Clastic rock—formation C1bb; carbonate rock—C1t-D3fm and C2b formations.
Exponential:
Power:
Logarithmic:
where γ and n stand for indicators of exponential and power functions, respectively, characterizing the intensity of permeability reduction from pressure changes, and A, B, C, and D are constants.
The analysis of the results obtained showed that Equations (6)–(8) describe with sufficient accuracy the dependence of permeability on effective pressure. However, since the calculated coefficients and parameters of the equations are individual for each reservoir and do not fully reflect the characteristics of the reservoirs and reservoir fluids, this method, which is based on the processing of statistical data, cannot be used to predict changes in permeability for analogous fields. Therefore, the purpose of this study was to find an exact solution to Equations (6)–(8) by a reasonable selection of parameters and to formulate a relevant mathematical model.
4. Model Formulation
In the analysis performed in Section 3, the values of coefficients and indicators in Equations (6)–(8) characterizing the intensity of the change in permeability from the effective pressure were determined. As is shown in [43,44], the rate of permeability variation is directly related to the pore size and permeability of the rock. To test this hypothesis, we performed a comparative analysis of the calculated values of the constants and indicators of Equations (6)–(8) for the oil reservoirs of the Perm–Solikamsk region fields on the initial permeability. During the analysis, it was found that for C1bb clastic formations, the dependence of the coefficients and indicators in Equations (6)–(8) on permeability is described well, with a low dispersion (R2 reached 0.97) (Figure 5). For carbonate formations C1t-D3fm and C2b, no clear dependence was obtained due to a high dispersion of values, which is explained by the high heterogeneity of the carbonate rocks and the presence of fractures [45] that are highly sensitive to changes in effective pressure, regardless of the initial permeability. Due to the high heterogeneity of the C1t-D3fm and C2b formations of the considered fields, a prediction of permeability variation may have low reliability [40]. Thus, further studies were carried out for C1bb clastic formations of the Perm–Solikamsk region fields.
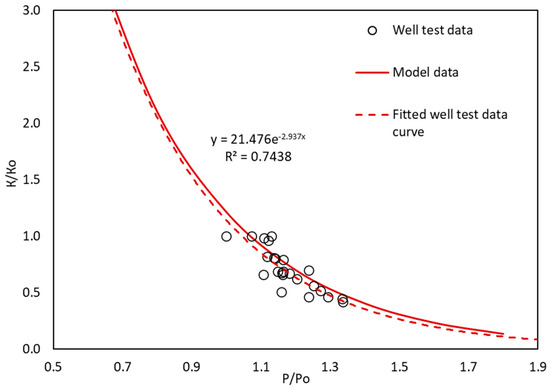
Figure 5.
Comparison of the calculated model data and the results of field well testing using the example of the Perm–Solikamsk region field C1bb reservoir.
Oil reservoirs are characterized not only by permeability, but also by a set of other geological parameters that can affect the nature of the change in permeability caused by effective pressure variation. To assess the degree of influence of reservoir parameters on the sensitivity of reservoir permeability to effective pressure, we carried out a correlation analysis of the coefficients in Equations (6)–(8) and reservoir properties. The results of the analysis are given in Table 2.
Table 2.
The results of the correlation analysis of C1bb reservoir properties and indicators of Equations (6)–(8).
The correlation analysis allowed us to establish a relationship between independent variables characterizing the properties of the reservoir and the coefficients in the equations describing the change in the permeability of rocks in relation to the effective pressure. Table 2 shows that the coefficients of Equations (6)–(8) are influenced by the following factors:
- -
- Initial reservoir pressure;
- -
- The average depth of the formation;
- -
- Average oil-saturated thickness;
- -
- Porosity;
- -
- Initial permeability;
- -
- Net-to-gross ratio;
- -
- Average number of permeable intervals in the section;
- -
- Oil gas saturation pressure;
- -
- Initial effective pressure.
The correlation analysis enabled us to rapidly assess the degree of influence of independent variables on each other. However, in the correlation analysis, parameters that only have a statistical relationship may be mistakenly selected. Another important condition affecting the accuracy of using correlation analysis is the availability of a sufficient number of observations.
Since a number of dependent variables influence each other, we selected those variables that best described the conditions of productive layers but that were not duplicated:
- –
- Initial permeability;
- –
- Initial reservoir pressure;
- –
- The average depth of the formation;
- –
- Net-to-gross ratio;
- –
- Initial effective pressure;
- –
- Average number of permeable intervals in the section.
In order to assess the influence of the properties of the C1bb formations of the Perm–Solikamsk region fields on γ and A in Equation (6), we used a linear multiple regression equation:
where b0 … bn are the determined regression coefficients, and x1 … xn are factor signs.
In the linear regression equation, only statistically significant parameters should be included to maintain reliability. The estimation and selection of parameters is usually carried out according to the methods of mathematical statistics. The choice of parameters in the regression Equation (9) in our work was carried out by assessing the influence of the significance of the parameters using STATISTICA software. When choosing parameters and their number, there are certain restrictions, including the number of observations. Due to the fact that for statistical analysis we have a relatively small number of observations, the maximum number of parameters in Equation (9) should be equal to three. Initially, we chose six parameters describing the geological features of the reservoirs, but the regression equation could include only three parameters. To assess the significance of the equations, we compared criteria F, t, and p for various combinations of three independent parameters of 20 non-repeating equations for all coefficients and exponents of Equations (6)–(8). The results of the comparisons calculated for criteria F, t, and p for exponent γ of Equation (6) are shown in Table 3, and the values of F, t, and p were 9.27, 3.18, and 0.05, respectively.
Table 3.
Calculated values of the criteria F, t, and p of the regression equations for the exponent γ Equation (6).
It can be seen from Table 3 that all equations had a high R2 value. As a first approximation, we can say that all equations described the change in γ from the geological parameters of the reservoir quite well. However, a more detailed analysis showed that not all equations passed the test for the presence of a type I error (p < 0.05). Using the parameters Pfo, H, and Po, we did not obtain the regression equation, since these parameters are interdependent—the effective pressure is determined as the difference between the rock pressure and the pore pressure. Additionally, the values of F and t of the criteria were compared with the table values, and as a result, it was found that only one equation with parameters ko, Pfo, and H was statistically significant and could be used as a model to predict the exponent γ of Equation (6). Other coefficients and exponents of Equations (6)–(8) were estimated in a similar way.
As a result of the analysis, we found that the variation of γ in Equation (6) was best described by initial permeability (ko), initial reservoir pressure (Pfo), and average depth of the formation (H):
The value of the coefficient A in Equation (6) was best described by initial effective pressure (Po), net-to-gross ratio (NTG), and average number of permeable intervals in the section (Kn):
The reliability of Equations (10) and (11) and the number of parameters with which there is a statistical relationship between the values of γ and A in Equation (6) was determined by F-test and Student’s t-test (a = 0.05, R2 = 0.96–0.974). The values of coefficients b1, b2, b3, and b0 were also calculated.
On the basis of the regression analysis and Equations (10) and (11), we established that the change in the relative permeability of the C1bb formations of the Perm–Solikamsk region fields was influenced only by the properties of the reservoirs. These were described by the factorial signs x1 … xn in Equation (10), characterizing the bedding conditions, and the reservoir heterogeneity in Equation (11). An influence of the properties of formation fluids on variation of relative permeability from the relative effective pressure was not found. This can be explained by the similar properties of oil and water in the Perm–Solikamsk oil fields.
Linear equations of multiple regressions for describing the influence of the properties of clastic formations C1bb on the coefficients B and n, and C and D in Equations (7) and (8) did not pass the F-test and Student’s t-test and therefore could not be used to describe the change in permeability in relation to effective pressure.
Thus, the mathematical model of change in the permeability of the C1bb formations of the Perm–Solikamsk region fields with permeability ranging from 250 to 420 mD and a formation depth of 2030–2272 m was based on the use of the exponential Equation (6), since it had the lowest average deviation and satisfied the F-test and Student’s t-test:
Adjust coefficients in model (12) may vary from 0.009 to 1456.8. It is known from mathematical statistics that the size of the coefficient does not determine the significance of the parameter in the regression equation, but depends only on the dimension of the parameter; for example, the coefficient 0.009 belongs to the parameter H, which in our conditions can vary from 2030 to 2272 m, respectively, and the multiplication of 0.009 H changes from 18.27 to 20.448. Moreover, the small values of adjust coefficients in model (12) may be due to the fact that the curves of permeability versus effective pressure for C1bb formations have approximately the same slope Figure 3a–g.
The verification of the exponential model on the basis of the empirical data showed a high convergence of the calculated parameters and the results of field well testing (Figure 5).
The resulting model (12) made it possible to assess the degree of reduction in reservoir permeability. This is especially important when designing further developments in the Perm–Solikamsk oil fields, since all new fields of the Perm–Solikamsk region are being naturally produced with a significant reduction in reservoir pressure at initial production period. As shown in this work, with such oil production, there is an intense decrease in the permeability of the reservoirs, which leads to a decrease in well productivity and oil loss. Therefore, predicting changes in reservoir permeability will allow the revision of existing approaches to the development of C1bb formations of the Perm–Solikamsk region oil fields, contributing to a more thorough assessment of the need to implement injection wells. Another advantage of the proposed model is that for changes in permeability C1bb formations of the Perm–Solikamsk region fields to be predicted, there is no need to conduct core and field well tests, which are costly and time-consuming.
5. Conclusions
During hydrocarbon production, the permeability of reservoirs varies due to a decrease in reservoir pressure and an increase in effective pressure. Laboratory core studies are typically used to assess the variation in permeability from a reservoir deformation. However, this method has a number of disadvantages, the main ones being the incomplete reflection of reservoir heterogeneities and violation of the natural stress–strain state when extracting core from the well. In this regard, for reliable information regarding the change in reservoir permeability to be obtained, it is necessary to use test data from wells.
For this analysis, we used data from field well tests carried out at three time periods: immediately after drilling the well, during the initial period of its operation, and after some time. To reveal the true dependence of permeability on effective pressure, we selected field well test data according to the following criteria: the reservoir pressure did not fall below the bubble point pressure and the water cut did not exceed 5%. For a comparative assessment of permeability and effective pressure, we normalized variables to dimensionless forms of k/ko and P/Po.
Analysis of the results of 2053 field well tests of the Perm–Solikamsk region fields allowed us to establish the dependence of the change in permeability on effective pressure. It was found that the change in permeability with a change in effective pressure was best described by exponential, power law, and logarithmic equations. For the equations of the dependence of permeability on effective pressure, we calculated coefficients and exponents. The analysis of coefficients and exponents were analyzed using linear regression, and results showed that the change in relative permeability of the C1bb formations of the Perm–Solikamsk region fields was influenced only by the properties that characterize the conditions of bedding of the formations and their heterogeneity. An influence of the formation fluid’s properties on the change in the relative permeability from the effective pressure was not found. This can be explained by the similar properties of oil and water of the considered productive formations. Thus, a mathematical model of the variation of permeability of the C1bb reservoirs of the Perm–Solikamsk region fields with a permeability ranging from 250 to 420 mD and a depth of 2030–2272 m was obtained on the basis of the use of an exponential equation.
Author Contributions
Conceptualization, E.K.; data curation, M.T.; formal analysis, E.R.; visualization, E.R.; writing—original draft, E.K.; writing—review and editing, M.T. All authors have read and agreed to the published version of the manuscript.
Funding
This research was funded by RUSSIAN SCIENCE FOUNDATION, project no. 19-79-10034.
Institutional Review Board Statement
Not applicable.
Informed Consent Statement
Not applicable.
Data Availability Statement
Not applicable.
Conflicts of Interest
The authors are aware of the ethical responsibilities, and they declare that they have no conflict of interest.
Abbreviations
| P | effective pressure, MPa |
| Po | initial effective pressure, MPa |
| Pc | overburden (lithostatic) pressure, MPa |
| Pf | pore fluid pressure, MPa |
| k | permeability, mD |
| ko | initial permeability, mD |
| A | coefficient of exponential equation |
| γ | exponent of exponential equation |
| B | coefficient in power law equation |
| n | exponent in power law equation |
| C | coefficient in logarithmic equation |
| D | coefficient in logarithmic equation |
| H | average depth of the formation |
| Ho | average total thickness of the formation |
| Hнн | average oil-saturated thickness |
| Kpor | porosity |
| ko | initial permeability |
| NTG | net-to-gross ratio |
| Kn | average number of permeable intervals in the section |
| Pfo | initial reservoir pressure |
| μo | viscosity in reservoir conditions |
| ρo | density of oil in reservoir conditions |
| ρн | oil density in surface conditions |
| β | volumetric coefficient of oil |
| Wax | the paraffin content in oil |
| Psat | oil gas saturation pressure |
| G | oil gas ratio |
| μw | the viscosity of water in reservoir conditions |
| ρw | density of water in reservoir conditions |
References
- Xiao, B.; Zhang, Y.; Wang, Y.; Jiang, G.; Liang, M.; Chen, X.; Long, G. A fractal model for kozeny–carman constant and dimensionless permeability of fibrous porous media with roughened surfaces. Fractals 2019, 27, 1950116. [Google Scholar] [CrossRef]
- Xiao, B.; Zhang, X.; Wang, W.; Long, G.; Chen, H.; Kang, H.; Ren, W. A FRACTAL MODEL FOR WATER FLOW THROUGH UNSATURATED POROUS ROCKS. Fractals 2018, 26, 1840015. [Google Scholar] [CrossRef]
- Kilmer, N.; Morrow, N.; Pitman, J. Pressure sensitivity of low permeability sandstones. J. Pet. Sci. Eng. 1987, 1, 65–81. [Google Scholar] [CrossRef]
- Wang, H.-X.; Wang, G.; Chen, Z.-X.J.; Wong, R.C. Deformational characteristics of rock in low permeable reservoir and their effect on permeability. J. Pet. Sci. Eng. 2010, 75, 240–243. [Google Scholar] [CrossRef]
- Jones, S.C. Two-Point Determinations of Permeability and PV vs. Net Confining Stress. SPE Form. Eval. 1988, 3, 235–241. [Google Scholar] [CrossRef]
- Main, I.G.; Kwon, O.; Ngwenya, B.T.; Elphick, S.C. Fault sealing during deformation-band growth in porous sandstone. Geology 2000, 28, 1131–1134. [Google Scholar] [CrossRef]
- Ngwenya, B.T.; Elphick, S.C.; Kwon, O.; Main, I.G. Permeability evolution during progressive development of deformation bands in porous sandstones. J. Geophys. Res. Space Phys. 2003, 108, 2343. [Google Scholar] [CrossRef]
- David, C.; Wong, T.-F.; Zhu, W.; Zhang, J. Laboratory measurement of compaction-induced permeability change in porous rocks: Implications for the generation and maintenance of pore pressure excess in the crust. Pure Appl. Geophys. 1994, 143, 425–456. [Google Scholar] [CrossRef]
- Rice, J.R. Chapter 20 Fault Stress States, Pore Pressure Distributions, and the Weakness of the San Andreas Fault. Int. Geophys. 1992, 51, 475–503. [Google Scholar] [CrossRef]
- Wong, T.-F.; Zhu, W. Brittle faulting and permeability evolution: Hydromechanical measurement, microstructural observation, and network modeling. Extrem. Events 1999, 113, 83–99. [Google Scholar] [CrossRef]
- Bhandari, A.R.; Flemings, P.B.; Hofmann, R.; Polito, P.J. Stress-Dependent In Situ Gas Permeability in the Eagle Ford Shale. Transp. Porous Media 2018, 123, 1–20. [Google Scholar] [CrossRef]
- Zhang, Q.; Liu, J.; Xu, H.; Zeng, Y.; Wang, C.; Wang, L. Experimental Investigation on Permeability Evolution of Limestone Caprock under Coupled THM Processes. KSCE J. Civ. Eng. 2019, 23, 5090–5097. [Google Scholar] [CrossRef]
- Shi, L.; Zeng, Z.; Fang, Z.; Li, X. Investigation of the Effect of Confining Pressure on the Mechanics-Permeability Behavior of Mudstone under Triaxial Compression. Geofluids 2019, 2019, 1–14. [Google Scholar] [CrossRef]
- Dong, J.-J.; Hsu, J.-Y.; Wu, W.-J.; Shimamoto, T.; Hung, J.-H.; Yeh, E.-C.; Wu, Y.-H.; Sone, H. Stress-dependence of the permeability and porosity of sandstone and shale from TCDP Hole-A. Int. J. Rock Mech. Min. Sci. 2010, 47, 1141–1157. [Google Scholar] [CrossRef]
- Selvadurai, A.; Głowacki, A. Permeability Hysterisis of Limestone during Isotropic Compression. Ground Water 2007, 46, 113–119. [Google Scholar] [CrossRef] [PubMed]
- Ghabezloo, S.; Sulem, J.; Guédon, S.; Martineau, F. Effective stress law for the permeability of a limestone. Int. J. Rock Mech. Min. Sci. 2009, 46, 297–306. [Google Scholar] [CrossRef]
- Sonich, V.P.; Cheremisin, N.A.; Baturin, Y.E. Influence of lowering reservoir pressure on the reservoir properties of rocks. Neftyanoe Khozyaystvo Oil Ind. 1997, 9, 52–57. [Google Scholar]
- Nelson, R. Fracture Permeability in Porous Reservoirs: Experimental and Field Approach. Ph.D. Thesis, Department of Geology, Texas A&M University, College Station, TX, USA, 1975. [Google Scholar]
- Ma, D.; Miao, X.X.; Chen, Z.Q.; Mao, X.B. Experimental Investigation of Seepage Properties of Fractured Rocks under Different Confining Pressures. Rock Mech. Rock Eng. 2012, 46, 1135–1144. [Google Scholar] [CrossRef]
- Walsh, J.B.; Brace, W.F. The effect of pressure on porosity and the transport properties of rock. J. Geophys. Res. Space Phys. 1984, 89, 9425–9431. [Google Scholar] [CrossRef]
- Li, M.; Bernabé, Y.; Xiao, W.-I.; Chen, Z.-Y.; Liu, Z.-Q. Effective pressure law for permeability of E-bei sandstones. J. Geophys. Res. Space Phys. 2009, 114, 07205. [Google Scholar] [CrossRef]
- Metwally, Y.M.; Sondergeld, C.H. Measuring low permeabilities of gas-sands and shales using a pressure transmission tech-nique. Int. J. Rock Mech. Min. Sci. 2001, 48, 1135–1144. [Google Scholar] [CrossRef]
- Zhang, C.; Rothfuchs, T. Experimental study of the hydro-mechanical behaviour of the Callovo-Oxfordian argillite. Appl. Clay Sci. 2004, 26, 325–336. [Google Scholar] [CrossRef]
- Jones, F.O.J. A Laboratory Study of the Effects of Confining Pressure on Fracture Flow and Storage Capacity in Carbonate Rocks. J. Pet. Technol. 1975, 27, 21–27. [Google Scholar] [CrossRef]
- Wong, L.N.Y.; Li, D.; Liu, G. Experimental Studies on Permeability of Intact and Singly Jointed Meta-Sedimentary Rocks under Confining Pressure. Rock Mech. Rock Eng. 2013, 46, 107–121. [Google Scholar] [CrossRef]
- Zheng, J.; Zheng, L.; Liu, H.-H.; Ju, Y. Relationships between permeability, porosity and effective stress for low-permeability sedimentary rock. Int. J. Rock Mech. Min. Sci. 2015, 78, 304–318. [Google Scholar] [CrossRef]
- Morrow, C.A.; Shi, L.Q.; Byerlee, J.D. Permeability of fault gouge under confining pressure and shear stress. J. Geophys. Res. Space Phys. 1984, 89, 3193–3200. [Google Scholar] [CrossRef]
- Shi, Y.; Wang, C.-Y. Pore pressure generation in sedimentary basins: Overloading versus aquathermal. J. Geophys. Res. Space Phys. 1986, 91, 2153–2162. [Google Scholar] [CrossRef]
- Aslanyan, A.; Aslanyan, I.; Farakhova, R. Assessing macroscopic dynamic permeability through pressure and noise analysis. In Proceedings of the SPE Reservoir Characterisation and Simulation Conference and Exhibition (RCSC), Abu Dhabi, United Arab Emirates, 14–16 September 2015; pp. 22–38. [Google Scholar] [CrossRef]
- Albornoz, F.; Williams, S.O. Optimization of core-log derived permeability using pressure transient analysis in low-permeability waterflood: Ventura Avenue field case study. In Proceedings of the Society of Petroleum Engineers Western Regional Meeting, Bakersfield, CA, USA, 21–23 March 2012; pp. 523–540. [Google Scholar] [CrossRef]
- Khemissa, H.; Lesage, A.; Akram, F.A.; Draoui, E.; Nakamura, S.; Al-Alyak, A.; Walia, S.; Das, S. Integration of permeability derived from well pressure transient analysis to improve prediction model permeability in high heterogeneous carbonates res-ervoir-Case study-offshore Abu Dhabi, United Arab Emirates. In Proceedings of the SPE Reservoir Characterisation and Simulation Conference and Exhibition: New Approaches in Characterisation and Modelling of Complex Reservoirs (RCSC), Abu Dhabi, United Arab Emirates, 16–18 September 2013; Volume 2, pp. 791–802. [Google Scholar]
- Ren, J.; Guo, P. A New Mathematical Model for Pressure Transient Analysis in Stress-Sensitive Reservoirs. Math. Probl. Eng. 2014, 2014, 1–14. [Google Scholar] [CrossRef]
- Moradi, M.; Shamloo, A.; Asadbegi, M.; Dezfuli, A.D. Three dimensional pressure transient behavior study in stress sensitive reservoirs. J. Pet. Sci. Eng. 2017, 152, 204–211. [Google Scholar] [CrossRef]
- Huang, Y.; Li, X.; Tan, X. Transient Pressure and Rate Decline Analysis for Horizontal Well in Stress-Sensitive Composite Reservoir. Math. Probl. Eng. 2018, 2018, 1–11. [Google Scholar] [CrossRef]
- Ren, J.; Guo, P. A general analytical method for transient flow rate with the stress-sensitive effect. J. Hydrol. 2018, 565, 262–275. [Google Scholar] [CrossRef]
- Jiang, L.; Liu, J.; Liu, T.; Yang, D. Semi-analytical modeling of transient pressure behaviour for a fractured vertical well with hydraulic/natural fracture networks by considering stress-sensitive effect. J. Nat. Gas Sci. Eng. 2020, 82, 103477. [Google Scholar] [CrossRef]
- Kadeethum, T.; Salimzadeh, S.; Nick, H. Well productivity evaluation in deformable single-fracture media. Geothermics 2020, 87, 101839. [Google Scholar] [CrossRef]
- Pourciau, R.D.; Fisk, J.H.; Descant, F.J.; Waltman, B. Completion and Well Performance Results, Genesis Field, Deepwater Gulf of Mexico. SPE Drill. Complet. 2005, 20, 147–155. [Google Scholar] [CrossRef]
- An, C.; Killough, J.; Xia, X. Investigating the effects of stress creep and effective stress coefficient on stress-dependent permeability measurements of shale rock. J. Pet. Sci. Eng. 2021, 198, 108155. [Google Scholar] [CrossRef]
- Kozhevnikov, E.; Turbakov, M.; Riabokon, E.; Poplygin, V. Effect of Effective Pressure on the Permeability of Rocks Based on Well Testing Results. Energies 2021, 14, 2306. [Google Scholar] [CrossRef]
- Poplygin, V.V.; Pavlovskaia, E.E. Investigation of the Influence of Pressures and Proppant Mass on the Well Parameters after Hydraulic Fracturing. Int. J. Eng. 2021, 34, 1066–1073. [Google Scholar] [CrossRef]
- Riabokon, E.P.; Turbakov, M.S.; Kozhevnikov, E.V.; Poplygin, V.V.; Wiercigroch, M. Advanced Problems in Mechanics. In Proceedings of the XLVII International Summer School-Conference “Advanced Problems in Mechanics”, St. Petersburg, Russia, 24–29 June 2019; pp. 185–192. [Google Scholar] [CrossRef]
- Dvorkin, J.; Nur, A. Dynamic poroelasticity: A unified model with the squirt and the Biot mechanisms. Geophysics 1993, 58, 524–533. [Google Scholar] [CrossRef]
- Wiercigroch, M.; Kozhevnikov, E.; Turbakov, M.; Poplygin, V.; Riabokon, E. Effective Pressure and Bedding Depth Influence on The Oil Fields Reservoir Properties (On The Example of The Northern Perm Region Oil Fields). In Proceedings of the 7th International geological and geophysical conference “Tyumen 2021. Natural Recourses Management as a Cross-Functional Process”, Tyumen, Russia, 22–26 March 2021. [Google Scholar] [CrossRef]
- Turbakov, M.; Shcherbakov, А. Determination of Enhanced Oil Recovery Candidate Fields in the Volga-Ural Oil and Gas Region Territory. Energies 2015, 8, 11153–11166. [Google Scholar] [CrossRef]
Publisher’s Note: MDPI stays neutral with regard to jurisdictional claims in published maps and institutional affiliations. |
© 2021 by the authors. Licensee MDPI, Basel, Switzerland. This article is an open access article distributed under the terms and conditions of the Creative Commons Attribution (CC BY) license (https://creativecommons.org/licenses/by/4.0/).