Article

An Analysis on the Compressed Hydrogen Storage System for the Fast-Filling Process of Hydrogen Gas at the Pressure of 82 MPa

1
Department of Mechanical Engineering, Graduate School, Hoseo University, Asan 31499, Korea
2
Division of Mechanical & Automotive Engineering, Hoseo University, Asan 31499, Korea
*
Author to whom correspondence should be addressed.
Energies 2021, 14(9), 2635; https://doi.org/10.3390/en14092635
Submission received: 6 April 2021 / Revised: 26 April 2021 / Accepted: 1 May 2021 / Published: 4 May 2021

Abstract

:
During the fast-filling of a high-pressure hydrogen tank, the temperature of hydrogen would rise significantly and may lead to failure of the tank. In addition, the temperature rise also reduces hydrogen density in the tank, which causes mass decrement into the tank. Therefore, it is of practical significance to study the temperature rise and the amount of charging of hydrogen for hydrogen safety. In this paper, the change of hydrogen temperature in the tank according to the pressure rise during the process of charging the high-pressure tank in the process of a 82-MPa hydrogen filling system, the final temperature, the amount of filling of hydrogen gas, and the change of pressure of hydrogen through the pressure reducing valve, and the performance of heat exchanger for cooling high-temperature hydrogen were analyzed by theoretical and numerical methods. When high-pressure filling began in the initial vacuum state, the condition was called the “First cycle”. When the high-pressure charging process began in the remaining condition, the process was called the “Second cycle”. As a result of the theoretical analysis, the final temperatures of hydrogen gas were calculated to be 436.09 K for the first cycle of the high-pressure tank, and 403.55 for the second cycle analysis. The internal temperature of the buffer tank increased by 345.69 K and 32.54 K in the first cycle and second cycles after high-pressure filling. In addition, the final masses were calculated to be 11.58 kg and 12.26 kg for the first cycle and second cycle of the high-pressure tank, respectively. The works of the paper can provide suggestions for the temperature rise of 82 MPa compressed hydrogen storage system and offer necessary theory and numerical methods for guiding safe operation and construction of a hydrogen filling system.

1. Introduction

Faced with growing energy shortages, environmental pollution, ecological deterioration, the development of clean and efficient new energy is the only way to solve the above problems. Hydrogen has become the most promising secondary energy of the 21st century for its excellent advantages such as broad source, no polluting product, high combustion efficiency, and reproducible ability. It has important strategic significance for solving the problems of energy shortage and environmental pollution puzzling all over the world [1,2,3,4]. With the deepening of research, hydrogen energy has been used in aviation and spaceflight, clean utilization of fossil energy, fuel cell vehicles, national defense and the military industry, mass energy storage, and other fields [5]. However, a hydrogen energy system is a large and complex engineering system, including production, storage, and utilization of hydrogen. In order to promote the practicality of the hydrogen energy economy, science researchers and energy policy experts from all over the world have carried out a lot of systematic research. The development of hydrogen energy is gaining more and more attention from the international community [6].
In the development of hydrogen energy, the density of hydrogen is low at normal temperatures and pressures. How to realize safe and efficient storage and transportation of hydrogen is one of the key problems for the large-scale application of hydrogen [7]. According to different storage methods, it can be divided into chemical hydrogen storage and physical hydrogen storage [8]. Chemical hydrogen storage is realized by hydrogen compound, which is generated through chemical reaction or chemical changes [9,10], including metal hydride, coordination hydride, and organic liquid hydride. Physical hydrogen storage is a traditional way to store hydrogen, including liquid and high-pressure hydrogen storage; liquid hydrogen storage is to store the liquefied low-temperature hydrogen (about 20 K) in the tank, which often adopts a high-vacuum adiabatic low-pressure tank as strict heat insulation is required in order to minimize the vaporization of liquid hydrogen storage. High-pressure hydrogen storage is to directly store the high-pressure gaseous hydrogen in a tank, which usually requires the pressure of tens of MPa in order to get a high volume density for hydrogen storage [11].
By comparing the above hydrogen storage methods, chemical hydrogen storage is far from meeting the requirements of a vehicle system because of material costs, control of actual reaction temperatures, the pressure of absorbing and releasing hydrogen, and the weight of materials. Liquid hydrogen storage has the disadvantages of high energy consumption and complex equipment because it requires more than 30% consumption of liquid hydrogen for hydrogen storage energy and the adiabatic layer further increases the weight of the tank. Thus, it is not a good prospect for application, though it has high-quality density. High-pressure storage is a common method of vehicle-mounted hydrogen storage at present because of its fast speed of absorbing and releasing hydrogen, simple equipment structure, and low energy consumption of compression in comparison to other hydrogen storage methods [12]. There are methods for storing the amount of hydrogen fuel in different forms, as shown in Table 1 [13,14,15,16,17].
The key technology for compressed hydrogen for widespread use is the tank. The requirements for material used in the tank are safety, reliability, and cost-effectiveness [2]. According to the division in ANSI HGV 2 Tanks [18], high-pressure hydrogen storage tanks are divided into four basic types: type I, all-metal tank; type II, hoop-wrapped tank with the inner container; type III, materials (liner, composite shell); type IV, carbon fiber-reinforced polymer. Type I and type II are heavier, which make it difficult to get high hydrogen storage density, and are suitable for hydrogen-filling stations, but not for a vehicle-mounted tank. Type III and type IV adopt light and high-intensity fibers, which not only reduces the mass of the hydrogen tank, but also bears higher pressure; thus, it is widely used as vehicle-mounted hydrogen storage tank. Table 2 shows the four different types of hydrogen storage tanks (Type I to Type IV) [13,19,20,21].
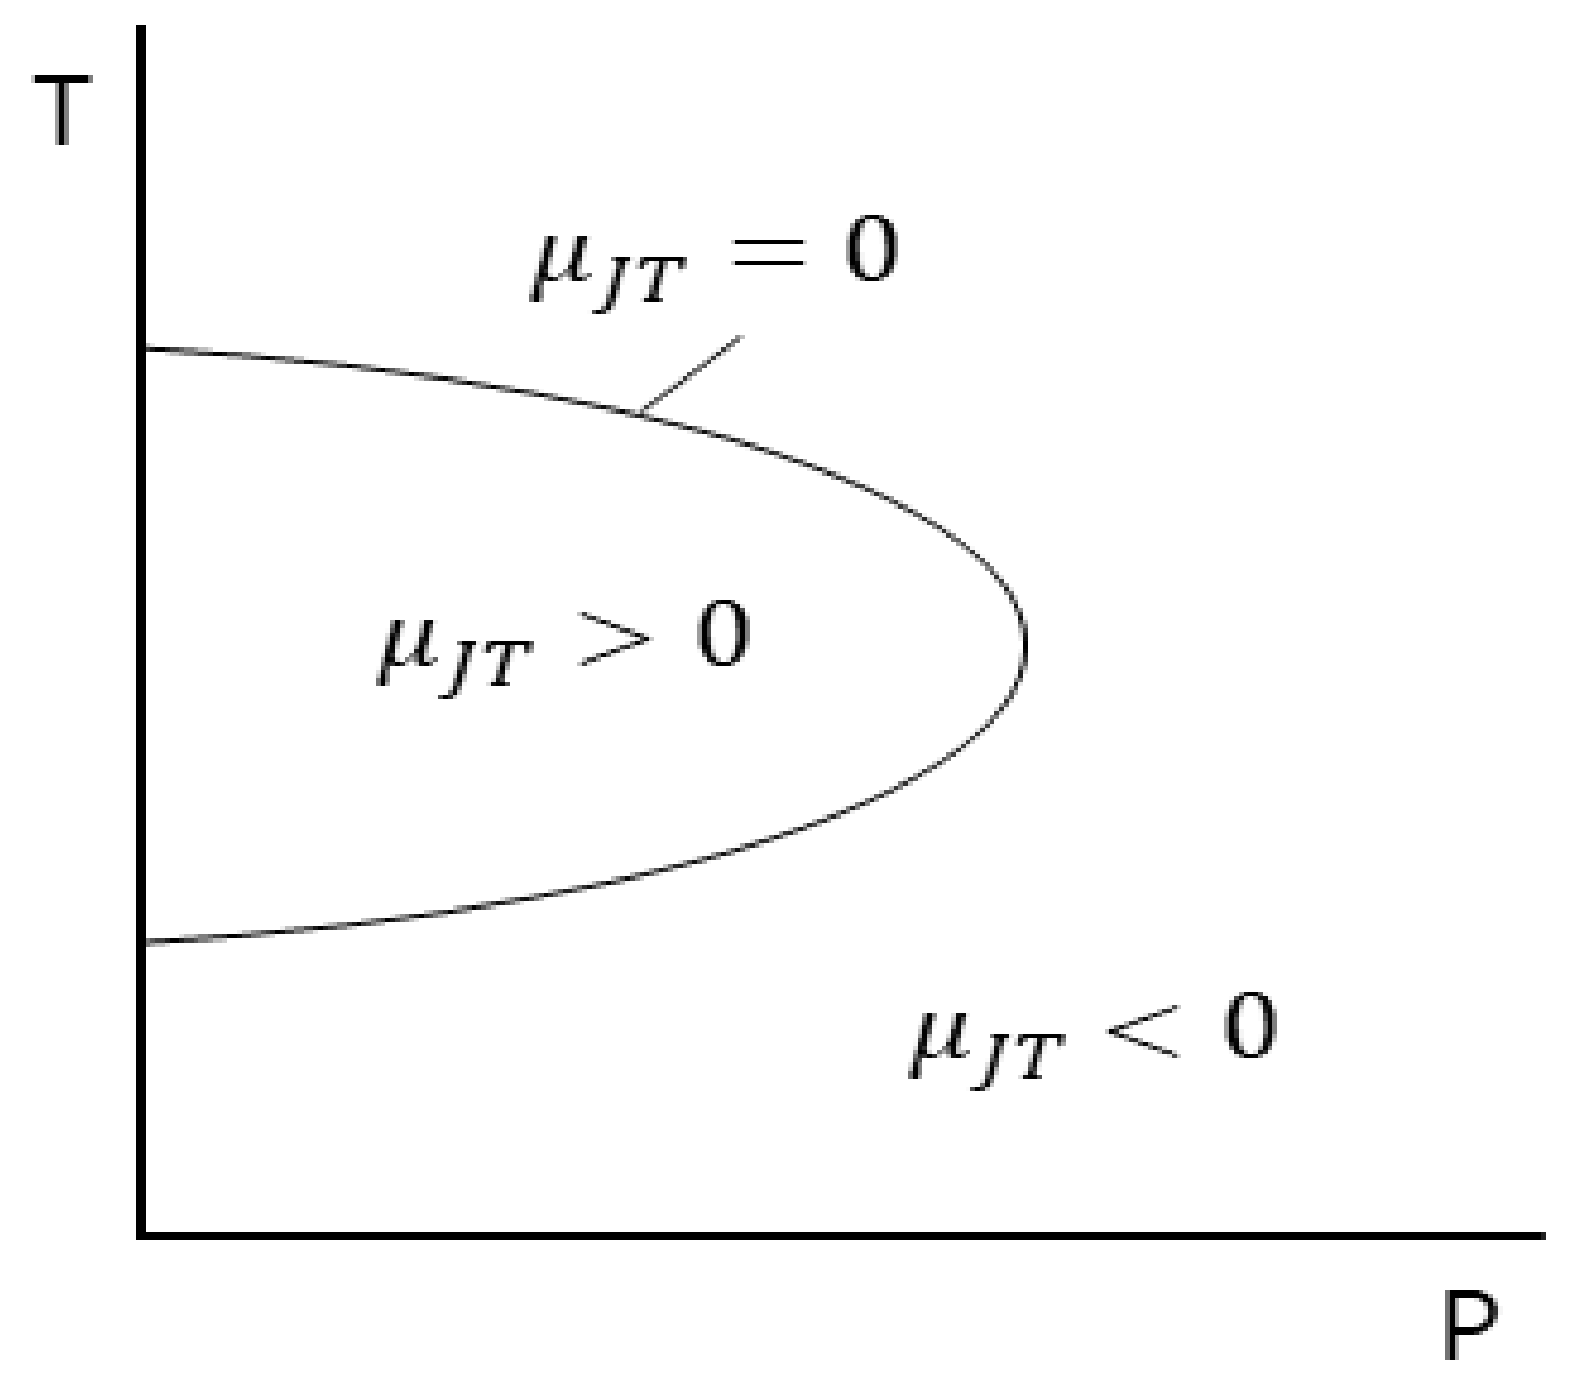
During the cyclic experiment of hydrogen gas, the change of temperature is significant as the temperature of hydrogen rises sharply during filling because of compression of hydrogen, conversion of kinetic energy into internal energy, and negative Joule–Thomson effect [22]. In the high-pressure filling process, the internal pressure of the tank increases, and thermal stress may occur due to the temperature rise of hydrogen. Therefore, it is of practical significance to study the temperature rise and the amount of charging of hydrogen for hydrogen safety.
In the research on temperature rise during fast filling, many domestic and overseas research institutions and scholars have conducted research from the perspectives of theoretical and simulation. Previous research studies have paved the way for advancements in the filling of hydrogen gas. Theoretical study is based on a simplified model, which combines mass and energy law, real gas equations and receives the expression of temperature and pressure after filling. At the thermodynamic model of the reference [
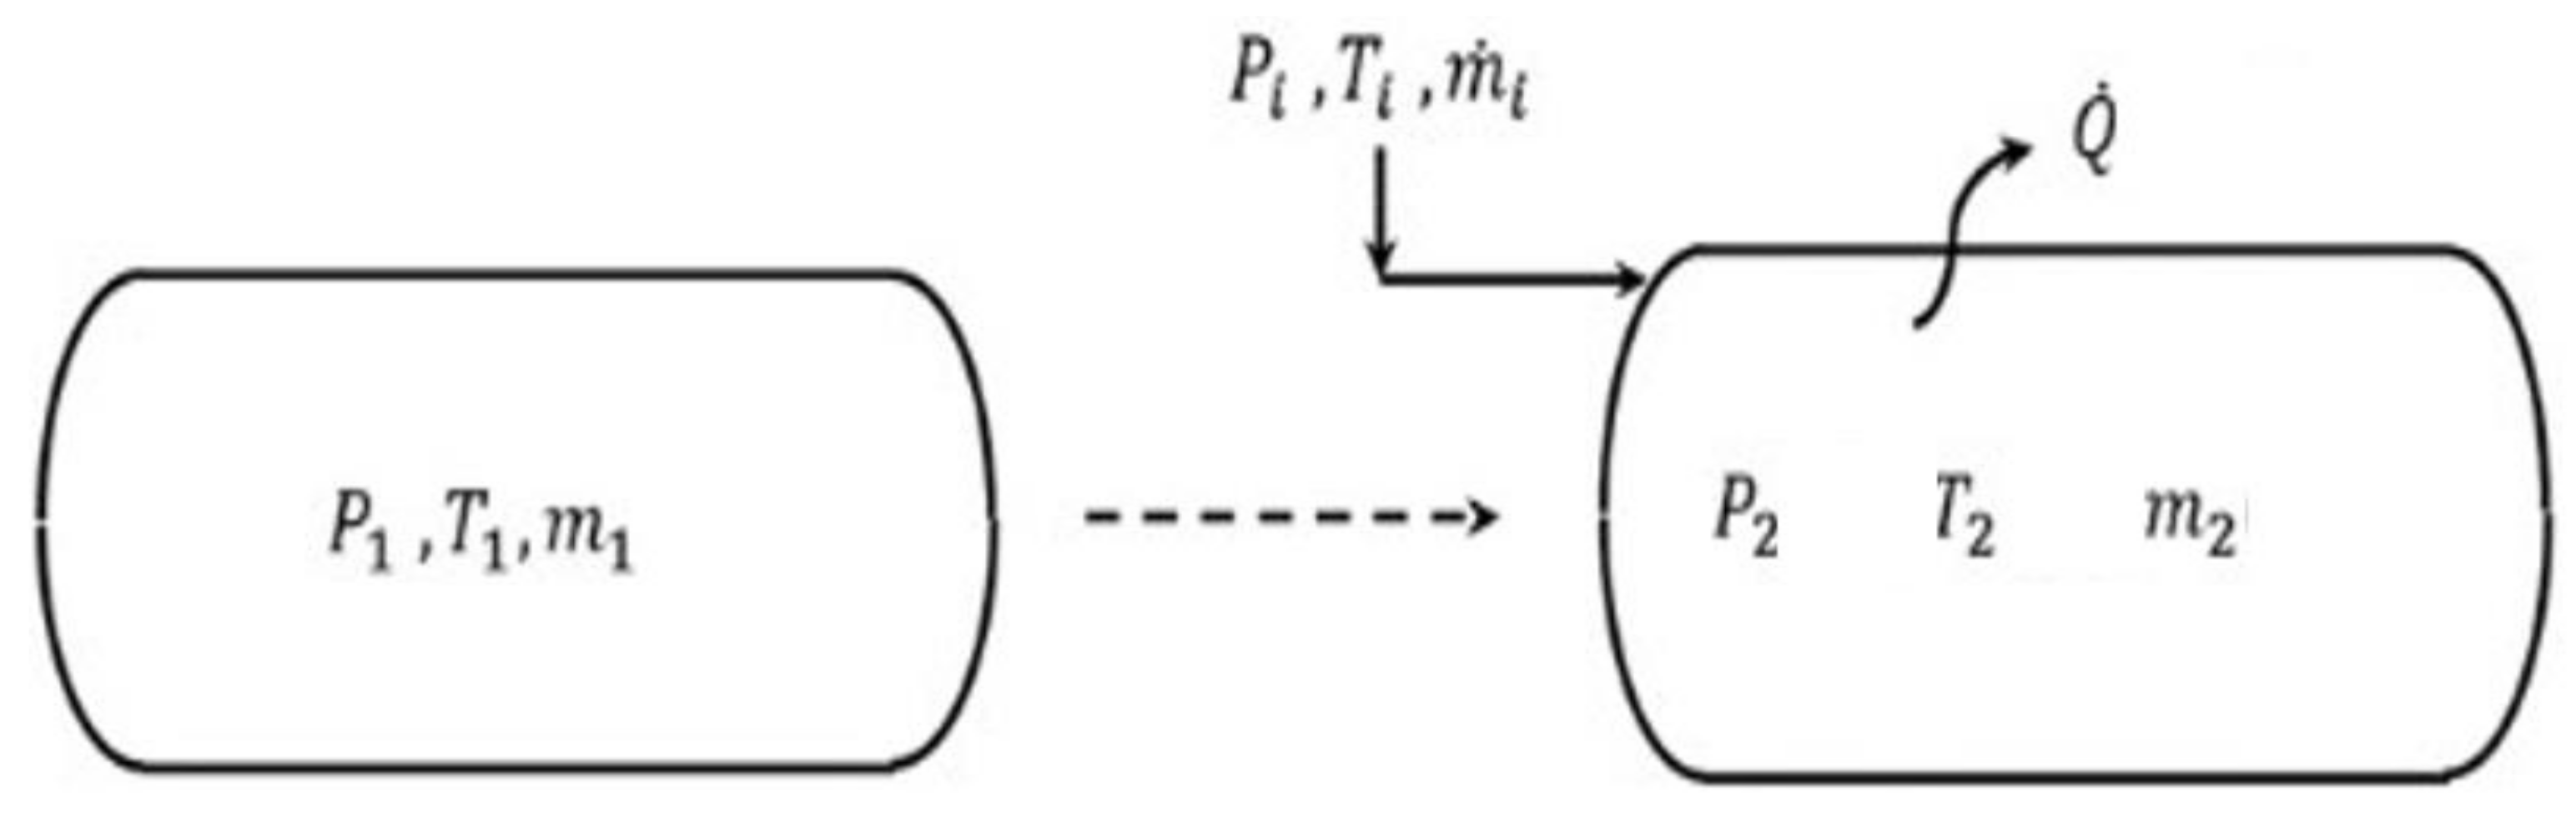
22], it takes the internal energy and kinetic energy of hydrogen in the tank into account, and neglects the heat transferred by internal hydrogen to the environment as the filling time is short. This assumes that the hydrogen’s initial temperature is the same as the temperature of hydrogen within the tank before the filling process. The result is that temperature rise can be calculated accurately by using relevant parameters in the process of theoretical analysis.
Hosseini et al. [23] studied the effect of the initial conditions on temperature rise based on energy analysis, and found that higher initial pressure resulted in smaller final temperature rise. Yang et al. [24] conducted model analysis on the fast-filling of hydrogen by taking advantage of ideal and real gas in adiabatic and isothermal conditions. The result shows that the filling time under adiabatic and isothermal conditions is the lower and upper limit for a given final target pressure. The reference [25] established a thermodynamic model based on the energy equation, which can analyze and obtain the filling’s mass and final temperature after filling. Monde et al. [26] developed a theoretical model to study the effects of the heat transfer coefficient on the final temperature. The results showed that the use of an appropriate constant heat transfer coefficient calculated final temperature is feasible. Yong Zhi et al. [27] developed a two-dimensional axisymmetric model, and the effects of the boost mode and supercharged the hydrogen tank temperature rise rate during the rapid inflation by the model. The expression of temperature change can be clearly understood by theoretical study, which concludes that the temperature rise of hydrogen mainly depends on filling parameters. Besides, the geometric parameters and types of tanks may affect the temperature and mass after filling. The various theoretical analyses of temperature rise are shown in Table 3.
In order to study the relationship between temperature and parameters, some experiments have studied temperature rise in the compression tank. Hirotain et al. [32] have been carried out fast-filling tests of 34-L and 74-L type-III tanks with a working pressure of 35 MPa, 65-L type-IV tanks, and 41-L type-III tanks, and 31-L type-IV tanks with a working pressure of 70 MPa. The results showed that pressure mode (constant speed, first fast and then slow, first slow and then fast, stepped pressure increase) has no obvious effect on the temperature rise of type III tanks, but had a significant effect on type IV tanks. Modnde et al. [33,34,35] studied the change of convective heat transfer coefficient through the fast-filling test, and conducted a three-stage fast-filling test, indicating that three-stage filling was one of the effective ways to address excessive temperature rise. Dicken et al. [36,37] conducted fast-filling experiments on 35 MPa, 74 L type III gas tanks with different initial pressures and different pressure rise rates. Since 63 thermocouples were installed in the test tank, detailed distribution of the temperature in the tank was obtained. Zheng Jinyang et al. [38] developed a 70 MPa fast-filling temperature rise test device, conducted the first 70 MPa fast charging experiment in China, and analyzed the influence of the gas tank structure on the temperature rise. Since the actual fast-filling process will be affected by the specific hydrogenation system settings of the hydrogen refueling station and the manufacturing process attributes of the hydrogen storage bottle itself, the existing fast-filling temperature of the analysis results is weak, so the technical standardization of detailed and universal quantitative analysis is being further promoted.
To sum up, since the actual fast-filling process will be affected by the specific hydrogenation system settings of the hydrogen refueling station and the manufacturing process attributes of the hydrogen storage bottle itself, the existing fast-filling temperature of the analysis results is weak, so the technical standardization of detailed and universal quantitative analysis is being further promoted. At present, there are relatively few studies on 70–100 MPa high-pressure filling experiments. The setting of fast-filling conditions such as the filling control scheme of the fast-filling experiment of the hydrogen tank lacks sufficient experiments, numerical and theoretical analysis as demonstration; for the temperature rise mechanism of the fast-filling process, energy consumption optimization and complex and changeable filling conditions. The effects of temperature rise and other aspects are still in the accumulation stage and have not been fully understood; in addition, because the hydrogen storage tank and its hydrogen filling system are a complex system, and because the standardization process of the system is still in the research stage, only some qualitative analysis can be given, but a quantitative analysis with wide applicability cannot be provided at this time.
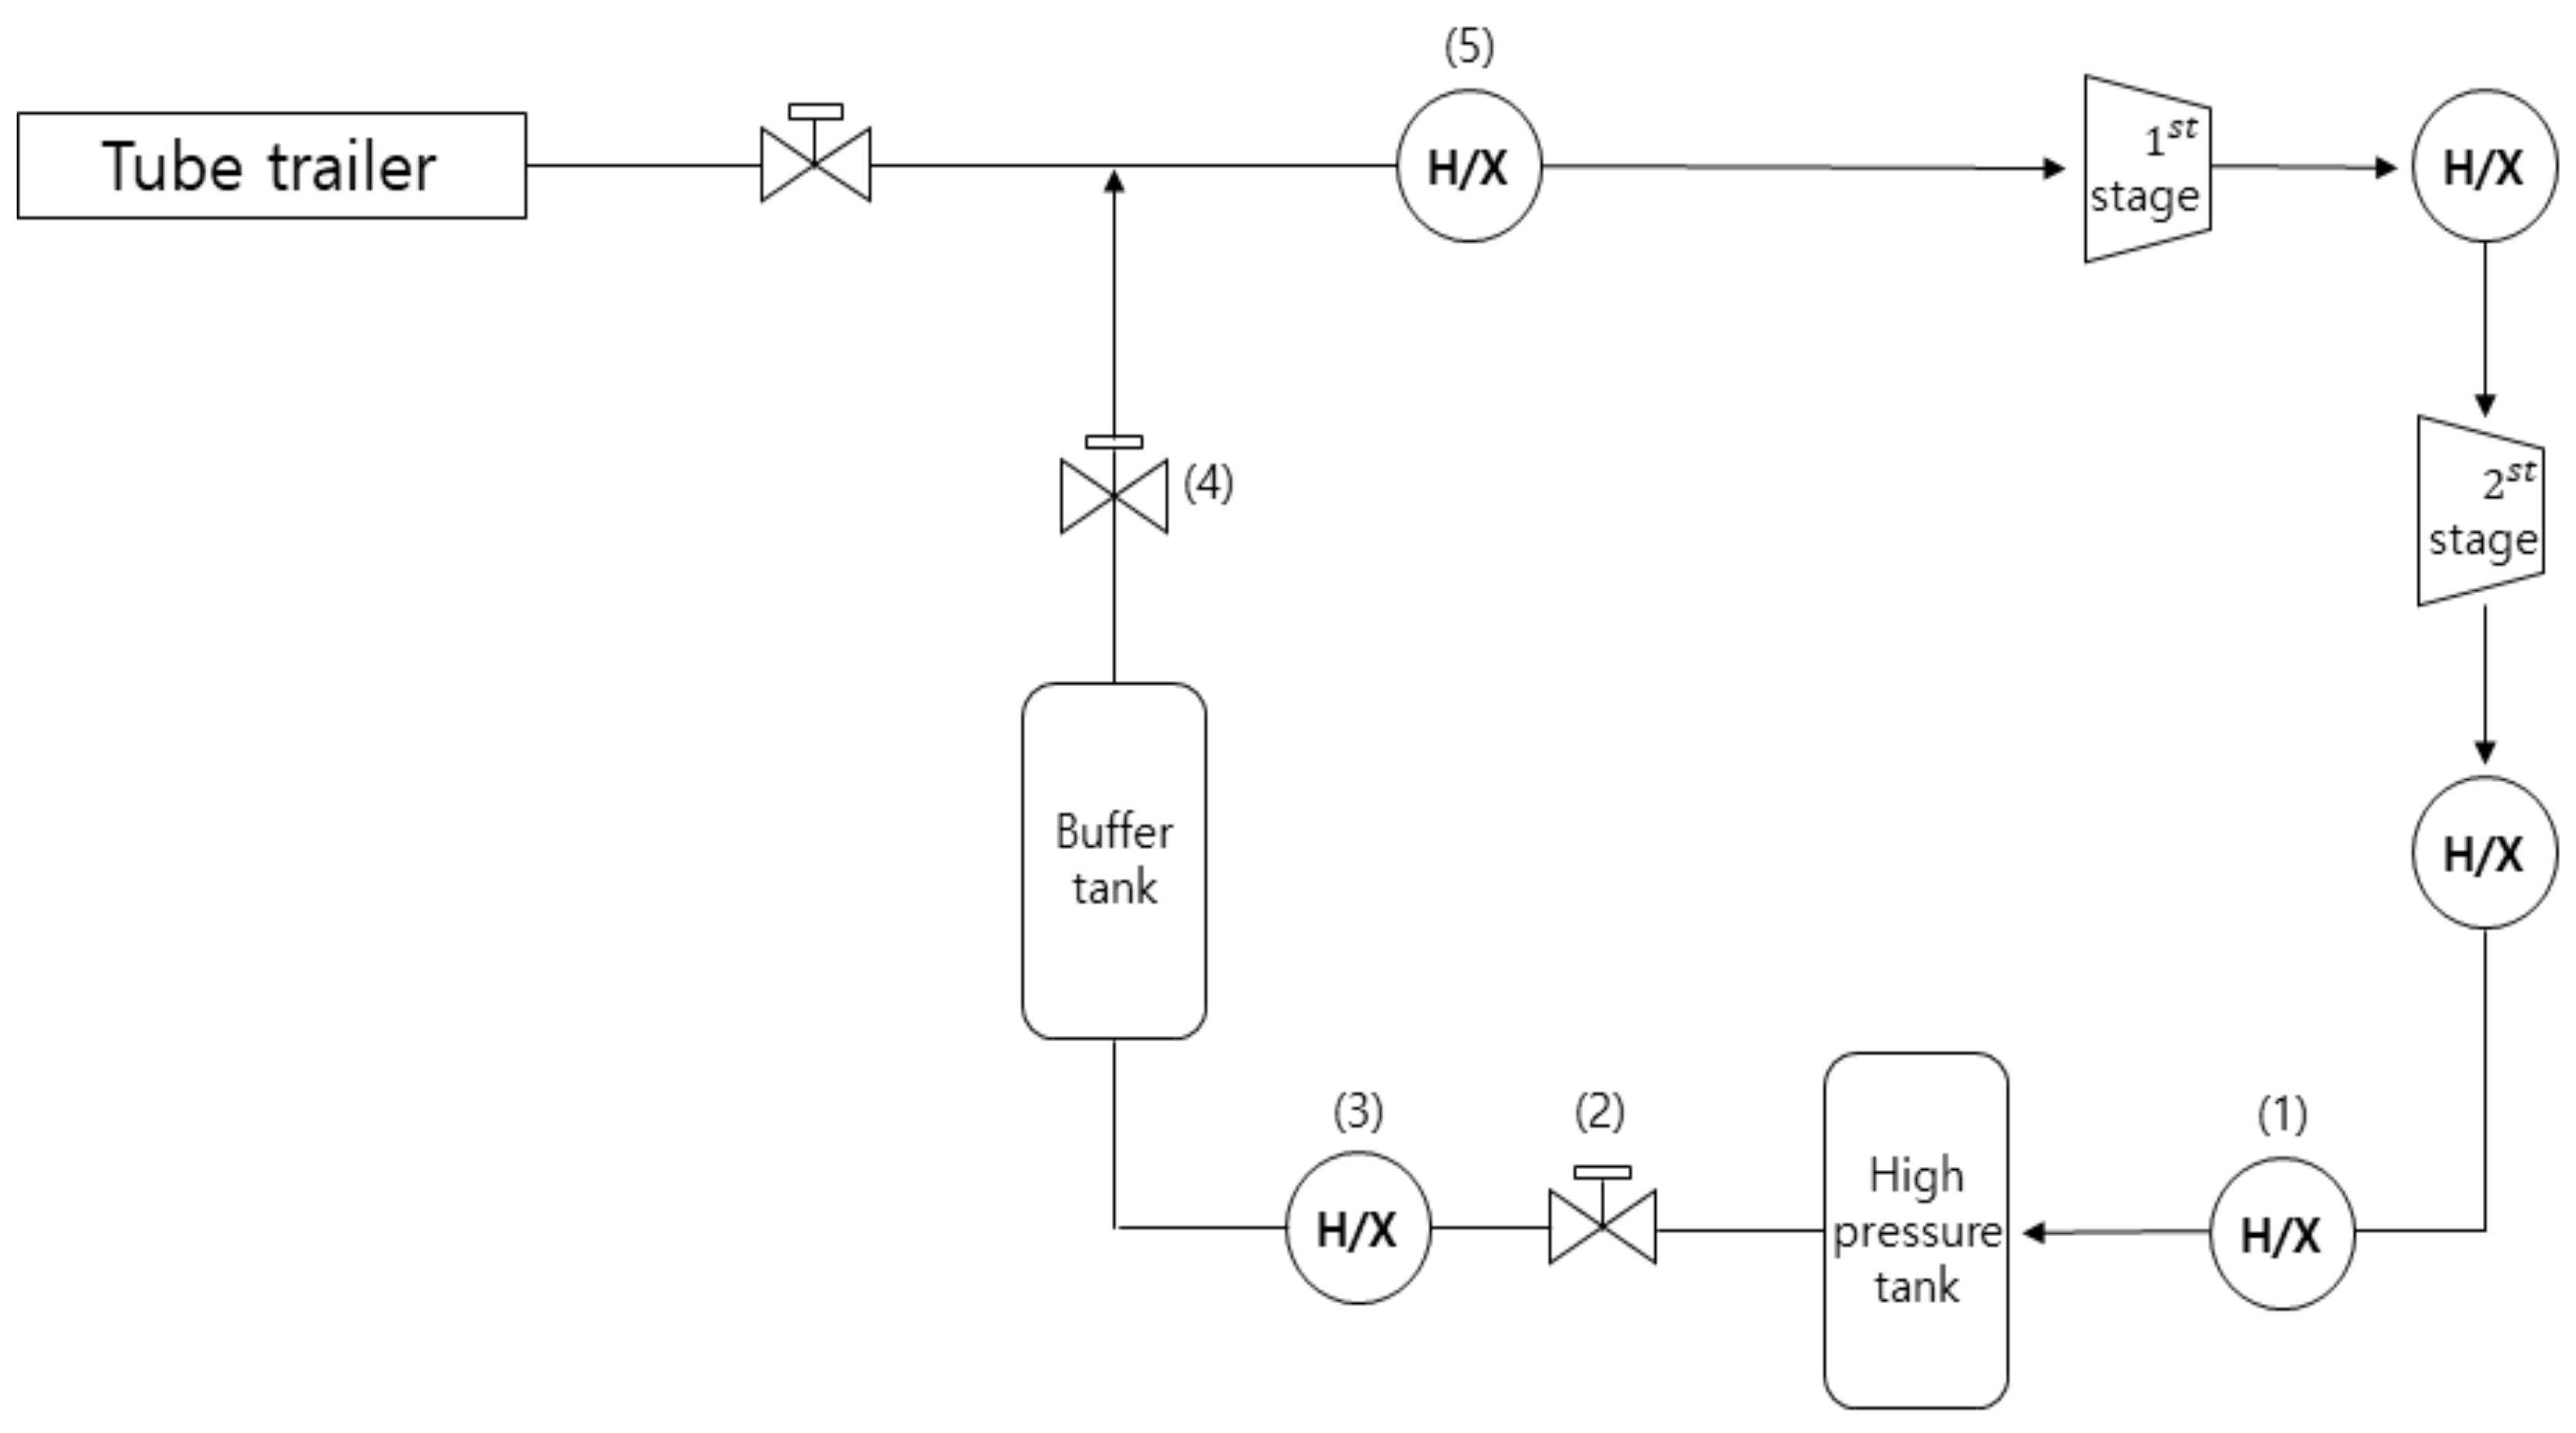
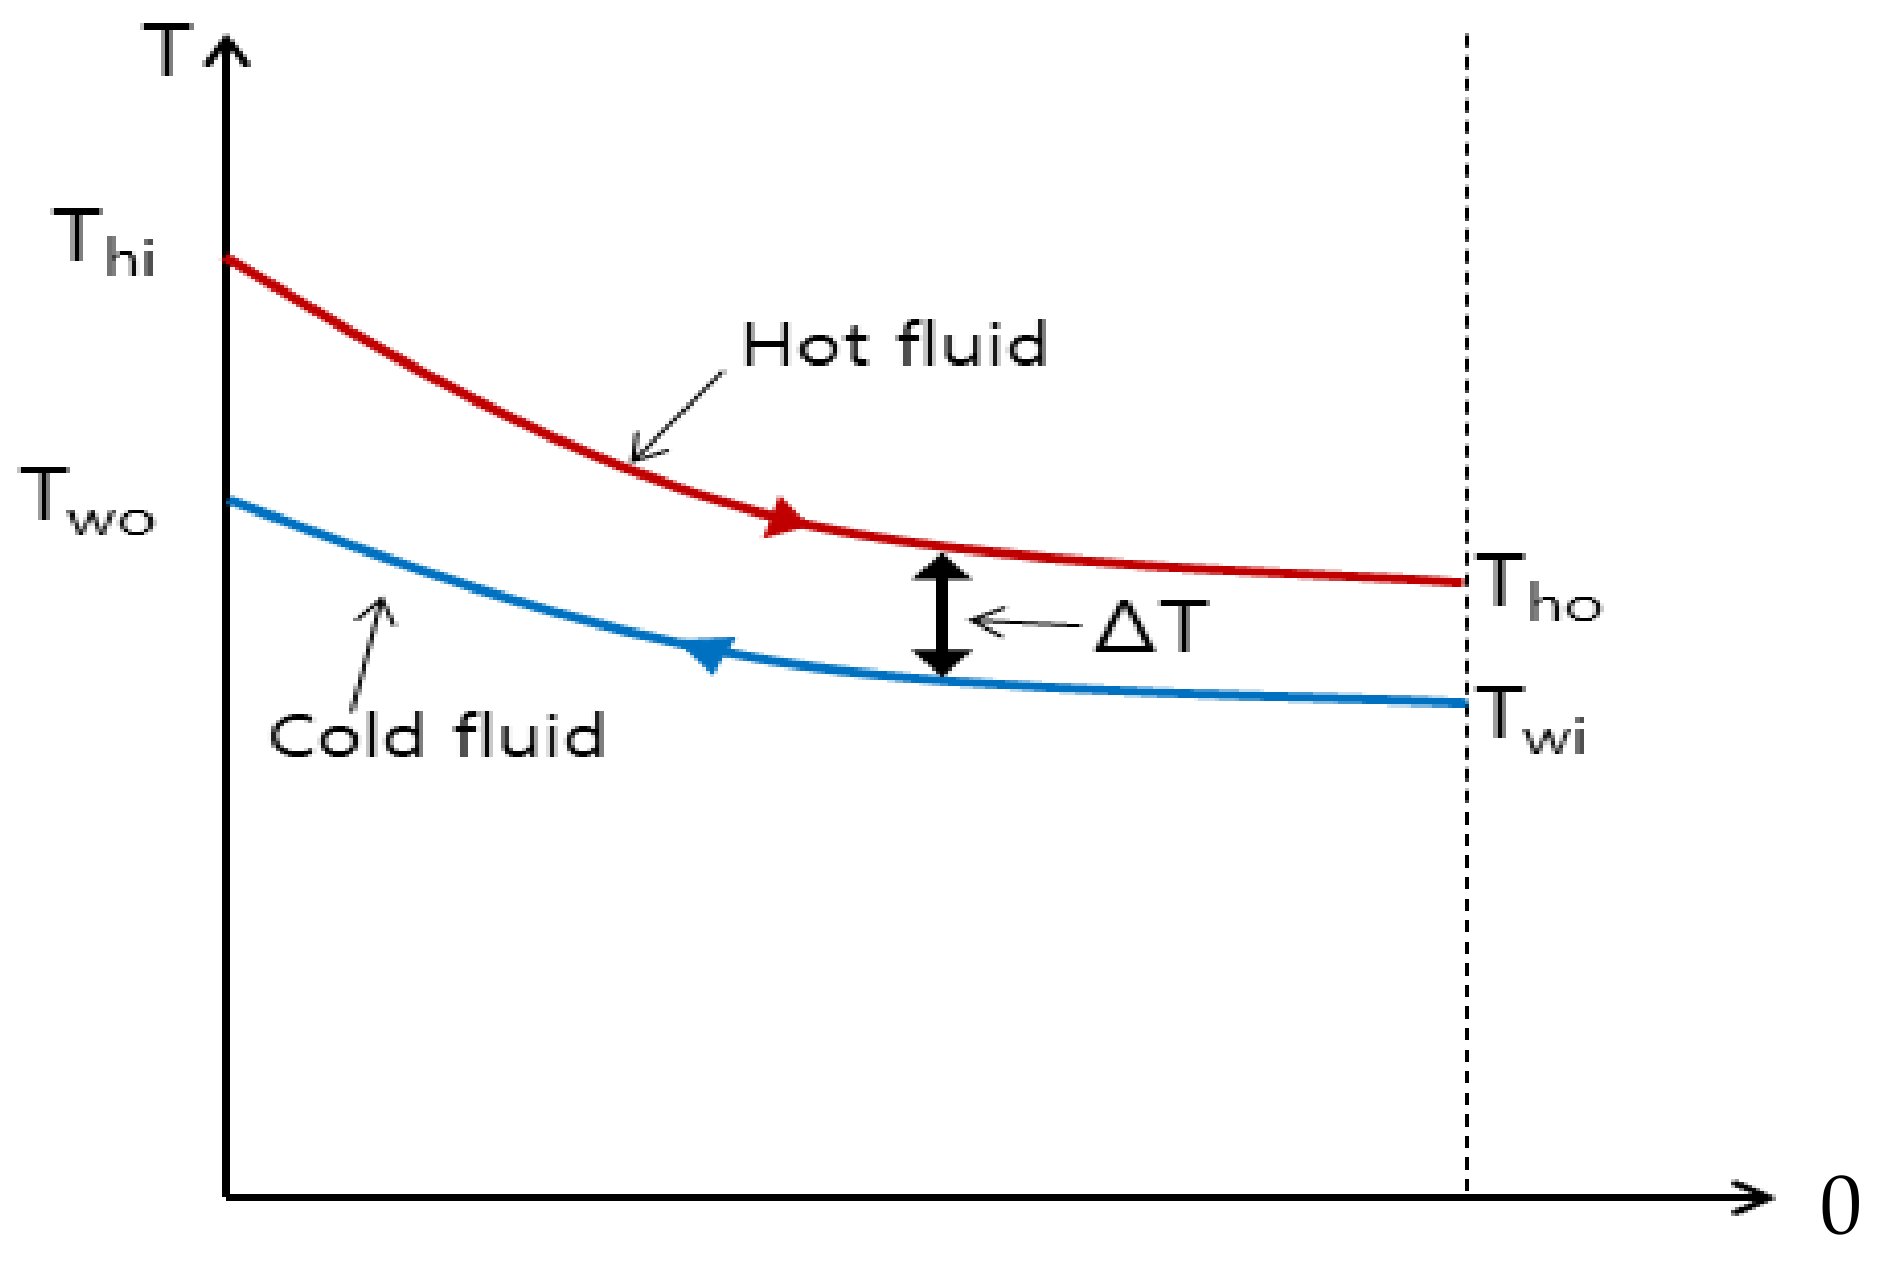
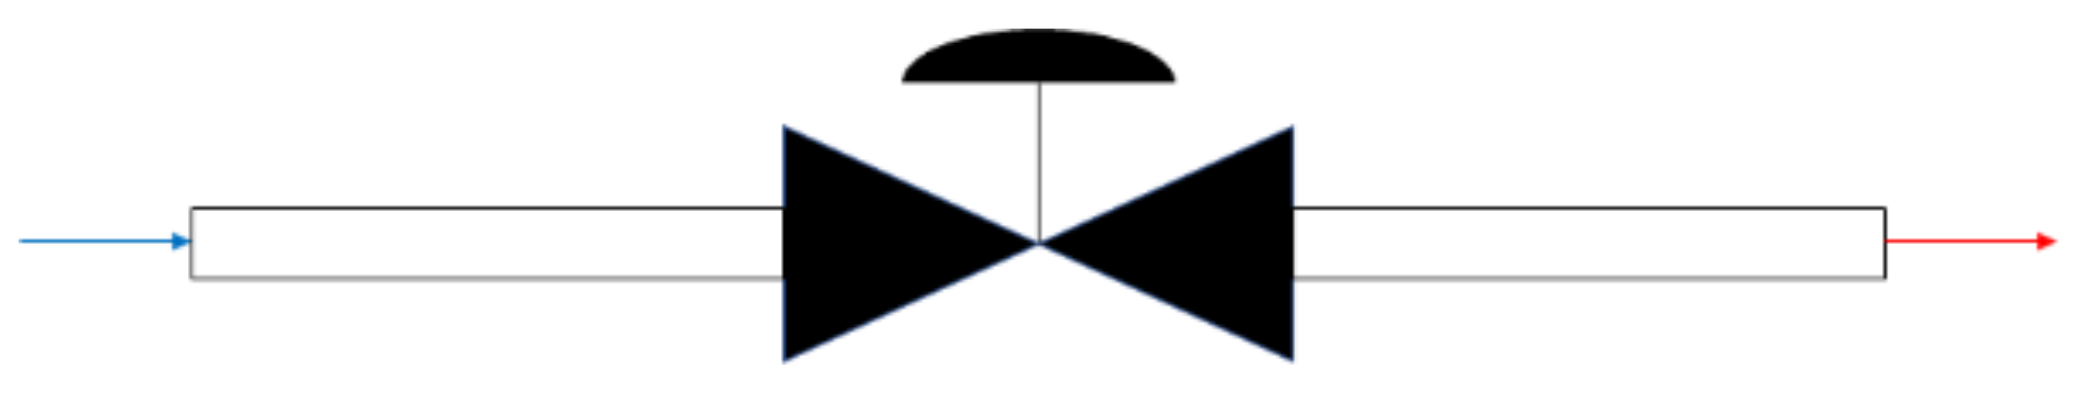
In this paper, we have two main extensions based on previous work reviews. First, we described an experiment involving hydrogen gas in a large storage tank and obtained the data of the pressure sensor during the fast-filling process. A theoretical model for the final temperature and mass of hydrogen gas during filling processes was developed, and analysis of the hydrogen temperature change, the amount of filling of hydrogen, the pressure reducing valve, and the required capacity of the heat exchanger for cooling the high-pressure tank through theoretical and numerical methods. Second, the real gas equation of state and thermodynamic properties were calculated by the National Institute of Standards and Technology (NIST) database: REFPROP 9.5. Final hydrogen mass and final temperature from the theoretical adiabatic condition are estimated based on the mass and energy balance method. Theoretical formulae fit the experimental/simulated data very well. The results of the study will be very useful for future research and development on hydrogen energy and high-pressure hydrogen stations.

2. Hydrogen Filling Modeling

The compression cycle in hydrogen filling returns to the process shown in Figure 1. In this study, the hydrogen supplied at the pressure is compressed to 82 MPa through a compression process, and then the hydrogen is stored in a high-pressure storage tank. This is a system that lowers the pressure and stores it in the buffer tank so the compression cycle can be repeated. Heat is generated during the compression process, storage process and the process of passing the pressure reducing valve. Then, the heated hydrogen is cooled to an appropriate temperature through a heat exchanger. As shown in Figure 1, the first stage and second stage are compressors, and (1), (3), and (5) are heat exchangers, and (2), (4) are pressure reducing valves.
Conducting in an initial vacuum state (as the pressure is very small, we assume that as a vacuum state) is called the “first cycle” and explaining the “second cycle” when there is residual pressure inside the tank. Figure 2 is high-pressure tank for hydrogen storage. The pressure uses a pressure transmitter (P601 series) on the tank; the error of the sensor is ±0.25% [39].

2.1. High-Pressure Tank

Theoretical model of the high-pressure filling process for the compression hydrogen storage tank, as shown in Figure 3. The initial conditions of the system are as follows: the pressure and temperature of the hydrogen compressed to high-pressure through the compressor is 82 MPa, 313.15 K, and the flow rate is 29.05 kg/h. The size of the high-pressure container that enters the hydrogen filling system is the same, with a length of 4.4197 m, an inner diameter of 0.3143 m, an outer diameter of 0.3985 m, the thickness of 0.0842 m, the volume of 0.343 m³, and thermal conductivity of 16.3 W / m · K . The initial state of the hydrogen storage tanks is a vacuum state in the first cycle, and there are residual pressures of 11.3 MPa and 11 MPa, respectively, in the second cycle. As for the air temperature, a value of 302.05 K was used to obtain conservative data. For the properties of hydrogen according to the temperature and pressure data obtained through the REFPROP 9.5 [40] program were used.
The convection between hydrogen and tank wall is divided into two cases: during the fast charging, the convection of the tank wall is dominated by forced convection; during the slow discharge, it is dominated by natural convection. The heat transfer coefficient of forced convection is calculated according to the Reynolds number (Re) and Prandtl number (Pr). There is no way to know the flow region of hydrogen in the tank during calculation because the thermodynamic model is adopted in the paper; thus, some Reynolds numbers cannot be calculated, which means the heat transfer coefficient cannot be obtained. In this case, by combining the document research results, the following assumption is made in the paper concerning the flow of gas in the tank: after hydrogen flows through the inlet valve and enters the tank, it flows to the tank bottom along the wall in a radiation shape, converges in the middle of tank head, and mixes with the hydrogen flowing in near the inlet valve after it flows back along the tank axis. We use the formula to calculate the actual heat transfer coefficient between hydrogen gas and the wall. According to the actual requirements of this study, the correlation of Nusselt number between the hydrogen and the tank wall can be written as follows [41]:
Nu D in = Dh k = 0.14 Re d in 0.67
The application range of the Reynolds number and Rayleigh number are respectively given by:
6.6 × 10 4 <   Re d in < 1.8 × 10 5   and   6.3 × 10 10   <   Ra D int < 1.3 × 10 11
Nu D in   is the Nusselt number based on the inner diameter of tank, which represents the convective heat exchange between hydrogen and the wall.
For the horizontal tank, the convective heat transfer coefficient of the external wall can be calculated by using Equations (3)–(5).
Nu out = 0.752 + 0.387 Ra · f Pr 1 / 6 2    
f Pr = 1 + 0.559 / Pr 9 / 16 16 / 9
h out = Nu out λ L
After calculating the natural convection heat transfer of the external wall by using an empirical formula, it is found that its value shows little change. The main reason is that the temperature change of the external wall is small and there is not much difference in wind speed in the environment. It has been calculated as the constant value in many kinds of literature about the temperature rise of fast-filling. The method is also adopted in this paper by setting it as   40   W / m 2 · K .
Initial data in the tank is shown in Table 4. T i   and   P i   are the temperature and pressure of the filling hydrogen gas; m 1 ,   T 1 ,   P 1 are the initial mass, temperature, and pressure within the tank; T 2 , m 2 , P 2   are the final temperature, mass, and pressure within hydrogen storage tank after filling.

2.2. Heat Exchanger

In the hydrogen compression system, it is a heat exchanger installed to lower the temperature of high-temperature hydrogen before passing through the compressor and entering the high-pressure container. The system’s heat exchanger uses a reverse flow-type double-tube heat exchanger. The double-tube heat exchanger is composed of a single tube and a jacket, and the high-temperature fluid flows through the inner tube. The low-temperature fluid flows outward, and the heat is transferred through the tube wall under normal conditions. The specification of the heat exchanger is shown in Table 5. The double-pipe heat exchanger is shown in Figure 4.

2.3. Pressure Reducing Valve

The pressure reducing valve is a valve used to reduce the fluid pressure, and plays a role in lowering the outlet pressure to a desired pressure by adjusting the high-pressure at the inlet with the adjusting screw and disk in the valve. The pressure reducing valve is shown in Figure 5.
Hydrogen has a very low inversion temperature, resulting in a phenomenon where the Joule–Thomson effect is reversed and the temperature rises. The Joule–Thomson effect appears according to the value of the Joule–Thomson coefficient, and the slope of the isoenthalpy line is the Joule–Thomson coefficient in that state, whose physical significance is the change rate of gas temperature with pressure after the experiment. The expression is shown in Equation (6).
μ JT = ( T P ) h = V C p α T 1
If μ JT is positive, gas temperature reduces with reduction of pressure; on the contrary, gas temperature rises with reduction of pressure. For ideal gas, μ JT = 0; for real gas, it may not be. During the fast-filling of hydrogen, μ JT of hydrogen is negative, which is the rise of gas temperature after throttling, as shown in Figure 6. During the filling of the hydrogen storage tank, the change of pressure in a large range makes the compressed hydrogen have a significant real gas effect with a certain temperature rise, so the hydrogen has throttling effect at different pipes and valve, which leads to a temperature rise of hydrogen gas.

3. Theoretical Results

3.1. Thermodynamic Analysis of the Filling Process

3.1.1. Model Assumptions

The temperature in the tank rises by filling the tank with hydrogen gas at high pressure. The model is analyzed through the following assumptions.
-
The temperature and pressure in the initial hydrogen storage tank are constant.
-
During the high-pressure filling process, the outer wall of the tank of hydrogen natural convective heat transfer coefficient constant. T a m b = 302.05 K. And neglect kinetic energy and gravitational force variations.
-
The temperature of hydrogen entering the tank is constant.
-
The hydrogen gas is evenly distributed in temperature and pressure, and the temperature of the tank wall is also evenly distributed in the hydrogen storage tank
-
The volume of the hydrogen storage tank is constant. As a result, it is possible to ignore the change in potential energy supplied with hydrogen to the hydrogen storage tank and the change in kinetic energy of the high-pressure container through the compressor.
-
The process of high-pressure filling hydrogen into the tank through the compressor is an adiabatic process, and heat exchange with the outside is not performed.

3.1.2. Model Equation

The conservation of mass and energy equations of hydrogen from our previous research [3]. The equations are given by:
Conservation of mass equation:
dm   dt = m ˙ i m ˙ e
Conservation of energy equation
dE   dt = Q ˙ W ˙ + m i ˙ h i m ˙ e h e  
Real gas equation of the state
  P = ρ RT 1 B ρ  
During the high-pressure filling process, the temperature and pressure of compressed hydrogen in the tank will change greatly, so the real gas model with sufficient accuracy must be adopted to accurately describe the change of thermodynamic state of hydrogen. The real gas equation of state was found to be the most suitable. Where, B = 0.007691 m 3 for hydrogen. Compared with the REFPROP 9.5 data, the results obtained from Equation (9) have a relative error of no more than 4% in the range of 300 K< T < 410 K for hydrogen [42].
Solutions of the mass balance of Equation (7) and the energy conservation of Equation (8) are as follows:
m 2 h i u 2 = m 1 h i u 1
u = c v T   ,           h = c p T  
From Equations (10) and (11), the following equations are obtained:
Q = m 2 c v 2 T 2 m 1 c v 1 T 1 m 2 m 1 c p 0 T i
Using the real gas equation of state, the following equation is obtained:
T 2 = P 2 T 0 c p 0 + P 2 B R RQ V + P 1 c v 1 T 1 R RT 1 + BP 1 P 1 c p 0 T i R RT 1 + BP 1 P 2 c v 2 RQ V P 1 T 1 c v 1 R RT 1 + BP 1 + P 1 T i c p 0 R RT 1 + BP 1

3.2. High-Pressure Tank for First Cycle Analysis

The first cycle is a vacuum and Q = 0, the Equation (13) can be obtained:
T 2 = c p 0 c v 2 T i
Specific heat coefficients c p   and   c v were calculated by using the REFPROP 9.5, a program produced and supplied by the National Institute of Standards and Technology (NIST). The transfer of the tank wall and inner wall consists of three parts, convection between the flow of high-temperature hydrogen in the tank and the tank wall, heat conduction in the wall surface, and convection between the external wall and the surroundings, as shown in Figure 7. Heat transfer between the hydrogen in the high-pressure container and the external air occurs on the surface of the high-pressure container and occurs in the form of conduction and convection. Radiant heat transfer was neglected because of the difference between the surface of the high-pressure tank and the outside temperature was expected to be relatively small [43].
Q ˙ = Q ˙ 1 + Q ˙ 2 = Δ T R 1 + Δ T R 2
T 1 T w 1 R 1 = Q ˙ ave , T 2 + T 2 R 2 = Q ˙ ave
where Q ˙ 1 is the heat transfer rate of the hydrogen storage tank, Q ˙ 2 is the heat transfer rate on both sides of the hydrogen storage tank. The heat transfer rate from the center of the container to the outside is equal to the sum of the heat transfer rate at the cylindrical part and the heat transfer rate at the side of the container, as shown in Equation (16). Immediately after high-pressure filling is completed, the temperature of the inner wall and the outer wall of the tank is determined by the temperature difference between hydrogen in the tank and external air, and the heat transfer phenomenon from the tank to the outside.
The result values for the buffer tank and high-pressure tank were shown in Table 6, and were calculated using the same method as obtained for the high-pressure tank of the first cycle of analysis.

3.3. High-Pressure Tank Second Cycle Analysis

As in the first cycle, the inflow temperature and pressure supplied through the compressor and heat exchanger are the same as 82 MPa and 313.15 K, but there is a residual pressure of 11.3 MPa after the first cycle in the high-pressure tank. When hydrogen gas is supplied and filled in a high-pressure tank with residual pressure, the temperature of the hydrogen tank can be expressed as shown in Equation (17):
T 2 = P 2 T 0 c p 0 + P 2 B R RQ V + P 1 c v 1 T 1 R RT 1 + BP 1 P 1 c p 0 T i R RT 1 + BP 1 P 2 c v 2 RQ V P 1 T 1 c v 1 R RT 1 + BP 1 + P 1 T i c p 0 R RT 1 + BP 1  
During the high-pressure filling process, Q = 0. The following equation is obtained:
  T 2 = P 2 T 0 c p 0 + P 2 B R P 1 c v 1 T 1 R RT 1 + BP 1 P 1 c p 0 T i R RT 1 + BP 1 P 2 c v 2 P 1 T 1 c v 1 R RT 1 + BP 1 + P 1 T i c p 0 R RT 1 + BP 1
The Equation (18) can be simplified as:
  T 2 = P 2 T i c p 0 RT 1 + P 1 T 1 c v 1 BP 2 P 2 c v 2 RT 1 + P 2 c v 2 BP 1 P 1 c v 1 RT 1 + P 1 T i c p 0 R  
The calculation of final temperature was based on the experimental pressure data from the reference [32]. The final temperature during this time with different equations is shown in Figure 8. It can be seen from the curve in Figure 8 that the curve of the fitting formula of Song et al. [31] is a little higher than the other. The reason for this situation may be ignored heat transfer. In the initial stage of high-pressure filling, the final temperatures have little difference. As the pressure increases, the difference in temperature rise becomes larger.
In addition to the value of T 2 , the other values were calculated by the same method as in first cycle. The resulting values for the buffer tank and high-pressure tank are shown in Table 7, and were calculated using the same method as the high-pressure tank.
The rise of hydrogen gas pressure over time is shown in Figure 9. It can be seen that the pressure basically increases linearly. Figure 10 shows the corresponding temperature valuations by using an accurate equation for the temperature rise calculation of the storage tank. The upward trends of (a) and (b) are basically the same. The error is obtained from the linear regression of the experimental pressure measurement. In the initial stage of fast-filling, the temperature rises grow rapidly, and as the ratio of the termination pressure to the initial pressure decreases, the temperature rises gradually increases slowly and remains stable towards the end of the filling process.

4. Hydrogen Compressor Heat Exchanger Analysis

The heat exchanger section is (1), (2) and (5), as shown in Figure 1. The heat capacity required in the firstcycle and the second cycle is the same through the heat exchanger (1). On the other hand, in heat exchangers (3) and (5), the hydrogen that h passed through the pressure-reducing valve flows into the heat exchanger and heat exchange with the cooling water occurs. The required capacity to reach the target temperature was calculated using the Log Mean Temperature Difference (LMTD) method. The working principle of the heat exchanger is shown in Figure 11.
  m h ˙ c ph Δ T h = m ˙ w c pw Δ T w  
Q ˙ = U total A totol Δ T
In order to obtain the necessary refrigeration capacity of the heat exchanger, the total heat transfer coefficient U t o t a l is required, which can be obtained through the heat transfer coefficient values of hydrogen and cooling water. The heat transfer rate through the heat exchanger has the same value in the hydrogen and cooling water. The Re number in the cooling water, which is an annular tube, was calculated using the hydraulic diameter, to determine laminar and turbulent flow.
Sieder Tate   equation : Nu = hD k = 1.86 DRePr L 1 3 Modified   Dittus Boelter   equation : Nu = hD k = 0.023 Re 0.8 Pr n
The Nu number is obtained by Equation (21), and the n-value has a value of 0.3 when the fluid is cooled and 0.4 when the fluid is heated.
LMTD = T hi T wi T h 0 T w 0 ln T hi T wi / T ho T w 0
In a double-tube heat exchanger, the temperature difference is obtained by using the log mean temperature difference (LMTD) using the temperature difference of two fluids at both ends. Using the same method, the required refrigeration capacity of heat exchangers (3) and (5) was calculated by different conditions in the first cycle and the second cycle, as shown in Table 8.

5. Conclusions

In current hydrogen filling systems, hydrogen is compressed and stored at high pressure in a tank through a compressor. In this process, the internal pressure of the tank increases, and thermal stress may occur due to the temperature rise of the hydrogen. In order to secure the reliability of the high-pressure tank, it is important to study and predict the temperature rise of hydrogen gas. In this paper, the change in the hydrogen’s temperature in the tank according to the pressure rise during the process of filling the high-pressure tank in an 82 MPa hydrogen filling system. As such, the final temperature, the amount of filling of hydrogen gas, the pressure-reducing valve, and the change and the performance of the heat exchanger for cooling high-temperature hydrogen were analyzed by theoretical and numerical methods.
As a result of the study, the following conclusions were drawn. First, as a result of the theoretical approach, the internal temperature of the high-pressure tank was calculated to increase by 436.09 K and 376.55 K on average in the first cycle and the second cycle. Second, the hydrogen filling amount in the high-pressure tank and the buffer tank increased by 11.58 kg and 3.49 kg, respectively, in the first cycle, and increased by 9.44 kg and 1.61 kg, respectively, in the second cycle. The amount of increased temperature decreased as the cycle continued.
In this paper, the thermal insulation condition was assumed during the charging process, and the heat transfer condition to the surroundings after charging was completed and was analyzed considering only conduction and convection. Considering the abnormal heat transfer process, not the adiabatic condition, and the radiant heat transfer, the time at which thermal equilibrium takes place will be different. In the future, we will consider the above to more accurately determine the temperature and thermal equilibrium. The works of this paper will be useful for system design and operation in industrial sites that require a hydrogen compression system.

Author Contributions

Conceptualization, J.-T.K. and K.P.; methodology, J.-T.K.; software, J.-Q.L.; validation, S.-J.J. and J.-T.K.; formal analysis, J.-C.L.; investigation, J.-Q.L.; resources, K.P.; data curation, S.-J.J.; writing—original draft preparation, J.-Q.L.; writing—review and editing, J.-Q.L.; visualization, J.-C.L.; supervision, J.-T.K.; project administration, S.-J.J. and K.P.; funding acquisition, S.-J.J. and K.P. All authors have read and agreed to the published version of the manuscript.

Funding

This study was a research project conducted by the Ministry of Trade, Industry and Energy and supported by the Korea Energy Technology Evaluation Institute (KETEP) as an energy technology development project. (No. 2017301004138, No. 20183010041940).

Institutional Review Board Statement

Not applicable.

Informed Consent Statement

Not applicable.

Data Availability Statement

Not applicable.

Conflicts of Interest

The authors declare no conflict of interest.

Nomenclature

A in   Internal surface area of tank, (m2)
A out   External surface area of tank, (m2)
A total   Total surface area, (m2)
h 1 Internal heat exchange coefficient between hydrogen and tank wall, (W/m2·K)
h 2 External heat exchange coefficient between tank wall and ambient fluid, (W/m2·K)
h i   ˙ Specific enthalpy of incoming gas, (J/kg)
h ˙ e Specific enthalpy of outflow gas, (J/kg)
c p   Specific heat capacity of the hydrogen gas at constant pressure, (J/kg·K)
c v   Specific heat capacity of the hydrogen gas at constant volume, (J/kg·K)
d in   Injector diameter, (m)
D in     Internal diameter of the tank, (m)
D out External diameter of the tank, (m)
LLength, (m)
MHydrogen mass within the tank, (kg)
m 1 m 2 Initial and settled mass in the tank, (kg)
m   i ˙ Mass flow rate into the tank, (kg/s)
m e ˙ Mass outflow rate for discharge process, (kg/s)
Nu in Nusselt number of the gas, dimensionless.   Nu = D h k = 0.14 R e d i n 0.67
Re d in   Reynolds number of the flow based on tank internal diameter, R e d i n = 4 m ˙ π μ d i n
Ra D in Rayleigh number of the gas.
PHydrogen pressure in the tank, (MPa)
P i Settled pressure of hydrogen gas in the tank, (MPa)
P 1   P 2 Initial and settled pressure within the tank, (MPa)
P 2 Final hydrogen pressure, (MPa)
t * Characteristic time, t * = m 0 / m ˙   f o r   f i l l i n g
THydrogen temperature in the tank (K)
T 1 The initial temperature of gas, (K)
T i Temperature of filling hydrogen gas, (K)
T 2 Final temperature of hydrogen gas in the tank, (K)
T amb The ambient temperature, T amb =302.05 K
T * Characteristic temperature, K
USpecific internal energy, (J/kg).
KThermal conductivity (W/m· K.)
Ρ Hydrogen density, (kg/m3)
BAbel-Nobel constant, B=0.007691 m3 for hydrogen gas
R 1 The total thermal resistance in the tank, (K/W)
R 2 The total thermal resistance of the side, (K/W)
R g Gas constant, J/mol K
QHeat transferring to ambient, (kJ)
Q ˙ Heat transfer rate (W)
U total Total heat transfer coefficient
α Constant of compression, α = 1.9155 × 10 6 k/Pa
λ Ratio of specific heat under the constant of volume to that under pressure.
ZCompressibility factor
ψ f ,   1 2 T h e   e n e r g y   e f f i c i e n c y
Τ Dimensionless time, τ = t / t *
Subscripts
h hydrogen;
w water;

References

  1. Kim, Y.M.; Gil Shin, D.; Kim, C.G. On-Board Cold Thermal Energy Storage System for Hydrogen Fueling Process. Energies 2019, 12, 561. [Google Scholar] [CrossRef] [Green Version]
  2. Li, M.; Bai, Y.; Zhang, C.; Song, Y.; Jiang, S.; Grouset, D.; Zhang, M. Review on the research of hydrogen storage system fast refueling in fuel cell vehicle. Int. J. Hydrog. Energy 2019, 44, 10677–10693. [Google Scholar] [CrossRef] [Green Version]
  3. Li, J.-Q.; Myoung, N.-S.; Kwon, J.-T.; Jang, S.-J.; Lee, T.; Lee, Y.-H. A theoretical analysis of temperature rise of hydrogen in high-pressure storage cylinder during fast filling process. Adv. Mech. Eng. 2020, 12, 1–10. [Google Scholar] [CrossRef]
  4. Li, J.-Q.; Kwon, J.-T.; Jang, S.-J. The Power and Efficiency Analyses of the Cylindrical Cavity Receiver on the Solar Stirling Engine. Energies 2020, 13, 5798. [Google Scholar] [CrossRef]
  5. Deng, S.; Xiao, J.; Bénard, P.; Chahine, R. Determining correlations between final hydrogen temperature and refueling parameters from experimental and numerical data. Int. J. Hydrog. Energy 2020, 45, 20525–20534. [Google Scholar] [CrossRef]
  6. Chen, J.; Veenstra, M.; Purewal, J.; Hobein, B.; Papasavva, S. Modeling a hydrogen pressure regulator in a fuel cell system with Joule–Thomson effect. Int. J. Hydrog. Energy 2019, 44, 1272–1287. [Google Scholar] [CrossRef]
  7. Mori, D.; Hirose, K. Recent challenges of hydrogen storage technologies for fuel cell vehicles. Int. J. Hydrog. Energy 2009, 34, 4569–4574. [Google Scholar] [CrossRef]
  8. Mehrizi, M.Z.; Abdi, J.; Rezakazemi, M.; Salehi, E. A review on recent advances in hollow spheres for hydrogen storage. Int. J. Hydrog. Energy 2020, 45, 17583–17604. [Google Scholar] [CrossRef]
  9. Zhou, P.; Liu, Q.; Sui, J.; Jin, H. Research progress in chemical hydrogen storage. Prog. Chem. Ind. 2014, 8, 2004–2011. [Google Scholar]
  10. Krishna, R.; Titus, E.; Salimian, M.; Okhay, O.; Rajendran, S.; Rajkumar, A.; Sousa, J.M.G.; Ferreira, A.L.C.; Campos, J.; Gracio, J.C.G.A.J. Hydrogen Storage for Energy Application. In Hydrogen Storage; IntechOpen: London, UK, 2012; pp. 243–266. [Google Scholar]
  11. Weisberg, A.H.; Aceves, S.M.; Espinosa-Loza, F.; Ledesma-Orozco, E.; Myers, B.; Spencer, B. Cold hydrogen delivery in glass fiber composite pressure tanks: Analysis, manufacture and testing. International J. Hydrog. Energy 2013, 38, 9271–9284. [Google Scholar] [CrossRef]
  12. Wang, Y.; Dai, X.; You, H.; Gao, M. Research on the design of hydrogen supply system of 70 MPa hydrogen storage cylinder for vehicles. Int. J. Hydrog. Energy 2018, 43, 19189–19195. [Google Scholar] [CrossRef]
  13. Abdalla, A.M.; Hossain, S.; Nisfindy, O.B.; Azad, A.T.; Dawood, M.; Azad, A.K. Hydrogen production, storage, transportation and key challenges with applications: A review. Energy Convers. Manag. 2018, 165, 602–627. [Google Scholar] [CrossRef]
  14. Züttel, A. Hydrogen storage methods. Naturwissenschaften 2004, 91, 157–172. [Google Scholar] [CrossRef]
  15. Ren, J.; Musyoka, N.M.; Langmi, H.W.; Mathe, M.; Liao, S. Current research trends and perspectives on materials-based hydrogen storage solutions: A critical review. Int. J. Hydrog. Energy 2017, 42, 289–311. [Google Scholar] [CrossRef]
  16. Sakintuna, B.; Lamari-Darkrim, F.; Hirscher, M. Metal hydride materials for solid hydrogen storage: A review. Int. J. Hydrog. Energy 2007, 32, 1121–1140. [Google Scholar] [CrossRef]
  17. Züttel, A. Materials for hydrogen storage. Mater. Today 2003, 6, 24–33. [Google Scholar] [CrossRef]
  18. American National Standards Institude. ANSI HGV 2: Compressed Hydrogen Gas Vehicle Fuel Containers; American National Standards Institude: Washington, DC, USA, 2014. [Google Scholar]
  19. Kim, S.C.; Lee, S.H.; Yoon, K.B. Thermal characteristics during hydrogen fueling process of type IV cylinder. Int. J. Hydrog. Energy 2010, 35, 6830–6835. [Google Scholar] [CrossRef]
  20. Suryan, A.; Kim, H.D.; Setoguchi, T. Three dimensional numerical computations on the fast filling of a hydrogen tank under different conditions. Int. J. Hydrog. Energy 2012, 37, 7600–7611. [Google Scholar] [CrossRef]
  21. Zheng, J.; Li, L.; Chen, R.; Xu, P.; Kai, F. High Pressure Steel Storage Vessels Used in Hydrogen Refueling Station. J. Press. Vessel. Technol. 2008, 130, 014503. [Google Scholar] [CrossRef]
  22. Liu, Y.-L.; Zhao, Y.-Z.; Zhao, L.; Li, X.; Chen, H.-G.; Zhang, L.-F.; Zhao, H.; Sheng, R.-H.; Xie, T.; Hu, D.-H. Experimental studies on temperature rise within a hydrogen cylinder during refueling. Int. J. Hydrog. Energy 2010, 35, 2627–2632. [Google Scholar] [CrossRef]
  23. Hosseini, M.; Dincer, I.; Naterer, G.; Rosen, M. Thermodynamic analysis of filling compressed gaseous hydrogen storage tanks. Int. J. Hydrog. Energy 2012, 37, 5063–5071. [Google Scholar] [CrossRef]
  24. Yang, J.C. A thermodynamic analysis of refueling of a hydrogen tank. Int. J. Hydrog. Energy 2009, 34, 6712–6721. [Google Scholar] [CrossRef]
  25. Wang, G.; Zhou, J.; Hu, S.; Dong, S.; Wei, P. Investigations of filling mass with the dependence of heat transfer during fast filling of hydrogen cylinders. Int. J. Hydrog. Energy 2014, 39, 4380–4388. [Google Scholar] [CrossRef]
  26. Monde, M.; Woodfield, P.; Takano, T.; Kosaka, M. Estimation of temperature change in practical hydrogen pressure tanks being filled at high pressures of 35 and 70 MPa. Int. J. Hydrog. Energy 2012, 37, 5723–5734. [Google Scholar] [CrossRef]
  27. Zhao, Y.; Liu, G.; Liu, Y.; Zheng, J.; Chen, Y.; Zhao, L.; Guo, J.; He, Y. Numerical study on fast filling of 70 MPa type III cylinder for hydrogen vehicle. Int. J. Hydrog. Energy 2012, 37, 17517–17522. [Google Scholar] [CrossRef]
  28. Li, Q.; Zhou, J.; Chang, Q.; Xing, W. Effects of geometry and inconstant mass flow rate on temperatures within a pressurized hydrogen cylinder during refueling. Int. J. Hydrog. Energy 2012, 37, 6043–6052. [Google Scholar] [CrossRef]
  29. Xiao, J.; Bénard, P.; Chahine, R. Estimation of final hydrogen temperature from refueling parameters. Int. J. Hydrog. Energy 2017, 42, 7521–7528. [Google Scholar] [CrossRef]
  30. Zhou, X.; Yang, T.; Xiao, J.; Bénard, P.; Chahine, R. Estimation of filling time for compressed hydrogen refueling. Energy Procedia 2019, 158, 1897–1903. [Google Scholar] [CrossRef]
  31. Song, B.-H.; Myoung, N.-S.; Jang, S.-J.; Kwon, J.-T. Hydrogen Compressor Cycle Analysis for the Operating Pressure of 50 MPa and High Charging Capacity. J. Korea Acad. Ind. Coop. Soc. 2020, 2, 66–73. [Google Scholar]
  32. Hirotani, R.; Terada, T.; Tamura, Y.; Mitsuishi, H.; Watanabe, S. Thermal Behavior in Hydrogen Storage Tank for Fuel Cell Vehicle on Fast Filling. SAE Tech. Pap. 2007. [Google Scholar] [CrossRef]
  33. Khan, T.I.; Monde, M.; Setoguchi, T. Hydrogen gas filling into an actual tank at high pressure and optimization of its thermal characteristics. J. Therm. Sci. 2009, 18, 235–240. [Google Scholar] [CrossRef]
  34. Woodfield, P.L.; Monde, M.; Takano, T. Heat Transfer Characteristics for Practical Hydrogen Pressure Vessels Being Filled at High Pressure. J. Therm. Sci. Technol. 2008, 3, 241–253. [Google Scholar] [CrossRef] [Green Version]
  35. Woodfield, P.L.; Monde, M.; Mitsutake, Y. Measurement of Averaged Heat Transfer Coefficients in High-Pressure Vessel during Charging with Hydrogen, Nitrogen or Argon Gas. J. Therm. Sci. Technol. 2007, 2, 180–191. [Google Scholar] [CrossRef] [Green Version]
  36. Dicken, C.; Mérida, W. Temperature Distribution within a Compressed Gas Cylinder during Fast Filling. In THERMEC 2006 Supplement; The University of British Columbia: Vancouver, BC, Canada, 2006; Volume 15, pp. 281–286. [Google Scholar]
  37. Dicken, C.; Mérida, W. Measured effects of filling time and initial mass on the temperature distribution within a hydrogen cylinder during refuelling. J. Power Sources 2007, 165, 324–336. [Google Scholar] [CrossRef]
  38. Zheng, J.; Guo, J.; Yang, J.; Zhao, Y.; Zhao, L.; Pan, X.; Ma, J.; Zhang, L. Experimental and numerical study on temperature rise within a 70 MPa type III cylinder during fast refueling. Int. J. Hydrog. Energy 2013, 38, 10956–10962. [Google Scholar] [CrossRef]
  39. Li, J.Q.; Myoung, N.S.; Kwon, J.T.; Jang, S.J.; Lee, T. A Study on the Prediction of the Temperature and Mass of Hydrogen Gas inside a Tank during Fast Filling Process. Energies 2020, 13, 6428. [Google Scholar] [CrossRef]
  40. NIST. Reference Fluid Thermodynamic and Transport Properties Database: Version 9.5; NIST: Gaithersburg, MD, USA, 2019. [Google Scholar]
  41. Bourgeois, T.; Ammouri, F.; Weber, M.; Knapik, C. Evaluating the temperature inside a tank during a filling with highly-pressurized gas. Int. J. Hydrog. Energy 2015, 40, 11748–11755. [Google Scholar] [CrossRef]
  42. Winters, B. 70MPa Fast-Fill Modeling & Validation; Sandia National Laboratories: Albuquerque, NM, USA, 2010. [Google Scholar]
  43. Bergman, T.L.; Incropera, F.P.; DeWitt, D.P.; Lavine, A.S. Fundamentals of Heat and Mass Transfer; John Wiley & Sons: Hoboken, NJ, USA, 2011. [Google Scholar]
Figure 1. Hydrogen compression system.
Energies 14 02635 g001
Figure 2. High-pressure tank for hydrogen storage
Energies 14 02635 g002
Figure 3. Simplified high-pressure tank modeling.
Energies 14 02635 g003
Figure 4. Temperature distributions for a counter-flow heat exchanger.
Energies 14 02635 g004
Figure 5. Pressure reducing valve.
Energies 14 02635 g005
Figure 6. Joule–Thomson effect.
Energies 14 02635 g006
Figure 7. Temperature differences of the wall reference on the side of the hydrogen storage tank.
Energies 14 02635 g007
Figure 8. Final temperature during the time with different equations.
Energies 14 02635 g008
Figure 9. The experimental results of the pressure measurement over time. (a) The pressure value of the high-pressure tank for the second cycle; (b) pressure value of the buffer tank for the second cycle.
Energies 14 02635 g009
Figure 10. The theoretical results of the temperature for the second cycle. (a) Temperature values of the high-pressure tank, and (b) temperature values of the buffer tank.
Energies 14 02635 g010
Figure 11. The heat exchanger. (a) Counter-flow heat exchanger; (b) working principle diagram of the heat exchanger.
Energies 14 02635 g011
Table 1. Types and comparisons of high-pressure hydrogen storage.
ClassificationTypeFeaturesComments
High-pressure storageCompressed hydrogenHigh efficiency, low energy consumption, simple equipment structureHigh material cost
Liquid hydrogen storageLiquefied low-temperature hydrogenHigh-quality hydrogen storage densityHigh energy consumption and complex equipment
Chemical hydrogen storageMetal hydrideHigh safety, high purity, and high hydrogen storage density.High cost of hydrogen storage and the chemical reaction process is difficult
Physical hydrogen storagePorous coordination networkHigh hydrogen storage densityUltra-low temperature, Complex equipment structure
Table 2. Comparison of hydrogen storage tanks.
TypesMaterialsAdvantagesComments
Type IAll MetalHeavy, internal corrosion, low hydrogen storage densityFor hydrogen stations
Type IIHoop-wrapped tank with inner containerHeavy, short life, serious hydrogen embrittlement problemFor industrial
Type IIIMaterials (Liner, Composite shell)Lightweight, high burst pressure, no permeationVehicular use.
Type IVCarbon fiber-reinforced polymerLightweight, lower burst pressure. Permeation through liner. High material costVehicular use. Longer life
Table 3. Theoretical studies of final temperature.
AuthorEquationsParameter
Liu et al. [22] T 2 = λ μ T 1 T 1 + α P 1 α ( λ P 1 T 1 P 1 T 1 ) T 1 + α P 1 + α T 1 P 1 T 1 P 1 P 2 Pv R g T = 1 + α P T
α = 1.9155 × 10 6 K / Pa
M.H et al. [23] m 1 ex 1 + m i ˙ tex i = m 2 ex 2 + I filling
ψ f , 1 2 = m 2 ex 2 m 1 ex 1 + m ˙ i t ex i
m ˙ i = dm i dt
ψ f ,   1 2 : The   energy   efficiency
Yang et al. [24] dU = δ Q δ W + h e dn e
N i + Kt du / dt + uK = Q ˙ + h e K
N = N i + Kt
Q ˙ = dQ / dt
Wang et al. [25] T 2 = P 1 T 1 V + λ T 0 RT 1 + α TP 1 mdt P 1 V + RT 1 + α TP 1 mdt α = 1.9155 × 10 6 K / Pa
λ = c p / c v
Li et al. [28] T 2 = m 1 aT 1 b + h e m ˙ dt + qdt a m 1 + m ˙ dt u = α T b
m 2 = m 1 + m ˙ dt
Xiao et al. [29] dT dt = 1 + α T * T t * + t
T * = γ T + α T f / 1 + α
t * = m 0 / m ˙ ,   τ = t / t *
T * : Characteristic   temperature
Zhou et al. [30] T * T T * T 0 = 1 1 + τ 1 + α
t   = 1 T T 0 k t ( 1 P 0 T 1 + β P / T / P 0 T 1 + β P 0 / T 0 ) γ T T + P 0 T 1 + β P / T / P 1 + β P 0 / T 0
t * = 1 T T 0 ( 1 P 0 T 1 + β P / T / P 0 T 1 + β P 0 / T 0 ) γ T T + P 0 T 1 + β P / T / P 1 + β P 0 / T 0
Song et al. [31] 1 T 2 = 1 T 1 T 1 c p i T i c v 2 P 1 Z 2 c v 1 P 2 Z 1 + P 1 Z 2 P 2 Z 1 PV = ZmRT
Table 4. Initial data of cycle system of the hydrogen storage tanks.
First Cycle
High-Pressure TankBuffer Tank
P i (MPa)82 P i (MPa)23
T i (K)313.15 T i (K)313.15
P 1 (MPa)0 P 1 (MPa)0
T 1 (K)0 T 1 (K)0
m 1 (kg)0 m 1 (kg)0
P 2 (MPa)820 P 2 (MPa)20
T 2 (K)Final temperature T 2 (K)Final temperature
m 2 (kg)Final mass m 2 (kg)Final mass
Second Cycle
High-Pressure TankBuffer Tank
P i (MPa)82 P i (MPa)23
T i (K)313.15 T i (K)313.15
P 1 (MPa)11.3 P 1 (MPa)11
T 1 (K)300.15 T 1 (K)304.55
m 1 (kg)2.82 m 1 (kg)2.74
P 2 (MPa)82 P 2 (MPa)20
T 2 (K)Final temperature T 2 (K)Final temperature
m 2 (kg)Final mass m 2 (kg)Final mass
Table 5. Heat exchanger specification.
L(m) ID a (m) OD p (m) ID p m m ˙ h (kg/s) T wi K T wo K T ho K
40.03550.01430.00790.0081280.15285.15303.15
Table 6. Results of the first cycle of the compressed hydrogen storage tanks.
ConditionHigh-Pressure TankBuffer Tank
P 2 (MPa)8220
T 2 (K)436.09440.15
m 2 (kg)11.583.49
Q(kJ)23125.097071.45
R 1 (K/W)0.007060.00716
R 2 (K/W)0.625
Q ˙ 1 (kW)18.9917.71
Q ˙ 2 (kW)0.2140.2006
Q ˙ ave (kW)9.619.76
T w 1 (K)417.75420.64
T w 2 (K)343.55344.18
Table 7. Results of the second cycle of the compressed hydrogen storage tanks.
ConditionHigh-Pressure TankBuffer Tank
P 2 (MPa)8220
T 2 (K)403.55345.69
m 1 (kg)2.822.74
m 2 (kg)12.264.35
Q(kJ)18599.902794.74
R 1 (K/W)0.007060.00716
R 2 (K/W)0.625
Q ˙ 1 (kW)14.386.10
Q ˙ 2 (kW)0.1620.061
Q ˙ ave (kW)7.273.082
T w 1 (K)389.66339.53
T w 2 (K)333.48315.38
Table 8. Heat exchanger performance required in the first cycle and second cycle.
(1)H/X(3)H/X(5)H/X
T hi (K)323.151st cycle2nd cycle1st cycle2nd cycle
446.59413.15443.15347.65
Q ˙ h KJ / s 1.21515.81611.87215.3204.068
m ˙ w ( kg / s )0.05780.7530.5650.7290.194
h ˙ w W / m 2 K 204.272666.862120.512600.36901.40
h ˙ h W / m 2 K 1615.251435.401369.531420.151372.16
U total W / m 2 K 181.333933.146832.112918.515544.022
Δ T K 24.7577.6767.38876.6444.89
Q ˙ RT 0.1863.0042.3242.9181.012
Publisher’s Note: MDPI stays neutral with regard to jurisdictional claims in published maps and institutional affiliations.

