1. Introduction
Climate change is a global phenomenon that must be acknowledged by countries because its effects are felt regardless of national borders. Its consequences include global warming, variability in climatic conditions, and massive depletion of biodiversity. Due to these environmental impacts, countries are initiating efforts to combat anthropogenic climate change by abating greenhouse gas emissions. Initiatives for sectoral decarbonization are happening on a global scale. In the energy sector, the continued increase and improvement of renewable energy technologies prove to be useful in decarbonizing electricity generation. However, despite this effort, decarbonization of the transport sector remains a challenge. This is one of the sectors in which green hydrogen may provide a decarbonization option [
1].
Hydrogen is attracting significant interest in New Zealand. With potential applications including energy storage, industrial heating, chemical feedstock, and green fuel, hydrogen holds a vast potential as an alternative energy vector. The New Zealand Government recognizes the need to explore hydrogen in order to meet climate change commitments, such as the 2015 Paris agreement and net-zero carbon emissions by 2050 [
2]. A high share of renewables in the electricity mix [
3] places New Zealand in a position to produce green hydrogen from renewable electricity sources through electrolysis.
Emissions growth in the road transport sector is responsible for an overall increase in New Zealand’s greenhouse gas emissions. In 2017, road transport accounted for about 14.5 million tonnes of CO
2-equivalent, or around 18% of total greenhouse gas emissions in New Zealand [
4]. In particular, the heavy vehicle fleet is hard to decarbonize because penetration of battery technology is difficult [
5].
This paper examines the feasibility of green hydrogen as a transport fuel for very heavy vehicles (VHVs) in New Zealand. VHVs are defined as those vehicles with gross vehicle mass that exceeds 30 tonnes [
6]. Green hydrogen fuel is attractive for VHVs for several reasons. First, VHVs tend to have definite travel patterns with routine back-to-base trips, suitable to be serviced by centralized hydrogen refuelling facilities. Second, the growth of heavy traffic is correlated with GDP because economic growth necessitates road freight activities [
7]. Third, heavy vehicles consume diesel, a non-renewable fuel with local prices that are greatly influenced by international price volatility [
8]. Therefore, green hydrogen that is produced in New Zealand could potentially decarbonize VHVs without compromising road freight activities in a growing economy. To achieve this, green hydrogen demand must be estimated from diesel consumed by all VHVs [
9,
10]. Available energy supply must also be calculated from consented yet unbuilt RE [
10]. Third, hydrogen price is calculated using the concept of levelized cost [
11,
12]. This research is novel because it sets the assessment in a New Zealand context and uses the concept of levelized cost in the calculation of hydrogen cost.
2. Literature Review
2.1. Hydrogen from Electrolysis
Electrolysis systems have three operational parameters: water consumption, power consumption and efficiency. Water consumption is estimated to be around 2.38 gallons or 9 L of water per kilogram of hydrogen [
13]. In terms of overall consumption, fossil-based hydrogen production has a greater water footprint compared to RE-based production [
14]. Electrolytic power consumption is a function of hydrogen flow rate, which ranges from 50 to 81 kWh/kg of hydrogen [
15]. Electrolyser efficiency is usually 70–75% for alkaline electrolysers and about 80–85% for PEM electrolysers, and is a function of current density and temperature [
15,
16]. Higher current density is needed to produce larger amounts of hydrogen from a given electrolyser area. Operating temperature must also be optimised because more economical hydrogen can be produced at high temperatures [
17] but system aging increases as operating temperature increases [
18].
2.2. Hydrogen for Transport
Hydrogen can address sectors that are “purely battery challenged”, such as heavy-duty transport, non-electrified rail, and maritime transportation. Although batteries exist in fuel cell electric vehicles (FCEV) and this combination may be more economical, purely battery transport may not always meet performance standards and the criterion of refuelling convenience [
19]. Moreover, hydrogen-powered vehicles, or fuel cell electric vehicles (FCEVs), have the following particular advantages over internal combustion vehicles and purely battery electric vehicles (BEVs) [
1,
19]:
FCEVs can drive further (more than 500 km) without frequent refuelling.
Refuelling times for FCEVs are similar to those for gasoline and diesel vehicles.
Hydrogen fuel has higher energy densities compared to stored energy in purely battery vehicles. Because of this, the sensitivity of FCEV powertrain cost and weight to the amount of energy stored (in kWh) is low. This is particularly beneficial for vehicles that require larger energy storage, such as heavy vehicles used for heavy load capacity and long ranges.
Infrastructure for FCEVs resembles that of gasoline fuel infrastructure, which adds value to practicality and capital costs.
All land vehicle types are potential niche markets for hydrogen fuel, but medium to heavy vehicles can truly benefit from longer ranges and fewer refuelling stops [
19]. Compared to purely battery electric vehicles, however, fuel cell vehicles are relatively new to the market. At present, large battery electric vehicles and fuel cell technologies are still expensive relative to small battery electric vehicles. Without significant improvements in battery charging and storage for longer range use, hydrogen would become a better low-carbon electrification option for medium to heavy trucks [
1].
2.3. Hydrogen and Diesel Trucks
At present, diesel and petrol are the dominant fuel source for road transport in New Zealand [
6,
20]. To decarbonize the sector, there is a general recognition that trucks are potentially the “low-hanging fruit” for hydrogen fuel [
1,
2,
6]. For instance, the well-to-tank efficiency of a US Class 6 heavy truck is 83% for diesel and 42–57% for fuel cell trucks. Regarding tank-to-wheel efficiencies, fuel cell trucks can have 50–100% better efficiencies than diesel trucks [
8,
21]. This, however, depends on vehicle operation (including speed) and whether the hydrogen fuel is in liquid or gaseous form [
8,
21]. In terms of price, hydrogen from electrolysis is currently more expensive than diesel fuel. However, diesel prices are highly volatile, depending on international oil market trends. Oil prices are expected to become more volatile as the future of oil production and consumption becomes increasingly uncertain [
22].
2.4. Levelized Cost of Hydrogen
Several past studies have also examined the economics of hydrogen production through the concept of levelized cost, borrowing from the concept of levelized cost of energy (LCOE) [
23]. Hydrogen output has been expressed in terms of LCOE in both vehicle fuel and energy storage applications [
11,
12]. LCOE factors include equipment costs, total installed costs, capacity factors, operations and maintenance (O&M) costs, and other components of the weighted average capital cost (WACC) [
24]. LCOE is a functional approach in measuring hydrogen because hydrogen output can also be expressed in terms of energy. Similar to computation of electricity costs, hydrogen costs can therefore be expressed in terms of cost per unit of hydrogen [
23].
In this paper, LCOE is used to frame the levelized cost of hydrogen (LCOH). The levelized cost approach is simple, allowing greater flexibility in sensitizing important LCOH parameters such as electricity cost, CAPEX, and the utilisation factor [
24]. Hydrogen cost is directly sensitive to changes in electricity cost, regardless of whether electricity is sourced from renewable or non-renewable sources, grid-connected or off-grid [
11,
25,
26,
27,
28,
29,
30]. The second most influential factor is capital cost (CAPEX), and particularly electrolyser costs. System optimization is necessary to avoid incorrect sizing of system components in the green hydrogen system [
30,
31,
32]. Utilisation rate is significant in the overall price of hydrogen, despite not having a direct share in the hydrogen per unit cost. Utilisation rate affects the system sizing of hydrogen production systems as part of the core techno-economic analysis [
2,
33].
3. Methodology
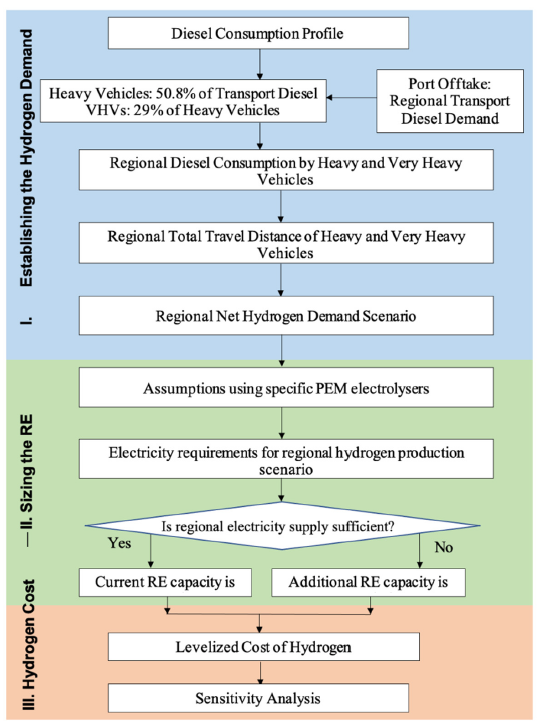
The feasibility of hydrogen as a form of green fuel for the very heavy vehicle (VHV) fleet in New Zealand was assessed using the following approach: (1) establishing the hydrogen demand, (2) sizing the renewable energy sources available, and (3) determining the price of hydrogen (
Figure 1). The hydrogen demand for VHVs was determined by considering the replacement of the equivalent in diesel fuel consumption [
9,
10], using data from 2017. The size of the renewable generation to power hydrogen production was estimated from only those additional generating facilities [
9,
10] with consented status in New Zealand. Lastly, the corresponding price of hydrogen was calculated based on the concept of levelized cost [
11,
12].
3.1. Information Used
Information on national and regional diesel demand was sourced from the energy balances and the 2017 calendar year report from the Ministry of Business, Innovation and Employment [
20]. This was used to estimate the kilometres travelled by VHVs and the equivalent hydrogen demand. Wholesale electricity prices, and existing and additional renewable energy capacity, were obtained from the Electricity Authority (EA) via its Market Information website. Techno-economic assumptions were based on the methodology used in the Hydrogen in New Zealand report [
6]. This report includes a green hydrogen cost model, diesel consumption of heavy and very heavy vehicles, and cost assumptions including capital and maintenance costs. The values from this report were cross-checked with values from other reports and were found to be consistent. A summary of the techno-economic assumption values used throughout the calculations is provided in
Table 1.
3.2. Renewable Electricity Source
This part of the methodology examines the current status and addition of renewable sources in comparison to the regional energy requirements to produce hydrogen for the VHV fleet [
10]. Electrolyser energy requirements were estimated using consumption data from specific electrolyser manufacturers.
Several electrolyser models were selected to obtain an equivalent energy consumption per Nm
3 of hydrogen. The HyLYZER
® PEM electrolyser from Hydrogenics
TM has a reported energy consumption of 5.4 kWh/Nm
3 of hydrogen produced, whereas the SiLYZER
® PEM electrolyser from Siemens
TM has an indicative hydrogen consumption of 5.6 kWh/Nm
3 [
38,
39]. From this, an estimate of 5.5 kWh/Nm
3, or 61 kWh/kg, was adopted for the calculations. The calculation using Equations (1) (for PJ) and (2) (for GWh) assumes the electrolyser efficiency, or losses, is included in the electrolyser energy consumption. The estimated annual (2017) electrolytic energy consumption per region is shown in
Table 2.
From the nameplate capacity and annual generation of existing grid renewable sources, the capacity factor for each renewable source can be calculated using Equation (3).
Table 3 details the consented yet unbuilt renewable energy capacity in each region. This information was derived from the 26 May 2019 update of proposed generation plants by the Electricity Authority (
https://www.emi.ea.govt.nz/Wholesale/Datasets/Generation/Generation_fleet/Proposed, accessed on 24 June 2019). These projects have a consented status, with the earliest commissioning year of 2019 (6.5 MW hydro in Otago) and the last projected construction year between 2023 through to 2033 (860 MW wind in Wellington) [
20]. The estimated generation in GWh was calculated from indicative nameplate capacities of additional consented renewable energy projects using Equation (4).
A comparison between electrolyser energy demand and additional consented renewable energy shows that the potential renewable energy capacity (9825 GWh) is more than sufficient to supply electricity to the electrolysers (4492 GWh). Some regions do not have additional renewable energy capacity. Connection to the electricity grid from adjacent regions with abundant indicative generation is viable in order to service hydrogen production [
10] from regions such as Bay of Plenty, Gisborne, Hawke’s Bay and Southland.
3.3. Hydrogen Cost
The calculation of levelized hydrogen cost considered the following: hydrogen production in a year, electrolyser capital cost, operations and maintenance costs, cost of electricity input, and the capital recovery factor of the electrolyser [
11,
12]. Levelized cost does not include taxes and price margins.
- -
LCOH—Levelized cost of hydrogen
- -
CEACC—Electrolyser capital cost
- -
CFREACC—Capital recovery factor of electrolyser
- -
CEE—Cost of electricity input
- -
Com-EE—Operations and maintenance cost
- -
mH2—Hydrogen production in a year
- -
Prated—Electrolyser rated power
- -
IE—Electrolyser cost per KW
- -
r—Discount rate
- -
n—System lifetime
Based on the initial calculation, the resultant costs were obtained (
Table 4).
From an earlier figure of 8 kg/100 km, a hydrogen production cost at 6.83 NZD/kg would translate to 0.55 NZD/km. This value does not include taxes, inflation, or retail margins.
4. Discussion
4.1. Hydrogen Demand
The overall VHV hydrogen demand volume was calculated at about 71 million kg or 786 million Nm3. Diesel and hydrogen fuel can be compared using energy and travel kilometre efficiency. The annual (2017) calculated travel distance equivalent of indicative diesel consumption in VHVs is 885 million km.
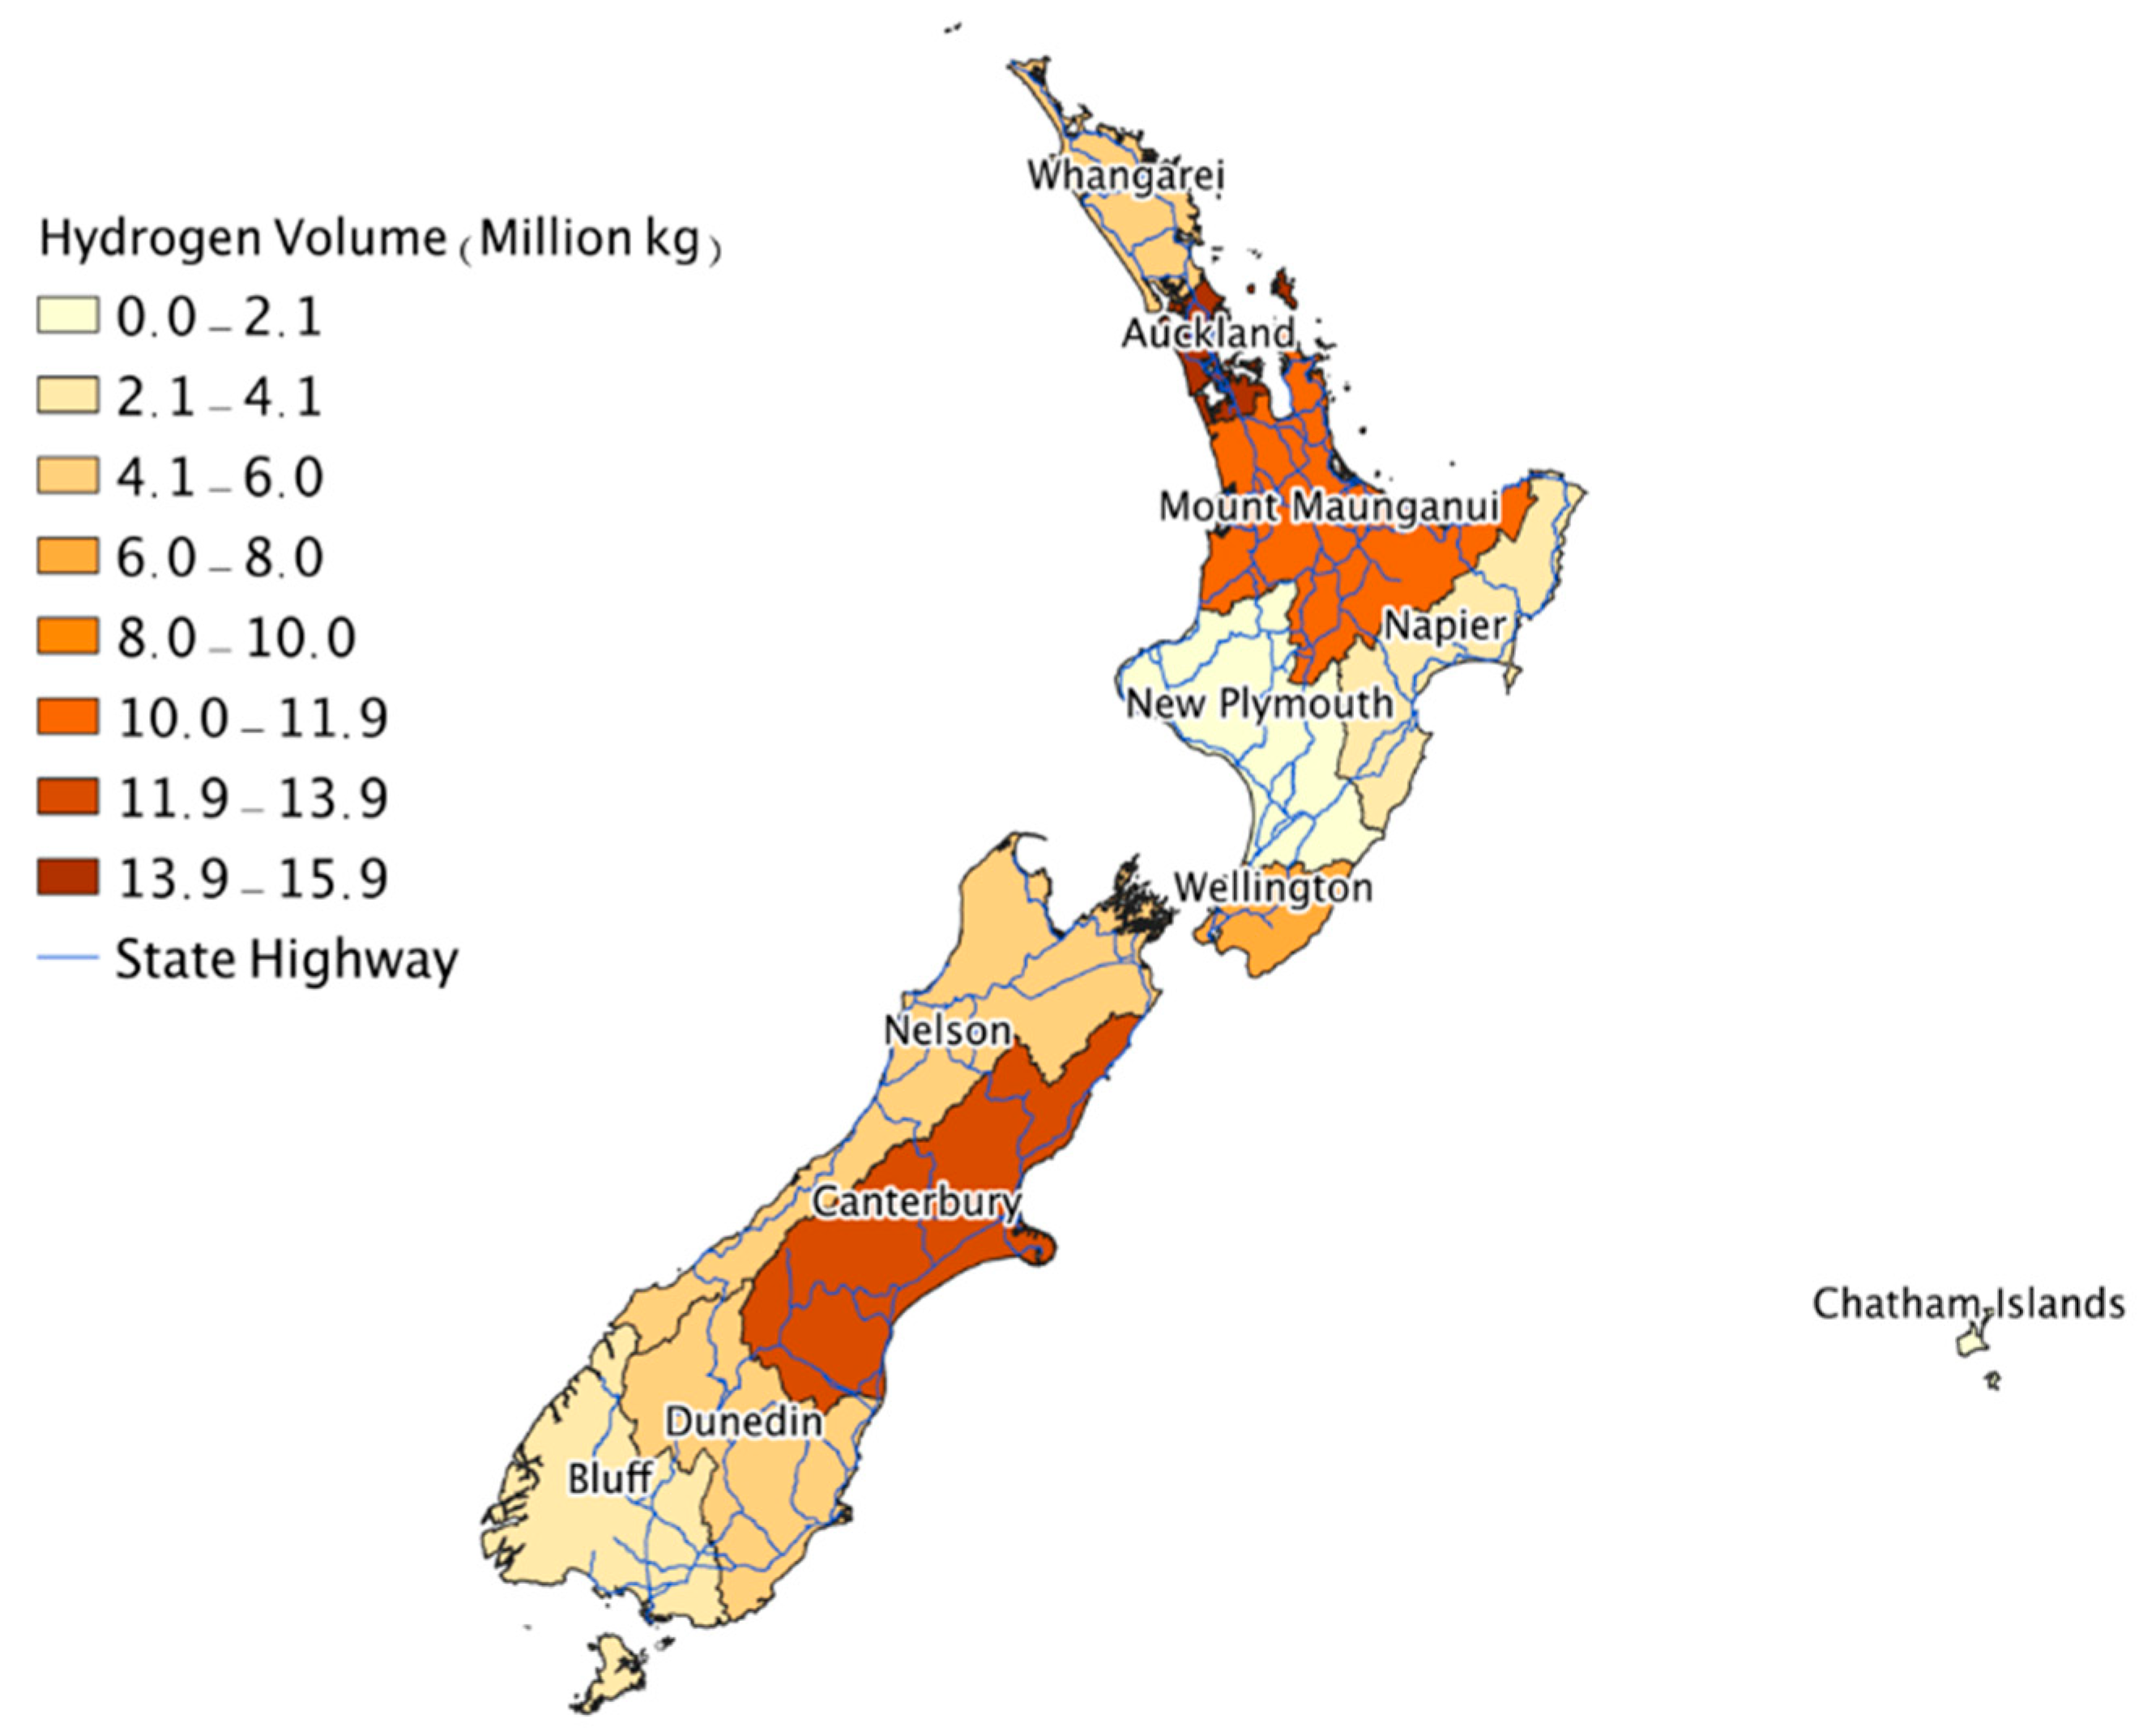
Regional distribution of annual (2017) hydrogen demand (see
Figure 2) was mapped using Quantum Geographic Information Systems (QGIS) software. Auckland would have the greatest hydrogen demand, followed by Mount Maunganui (Waikato and Bay of Plenty regions) and Canterbury. As discussed in the previous section, these regions also have the largest state highway networks, population, and freight activities [
20]. At first glance, there is a rough consistency between regions with high hydrogen fuel demand and regions with more population, state highway networks, and economic productivity.
4.2. Renewable Energy Supply
This step begins with the calculation of hydrogen electrical energy equivalent. Annual (2017) hydrogen demand is calculated at 8.5 PJ or 4492 GWh. The conversion value of 61 kWh/kg is assumed to be inclusive of losses within the electrolyser equipment.
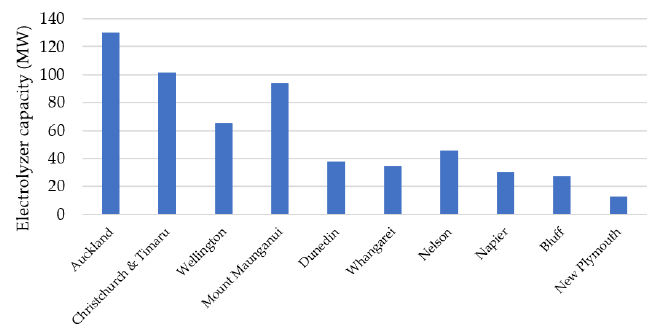
The regional distribution of electrolyser capacity needed to supply the total hydrogen demand is shown in
Figure 3. This gives initial information on the extent of investment needed to supply the regional hydrogen demand.
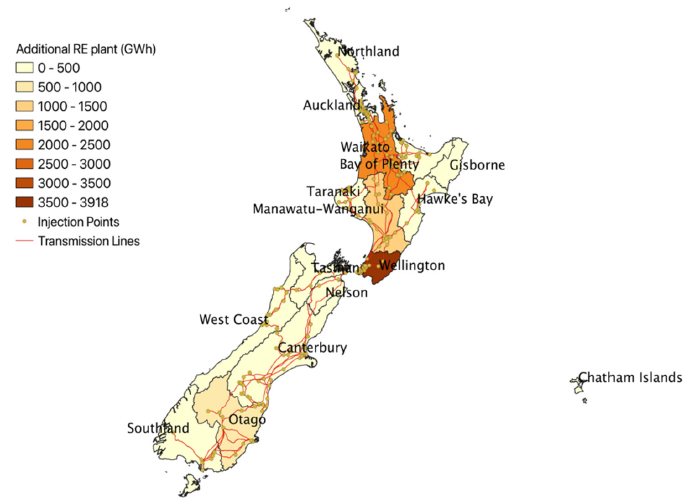
Regional distribution of additional RE (
Figure 4) shows that Wellington has the largest additional capacity composed of purely wind generation. The second largest additional capacity is in Waikato. The takeaway from this map is the strategic location of the additional RE generation plants compared to the hydrogen demand in
Figure 2. Connection of additional RE to the grid is beneficial in extending power to regions of high hydrogen demand and regions without additional RE. RE in Wellington can support hydrogen production demand in both the North and South Islands, especially the Canterbury region. The Waikato and Bay of Plenty regions (Mount Maunganui) can support hydrogen demand in Auckland. This additional RE generation option confirms that there are still significant untapped RE resources in New Zealand.
Consented yet unbuilt RE has an estimated generation potential of 9824 GWh per year. This is sufficient to power the hydrogen production electricity demand, which is 4492 GWh (inclusive of 4% grid network loss). This is a positive indication of green hydrogen’s cost competitiveness, because regions with abundant RE sources can produce more cost competitive green hydrogen [
1,
10].
4.3. Hydrogen Cost
The calculated hydrogen price is NZD 6.83/kg (see
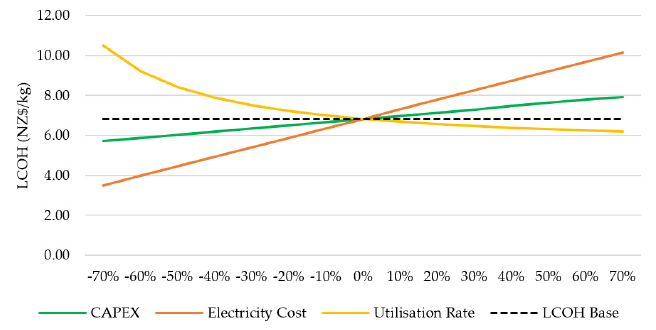
Section 3.3). Electricity cost accounts for the largest portion of the hydrogen cost, occupying about 70% of total production costs. This is consistent with other hydrogen cost studies for electrolytic hydrogen. This is further illustrated in the sensitivity graph in
Figure 5.
Electricity cost is clearly the most dominant cost input of the LCOH. Changes in the cost of electricity affect hydrogen cost about three-fold more than CAPEX. The sharply curving line for utilisation rate indicates, as expected, that LCOH will rise rapidly at low levels of utilisation. The greatest future cost reduction opportunity is expected in the electricity cost. Fluctuations in electricity price will make the production cost of hydrogen highly variable and will reduce its economic competitiveness [
30]. Nevertheless, hydrogen prices may differ according to its end use application, mode of production, and techno-economic situations worldwide.
4.4. Cost Reduction Scenarios
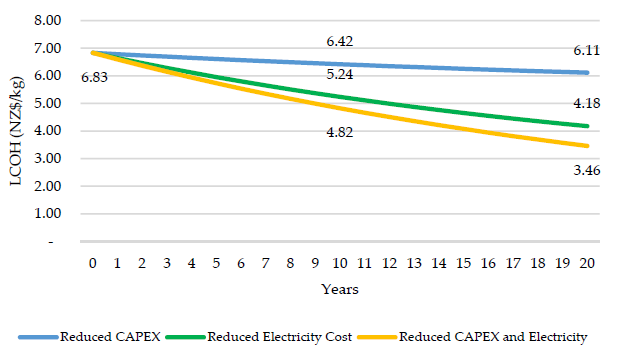
Three scenarios project the price of hydrogen in the next 10 to 20 years. The first and second scenarios describe the cost reductions by CAPEX and electricity, respectively. The third scenario describes the combined effect of reducing CAPEX and electricity costs (see
Figure 6).
The cost reduction in CAPEX over the 10 years alone (Scenario 1) will yield a modest cost reduction of NZD 0.41/kg in 10 years and NZD 0.72/kg in 20 years. Significant reductions in the electricity cost (Scenario 2) will reduce the LCOH by NZD 1.59/kg in 10 years and NZD 2.65/kg in 20 years. The combined reduction of both CAPEX and electricity cost (Scenario 3) will yield the biggest cost reduction opportunity. In the third scenario, the LCOH may be reduced by NZD 2.01/kg in 10 years (30% reduction rate) and will go down by a further NZD 3.37/kg in 20 years, almost 50% from the base value. This trend of cost reduction estimate is approximately similar to the estimate in the Hydrogen Council (2020) report, although this paper acknowledges that trends in hydrogen cost reductions are also likely to vary according to future technology advancements, and fiscal and non-fiscal support mechanisms worldwide.
5. Conclusions
This study examined the feasibility of green hydrogen as a transport fuel for the very heavy vehicle (VHV) fleet in New Zealand. It is based on large-scale, decentralized, and embedded (dedicated) grid-connected hydrogen production using polymer electrolytic membrane (PEM) electrolysers. The analysis was performed in three steps. First, hydrogen demand was calculated. Second, the additional RE was evaluated in order to determine its sufficiency to supply electricity for green hydrogen production. Finally, the hydrogen production cost was calculated using the concept of levelized cost.
The results of this study indicate an overall green hydrogen demand for VHVs of 71 million kg or 8.5 PJ, less than the diesel fuel demand of 14.7 PJ for the same VHV travel kilometres. Regions with greater populations and economic activities, such as Auckland and Canterbury, tend to have the largest demand for green hydrogen fuel. This study also established that the potential annual generation of 9824 GWh of RE electricity from consented, yet unbuilt, RE projects is greater than the electricity demand that would be required for green hydrogen production, estimated to be around 4492 GWh. Wind accounts for the largest RE proportion of the consented, yet unbuilt, projects, and is mostly concentrated in the Wellington region. A comparison of hydrogen demand and RE supply indicates a mismatch between regions of high hydrogen demand and high RE supply. The calculated levelized hydrogen cost is NZD 6.83/kg. This translates into NZD 0.55/km of VHV travel cost, excluding retail margins. Electricity cost was also found to be the most sensitive cost parameter for green hydrogen production.
There are two recommendations from this study. First, power matching scenarios for regions with high hydrogen demand and regions with high potential supply for RE electricity must be assessed through further research. This includes identifying transmission constraints and grid impact assessments for possible grid stresses that can be created by both the additional electricity demand for hydrogen production demand and potential electricity supply from consented, yet unbuilt, RE projects. Second, the uptake of green hydrogen fuel will require exploration of potential policy interventions, especially in the initial rollout stages. The New Zealand government has been supportive of the promotion of electric vehicles. The government can provide similar support for hydrogen fuel cell vehicles, particularly for heavy vehicle freight operators [
20].
Author Contributions
Conceptualization, R.J.P.; methodology, R.J.P.; validation, A.C.B., J.H.; formal analysis, R.J.P.; writing—original draft preparation, R.J.P.; writing—review and editing, A.C.B., J.H. All authors have read and agreed to the published version of the manuscript.
Funding
This research received no external funding.
Institutional Review Board Statement
Not applicable.
Informed Consent Statement
Not applicable.
Data Availability Statement
Not applicable.
Acknowledgments
Sustainable Energy Systems, Victoria University of Wellington.
Conflicts of Interest
The authors declare no conflict of interest.
References
- Hydrogen Council. Path to Hydrogen Competitiveness—A Cost Perspective. 2020. Available online: https://hydrogencouncil.com/wp-content/uploads/2020/01/Path-to-Hydrogen-Competitiveness_Full-Study-1.pdf (accessed on 4 December 2019).
- MBIE. A Vision for Hydrogen in New Zealand. Energy strategies for New Zealand. 2019. Available online: https://www.mbie.govt.nz/building-and-energy/energy-and-natural-resources/energy-strategies-for-new-zealand/ (accessed on 9 April 2019).
- International Energy Agency. Energy Policies of IEA Countries—New Zealand 2017 Review; International Energy Agency: Paris, France, 2017; pp. 1–8. [Google Scholar]
- Ministry for the Environment. New Zealand Greenhouse Gas Inventory 2019; Ministry for the Environment: Wellington, New Zealand, 2019; Volume 1.
- Energy Transitions Commission. Reaching Net-Zero Carbon Emissions from Harder-To-Abate Sectors by Mid-Century. 2018. Available online: https://www.ieta.org/resources/COP24/MiscMediaFiles/Dec7/SE16(3).pdf (accessed on 4 December 2019).
- Concept Consulting Group. Hydrogen in New Zealand Report 2—Analysis. 2019. Available online: http://www.concept.co.nz/uploads/2/5/5/4/25542442/h2_report2_analysis_v4.pdf (accessed on 23 March 2019).
- ANZ. ANZ NZ Truckometer August 2019. 2019. Available online: https://www.anz.co.nz/content/dam/anzconz/documents/economics-and-market-research/2019/truckometer/ANZ-Truckometer-20190809.pdf (accessed on 16 January 2020).
- Winter, U.; Weidner, H. Hydrogen for the Mobility of the Future Results of GM/Opel’s Well-to-Wheel Studies in North America and Europe. Fuel Cells 2003, 3, 76–83. [Google Scholar] [CrossRef]
- Franzitta, V.; Curto, D.; Milone, D.; Trapanese, M. Energy saving in public transport using renewable energy. Sustainability 2017, 9, 106. [Google Scholar] [CrossRef]
- Franzitta, V.; Curto, D.; Rao, D.; Viola, A. Hydrogen production from sea wave for alternative energy vehicles for public transport in Trapani (Italy). Energies 2016, 9, 850. [Google Scholar] [CrossRef]
- Genç, M.S.; Çelik, M.; Karasu, I. A review on wind energy and wind-hydrogen production in Turkey: A case study of hydrogen production via electrolysis system supplied by wind energy conversion system in Central Anatolian Turkey. Renew. Sustain. Energy Rev. 2012, 16, 6631–6646. [Google Scholar] [CrossRef]
- Genç, G.; Çelik, M.; Genç, M.S. Cost analysis of wind-electrolyzer-fuel cell system for energy demand in Pnarbaş-Kayseri. Int. J. Hydrog. Energy 2012, 37, 12158–12166. [Google Scholar] [CrossRef]
- Webber, M.E. The water intensity of the transitional hydrogen economy. Environ. Res. Lett. 2007, 2, 034007. [Google Scholar] [CrossRef]
- Shi, X.; Liao, X.; Li, Y. Quantification of fresh water consumption and scarcity footprints of hydrogen from water electrolysis: A methodology framework. Renew. Energy 2020, 154, 786–796. [Google Scholar] [CrossRef]
- Pascuzzi, S.; Anifantis, A.S.; Blanco, I.; Mugnozza, G.S. Electrolyzer performance analysis of an integrated hydrogen power system for greenhouse heating a case study. Sustainability 2016, 8, 629. [Google Scholar] [CrossRef]
- Dell, R.M.; Moseley, P.T.; Rand, D.A.J. Chapter 8—Hydrogen, Fuel Cells and Fuel Cell Vehicles; Academic Press: Boston, MA, USA, 2014; pp. 260–295. [Google Scholar]
- Hauch, A.; Küngas, R.; Blennow, P.; Hansen, A.B.; Hansen, J.B.; Mathiesen, B.V.; Mogensen, M.B. Recent advances in solid oxide cell technology for electrolysis. Science 2020, 370, eaba6118. [Google Scholar] [CrossRef]
- Lettenmeier, P. Efficiency—Electrolysis. 2019. Available online: https://assets.new.siemens.com/siemens/assets/api/uuid:139de890-44e1-453b-8176-c3d45c905178/version:1558704999/white-paper-efficiency-en.pdf (accessed on 11 October 2019).
- Hydrogen Council. How Hydrogen Empowers the Energy Transition. 2017. Available online: http://hydrogencouncil.com/wp-content/uploads/2017/11/Hydrogen-scaling-up-Hydrogen-Council.pdf (accessed on 24 June 2019).
- MBIE. Energy in New Zealand 2018. Markets—Evidence and Insights Branch. 2018. Available online: https://www.mbie.govt.nz/assets/d7c93162b8/energy-in-nz-18.pdf (accessed on 24 June 2019).
- Lee, D.Y.; Elgowainy, A.; Kotz, A.; Vijayagopal, R.; Marcinkoski, J. Life-cycle implications of hydrogen fuel cell electric vehicle technology for medium- and heavy-duty trucks. J. Power Sources 2018, 393, 217–229. [Google Scholar] [CrossRef]
- IEA. Oil 2O18—Analysis and Forecasts to 2023. Market Report Series. 2018. Available online: https://www.iea.org/oilmarketreport/ (accessed on 6 October 2019).
- Viktorsson, L.; Heinonen, J.T.; Skulason, J.B.; Unnthorsson, R. A step towards the hydrogen economy—A life cycle cost analysis of a hydrogen refueling station. Energies 2017, 10, 763. [Google Scholar] [CrossRef]
- International Renewable Energy Agency (IRENA). Renewable Power Generation Costs in 2018. 2019. Available online: https://www.irena.org/-/media/Files/IRENA/Agency/Publication/2018/Jan/IRENA_2017_Power_Costs_2018.pdf (accessed on 5 March 2019).
- Greiner, C.J.; KorpÅs, M.; Holen, A.T. A Norwegian case study on the production of hydrogen from wind power. Int. J. Hydrog. Energy 2007, 32, 1500–1507. [Google Scholar] [CrossRef]
- Levene, J.I.; Mann, M.K.; Margolis, R.M.; Milbrandt, A. An analysis of hydrogen production from renewable electricity sources. Sol. Energy 2007, 81, 773–780. [Google Scholar] [CrossRef]
- Linnemann, J.; Steinberger-Wilckens, R. Realistic costs of wind-hydrogen vehicle fuel production. Int. J. Hydrog. Energy 2007, 32, 1492–1499. [Google Scholar] [CrossRef]
- Loisel, R.; Baranger, L.; Chemouri, N.; Spinu, S.; Pardo, S. Economic evaluation of hybrid off-shore wind power and hydrogen storage system. Int. J. Hydrog. Energy 2015, 40, 6727–6739. [Google Scholar] [CrossRef]
- Parra, D.; Valverde, L.; Pino, F.J.; Patel, M.K. A review on the role, cost and value of hydrogen energy systems for deep decarbonisation. Renew. Sustain. Energy Rev. 2019, 101, 279–294. [Google Scholar] [CrossRef]
- Rahil, A.; Gammon, R. Dispatchable hydrogen production at the forecourt for electricity demand shaping. Sustainability 2017, 9, 1785. [Google Scholar] [CrossRef]
- Mohammadi, A.; Mehrpooya, M. A comprehensive review on coupling different types of electrolyzer to renewable energy sources. Energy 2018, 158, 632–655. [Google Scholar] [CrossRef]
- Gutiérrez-Martín, F.; Confente, D.; Guerra, I. Management of variable electricity loads in wind—Hydrogen systems: The case of a Spanish wind farm. Int. J. Hydrog. Energy 2010, 35, 7329–7336. [Google Scholar] [CrossRef]
- Bertuccioli, L.; Chan, A.; Hart, D.; Lehner, F.; Madden, B.; Standen, E. Development of Water Electrolysis in the European Union. LC-GC N. Am. 2014. [Google Scholar]
- Collier, S.; Ruehl, C.; Yoon, S.; Boriboonsomsin, K.; Durbin, T.D.; Scora, G.; Johnson, K.; Herner, J. Impact of Heavy-Duty Diesel Truck Activity on Fuel Consumption and Its Implication for the Reduction of Greenhouse Gas Emissions. Transp. Res. Rec. 2019, 2673, 125–135. [Google Scholar] [CrossRef]
- Hyundai Motors New Zealand. World’s First Fleet of Fuel Cell Electric Trucks into Commercial Operation. 2019. Available online: https://www.hyundai.co.nz/hyundai-motor-and-h2-energy-to-bring-the-world-s-first-fleet-of-fuel-cell-electric-trucks-into-commercial-operation- (accessed on 27 November 2019).
- ESORO. The World’s First Fuel Cell Heavy Goods Vehicle Able to Fulfill Coop’s Logistics Requirements. 2017. Available online: http://www.esoro.ch/deutsch/content/aktuelles/images/Factsheet_Lastwagen_E.pdf (accessed on 5 October 2019).
- International Renewable Energy Agency (IRENA). Hydrogen From Renewable Power: Technology Outlook for the Energy Transition. 2018. Available online: www.irena.org/publications (accessed on 4 December 2019).
- Hydrogenics. Hydrogenics Renewable Hydrogen Solutions. 2018. Available online: http://www.hydrogenics.com/wp-content/uploads/Renewable-Hydrogen-Brochure.pdf (accessed on 4 December 2019).
- Siemens AG. SiLYZER 200. 2017. Available online: https://assets.new.siemens.com/siemens/assets/api/uuid:8063d38e3aca74d2a0bcc307fcef435ced002103/version:1524044774/silyzer200-broschure-en.pdf (accessed on 2 October 2019).
| Publisher’s Note: MDPI stays neutral with regard to jurisdictional claims in published maps and institutional affiliations. |
© 2021 by the authors. Licensee MDPI, Basel, Switzerland. This article is an open access article distributed under the terms and conditions of the Creative Commons Attribution (CC BY) license (https://creativecommons.org/licenses/by/4.0/).


