Abstract
Cylinder deactivation is an effective measure to reduce the fuel consumption of internal combustion engines. This paper deals with several practical aspects of switching from conventional operation to operation with deactivated cylinders, i.e., gas spring operation with closed intake and exhaust valves. The focus of this paper lies on one particular quantity-controlled stoichiometrically-operated engine where the load is controlled using the valve timing. Nevertheless, the main results are transferable to other engines and engine types, including quality-controlled engines. The first aspect of this paper is an analysis of the transition from fired to gas spring operation, and vice versa, as well as the gas spring operation itself. This is essential for mode changes, such as cylinder deactivation or skip-firing operation. Simulation results show that optimizing the valve timing in the last cycle before deactivating/first cycle after reactivating a cylinder, respectively, is advantageous. We further show that steady-state gas spring operation is reached after approximately 6 s regardless of the initial conditions and the engine speed. The second aspect of this paper experimentally verifies the advantage of optimized valve timings. Furthermore, we show measurements that demonstrate the occurrence of an unavoidable torque ripple, especially when the transition to and from the deactivated cylinder operation is performed too quickly. We also confirm with our experiments that a more gradual mode transition reduces the torque drop.
1. Introduction
It is an inescapable fact that, for the foreseeable future, road and off-road transport will be characterized by a mix of solutions involving internal combustion engines (ICEs), battery, and hybrid powertrains, as well as conventional vehicles powered by IC engines [1,2].
Following governmental regulations for the protection of the environment, a low fuel consumption is an important goal for all car manufacturers. In Europe, from 2020 onwards, a fleet averaged CO2 limit of 95 g/km will come into effect for a reference vehicle of 1372 kg. By 2030, a further reduction to 59.4 g/km is required. The fuel consumption of vehicles equipped with a combustion engine must, therefore, be reduced significantly.
In addition, the CO2 emissions of these vehicles can be further reduced when biofuels and synthetic fuels are used. As renewable energy sources, such as solar- or wind-power, are intermittent, researchers have proposed to use excess electric energy produced during periods of low demand to produce synthetic fuels [3]. In Reference [4], a Well-to-Miles analysis is performed to quantify the demand of renewable energy for vehicle operation with different synthetic fuels. Retrofitting gasoline engines to operate with natural gas can lead to a reduction in the CO2 emissions by 20% [5] and 23% [6], respectively, for passenger cars and a reduction of 26% [7] for a non-road application.
One method to reduce the fuel consumption of spark ignition engines is cylinder deactivation. By using fewer cylinders to supply the same brake load, parasitic losses are reduced, which increases efficiency. Numerous publications [8,9,10,11,12,13,14,15,16,17,18,19,20] about cylinder deactivation describe these effects. Fuel savings by up to 25% for steady-state engine operation [13,14] and by up to 15% in driving cycles [14] or 20% in urban driving [9] are reported.
Cylinder deactivation can improve the operation of Diesel engines, as well. Here, the goal is not only to increase the efficiency at low loads but also to increase the exhaust gas temperature and, thereby, the temperature of the exhaust gas after treatment system, as well as to reduce engine-out emissions [21,22,23,24,25,26,27].
The publications cited describe the benefits of cylinder deactivation in great detail. Regarding the mode changes, hardware-specific requirements like timing issues to avoid damage to the system [18,28,29] typically crop up. Other authors mention that changes of the actuation of the throttle, the ignition, and possibly the cam timing [11,30,31,32] are necessary, or they state that improved software [18,26,33] is required for mode changes. While the authors of Reference [17] provide detailed information regarding the control strategy, these results are only valid for the particular system they use, and the control strategy is also only provided schematically with no experimental verification.
In Reference [12], a control strategy is presented with an experimental verification; however, the same ignition angle appears to be used for both cylinder groups during the mode transition. The authors do not provide sufficient detail about the two engine revolutions during which the actual mode transition occurs, but this is crucial, as shown in Reference [34].
Other authors [31,35] recognize a torque ripple during the mode changes and suggest opening the torque converter lock-up clutch as a countermeasure. However, they do not address the cause of the torque ripple.
In a previous paper, the present authors introduced a control strategy to influence the torque ripple directly [34]. The properties during the transition to and from cylinder deactivation were analyzed with regard to cycle-averaged torque and fuel consumption. It was shown that the drawback of an increased fuel consumption during the transitions can be neglected when a variable valve-train is used. The analyses also showed that the specific increase/decrease in each cylinder group has a significant impact on the cycle-averaged engine torque. It must be noted that the key point of the control strategy presented in Reference [34] is the selection of beneficial reference values for the load of the individual cylinders. Tracking these reference values will lead to a smooth transition regardless of the particular controllers that are used on the engine control unit (ECU).
This paper can be seen as a follow-up to Reference [34]. We provide insight into the gas spring operation of the unfired cylinders and show that regardless of the initial conditions, steady-state operation is reached after only 10 engine cycles for the considered spark ignition engine. Then, we present different possibilities for the transition from fired operation to gas spring operation and vice versa. The advantages that result from using optimized valve timings made possible by a fully variable valve-train are quantified. In the experimental analysis part of the paper, we provide experimental verification for the control strategy presented in Reference [34]. In that study, it was stated that using a particular control strategy which limits the torque gradients of each cylinder group during deactivation and reactivation, respectively, will reduce a torque ripple during the transition phase. In this study, we show experimentally that whether the mode transition is done quickly or gradually has, in fact, a significant impact on the torque drop during deactivation and reactivation processes, respectively. It must be noted that this study does not assess problems associated to noise, vibration, and harshness (NVH) as this is very specific to drivetrain, application, and vehicle. This study shows how the transition should be done whenever it is allowed.
For the simulation part of the study, we use two types of engine simulation models for the analyses presented here. They employ different levels of detail, and, while one is more detailed and, hence, only used for offline analysis of the fundamental effects, the other is strongly simplified and suitable for implementation on the ECU. For the experimental part and also to parameterize the simulation models, a passenger car engine equipped with the fully variable FlexWork valve-train [36] and operated with natural gas is used.
This paper is structured as follows: First, we present the experimental setup that was used for the measurements shown in this publication. Next, we present the simulation models. Then, we analyze fundamental properties of the engine operation in the deactivated state, i.e., gas spring operation. Thereafter, we present simulation results of different strategies for the deactivation and reactivation of a cylinder, respectively. Finally, we provide experimental verification.
2. Experimental Setup
Experiments were performed on a Volkswagen engine with four cylinders and a displacement of 1.4 L. The engine operated on port-fuel-injected natural gas and was controlled to stoichiometric conditions. The complete camshaft system, composed of the camshafts, gears, chain, and timing adjustment, was removed and the engine was fitted with the electro-hydraulic FlexWork valve-train [36], which is shown in the photograph in the top of Figure 1. This valve-train has one actuator, a magnetic coil, for each pair of intake and exhaust valves, respectively. Figure 1 also shows a schematic of the engine test bench, and Table 1 gives an overview of the experimental setup.
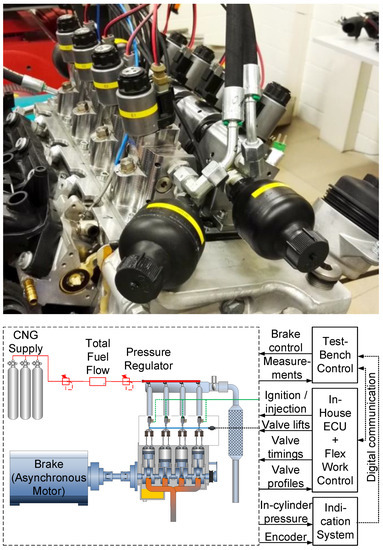
Figure 1.
Photograph and schematic of the experimental setup. “Measurements” comprises pressures and temperatures at various locations, as well as volumetric flow rates of the hydraulic valve actuators, and the air and fuel for combustion.

Table 1.
Main characteristics of the experimental setup.
The working principle of the valve-train is basically a hydraulically excited spring-mass-system [37] which is able to recover energy during the valve closing phase. Detailed description of the valve train can be found in Reference [38,39], and the results of the engine operation in Reference [36,38,39,40]. For the experiments conducted for this research, only three main properties of the valve-train are relevant:
- (i)
- The valve lift for the intake and exhaust valves, respectively, can be set for all cylinders.
- (ii)
- Both opening and closing timings can be set individually for each cylinder at the intake and exhaust side, respectively.
- (iii)
- The valves are naturally closed, which means that each pair of intake and exhaust valves can be deactivated individually.
These properties allow an investigation of the deactivation and reactivation process of a cylinder without the typical constraints cam-based systems have. These constraints comprise the inability to change the valve timing of two cylinder groups individually and—generally speaking—the lack of variability in the exhaust valve opening duration.
The engine control software allows variation of valve timings, the mass of fuel injected and the ignition timing for each cylinder-individually from one actuation to the next. This makes a fast and cylinder-individual load control possible. Thus, the new values are chosen for each cylinder individually in each cycle according to the load that is required in that instant. The condition for the deactivation of a cylinder simply is if the desired mean effective pressure is smaller than 0.5 bar. In order to realize a deactivation, the corresponding “enable" signals are set to zero right after the last actuation of the fuel injection, intake valve and exhaust valve, respectively, of a particular cylinder.
To motivate for the benefits of cylinder deactivation, some information on the brake efficiency is provided in Table 2 for low load operating points at an engine speed of 2000 rpm.
Table 2.
Brake efficiency at 2000 rpm in 4-cylinder and 2-cylinder operation.
No sensors to assess problems associated to NVH are installed at the testbench as this is very specific to drivetrain, application, and vehicle. However, the authors can state that there was no audible noise during the transition, and the sound of the engine was soft in full-cylinder operation, as well as in two-cylinder operation, with an audible difference between them. A visual inspection indicated that there were no fouled spark plugs after the measurements in two-cylinder operation and deactivation/reactivation measurements. However, the engine was only operated with two cylinders for rather short periods of time (several minuts) for the required measurements. Whether extended two-cylinder operation can lead to the occurrence of such problems can only be determined in long-term studies, which is not the scope of our research.
3. Simulation Models
Two different types of engine simulation models are used is this work. They employ different levels of detail, and, while one is more detailed and, hence, only used for offline analysis of the fundamental effects, the other is strongly simplified. This model is invertible and allows the ECU to calculate feed-forward control trajectories.
The process simulation is a 0-dimensional engine simulation tool. The intake manifold pressure, the exhaust manifold pressure and the pressure inside the crank case, respectively, are constant, while the in-cylinder pressure can change. The mass flow over intake valves, exhaust valves and piston rings is modeled as compressible flow. There are three gas species in the model—air, unburned mixture, and burned gas—which have temperature dependent gas properties. The combustion is modeled as a Vibe type heat release rate [41] and wall heat losses are implemented using the Woschni correlation [42]. The parameters for the valve flow coefficients, heat release rate, wall heat losses, and blow-by properties are identified using measurements obtained at the test bench. To identify the blow-by parameters, at least two measurements are necessary: One measurement at conditions where no reverse blow-by occurs, e.g., supercharged operation, and one measurement in the gas spring operation where reverse blow-by has a major influence on the in-cylinder mass and pressure level. The root mean square error of the indicated efficiency at a given indicated mean effective pressure is as low as 0.18%, and the root mean square error of the mean indicated pressure at given valve timings is 0.136 bar in the relevant operating region. This model will be used for the analysis of the gas spring operation and the transition from and to fired operation, respectively.
The simple engine model is a discrete event model based on the Willans approximation presented in Reference [41]. For one engine speed, the mean effective pressure is modeled as:
where e is the Willans efficiency, i.e., the efficiency of the conversion of chemical energy in the fuel to indicated work of the high pressure part of the engine cycle, represents the pumping losses, and represents the friction losses. The mean effective fuel power is defined by the fuel’s lower heating value , the mass of fuel injected per cycle , and the engine displacement volume .
The in-cylinder pressure measurements and the torque measurement were used to evaluate the summands of Equation (1) as
where is the indicated mean effective pressure over the entire engine cycle, is the indicated mean effective pressure of the low-pressure loop, i.e., the gas exchange, and is the indicated mean effective pressure of the high-pressure loop, i.e., the compression and combustion strokes. The engine model shown in Figure 2 is based on steady-state load variations measured at the test bench which were carried out at an engine speed of 2000 rpm. The valve lift is kept constant at 3 mm for both intake and exhaust valves, and the throttle is fully open for all measurements. Using a higher valve lift would result in a slight increase of the achievable load and a slight reduction of throttling losses at the expense of combustion stability at very low loads.
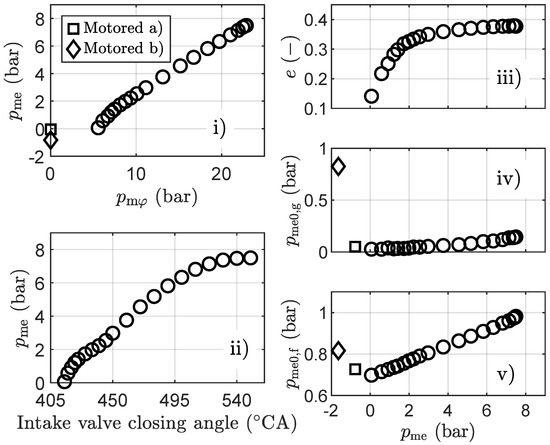
Figure 2.
Willans-based Discrete Event Model. The circles depict measurements in fired operation. Motored (a) refers to motored operation with all valves closed (gas spring operation) and motored (b) refers to motored operation with only the intake valves closed. Subfigures (i,ii) show the mean effective pressure over the fuel mean effective pressure and the intake valve closing angle, respectively. Subfigures (iii–v) show the Willans efficiency, the gas exchange losses, and the friction losses, respectively, as a function of the brake mean effective pressure.
The load is controlled by changing the valve timings, mainly the intake valve closing angle. At low loads, the intake valve closes as early as 55 °CA after gas exchange top dead center. When the load reduces from 7 to 2 bar , the combustion efficiency e also slightly reduces, which is due to a decrease of turbulence. However, this effect is overcompensated by the benefit of lower pumping losses when compared to throttled operation, as was analyzed in Reference [40] for this exact same engine and valve-train. At loads lower than , the center of combustion had to be delayed to avoid high cycle-to-cycle variations of the mean indicated pressure.
Since the valve timings, the fuel injection and the ignition angle can all be changed from one engine cycle to the next for each cylinder and the intake manifold pressure remains constant at all loads, no further level of detail is required for this model besides the respective delays which are summarized in Table 3. The measured curves are implemented directly in the ECU. By means of linear interpolation, we obtain the respective valve timings, injection duration, and ignition angle for the desired load of each cylinder.
Table 3.
Delays of the discrete event model.
4. Gas Spring Operation in a Deactivated Cylinder
Before we analyze the transitions to and from the deactivated cylinder operation, we address the properties of a deactivated cylinder itself. Simulations are carried out using the process simulation model. All simulations are over 1000 engine cycles at 2000 rpm and start at top dead center. The cylinder only contains burned gas at a pressure of 1.1 bar, which is chosen to represent the in-cylinder pressure during the exhaust stroke. Both intake and exhaust valves are closed from the beginning, and there is no heat release from combustion. While the given engine has a compression ratio of 10, compression ratios of 13 and 16 were also analyzed for comparison.
In the upper and middle plots of Figure 3, the cycle-averaged in-cylinder mass is shown. The upper plot shows that, even if the identified blow-by flow cross sections are doubled or halved, the in-cylinder mass converges to the same value. The smaller the flow cross section, the slower the process. However, after a maximum of 250 engine cycles (which corresponds to 15 s), the steady-state is reached. However, the variation of the in-cylinder mass over one engine revolution increased, the larger the flow cross section is. This is shown in the middle right plot.
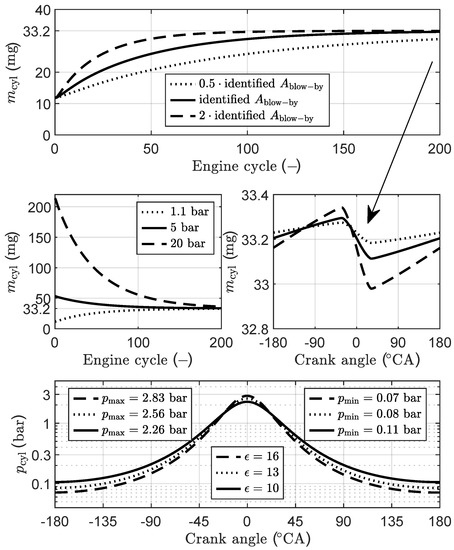
Figure 3.
Gas spring operation with different model parameters. Upper plot and middle right plot: different blow by properties (double and half of the identified parameters). Middle left plot: different initial in-cylinder pressures. Bottom plot: different compression ratios.
The middle left plot shows that, for different initial pressures, the in-cylinder mass also converges quickly to the same steady-state value. The of the gas spring operation is −0.042 bar in steady-state. Except for the smallest blow-by flow cross section, the simulations converge after approximately 100 engine cycles, which corresponds to 6 s. The gas spring value, however, stabilizes within 5% of its final value in less than 10 engine cycles.
Finally, the bottom plot of Figure 3 shows the cylinder pressure trace in steady-state conditions for different compression ratios. Increasing the compression ratio increases the pressure amplitude. The peak pressure at top dead center increases, while the minimal pressure at bottom dead center reduces simultaneously. The peak pressure for the given compression ratio of 10 is only approximately 2.3 bar, while the minimum pressure is slightly above 0.1 bar.
An additional set of simulations at 4000 rpm reveals that it takes approximately the same amount of time and, hence, twice as many engine cycles until the steady state is reached. The minimum and maximum pressure levels, as well as the cycle-averaged in-cylinder mass, remain largely unchanged. However, the of the gas spring operation reduces to −0.037 bar in steady-state due to the smaller fluctuation of mass over one engine revolution.
These analyses show that, after only a short period of time—approximately 6 s—the steady-state gas spring operation is reached, regardless of the initial conditions and the engine speed. This corresponds to less than one second of operation in the deactivated state. In addition, these simulations reveal the in-cylinder pressure level which is relevant for the deactivation and reactivation process of a cylinder.
5. Analysis of the Deactivation and Reactivation Process of a Cylinder
Regardless of the engine configuration, the number of cylinders, the type of fuel, the strategy used, or the load of the last combustion cycle: whenever any individual cylinder is deactivated, it must undergo a transition from fired operation to gas spring operation. During the reactivation, the inverse holds true and is again independent from the aforementioned criteria. Several basic options are available to influence the deactivation and reactivation process, respectively. In order to analyze these transitions in a general way, this section analyzes the deactivation and the reactivation using the process simulation. These results will be validated in the following section using experimental data.
5.1. Calculation
Since the deactivation of a cylinder can be seen as a very fast transient process in which significant changes occur from one engine cycle to the next it becomes relevant how the is calculated. On the contrary, in steady-state operation, it is not relevant in which stroke the calculation starts. In that case, the resulting average over several engine cycles is always the same. As in Reference [34], the calculation is started with the intake event (intake-compression-combustion-exhaust). Since, during the deactivating/reactivating engine cycle, some particular deviations from conventional pV-diagrams occur, it is important to keep this in mind.
It must also be mentioned that, regardless of how the is calculated, there is only one pressure in the combustion chamber that acts on the piston; therefore, the way in which the is calculated cannot change the result.
5.2. The Deactivating Cycle
There are two fundamentally different approaches, when it comes to the deactivation of a cylinder: either exhaust gas or air can be trapped inside the cylinder before deactivation.
This choice will lead to different possibilities in the operating strategy upon reactivation. In case air is trapped inside the cylinder, a combustion can occur before the reactivation of the valves. For a direct injected engine, the fuel injection may cause enough turbulence and entrainment for a combustion to take place. If the engine is port injected, an air-fuel mixture has to be trapped inside the cylinder for this option which would, however, be difficult to ignite due to the resulting lack of charge motion.
Since the engine used for this research is only operated with port injected natural gas, the option to trap air or mixture is not considered. Therefore, simulations are made of three different methods for deactivating a cylinder that all trap exhaust gas inside the cylinder:
- (a)
- Do not expel the burned gas of the last combustion and, thus, trap exhaust gas at high pressure.
- (b)
- Conduct the last exhaust stroke and deactivate the exhaust valves thereafter. Thus, trap exhaust gas at low pressure.
- (c)
- Close the exhaust valve during the last exhaust stroke and hence only partially expel the burned gas. Thus, trap exhaust gas at medium pressure.
Method (c) is only possible with sufficient variability in the valve-train. To compare these transition methods, several engine cycles must be taken into account because, as shown in Section 4, it takes several engine cycles until the steady-state gas-spring operation is reached. The value is a sum of mean indicated pressures which is used to quantify each method. It is comprised of the of the last conventional combustion cycle, the cycle in which the cylinder is deactivated, and the following 138 engine cycles.
An optimization was carried out to find the best valve timing for method (c). An exhaust valve closing angle of 25 °CA before top dead center directly initializes the gas spring operation at the desired pressure level for this engine, since, at this crank angle, the in-cylinder pressure is approximately at the value it will have in steady-state gas spring operation. This valve timing depends on the blow-by properties of the specific engine and may vary for different engines. However, this effect is largely independent of the load of the last combustion cycle, as the measure only affects the last exhaust stroke and the gas spring operation.
The upper three plots of Figure 4 show the valve lift curves and the cylinder pressure over several engine cycles after deactivation for each deactivation method. The engine cycle which spans from 0 to 1 in each simulation is referred to as “the deactivating cycle”. The bottom two plots show the trace of the first deactivated cycles and a double logarithmic pV-diagram of the deactivating cycle of each method, respectively.
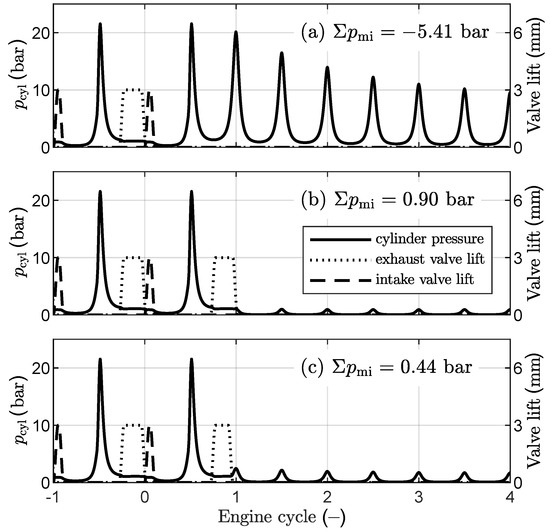
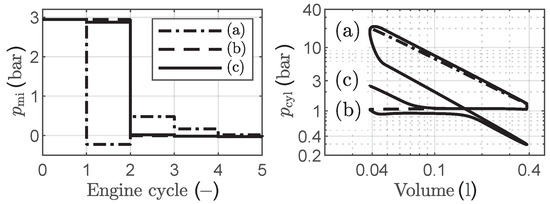
Figure 4.
Upper three plots: valve lift curves and cylinder pressure of different cylinder deactivation strategies. Bottom two plots: traces and a double logarithmic pV-diagram of the deactivating cycle.
The main difference between these methods is that they result in a different in-cylinder pressure after the deactivating cycle, which can be seen in the bottom right plot. Comparing the traces of all methods, the bottom left plot shows that, while methods (b) and (c) are rather similar, method (a) differs strongly. The negative in the deactivating cycle for method (a) results from the high pressure during the exhaust stroke with closed exhaust valves. The positive values directly thereafter result from the fact that the calculation starts at top dead center, and the cylinder content loses mass until steady-state is reached. The value for this deactivation method is the lowest of the three. Comparing methods (b) and (c), one difference is that a slightly lower value results for method (c) in the deactivating cycle. The reason for this difference is that, late in the expansion stroke, when the exhaust valve is closed, the pressure increases. This can be seen in the pV-diagram and is counted as a negatively enclosed area. The following values in the gas-spring operation until steady-state is reached are very similar but slightly lower for method (c). The value is 0.46 bar lower. Therefore, a trade-off exists between increasing the initial losses and avoiding an underpressure in the initial phase of the gas spring operation.
5.3. The Reactivating Cycle
When exhaust gas is trapped inside the deactivated cylinder, there are two fundamentally different approaches, when it comes to reactivating a cylinder: either the intake valves or the exhaust valves can be opened first.
In case the exhaust valves are opened first, the cylinder content is scavenged to the exhaust before opening the intake valves. The other option is to open the intake valve first. In that case, the burned gas fraction is higher for the first combustion as the in-cylinder pressure at the corresponding top dead center is approximately 2 bar. Both intake valve opening and closing angle need to be adjusted for this option.
Simulations are made of three different methods for reactivating a cylinder:
- (a)
- Reactivate the exhaust valves first using conventional valve timing.
- (b)
- Reactivate the exhaust valves first using a very early exhaust valve opening angle.
- (c)
- Reactivate the intake valves first using a modified intake valve opening and closing angle.
Options (b) and (c) are only possible with sufficient variability in the valve-train. An optimization was carried out to find the best timing for the opening of the exhaust valve for method (b). An exhaust valve opening angle of 20 °CA after top dead center maximizes the of the reactivating cycle for this engine, since, at this crank angle, the in-cylinder pressure is approximately equal to the exhaust manifold pressure. This angle depends on the blow-by properties of the specific engine and may vary for different engines. However, this effect is largely independent of the load of the first combustion cycle, as the measure only affects the last expansion and exhaust stroke of the gas spring operation. For method (c), both intake valve timings were optimized. An opening angle of 20 °CA after top dead center minimizes the losses, while an adjusted closing angle leads to the desired . In this case, the last gas spring cycle is not modified, and both valve timings affect the first combustion cycle, as the calculation starts with the intake stroke. In cases when the load of the first combustion is very low, this method may run into the problem that the required opening duration of the intake valve may become shorter than possible with the hardware. In such cases, a later intake valve closing angle must be accepted and counterbalanced by ignition retardation.
The upper three plots of Figure 5 show the valve lift curves and the cylinder pressure over several cycles after reactivation for the three different reactivation methods. The engine cycle that spans from 0 to 1 for methods (a) and (b) is referred to as “the reactivating cycle”. Method (c) does not have a separate reactivating cycle, as the modification of the first intake valve opening can be seen in the first cycle with combustion. The bottom two plots show the trace of the first reactivated cycles and a double logarithmic pV-diagram of the reactivating cycle of each method, respectively.
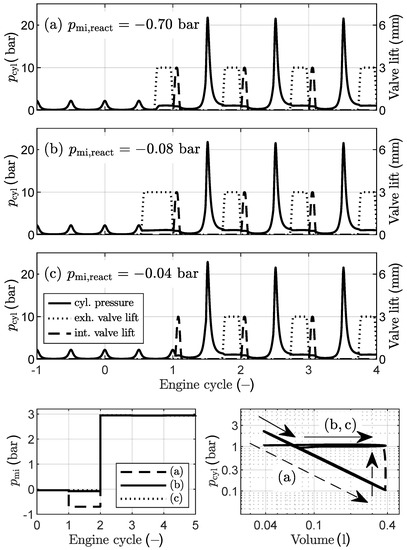
Figure 5.
Upper three plots: valve lift curves and cylinder pressure of different cylinder reactivation strategies. Bottom two plots: traces and a double logarithmic pV-diagram of the deactivating cycle.
Comparing the traces of these methods shows that the only visible difference occurs during the reactivating cycle. Unlike for the deactivating process, the reactivating cycle itself is sufficient to quantify the differences between these methods.
In method (a), the gas spring operation ends in bottom dead center, and the in-cylinder pressure increases to the level of the exhaust manifold pressure as soon as the exhaust valves open. In contrast, for method (b), the gas spring operation ends early, during the downward stroke; therefore, the negatively encountered area in the pV-diagram is much smaller. For method (c), the gas spring operation also ends early, during the downward motion of the piston, but one revolution later compared to method (b), i.e., during the intake stroke. This is also the reason that methods (b) and (c) appear similar in the pV-diagram. These results clearly show that methods (b) and (c) are superior to method (a) since the losses are much lower. The difference between methods (b) and (c) results from the fact that, in method (b), there is essentially one entire engine revolution where the exhaust valves are open. Since exhaust gas is being aspirated into the cylinder and then pushed out into the exhaust manifold again, this method shows slightly higher losses.
The process simulation model does not take into account a possible deterioration of the combustion due to increased internal burned gas fraction or lack of turbulence. Therefore, the practicability of the proposed methods will be put to the test during the experimental part of the study in Section 6.
6. Experimental Results
In this section, we experimentally verify the different strategies for the deactivating and reactivating cycle, respectively. We also show that a torque drop occurs, when the transition to and from deactivated cylinder operation is done too quickly and that this torque drop can be reduced when the transition is done more gradually.
6.1. Cylinder Deactivation
Since the fully variable FlexWork valve-train allows for changes in valve timings of both intake and exhaust from one actuation to the next, the two most promising of the previously discussed cylinder deactivation methods are presented. Thereafter, a so-called “instantaneous” cylinder deactivation, which represents the fastest way to change to two-cylinder operation, is analyzed followed by measurements of more gradual transitions for comparison. This was proposed in Reference [34], and, using this strategy, one cylinder group increases the load linearly, and the other cylinder group decreases the load linearly.
For all pV-diagrams shown in this paper (fired operation and gas-spring operation), the offset correction of the in-cylinder pressure is done during the compression stroke when all valves are closed and before ignition by comparing the measured pressure trace to that of a polytropic compression [43]. For the gas spring operation, this is the only option as all valves are closed.
The left plot of Figure 6 shows the steady-state gas spring operation of 20 engine cycles. The reason that the lines diverge near the bottom dead center is the double logarithmic representation of the pV-diagram. The deviations at bottom dead center are in fact not larger from those at top dead center in the same plot. The average of the steady-state gas spring operation of all four cylinders is −0.051 bar.
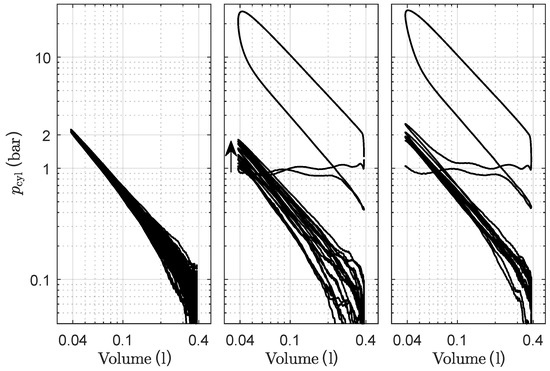
Figure 6.
Measurements of the gas spring operation (left plot) and 2 methods for cylinder deactivation (middle and right plot). The middle plot shows the pressure trace of the last cycle with combustion and several engine cycles thereafter when the exhaust valves are deactivated after a full exhaust stroke. The right plot shows the same number of engine cycles when a partial exhaust stroke is performed in the deactivating cycle.
The middle and right plot of Figure 6 show the deactivating cycle and several gas spring cycles after the deactivation when conventional and optimized valve timing (partial exhaust stroke) is used, respectively. The measurements clearly show that, in the middle plot, the pressure during the gas spring operation increases over time. The first gas spring cycle starts at top dead center with the in-cylinder pressure similar to that of the exhaust manifold after the exhaust stroke, i.e., slightly above 1 bar. Then, the pressure level increases to the steady-state value shown in the left plot due to the increasing in-cylinder mass which results from inverse blow-by. In the right plot, this is not the case, and the steady-state gas spring operation is reached almost instantly. Despite the fact that the difference between the two methods can clearly be seen in the pV-diagram, it was not possible to confirm the difference in the value presented in Section 5.2. The reason is that, due to the stochastic nature of the last combustion before deactivation and the measurement uncertainty (which is rather large at this low pressure level), such small differences vanish.
The additional advantage for the optimized valve timing is that the in-cylinder pressure is higher during the transition to steady-state gas spring operation, which is helpful in order to reduce the aspiration of engine oil into the cylinder which occurs when the pressure below the first piston ring is higher than the in-cylinder pressure [44]. Therefore, the optimized exhaust valve timing for the deactivating cycle is used in the following cylinder deactivation measurements.
Figure 7 shows the result of an instantaneous cylinder deactivation. The upper plot shows the intake valve closing angle for each cylinder group. This value represents the desired engine load, as shown in Figure 2. The middle plot shows the measured values that resulted from the combustion cycle that used the intake valve closing angle shown in the upper plot in the same segment. For deactivated cylinders, no intake valve closing angle is shown, while the measurement of the gas spring cycle is shown. The bottom plot presents the cycle-averaged , which is the mean value of the current segment and the last three values. On the right y-axes in the bottom plot, the torque measurement is shown. This measurement is done with a frequency of 50 Hz and is, therefore, not segment-synchronous.
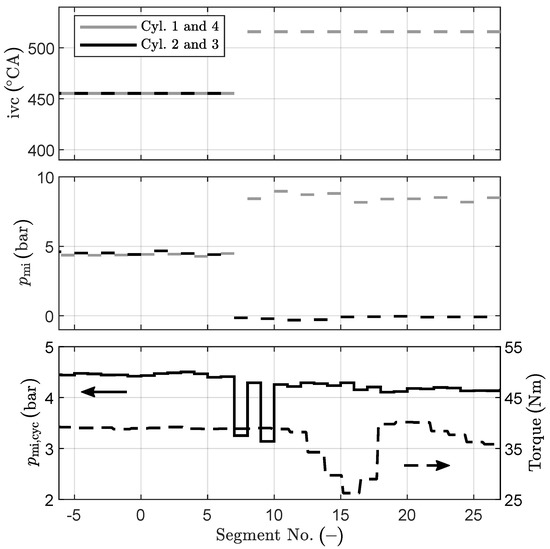
Figure 7.
Measurement of an “instantaneous” cylinder deactivation. Top to bottom: intake valve closing angle (which represents the desired load), measured , cycle-average , and measured torque. For deactivated cylinders, no intake valve closing angle is shown, while the measurement of the gas spring cycle is shown. The term “instantaneous" is used here because this represents the fastest way to change into two-cylinder operation.
Figure 7 clearly shows in the upper and middle plot that the load changes from one cycle to the next for each cylinder group. The of the firing cylinder group directly changes to the targeted value, while the of the deactivated cylinder group directly changes to the gas spring operation. The cycle-averaged features two distinct drops that indicate a lack of torque. The torque measurement confirms that the drops in the are also seen at the gearbox input in the form of a significant torque drop (35% lower torque).
Figure 8 shows the result of a more gradual cylinder deactivation that used a linearly increasing/decreasing torque ramp for the desired load in the two cylinder groups, respectively. This results in two intermediate combustion events for the firing cylinder group and a single intermediate combustion event for the cylinder group that will be deactivated. However, the reduction of the cycle-averaged is clearly visible compared to the instantaneous deactivation and there is almost no drop in the torque measurement (only 8% lower torque). These experimental results clearly show that the amplitude of the deviation of the cycle-averaged and the torque drop can be reduced significantly by the strategy presented in Reference [34]. Despite the fact that no model of the drivetrain and the dual mass flywheel were used, these results show that, when just three combustion events are placed between the four-cylinder and two-cylinder operation, the fluctuations of the cycle-averaged are small enough so that no torque oscillation of the dual mass flywheel results.
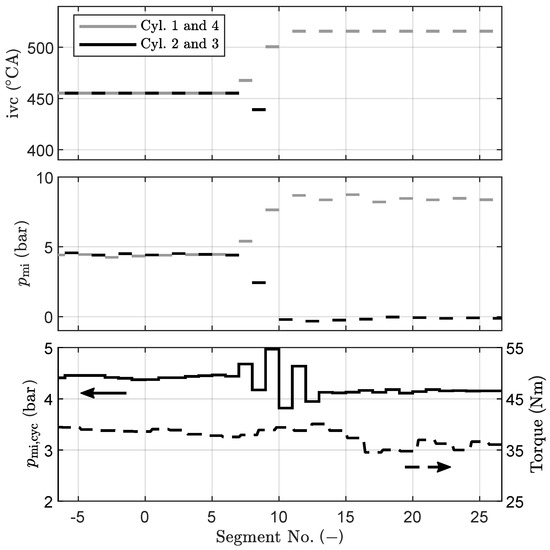
Figure 8.
Measurement of a more gradual cylinder deactivation. Top to bottom: intake valve closing angle (which represents the desired load), measured , cycle-average , and measured torque. For deactivated cylinders, no intake valve closing angle is shown, while the measurement of the gas spring cycle is shown.
It must be noted that, due to the stochastic nature of the combustion process and especially in fast transient load changes as required here, it is not possible to place the three combustion events such that exactly the desired results. However, a clear reduction in the cycle-averaged and the torque drop could always be observed.
In order to test whether a smaller gradient of the torque ramps leads to an even smaller torque drop, additional measurements were made. The torque ramps are such that each cylinder increases/decreases the load by only 0.2 bar from one actuation to the next. The resulting transition from four-cylinder operation to two-cylinder operation takes 1.1 s, and the result is shown in Figure 9. The results clearly show that, during this slower transition, even smaller deviations in the torque can be reached.
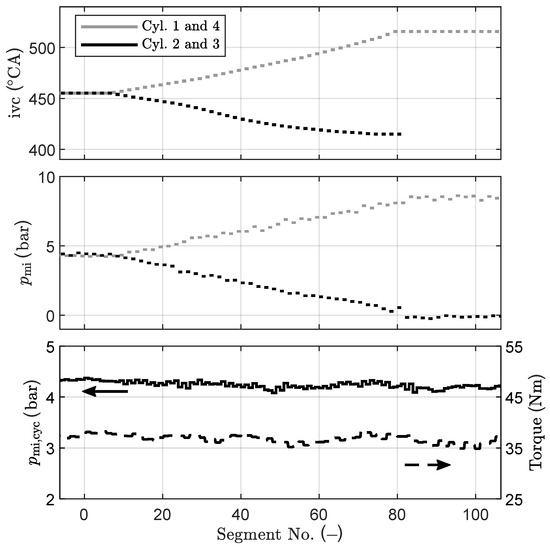
Figure 9.
Measurement of a very slow cylinder deactivation. Top to bottom: intake valve closing angle (which represents the desired load), measured , cycle-average , and measured torque. For deactivated cylinders, no intake valve closing angle is shown, while the measurement of the gas spring cycle is shown.
The trade-off between a small torque drop and a short mode transition time that was identified in Reference [34] is confirmed by these results. However, the experimental results also show that even very short mode transitions result in a small torque drop as long as an instantaneous deactivation is avoided.
6.2. Cylinder Reactivation
All three previously discussed cylinder reactivation methods are presented here. Then, as for the cylinder deactivation, an “instantaneous” reactivation is presented and discussed, followed by the analysis of a more gradual mode transition.
Figure 10 shows the reactivating cycle and one combustion cycle when the conventional (left) and the optimized (middle) exhaust valve timing is used, respectively. The right plot shows the reactivation when the intake valve is opened first. The measurements confirm that there is a significant difference in of the reactivating cycle. The measured value in case of the conventional exhaust valve timing is only off by 0.03 bar. In case of the optimized exhaust valve timing, the difference is 0.08 bar, which may result from an underestimation of the flow coefficients of the exhaust valves for reverse flow direction or from neglecting the flow conditions in the exhaust manifold. For the strategy where the intake valve opens first, it was not possible to get the mixture to ignite. This may be different for direct-injected engines, which is why the general idea and valve strategy is presented here anyway. Both cases, when exhaust and intake valve timing are optimized, respectively, show lower losses than using the conventional exhaust valve timing. For the following cylinder reactivation measurements, the optimized exhaust valve timing is used for the reactivating cycle.
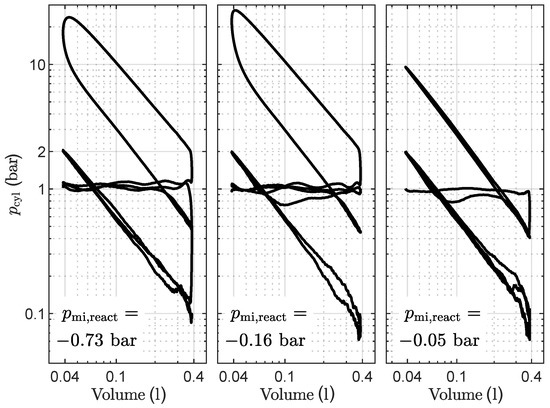
Figure 10.
All plots show measurements of pressure traces of the reactivating cycle followed by one combustion cycle. The conventional exhaust valve timing is used on the left, while the middle plot shows the result when the optimized exhaust valve timing is used in the reactivating cycle. The right plot shows the reactivation when the intake valve is opened first.
For the cylinder reactivation strategy, one small change is made compared to the strategy presented in Reference [34]. In that publication, the of the reactivating cycle was assumed to be −0.8 bar, which corresponds to steady-state motored operation with deactivated intake valves and activated exhaust valves. Since with the fully variable valve-train optimized valve timings can be used to reduce these losses, the slight load increase of the firing cylinder group before the cylinder reactivation is not required here.
Figure 11 shows the results of an instantaneous cylinder reactivation. The results are very similar to those of an instantaneous cylinder deactivation.
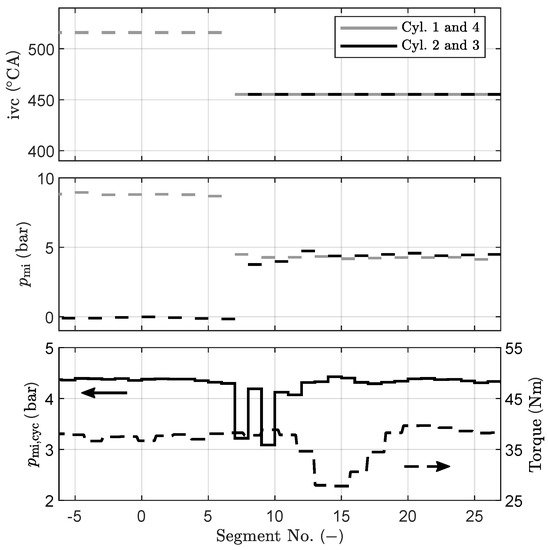
Figure 11.
Measurement of an “instantaneous” cylinder reactivation. Top to bottom: intake valve closing angle (which represents the desired load), measured , cycle-average , and measured torque. For deactivated cylinders, no intake valve closing angle is shown, while the measurement of the gas spring cycle is shown. The term “instantaneous” is used here because this represents the fastest way to change back into four-cylinder operation.
Figure 12 shows a more gradual cylinder reactivation. The results are again very similar to those of a gradual cylinder deactivation. A soft reactivation reduces fluctuations of the cycle-averaged and the torque drop.
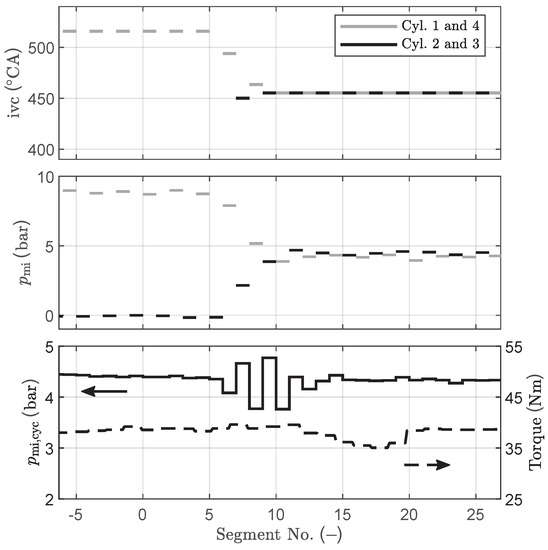
Figure 12.
Measurement of a more gradual cylinder reactivation. Top to bottom: intake valve closing angle (which represents the desired load), measured , cycle-average , and measured torque. For deactivated cylinders, no intake valve closing angle is shown, while the measurement of the gas spring cycle is shown.
It must be noted that, due to the stochastic nature of the combustion process, especially for the first combustion after operation in the deactivated state and especially at very low loads, the desired is not always achieved. Using fuel enrichment for the first combustion helps to avoid misfiring, but the reactivation from the deactivated state remains challenging. However, also for the cylinder reactivation, a clear reduction in the cycle-averaged and the torque drop could always be observed.
7. Conclusions
The transition from fired operation to gas spring operation, and vice versa, as well as the deactivated cylinder state, are essential for mode changes, such as cylinder deactivation or skip-firing operation.
A process simulation model was used to analyze how a cylinder behaves in the deactivated state. The results show that a different initial pressure before deactivating a cylinder or different blow-by properties still lead to the same steady-state in-cylinder mass. The steady-state is reached after approximately 6 s, which corresponds to 100 engine cycles at 2000 rpm and 200 engine cycles at 4000 rpm, respectively. The corresponding steady-state pressure amplitude changes for different compression ratios. The in-cylinder pressure level is important for the deactivating and reactivating cycle, respectively.
The simulation model was also used to analyze the last cycle before deactivating and the first cycle after reactivating a cylinder, respectively. Results show that optimizing the exhaust valve closing timing for the deactivation and the exhaust valve opening timing for the reactivation process are beneficial. While the advantage during the deactivation is in avoiding under-pressure, the advantage during the reactivating cycle over conventional valve timing is approximately 0.6 bar .
Experimental results confirm the advantages of optimized valve timing. For the reactivating cycle, the clear advantage can be measured, and the difference for the deactivating cycle is clearly visible in the pV-diagram.
Further experimental results for different types of cylinder deactivation/reactivation processes show how the specific strategy that is used can help to reduce an unavoidable torque drop. When the deactivation/reactivation process is done as quickly as possible, a large torque drop occurs. When the torque of the deactivating/firing cylinder group is decreased/increased more gradually, this torque drop can be reduced significantly.
This research shows that the transition to and from the gas spring operation must be taken into account and highlights the benefits resulting from an optimization of the valve timing. Beyond cylinder deactivation, this is relevant for skip-firing operation and other non-conventional engine operating modes, such as 8-stroke and 12-stroke operation, which will be part of future research. Furthermore, the experimental results show that maintaining low oscillations in the cycle-averaged during mode transitions avoids a large drop in torque at the output shaft. This insight may be helpful when managing other mode transitions, such as changing between 4-stroke and 8-stroke operation, which will be analyzed in future research, as well.
Author Contributions
Conceptualization, N.Z. and J.R.; methodology, N.Z. and J.R.; software, N.Z.; validation, N.Z.; formal analysis, N.Z.; investigation, N.Z.; resources, P.S.; data curation, N.Z.; writing—original draft preparation, N.Z.; writing—review and editing, N.Z., J.R. and P.S.; visualization, N.Z.; supervision, P.S.; project administration, P.S.; funding acquisition, P.S. All authors have read and agreed to the published version of the manuscript.
Funding
This research is part of the project “FlexWork” which is funded by the Swiss Federal Office of Energy, grant number SI/501619-01.
Acknowledgments
The authors express their gratitude to Wolfgang Schneider (Wolfgang Schneider Ingenieurbüro, Thun) and Andyn Omanovic (Empa) for their contributions in inventing and realizing the electro-hydraulic valve-train. Special thanks go also to the technical staff of Empa (Hugo Ehrensperger, Roland Spühler, Roland Graf) who set-up the experiments and modified the engine with great care and to Thomas Hilfiker for the discussions about technical aspects of state-of-the-art spark ignition engines.
Conflicts of Interest
The authors declare no conflict of interest.
Abbreviations
The following abbreviations are used in this manuscript:
| NVH | noise, vibration, and harshness |
| ICE | internal combustion engine |
| ECU | engine control unit |
| rpm | revolutions per minute |
| cyc | cycle |
| deact | deactivation |
| react | reactivation |
| ivc | intake valve closing angle |
| mean effective pressure | |
| mean indicated pressure | |
| fuel mean effective pressure | |
| e | Willans efficiency |
| gas exchange losses | |
| mechanical friction losses |
References
- Reitz, R.; Ogawa, H.; Payri, R.; Fansler, T.; Kokjohn, S.; Moriyoshi, Y.; Agarwal, A.; Arcoumanis, D.; Assanis, D.; Bae, C.; et al. IJER editorial: The future of the internal combustion engine. Int. J. Engine Res. 2020, 21, 3–10. [Google Scholar] [CrossRef]
- Kalghatgi, G. Is it really the end of internal combustion engines and petroleum in transport? Appl. Energy 2018, 225, 965–974. [Google Scholar] [CrossRef]
- Luo, X.; Wang, J.; Dooner, M.; Clarke, J. Overview of current development in electrical energy storage technologies and the application potential in power system operation. Appl. Energy 2015, 137, 511–536. [Google Scholar] [CrossRef]
- Hänggi, S.; Elbert, P.; Bütler, T.; Cabalzar, U.; Teske, S.; Bach, C.; Onder, C. A review of synthetic fuels for passenger vehicles. Energy Rep. 2019, 5, 555–569. [Google Scholar] [CrossRef]
- Aslam, M.; Masjuki, H.; Kalam, M.; Abdesselam, H.; Mahlia, T.; Amalina, M. An experimental investigation of CNG as an alternative fuel for a retrofitted gasoline vehicle. Fuel 2006, 85, 717–724. [Google Scholar] [CrossRef]
- Lejda, K.; Jaworski, A.; Mądziel, M.; Balawender, K.; Ustrzycki, A.; Savostin-Kosiak, D. Assessment of Petrol and Natural Gas Vehicle Carbon Oxides Emissions in the Laboratory and On-Road Tests. Energies 2021, 14, 1631. [Google Scholar] [CrossRef]
- Warguła, Ł.; Kukla, M.; Lijewski, P.; Dobrzyński, M.; Markiewicz, F. Impact of Compressed Natural Gas (CNG) Fuel Systems in Small Engine Wood Chippers on Exhaust Emissions and Fuel Consumption. Energies 2020, 13, 6709. [Google Scholar] [CrossRef]
- Turner, J.W.; Pearson, R.J.; Kenchington, S.A. Concepts for improved fuel economy from gasoline engines. Int. J. Engine Res. 2005, 6, 137–157. [Google Scholar] [CrossRef]
- Middendorf, H.; Theobald, J.; Lang, L.; Hartel, K. Der 1,4-l-TSI-Ottomotor mit Zylinderabschaltung. Mot. Z. 2012, 73, 186–193. [Google Scholar] [CrossRef]
- Demmelbauer-Ebner, W.; Middendorf, H.; Birkigt, A.; Ganzer, M.; Hagelstein, D.; Persigehl, K. EA211 TSI®evo–The new 4-cylinder gasoline engines from Volkswagen. In Proceedings of the 25th Aachen Colloquium Automobile and Engine Technology, Aachen, Germany, 10–12 October 2016. [Google Scholar]
- Indra, F. Zylinderabschaltung für alle Hubkolbenmotoren? MTZ 2011, 72, 712–715. [Google Scholar] [CrossRef]
- Michelini, J.; Glugla, C. Control system design for steady state operation and mode switching of an engine with cylinder deactivation. In Proceedings of the 2003 American Control Conference, Denver, CO, USA, 4–6 June 2003; Volume 4, pp. 3125–3129. [Google Scholar]
- Kutlar, O.A.; Arslan, H.; Calik, A.T. Methods to improve efficiency of four stroke, spark ignition engines at part load. Energy Convers. Manag. 2005, 46, 3202–3220. [Google Scholar] [CrossRef]
- Leone, T.G.; Pozar, M. Fuel economy benefit of cylinder deactivation–sensitivity to vehicle application and operating constraints. SAE Trans. 2001, 110, 2039–2044. [Google Scholar]
- Dönitz, C.; Vasile, I.; Onder, C.; Guzzella, L. Dynamic programming for hybrid pneumatic vehicles. In Proceedings of the American Control Conference, Philadelphia, PA, USA, 10–12 July 2009; pp. 3956–3963. [Google Scholar]
- Turner, J.W.G.; Bassett, M.D.; Pearson, R.J.; Pitcher, G.; Douglas, K.J. New Operating Strategies Afforded by Fully Variable Valve Trains; SAE Technical Paper; SAE: Warrendale, PA, USA, 2004. [Google Scholar]
- Flierl, R.; Lauer, F.; Breuer, M.; Hannibal, W. Cylinder deactivation with mechanically fully variable valve train. SAE Int. J. Engines 2012, 5, 207–215. [Google Scholar] [CrossRef]
- Wilcutts, M.; Switkes, J.; Shost, M.; Tripathi, A. Design and benefits of dynamic skip fire strategies for cylinder deactivated engines. SAE Int. J. Engines 2013, 6, 278–288. [Google Scholar] [CrossRef]
- Kuruppu, C.; Pesiridis, A.; Rajoo, S. Investigation of Cylinder Deactivation and Variable Valve Actuation on Gasoline Engine Performance; SAE Technical Paper; SAE: Warrendale, PA, USA, 2014. [Google Scholar]
- McGhee, M.; Wang, Z.; Bech, A.; Shayler, P.; Witt, D. The effects of cylinder deactivation on the thermal behaviour and fuel economy of a three-cylinder direct injection spark ignition gasoline engine. Proc. Inst. Mech. Eng. Part J. Automob. Eng. 2019, 233, 2838–2849. [Google Scholar] [CrossRef]
- Ramesh, A.K.; Shaver, G.M.; Allen, C.M.; Nayyar, S.; Gosala, D.B.; Caicedo Parra, D.; Koeberlein, E.; McCarthy, J.; Nielsen, D. Utilizing low airflow strategies, including cylinder deactivation, to improve fuel efficiency and aftertreatment thermal management. Int. J. Engine Res. 2017, 18, 1005–1016. [Google Scholar] [CrossRef]
- Mo, H.; Huang, Y.; Mao, X.; Zhuo, B. The effect of cylinder deactivation on the performance of a diesel engine. Proc. Inst. Mech. Eng. Part J. Automob. Eng. 2014, 228, 199–205. [Google Scholar] [CrossRef]
- Zammit, J.P.; McGhee, M.J.; Shayler, P.J.; Law, T.; Pegg, I. The effects of early inlet valve closing and cylinder disablement on fuel economy and emissions of a direct injection diesel engine. Energy 2015, 79, 100–110. [Google Scholar] [CrossRef]
- Zammit, J.P.; McGhee, M.J.; Shayler, P.J.; Pegg, I. The influence of cylinder deactivation on the emissions and fuel economy of a four-cylinder direct-injection diesel engine. Proc. Inst. Mech. Eng. Part J. Automob. Eng. 2014, 228, 206–217. [Google Scholar] [CrossRef]
- Ding, C.; Roberts, L.; Fain, D.J.; Ramesh, A.K.; Shaver, G.M.; McCarthy, J.; Ruth, M.; Koeberlein, E.; Holloway, E.A.; Nielsen, D. Fuel efficient exhaust thermal management for compression ignition engines during idle via cylinder deactivation and flexible valve actuation. Int. J. Engine Res. 2016, 17, 619–630. [Google Scholar] [CrossRef]
- Kitabatake, R.; Minato, A.; Inukai, N.; Shimazaki, N. Simultaneous improvement of fuel consumption and exhaust emissions on a multi-cylinder camless engine. SAE Int. J. Engines 2011, 4, 1225–1234. [Google Scholar] [CrossRef]
- McCarthy, J.; Theissl, H.; Walter, L. Improving commercial vehicle emissions and fuel economy with engine temperature management using variable valve actuation. Internationaler Motorenkongress 2017; Liebl, J., Beidl, C., Eds.; Springer Fachmedien Wiesbaden: Wiesbaden, Germany, 2017; pp. 591–618. [Google Scholar]
- Rebbert, M.; Kreusen, G.; Lauer, S. A New Cylinder Deactivation by FEV and Mahle; SAE Technical Paper; SAE: Warrendale, PA, USA, 2008. [Google Scholar]
- Zheng, Q. Characterization of the Dynamic Response of a Cylinder Deactivation Valvetrain System; SAE Technical Paper; SAE: Warrendale, PA, USA, 2001. [Google Scholar]
- Flierl, R.; Hannibal, W.; Schurr, A.; Neugärtner, J. Dreizylinder-Turbomotor mit Zuschaltung eines Zylinders. In Fahrerassistenzsysteme und Effiziente Antriebe; Springer Fachmedien Wiesbaden: Wiesbaden, Germany, 2015; pp. 128–135. [Google Scholar]
- Fujiwara, M.; Kumagai, K.; Segawa, M.; Sato, R.; Tamura, Y. Development of a 6-Cylinder Gasoline Engine with New Variable Cylinder Management Technology; SAE Technical Paper; SAE: Warrendale, PA, USA, 2008. [Google Scholar]
- Kreuter, P.; Heuser, P.; Reinicke-Murmann, J.; Erz, R.; Stein, P.; Peter, U. Meta-CVD system: An electro-mechanical cylinder and valve deactivation system. SAE Trans. 2001, 110, 107–117. [Google Scholar]
- Fortnagel, M.; Schommers, J.; Clauß, R.; Glück, R.; Nöll, R.; Reckzügel, C.; Treyz, W. Der neue Mercedes-Benz-Zwölfzylindermotor mit Zylinderabschaltung–Teil 1: Grundkonzept, konstruktiver und mechanischer Aufbau. Mtz-Mot. Z. 2000, 61, 280–291. [Google Scholar] [CrossRef]
- Ritzmann, J.; Zsiga, N.; Peterhans, C.; Onder, C. A Control Strategy for Cylinder Deactivation. Control. Eng. Pract. 2020, 103, 104566. [Google Scholar] [CrossRef]
- Senapati, U.; McDevitt, I.; Hankinson, A. Vehicle Refinement Challenges for a Large Displacement Engine with Cylinder Deactivation Capability; SAE Technical Paper; SAE: Warrendale, PA, USA, 2011. [Google Scholar]
- Zsiga, N.; Omanovic, A.; Soltic, P.; Schneider, W. Functionality and Potential of a New Electrohydraulic Valve Train. MTZ Worldw. 2019, 80, 18–27. [Google Scholar] [CrossRef]
- Schechter, M.; Levin, M. Camless Engine; SAE Technical Paper; SAE: Warrendale, PA, USA, 1996. [Google Scholar]
- Zsiga, N.; Omanovic, A.; Soltic, P.; Schneider, W. Wirkungsgradvorteile beim Ottomotor unter Verwendung einer nockenwellenlosen, vollvariablen Ventilsteuerung gegenüber gedrosseltem Betrieb. In 8. VDI-Tagung Ventiltrieb und Zylinderkopf; VDI: Düsseldorf, Germany, 2019. [Google Scholar]
- Zsiga, N.; Omanovic, A.; Soltic, P.; Schneider, W. FlexWork – Lastregelung bei einem Motor mit elektrohydraulischem, vollvariablem Ventiltrieb. In Ladungswechsel und Emissionierung 2018; Springer Fachmedien Wiesbaden: Wiesbaden, Germany, 2018. [Google Scholar]
- Balmelli, M.; Zsiga, N.; Merotto, L.; Soltic, P. Effect of the Intake Valve Lift and Closing Angle on Part Load Effciency of a Spark Ignition Engine. Energies 2020, 13, 1682. [Google Scholar] [CrossRef]
- Guzzella, L.; Onder, C. Introduction to Modeling and Control of Internal Combustion Engine Systems; Springer Science & Business Media: Berlin, Germany, 2009. [Google Scholar]
- Woschni, G. A Universally Applicable Equation for the Instantaneous Heat Transfer Coefficient in the Internal Combustion Engine; SAE Technical Paper; SAE: Warrendale, PA, USA, 1967. [Google Scholar]
- Tunestal, P.; Hedrick, J.K.; Johansson, R. Model-based estimation of cylinder pressure sensor offset using least-squares methods. In Proceedings of the 40th IEEE Conference on Decision and Control (Cat. No.01CH37228), Orlando, FL, USA, 4–7 December 2001; Volume 4, pp. 3740–3745. [Google Scholar]
- Gamble, R.; Priest, M.; Taylor, C. Detailed Analysis of Oil Transport in the Piston Assembly of a Gasoline Engine. Tribol. Lett. 2003, 14, 147–156. [Google Scholar] [CrossRef]
Publisher’s Note: MDPI stays neutral with regard to jurisdictional claims in published maps and institutional affiliations. |
© 2021 by the authors. Licensee MDPI, Basel, Switzerland. This article is an open access article distributed under the terms and conditions of the Creative Commons Attribution (CC BY) license (https://creativecommons.org/licenses/by/4.0/).