Article

Impact of Process Parameters on the Diameter of Nanobubbles Generated by Electrolysis on Platinum-Coated Titanium Electrodes Using Box–Behnken Experimental Design

Department of Biotechnology and Bioprocess Engineering, Faculty of Chemical and Process Engineering, Warsaw University of Technology, Warynskiego 1, 00-645 Warsaw, Poland
*
Author to whom correspondence should be addressed.
Energies 2021, 14(9), 2542; https://doi.org/10.3390/en14092542
Submission received: 14 April 2021 / Revised: 23 April 2021 / Accepted: 26 April 2021 / Published: 28 April 2021
(This article belongs to the Special Issue Multiphase Flows)

Abstract

:
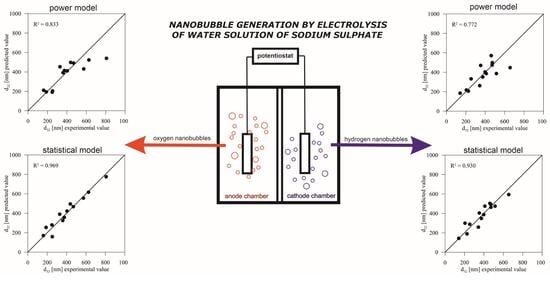
(1) The generation of nanobubbles by electrolysis is an interesting method of using electrical energy to form bubble nuclei, effectively creating a multiphase system. For every process, the effectiveness of nanobubble generation by electrolysis depends on various process parameters that impact should be determined. (2) In this work, the electrolytic generation of hydrogen and oxygen bubbles was performed in a self-built setup, in which a Nafion membrane separated two chambers. The generation of bubbles of both gases was investigated using Box–Behnken experimental design. Three independent variables were salt concentration, current density, and electrolysis time, while the dependent variables were Sauter diameters of generated bubbles. An ANOVA analysis and multivariate regression were carried out to propose a statistical and power model of nanobubble size as a process parameter function. (3) The generation of bubbles of hydrogen and oxygen by electrolysis showed that different factors or their combinations determine their size. The results presented in this work proved to be complementary to previous works reported in the literature. (4) The Sauter diameter of bubbles increases with salt concentration and stays constant with increasing current density in investigated range. The proposed correlations allow the Sauter diameters of nanobubbles generated during electrolysis to be predicted.

Graphical Abstract

1. Introduction

Electrolysis is the typical process during which an external source of energy can be used to form the multiphase gas–liquid system. As a consequence of applied current, gas bubbles can be created. Spherical gas bubbles in liquid can be categorised based on their diameter. There are numerous classifications of bubbles on the boundary of microscale and nanoscale (for example [1,2,3,4]). According to ISO 20480-1:2017, we can call all bubbles with a diameter under 100 μm ‘fine bubbles’. Bubbles under 1 μm can then be called ultrafine bubbles, while those in the range from 1 μm to 100 μm are microbubbles. In this study, we assume that bubbles of which diameter does not exceed 1 μm are called nanobubbles (which is identical to ultrafine bubbles according to ISO norm). We adhere to the name microbubbles, as defined in ISO norm.
These fine objects are used in various industry branches, including wastewater treatment, plant and animal growth propagation, and disinfection [5], thanks to their extraordinary characteristics, distinguishing them from their macroscale counterparts. These properties include high surface tension, rising velocity lower than Brownian motion, and surface charge [2].
Nanobubbles and microbubbles in liquid are generated primarily by using hydrodynamic methods, including ejectors, venturi nozzles, and porous membranes, among others [6,7,8]. Electrolysis is commonly used to obtain pure elements, both metals and gases. It is even considered the “clean way to produce hydrogen” [9]. Interestingly, bubbles generated by electrolysis proved to be helpful in the alignment of objects at the microscale, but the efficiency of this process is still low, and it needs further refining to be viable for human cell alignment [10]. Proof of gas nanobubble generation during electrolysis was given by Tyrell and Attard (2001), who performed atomic force microscopy (AFM) analysis of electrode surfaces [11]. Perera et al. (2018) have shown by analysing nanobubble generation on the nanoelectrode that surface nanobubbles forming on the electrode surface detach and form bulk nanobubbles. Various researchers have investigated a single nanobubble generation mechanism on the nanoelectrode surface [12,13,14]. German et al. (2016) have investigated the critical radius of bubble formation based on the free energy of bubble formation and the Young–Laplace equation [13]. By analysing the peak current during bubble formation, the authors compared bubbles of different gases (hydrogen, oxygen, and nitrogen), both when treated as ideal gases and when correction factors are included. That concludes that the cores of bubble formation of pure gases cannot be smaller than 3.6 ± 0.3 nm, 7.9 ± 1.6 nm, and 10.0 ± 1.0 nm in radius for hydrogen, oxygen, and nitrogen, respectively. As there are concrete proofs of nanobubble generation on the nanoelectrodes, it is interesting whether it is possible to generate nanobubbles on electrodes of larger size.
Electrolysis is seldom used to generate nanobubbles in industrial processes, but it can be used as an alternative generation method on a laboratory scale. The team led by Kenji Kikuchi investigated the parameters of the generation of nanobubbles using electrolysis, including approaches to determine the concentration of hydrogen or oxygen nanobubbles [15,16,17,18]. Specifically, the Winkler method for oxygen nanobubbles [18] and dissolved hydrogen (DH) meter for hydrogen nanobubbles [16] were used in nanobubble concentration determination. All investigations involved a continuous flow, platinum-coated titanium electrodes, and a Nafion diaphragm separating anode and cathode chambers. Ions were introduced into the solution using NaOH (pH adjustment) and NaCl (ionic strength adjustment). Each electrode’s surface area was 25 cm2, and its chamber had a volume of 10 cm3. When oxygen nanobubbles were generated in this setup, the average diameter of nanobubbles after one day measured using DLS PAR-III (Otsuka Denshi) was about 50 nm, while in the next two days, the diameter increased to about 300 nm [18]. Similar results are obtained for oxygen nanobubbles generated using other methods [2,19]. In previous works, Kikuchi et al. also investigated hydrogen nanobubbles, for which they have obtained a much wider distribution of bubbles [20].
In contrast to Kikuchi et al., in this work, the batch reactor is used, which has one crucial advantage for nanobubble investigations. The electrolysis chamber volume is over 60 times larger than in Kikuchi et al.’s work. For that reason, the change in the solution composition can be neglected. Kikuchi et al. [15,16,17,18] ensured stable ionic strength of the solution by adding sodium hydroxide, which fulfils a similar purpose. We did not perform this to minimise the number of compounds in the liquid volume to simplify the experimental data analysis setup.
Another research team investigated nanobubble behaviour in alternating polarity electrolysis (AP electrolysis), where the shape of the cloud of nanobubbles could be controlled by adjusting the frequency of polarity alternation [21,22,23]. The shape of the nanobubble cloud changes when the frequency of polarity alternation changes and bubbles migrate between electrodes of different sizes. This method proves that nanobubbles have a significant surface charge as they react with the electric charge generated on the electrodes.
Interestingly, there are works concerning the combustion of gases in nanobubbles containing mixtures of hydrogen and oxygen [24,25]. The authors show that energy released during nanobubble merging is so high that it cannot be part of the Joule heating of the electrolyte. Additionally, the authors report visible ignition of the merged bubble. The authors performed mathematical modelling of combustion in the merged bubble and showed that the essential part of spontaneous combustion is the exposition of hydrogen atoms on the bubble surface (hydrogen molecule dissociation). Additionally, such a reaction can create even significant amounts of hydrogen peroxide [24,26].
Besides the work of Kikuchi et al. (2001), there are no investigations concerning the influence of electrolysis time, current density value, or salt concentration on the average size of nanobubbles generated by electrolysis. However, some interesting considerations concerning the formation of microbubbles directly on the electrode surface, without considering the effects occurring in the bulk of the liquid, are present. Zhang and Zeng [27] have analysed the formation of bubbles in the range of 200 μm to 1000 μm on the vertically oriented Ni electrodes submerged into solutions of KOH. Similarly, Chandran et al. [28] have analysed the release of the microbubbles (diameter 20–50 μm) from horizontally-oriented copper electrodes during electrolysis of sodium chloride. The authors examined the grayscale images captured by a CCD camera to find the connection between the bubble’s growth time on the electrode and the radius of such bubble. They found the agreement with the equation proposed by Scriven [29]:
R = 2β(αt)0.5,
where R is the bubble radius at an instant t. β is a parameter dependent on the degree of supersaturation, and α is the mass diffusivity of the gas in the liquid. They found out that constant β increases with the increase in the current value, which indicates a higher degree of supersaturation in electrode vicinity. Additionally, the authors analysed the growth of bubbles after detachment from the electrode. They observed that in the bubble stream over the electrode, bubbles grow rapidly just after detachment and then slow down and grow nearly linearly with the increasing distance from the electrode surface. Matsuura et al. [30] also analysed the growth of bubbles released from the electrode. They used a high-speed camera connected to the microscope and tungsten cathode and a stainless iron anode, observing the kinetics of bubble diameter change. Unfortunately, in nanoscale, employing the observation of a single nanobubbles’ growth on the electrode is much more challenging. For that reason, the equation proposed by Scriven cannot be used if one cannot observe the moment of bubble formation. As such, it would seem that a typical formula for bubble formation cannot be employed for nanobubble generation without nanoelectrodes. However, as shown by Hao et al. [31], total-internal reflection fluorescence (TIRF) microscopy allows for the observation of single hydrogen and oxygen nanobubbles during electrolysis using indium tin oxide (ITO) electrodes.
However, in this study, we are primarily interested in a more statistical and general approach to the electrolytic generation of nanobubbles. Thanks to light scattering methods, it is possible to observe nanobubbles in the bulk of liquid [32,33] after their detachment from the electrode surface. Then, one can analyse the statistical distribution of the bubbles’ diameter in the liquid that will be used in this study.
Nevertheless, the previous literature concerning the electrolytic generation of nanobubbles is not broad. The fact that there is not much information in the literature about the generation of bulk nanobubbles by electrolysis shows how much work is yet to be conducted to understand this process thoroughly. As such, this work belongs to fundamental science concerning the electrolytic generation of nanobubbles. Even though bubbles generated by electrolysis in macroscale are incredibly well-documented, the knowledge about their nanoscale counterparts only starts to grow due to the development of measurement techniques dedicated to the exploration of nanoscale.
This work investigates the impact of process parameters on the size of generated nanobubbles during the electrolysis of Na2SO4. We have chosen this salt as, during electrolysis, there would be a difference in the electrode reaction kinetics on the cathode and anode due to the single-charged cation and double-charged anion presence. As we are more interested in the process approach to nanobubble generation and not the strict mechanism of generation of single nanobubbles, we have chosen to investigate the generation by electrolysis using statistical methods. Three selected parameters were set as the independent variables, each having three distinct values. A Box–Behnken design (DoE) was used to plan the experiments. The second aim of this study is to propose the statistical model of this phenomenon based on an ANOVA and multiple regression analysis using Statistica 13.1 (Statsoft Poland, Cracov, Poland) software and compare it to power model based on three process parameters: salt concentration (0.01–0.19 mol/dm3), current density (20–40 mA/cm2) and time of electrolysis (from 10 to 30 min). In this work, we are not investigating the possibility of nanobubble generation, as it was previously investigated. The novelty of this paper is taking the next step in electrolytically-generated nanobubble studies, namely the influence of typical electrolysis parameters on nanobubble diameter. Results of this work should allow predicting the nanobubble size for given generation parameters. That approach is broader than it is presented in the literature and makes a bridge between fundamental science and applications, such as employing spontaneous combustion in nanobubbles, as reported by Prokaznikov et al. [24].

2. Materials and Methods

2.1. Electrolysis

The electrolysis of Na2SO4 was performed in the setup presented in Figure 1. As the electrolyte, 1.5 dm3 of sodium sulphate solution of given concentration was used. Reagent-grade salt (Merck, Darmstadt, Germany) was dissolved in deionised water. The setup consisted of a Nafion cation-exchanging membrane, which divided the electrolyser volume into two chambers filled with sodium sulphate solution, which contained the cathode and anode, respectively. Chambers were open to the atmosphere, preventing the increase in pressure in the cell. Both electrodes were titanium rods (diameter 1 mm) coated with a 1.5 μm layer of platinum (William Gregor Ltd., East Grinstead, UK), submerged into the electrolyte so that each electrode had a submerged area of 3.14 cm2. The electrodes were connected to the potentiostat, generating the current necessary for the electrolysis to happen. All parameters of electrolysis were controlled using AtlasCorr software. The electrolysis was performed using a galvanostatic program, setting the value of the current constant during the process.
Hydrogen or oxygen bubbles were generated in the cathode and anode chambers, respectively. During sampling, syringe needles placed into both chambers were used. Needles were placed parallel to the electrodes, 1 cm to the side, the same distance to Nafion membrane as the electrodes. We started the DLS measurements within a minute of the sampling and did not shake the sampling vessel. Therefore we state that the density of size distribution did not change, and therefore the Sauter diameter stayed constant.

2.2. Experimental Plan

The influence of three parameters on the Sauter diameter of oxygen and hydrogen bubbles in the dispersion (dependent variables) was investigated. The chosen parameters (independent variables) were salt concentration, current density, and the time of electrolysis. We assume that salt concentration is independent of electrolysis time as our electrolytic cell volume to electrode surface ratio is over 1000 times larger than in studies by Kikuchi et al. [18], and the rate of change in salt concentration is negligible. The Box–Behnken experimental plan was generated using Statistica 13.1 (StatSoft) software, and as such, three levels of each independent variable were chosen. The values of the selected parameters in each experiment carried out as part of the experimental plan are presented in Table 1. Values of salt concentration are from the same range as in mentioned studies by Kikuchi et al. [16,17,18], while current density is just over the current densities investigated by Kikuchi et al. That choice was crucial to check whether, for current density over 16 mA/cm2, the change in the Sauter diameter of bubbles is negligible, as would be valid from extrapolation of the data obtained by Kikuchi et al.
The time of electrolysis was 10–30 times longer than reported by Kikuchi, as we wished for more bubbles to be formed for more statistically viable analysis. We could conduct that based on the much larger electrolyte volume, which allowed bubbles to disperse freely.
The whole plan was performed twice with randomised order of experiments, and as such, 30 experiments were carried out in total.

2.3. Size Distribution Density Measurement

After bubble generation, samples were measured for size distribution density using a Zetasizer Nano ZS (Malvern Panalytical, Malvern, UK) by the dynamic light scattering (DLS) method. This method is based upon the analysis of changes of light scattered on objects in a liquid when they move. Movement is restricted to the only chaotic movement of nanoscopic objects (Brownian motion). The faster the move observed, the smaller the object detected. The detected objects are classified based on their average diameter. This method is commonly used in bubble studies [2,5,6].
Samples were taken from both cathode and anode chambers after each experiment. Two volumes of each sample were analysed, and for each volume, five measurements were carried out.
Measurement of number size distribution density was then averaged to obtain the Sauter diameter of bubbles (d32 [nm]) in liquid according to Equation (2).
d32 = Σ(di3ni)/Σ(di2ni),
where ni is the number fraction of bubbles of an average diameter of di [nm].

2.4. Statistical Analysis

The ANOVA analysis and multiple regression of the results obtained from experiments performed according to the Box–Behnken design were carried out using Statistica 13.1. software. Three independent variables were determined: current density [mA/cm2], salt concentration [mol/dm3], and time of electrolysis [min]. Sauter diameters of hydrogen and oxygen bubbles were the dependent variables. A model with linear–linear interactions was proposed.

2.5. Power Model

Another modelling approach was the power model, commonly used to describe numerous correlations for mass transfer (Sherwood number) or heat transfer (Nusselt number). We proposed a power model in the form presented below:
d32 = A∙Cx∙Iy∙tz,
where d32 is the Sauter diameter of bubbles, C is the salt concentration, I is the current density, t is the electrolysis time, and x, y, z are the exponents corresponding to variables C, I, t, respectively.

2.6. Parity Plots

Parity plots were drawn to compare the quality of different models. Parity plots compare the experimental values of dependent variables with values predicted by the model for the same set of independent variables. The R2 factor is the correlation coefficient between the model and experimental values.

3. Results and Discussion

3.1. Sauter Diameters of Obtained Bubbles

Experiments were performed according to the Box–Behnken design for three independent variables. Table 2 presents the Sauter diameter (averaged over two repetitions of the plan) of hydrogen and oxygen bubbles obtained in all experiments.
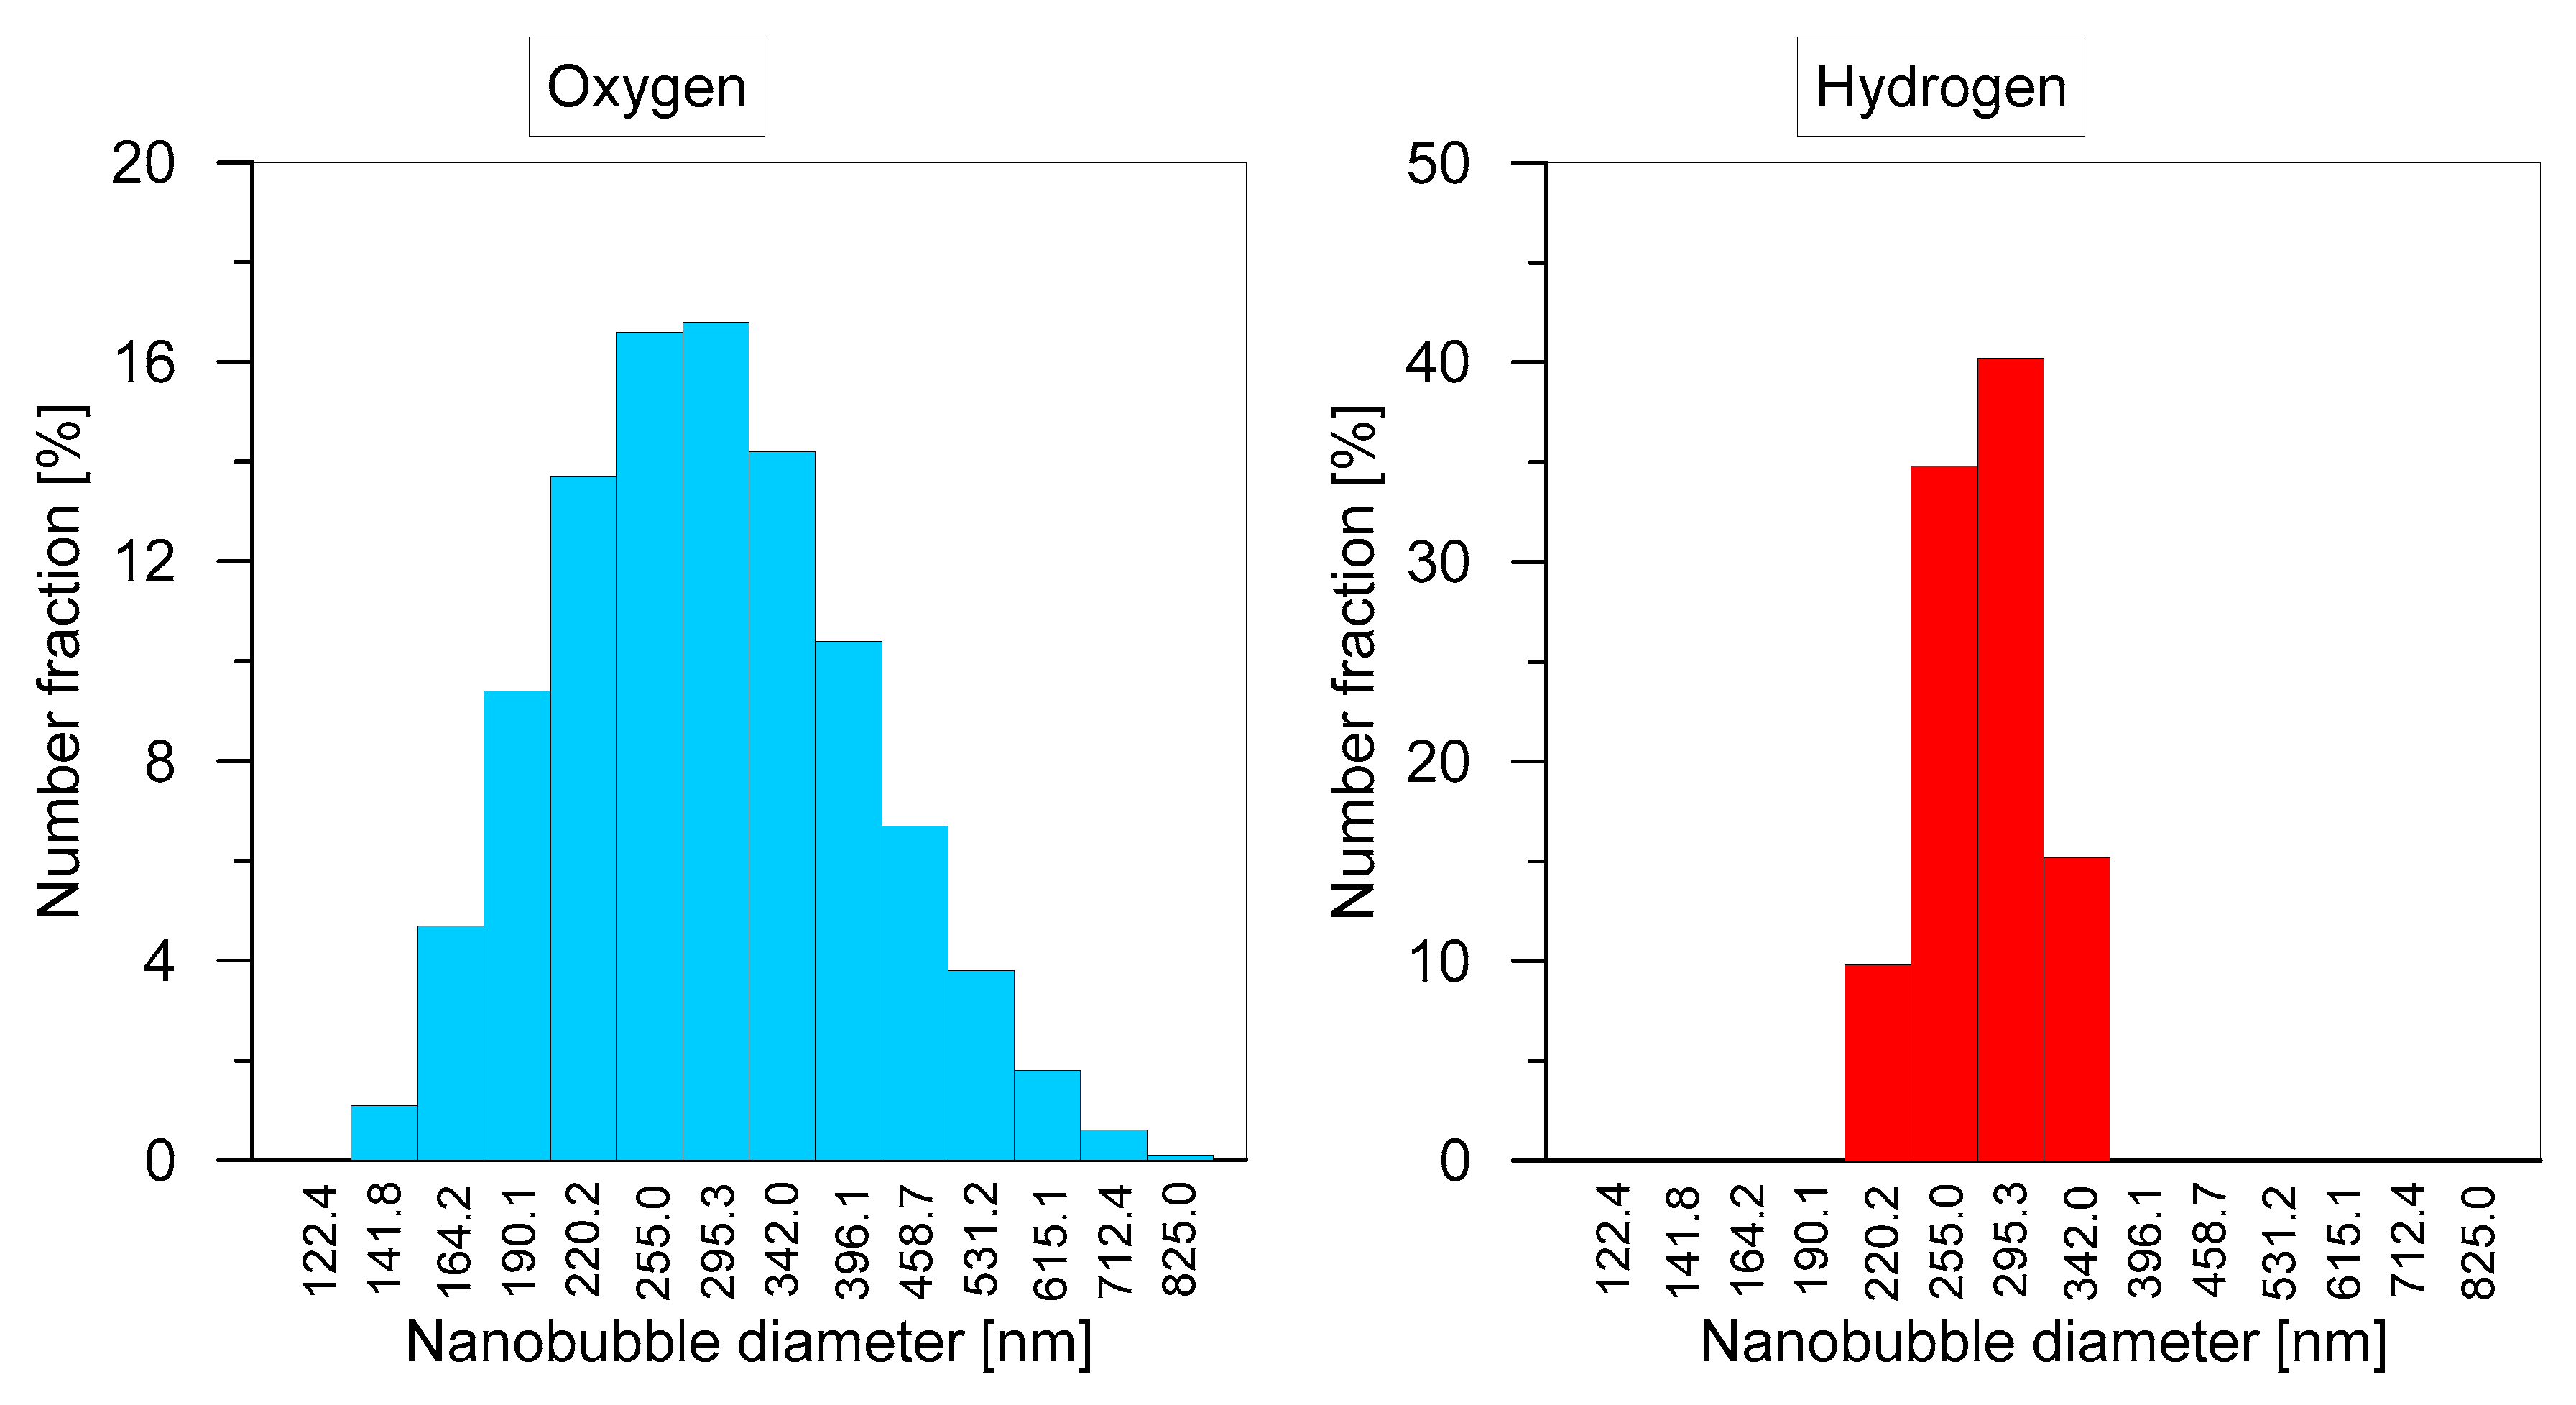
Exemplary and representative densities of size distributions obtained by Dynamic Light Scattering are presented in Figure 2. As one can see, the distribution is monomodal. Thus, the Sauter diameter (d32) is a good approximation of the average diameter of bubbles in this distribution.
As it is shown, the nanobubbles are generated depending on the set of values of independent variables used. The analysis of the results shown in Table 2 was performed, and a statistical model was proposed.

3.2. Statistical Model

For the statistical model, linear–linear interactions between the two factors were included. Effects also included one-factor linear effects (L) and quadratic effects (Q). The complete equation of this model is as follows:
d32 = a0 + Σ(bi∙i) + Σ(ci∙i2) + Σ(dij∙i∙j),
where a0 [nm] is the constant term, bi, ci, dij are regression coefficients of different variables or variable pairs and i, j are independent variables, i.e., salt concentration C [mol/dm3], time of electrolysis t [min] and current density I [mA/cm2]. The model was calculated separately for oxygen bubbles (generated in the anode chamber) and hydrogen bubbles (generated in the cathode chamber). Model equations are as follows:
d32O2 = −1013.58 + 8364.75∙C − 2518.49∙C2 + 56.2611∙I − 0.47737∙I2 + 3.68073∙t + 0.622724∙t2 − 106.152∙C∙I − 118.471∙C∙t − 0.720128∙I∙t,
d32H2 = 717.515 − 2280.24∙C − 4427.45∙C2 − 27.1527∙I + 0.185045∙I2 + 31.8921∙t − 1.03834∙t2 + 121.755∙C∙I + 38.4533∙C∙t + 0.000671525∙I∙t,
To obtain the Sauter diameter of bubbles in nanometres, variables should be input with the same unit as in this study, i.e., the salt concentration in mol/dm3, the current density in mA/cm2, and time of electrolysis in minutes. Table 3 presents the regression coefficients shown above, along with their statistical significance (p-value). The higher the p-value, the less statistically significant is the corresponding effect. Table 3 shows that the p-value ranges from 0.00753 to 0.827 for oxygen bubbles and from 0.0846 to 0.999 for hydrogen bubbles.
A higher error model can be derived by eliminating the least statistically significant values in approximating the dependent variable’s value. On the other hand, such a model includes only those effects that had similar values over all experiments. In other words, the precision of the model at the cost of its accuracy can be gained. In this study, we decided to set p-values lower than 0.1 as the determinant of statistically significant effect.
If that is the case, after the elimination of non-significant effects, the model can be refined. New regression coefficients are presented in Table 4. The effects that were eliminated due to low statistical significance are denoted with a minus sign. In the statistical model equation (Equations (5) and (6)), their regression coefficients are set to zero.
As such, new statistical model equations can be derived based on the data from Table 4.
d32O2 = −436.428 + 7115.80∙C + 23.4847∙I + 0.657205∙t2 − 86.5119∙C∙I − 115.824∙C∙t − 0.655809∙I∙t,
d32H2 = 351.990 – 6569.47∙C2 − 11.8771∙I + 33.5349∙t − 0.982773∙t2 + 89.0190∙C∙I,
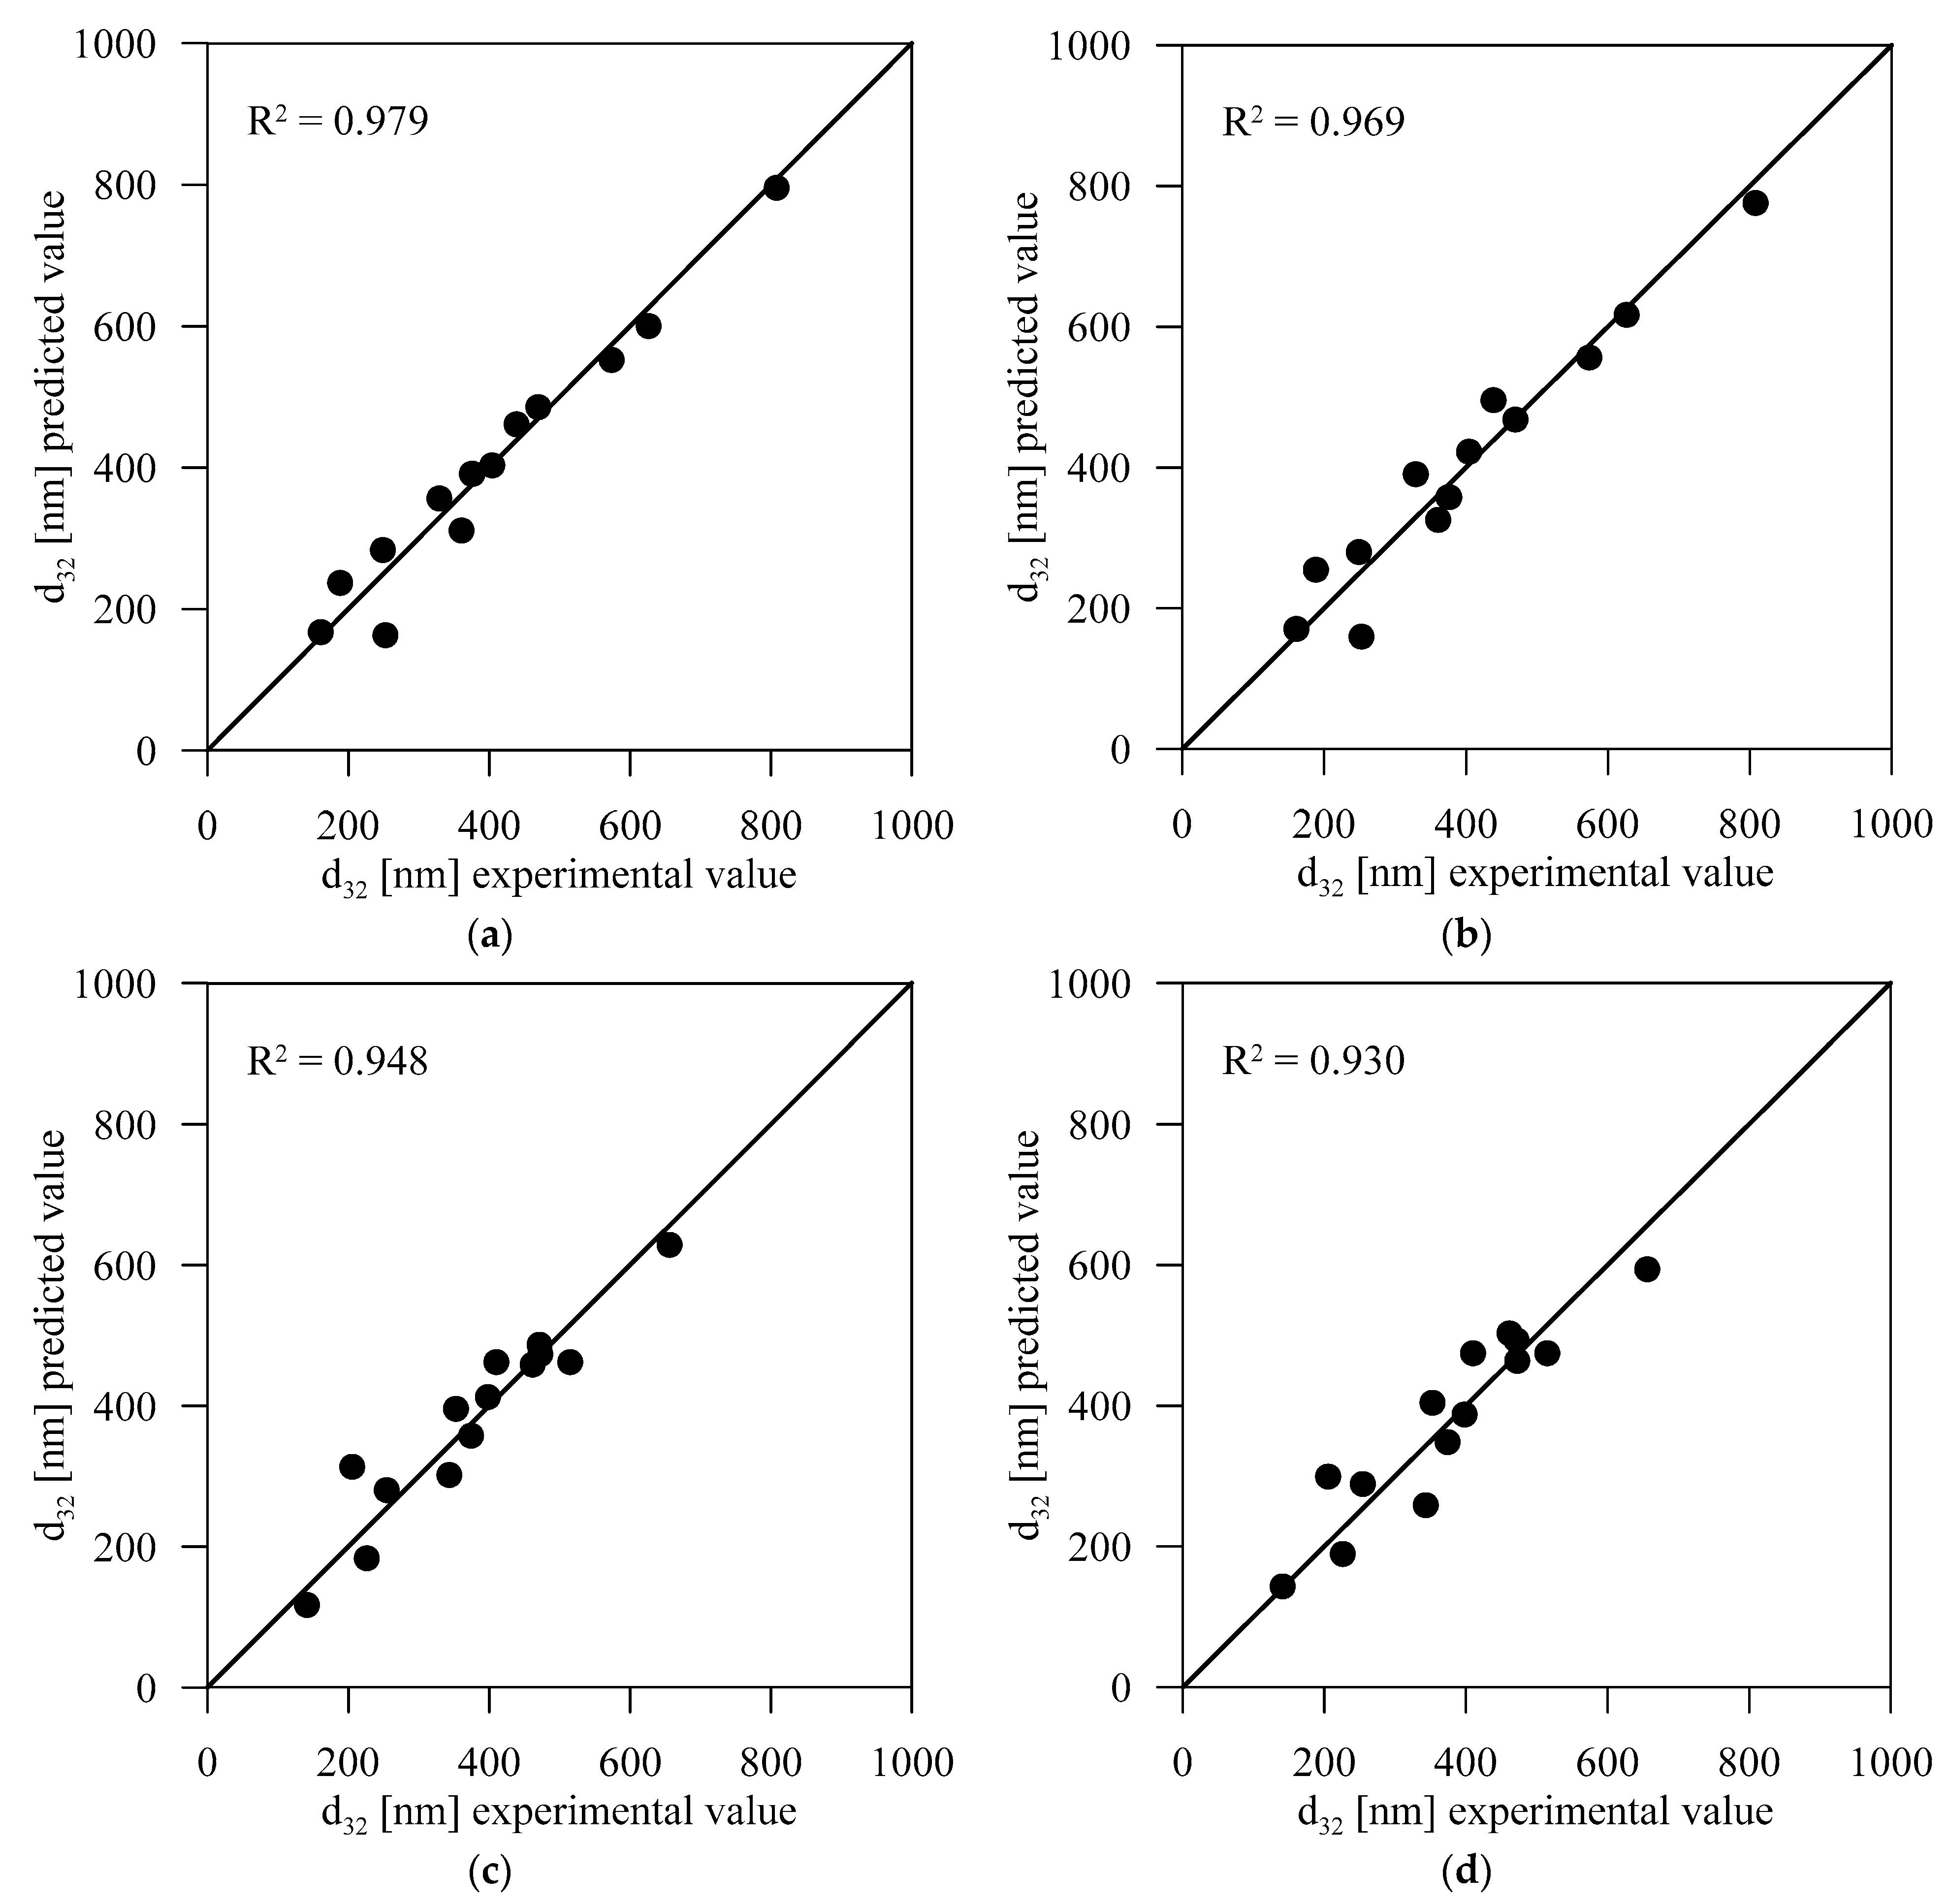
To check how distant the model values are from the experimental ones, the parity plots presented in Figure 3 can be observed, which show the deviations of approximated values from the experimental ones. It is visible that the full models (Figure 3a,c) are slightly better fitted to the straight line than refined ones (Figure 3b,d). However, as mentioned earlier, the refined model presents data based on effects derived with lower standard error, and as such, it should be preferable. As the differences in R2 factors between complete and refined models for both gases are minimal and all effects in refined models have p-values under the set threshold (p-value < 0.1), the refined models should be chosen as an appropriate approximation of experimental values.

3.3. Power Model

Statistical models presented above are based on the statistical analysis of the effects of each independent variable. Another approach widely used in engineering is to correlate each variable’s impact using a power model. Additionally, this approach is typical for describing the influence of various process parameters on the bubbles’ diameter obtained in the barbotage column. For example, Pohorecki et al. [34] proposed a correlation that predicted this value as a function of density, viscosity, surface tension of a liquid, and gas velocity supplied to the column.
Analogously, in this work, the experimental results are fitted to the equation presented below:
d32 = A∙Cx∙Iy∙tz,
where d32 is the Sauter diameter of bubbles, A is the constant term, C is the salt concentration, I is the current density, t is the electrolysis time, and x, y, z are the powers corresponding to variables C, I, t, respectively. A logarithm can be applied to both sides of this equation and then perform a multivariate linear regression. We have acquired power models, as follows (exponents rounded to two significant figures):
d32O2 = 1433.68∙C0.32 ∙ I−0.072 ∙ t−0.088,
d32H2 = 2439.14∙C0.26 ∙ I−0.083 ∙ t−0.32,
Similarly to statistical models, to obtain the Sauter diameter of bubbles in nanometres, one should input variables in the same unit as in this study, i.e., the salt concentration in mol/dm3, the current density in mA/cm2, and time of electrolysis in minutes.
The oxygen bubbles seem to depend only on the salt concentration of Na2SO4 (exponent 0.32), while exponents corresponding to both current density and time of electrolysis are under 0.1. Such a low value of exponent makes the whole factor close to 1.
The exponent corresponding to the current density for hydrogen bubbles is close to zero, suggesting that this independent variable does not significantly influence the bubbles’ Sauter diameter (Iy term is near to 1). The difference from the model for oxygen bubbles is the exponent corresponding to a time of electrolysis. When the electrolysis time increases, the hydrogen bubbles tend to be smaller, while the oxygen bubbles’ diameter stays nearly constant during electrolysis. In our opinion, that fact is directly tied to the difference in these gases’ solubilities and bubble formation conditions. As hydrogen solubility (1.6 mg/dm3, 0.8 mmol/dm3) is smaller than for oxygen (43 mg/dm3, 1.34 mmol/dm3), it causes more nanobubble nuclei to be formed in time. Additionally, the number of dihydrogen molecules needed to form the bubble near the electrode is about 3500 ± 900, while for oxygen, this number is nearly one magnitude larger (28,000 ± 9000) [13]. During electrolysis, part of the gas released on the electrode dissolves, while the rest forms bubbles. When gas is approaching its maximal solubility, the rate of dissolution lowers. For gas with lower solubility, the time in which it is achieved is shorter. As such, the lower the gas’ solubility, the more gas is released in the form of bubbles. This effect is accompanied by the fact that fewer hydrogen molecules are needed to form a bubble than the oxygen bubble. For that reason, as the time of electrolysis progress, more nuclei of hydrogen bubbles are formed in the bulk of the liquid. As there are more bubbles in volume, their diameter has to decrease to maintain the equilibrium between gas dissolved in water and enclosed in bubbles. Easier formation of bubble nuclei causes them to prefer nucleation to growth, compared to oxygen. As oxygen bubbles need much more molecules to form bubbles, they favour bubble growth over nucleation. For that reason, there is a possibility that part of the oxygen bubbles grow large enough for buoyancy forces to cause their rising to the free surface. Such process is constant in time, and therefore the Sauter diameter of stable nanobubbles in dispersion remains the same throughout the whole process duration.
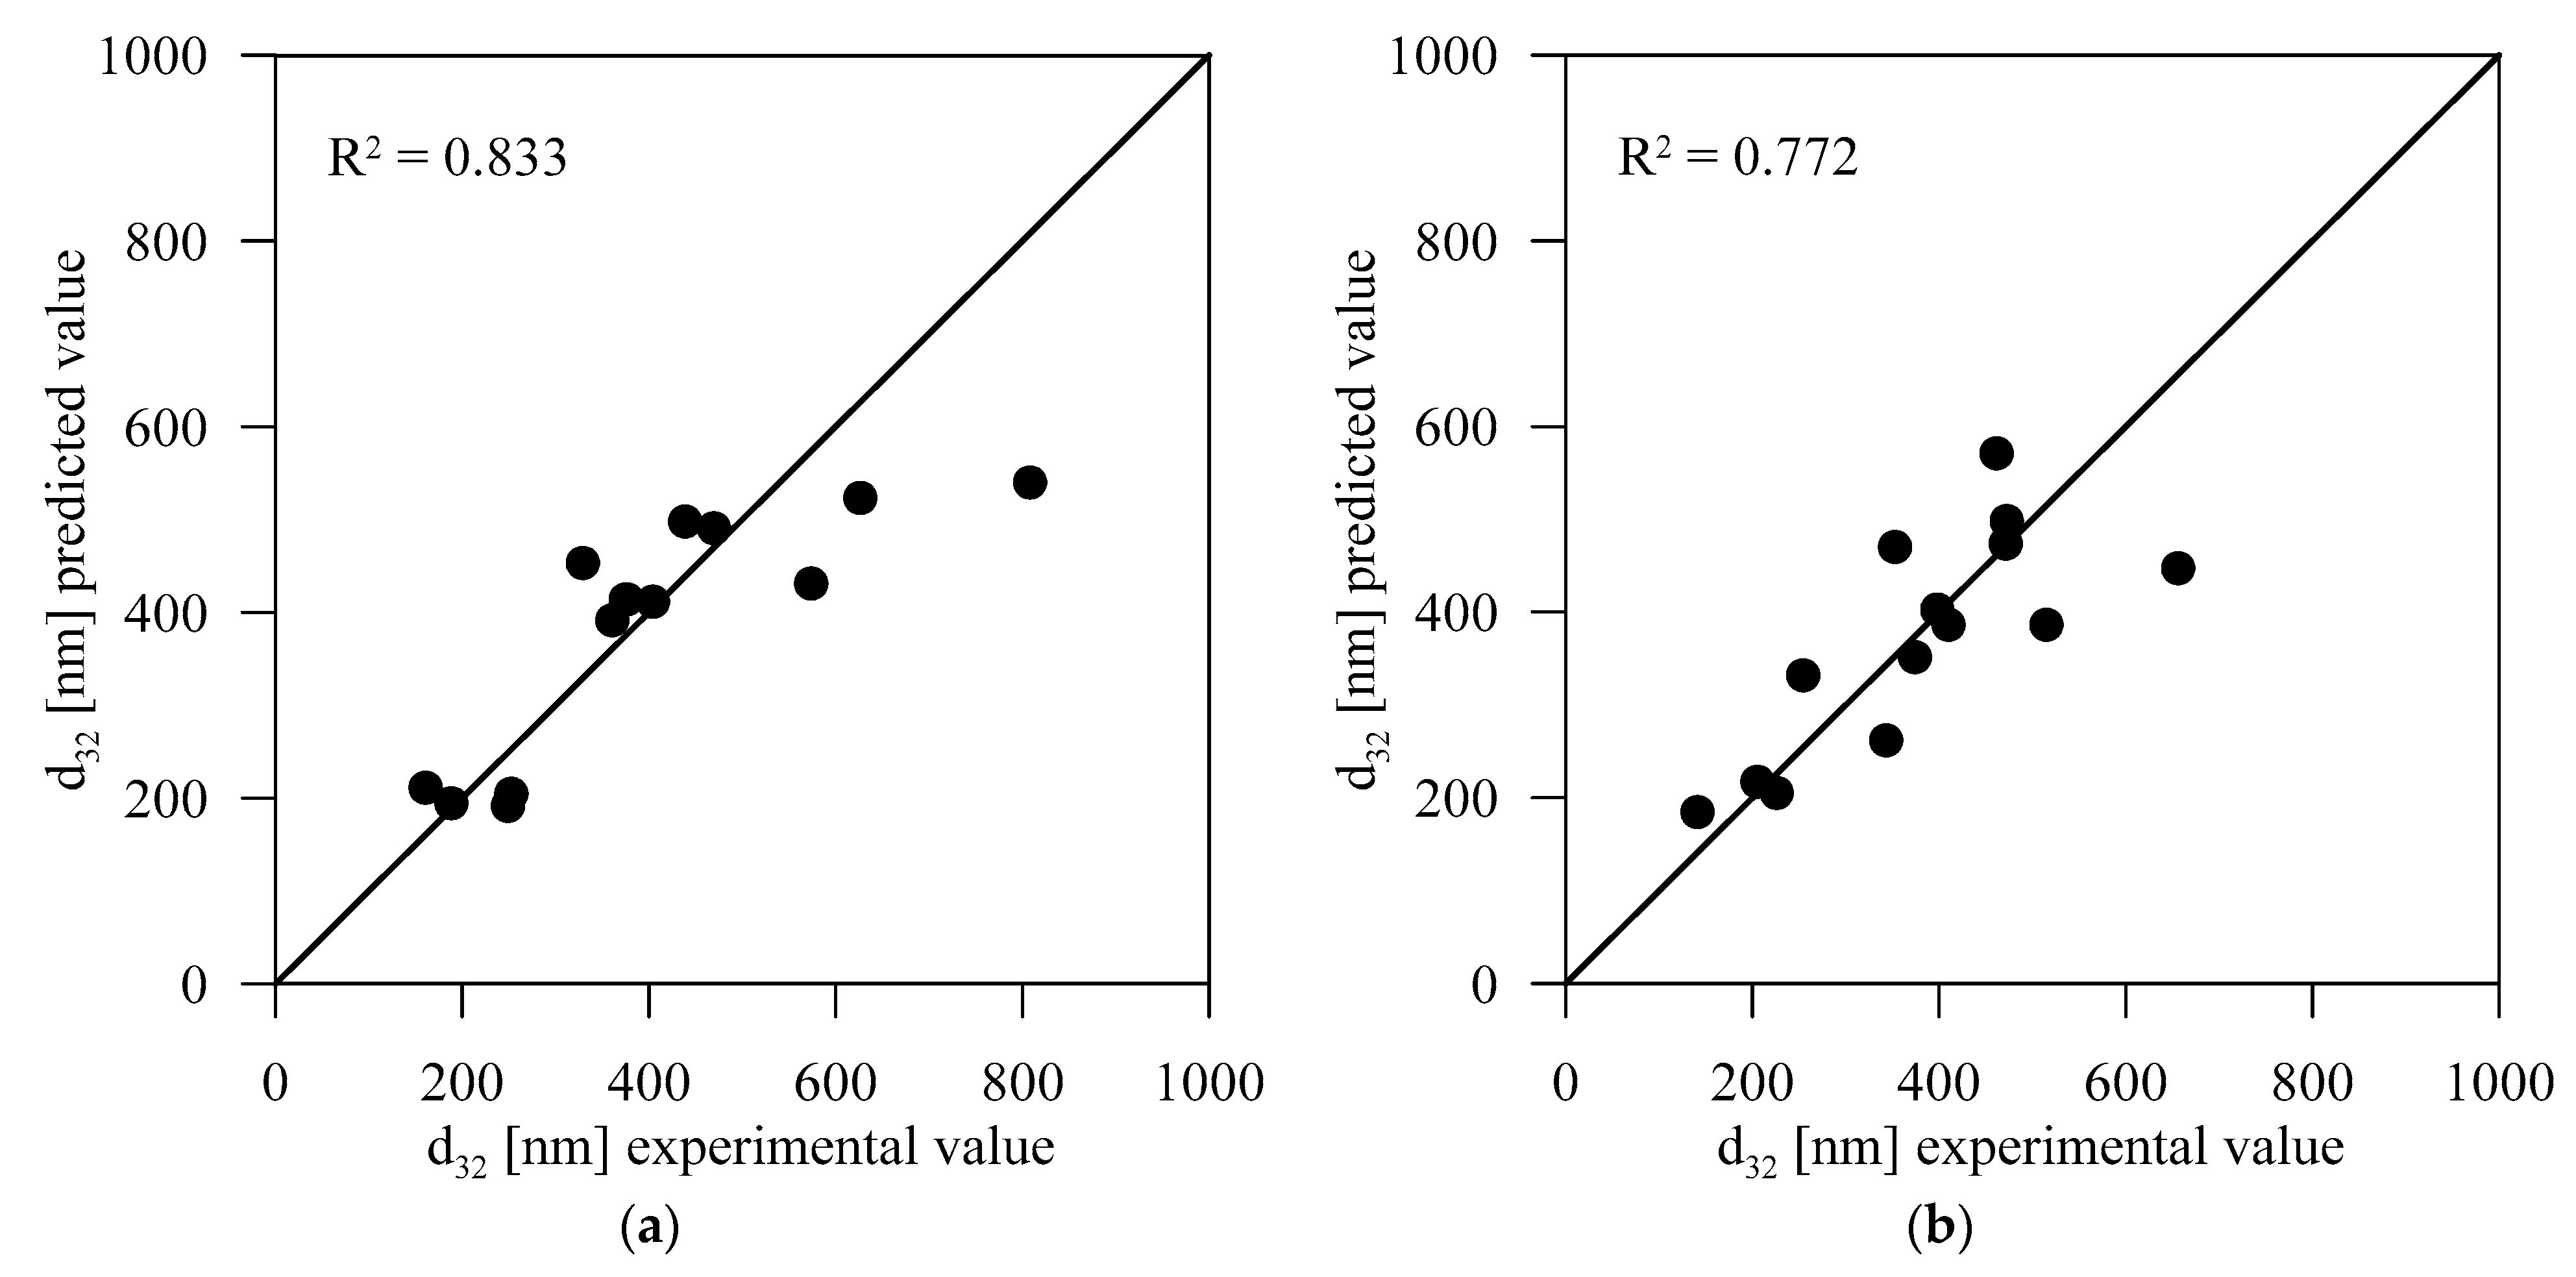
Parity plots were drawn (Figure 4) to check the power models’ quality for both kinds of gas nanobubbles. The R2 factors are lower than in the case of statistical models. The deviation of data is under 20% and 25% for models for oxygen and hydrogen bubbles, respectively. An article by Pohorecki et al. [34], noted previously as an example of the description of data using power model, reports a deviation of 10%, while Yue et al. [35] report the standard deviation of two power models of 22.8% and 19% describing Sherwood number in Taylor and annular flow in a gas–liquid microreactor, respectively. For that reason, the deviation of our data is acceptable for modelling purposes, as it is under 20% and 25% for models for oxygen and hydrogen bubbles, respectively. As such, proposed power models can be used as the approximation of this experimental data.
In this section, it is shown that both statistical models and power models present an accurate approximation of the data in the studied range of independent variables, namely 0.01–0.19 M solution of Na2SO4, the current density of 20–40 mA/cm2, and electrolysis time from 10 to 30 min. The higher values of R2 for statistical models without refining compared to refined models and for all statistical models compared to power models are expected. Models without refining have the largest number of constants describing the process, which allows for better approximation. After refining, the number of constants decreases significantly (from 10 to 7 constants for oxygen nanobubbles and 6 constants for hydrogen nanobubbles). Power models for both kinds of nanobubbles are described using only 4 constants, and as such, their approximation is expected to be lowered. The constant term in the power model may average the influence of other factors not investigated in this study.

3.4. Comparison with Literature Results

This study shows that nanobubbles are formed during electrolysis, which was reported in the literature [15,16,17]. However, the previous study did not propose any statistical or physical correlation of this phenomena in nanoscale. Nevertheless, the previous studies show the influence of two out of the three parameters chosen in our work as independent variables, namely current density and salt concentration. For that reason, we can compare our results with those obtained by other researchers.
At first glance, it could be assumed that the current density should impact the rate of gas nanobubble formation as it happens on the macroscale. However, when it comes to the nanoscale, another effect is visible. Kikuchi et al. [18] showed that current density in the range of 0.05–4.0 mA/cm2 has no impact on oxygen concentration in water obtained during electrolysis of 0.033 M Na2SO4 solution. Even though the authors measured the concentration of gas in bubbles and not the diameter, it can be assumed that these values are closely related. As the total (dissolved and enclosed in bubbles) concentration of gas was much lower than the solubility of gas, higher current density should intensify the mass transfer and cause the dissolved gas concentration to increase. As it was not the case, most of the gas was enclosed in nanobubbles, for which, according to numerous researchers, the mass transfer is impeded, which is the cause of nanobubble stability [2,36,37]. Therefore, the concentration of gas can be directly tied to the number of bubbles and, as such, their diameter. Note that the concentration of Na2SO4 is in the range of models proposed in this work.
Similarly, in their earlier work, Kikuchi et al. [16] presented results that show a similar effect for hydrogen nanobubbles. They showed that current density has no impact on the concentration of hydrogen enclosed in bubbles generated in the 0.033 M Na2SO4 solution; the plots were approaching a plateau. Our power model, presented in this paper, also showed the diminutive influence of current density for oxygen and hydrogen nanobubbles. In our opinion, based on the extrapolation from the shape of plots in works by Kikuchi et al., our results are complementary to those obtained in their studies.
Additionally, Kikuchi et al. [16] showed that increasing the ionic strength is causing an increase in total hydrogen concentration. The results correspond to results obtained in this study where with the increase in salt concentration (ionic strength), the Sauter diameter of bubbles also increases. Once again, our results complement those presented by Kikuchi et al. [16,18].
Unfortunately, we did not find studies carried out for oxygen nanobubbles in solutions of different ionic strength. Therefore, we cannot compare our results with the literature.

4. Conclusions

In this work, the Box–Behnken design was applied for galvanostatic electrolysis of salt solution where three independent variables were chosen: salt (Na2SO4) concentration, current density, and time of electrolysis. A statistical model based on an ANOVA analysis was proposed, and the power model was based on multivariate regression. Both models described the data accordingly. Obtained results are complementary to previous research by Kikuchi et al. [18,20].
The presented statistical models were refined to present only effects with a p-factor lower than 0.1. The power model, which is commonly used to describe various physicochemical phenomena, shows that the salt concentration has the most significant influence on the bubble diameter for both hydrogen and oxygen nanobubbles. At the same time, current density does not play a significant role, as its exponent is smaller than 0.1. The only significant difference between the models for hydrogen and oxygen nanobubbles is the influence of electrolysis duration, impacting only the hydrogen bubble size. We suspect that this effect is linked to the differences in solubility between investigated gases and bubble formation conditions. Correlations proposed in this work are our input to a more statistical approach to nanobubble generation by electrolysis, as a complementation to previous, more physical approaches to this process.

Author Contributions

Conceptualization, K.U. and P.S.; Formal analysis, K.U., R.J. and P.S.; Funding acquisition, K.U. and P.S.; Investigation, K.U. and R.J.; Methodology, K.U. and P.S.; Project administration, P.S.; Supervision, P.S.; Validation, K.U. and R.J.; Visualization, K.U.; Writing—original draft, K.U.; Writing—review and editing, K.U., R.J. and P.S. All authors have read and agreed to the published version of the manuscript.

Funding

This research was funded by National Science Centre, Poland, grant number 2018/29/B/ST8/00365.

Data Availability Statement

The datasets presented in this study are openly available in FigShare at 10.6084/m9.figshare.13668779.

Conflicts of Interest

The authors declare no conflict of interest.

References

  1. Tsuge, H. Micro- and Nanobubbles. Fundamentals and Applications; Pan Stanford Publishing: Boca Raton, NY, USA, 2015; ISBN 9789814463119. [Google Scholar]
  2. Ulatowski, K.; Sobieszuk, P.; Mróz, A.; Ciach, T. Stability of nanobubbles generated in water using porous membrane system. Chem. Eng. Process. Process Intensif. 2019, 136, 62–71. [Google Scholar] [CrossRef]
  3. Parmar, R.; Majumder, S.K. Microbubble generation and microbubble-aided transport process intensification-A state-of-the-art report. Chem. Eng. Process. Process Intensif. 2013, 64, 79–97. [Google Scholar] [CrossRef]
  4. Agarwal, A.; Ng, W.J.; Liu, Y. Principle and applications of microbubble and nanobubble technology for water treatment. Chemosphere 2011, 84, 1175–1180. [Google Scholar] [CrossRef] [PubMed]
  5. Ulatowski, K.; Sobieszuk, P. Gas nanobubble dispersions as the important agent in environmental processes—Generation methods review. Water Environ. J. 2020. [Google Scholar] [CrossRef]
  6. Ulatowski, K.; Sobieszuk, P. Influence of liquid flowrate on size of nanobubbles generated by porous-membrane modules. Chem. Process Eng. 2018, 39, 335–345. [Google Scholar] [CrossRef]
  7. Terasaka, K.; Hirabayashi, A.; Nishino, T.; Fujioka, S.; Kobayashi, D. Development of microbubble aerator for waste water treatment using aerobic activated sludge. Chem. Eng. Sci. 2011, 66, 3172–3179. [Google Scholar] [CrossRef]
  8. Juwana, W.E.; Widyatama, A.; Dinaryanto, O.; Budhijanto, W. Indarto; Deendarlianto Hydrodynamic characteristics of the microbubble dissolution in liquid using orifice type microbubble generator. Chem. Eng. Res. Des. 2019, 141, 436–448. [Google Scholar] [CrossRef]
  9. Bessarabov, D.; Millet, P. Brief Historical Background of Water Electrolysis. In PEM Water Electrolysis; Academic Press: Cambridge, MA, USA, 2018; pp. 17–42. ISBN 9780128111451. [Google Scholar]
  10. Endo, T.; Tsuji, K.; Tanaka, Y.; Yanagida, Y.; Hatsuzawa, T. Design and fabrication of cell alignment device based on electrolytically-generated air bubbles, and its practical realization using polystyrene microbeads. Microchim. Acta 2009, 164, 263–268. [Google Scholar] [CrossRef]
  11. Tyrrell, J.W.G.; Attard, P. Images of nanobubbles on hydrophobic surfaces and their interactions. Phys. Rev. Lett. 2001, 87, 1–4. [Google Scholar] [CrossRef]
  12. Perera, R.T.; Arcadia, C.E.; Rosenstein, J.K. Probing the nucleation, growth, and evolution of hydrogen nanobubbles at single catalytic sites. Electrochim. Acta 2018, 283, 1773–1778. [Google Scholar] [CrossRef]
  13. German, S.R.; Edwards, M.A.; Chen, Q.; Liu, Y.; Luo, L.; White, H.S. Electrochemistry of single nanobubbles. Estimating the critical size of bubble-forming nuclei for gas-evolving electrode reactions. Faraday Discuss. 2016, 193, 223–240. [Google Scholar] [CrossRef]
  14. Chen, Q.; Ranaweera, R.; Luo, L. Hydrogen Bubble Formation at Hydrogen-Insertion Electrodes. J. Phys. Chem. C 2018, 122, 15421–15426. [Google Scholar] [CrossRef]
  15. Kikuchi, K.; Tanaka, Y.; Saihara, Y.; Ogumi, Z. Study of hydrogen nanobubbles in solution in the vicinity of a platinum wire electrode using double-potential step chronoamperometry. Electrochim. Acta 2006, 52, 904–913. [Google Scholar] [CrossRef]
  16. Kikuchi, K.; Tanaka, Y.; Saihara, Y.; Maeda, M.; Kawamura, M.; Ogumi, Z. Concentration of hydrogen nanobubbles in electrolyzed water. J. Colloid Interface Sci. 2006, 298, 914–919. [Google Scholar] [CrossRef] [PubMed]
  17. Kikuchi, K.; Nagata, S.; Tanaka, Y.; Saihara, Y.; Ogumi, Z. Characteristics of hydrogen nanobubbles in solutions obtained with water electrolysis. J. Electroanal. Chem. 2007, 600, 303–310. [Google Scholar] [CrossRef]
  18. Kikuchi, K.; Ioka, A.; Oku, T.; Tanaka, Y.; Saihara, Y.; Ogumi, Z. Concentration determination of oxygen nanobubbles in electrolyzed water. J. Colloid Interface Sci. 2009, 329, 306–309. [Google Scholar] [CrossRef] [PubMed]
  19. Meegoda, J.N.; Aluthgun Hewage, S.; Batagoda, J.H. Stability of nanobubbles. Environ. Eng. Sci. 2018, 35, 1216–1227. [Google Scholar] [CrossRef]
  20. Kikuchi, K.; Takeda, H.; Rabolt, B.; Okaya, T.; Ogumi, Z.; Saihara, Y.; Noguchi, H. Hydrogen particles and supersaturation in alkaline water from an Alkali-Ion-Water electrolyzer. J. Electroanal. Chem. 2001, 506, 22–27. [Google Scholar] [CrossRef]
  21. Postnikov, A.V.; Uvarov, I.V.; Lokhanin, M.V.; Svetovoy, V.B. Highly energetic phenomena in water electrolysis. Sci. Rep. 2016, 6, 39381. [Google Scholar] [CrossRef] [Green Version]
  22. Postnikov, A.V.; Uvarov, I.V.; Lokhanin, M.V.; Svetovoy, V.B. Electrically controlled cloud of bulk nanobubbles in water solutions. PLoS ONE 2017, 12, e0181727. [Google Scholar] [CrossRef] [Green Version]
  23. Postnikov, A.V.; Uvarov, I.V.; Penkov, N.V.; Svetovoy, V.B. Collective behavior of bulk nanobubbles produced by alternating polarity electrolysis. Nanoscale 2018, 10, 428–435. [Google Scholar] [CrossRef] [PubMed] [Green Version]
  24. Prokaznikov, A.; Tas, N.; Svetovoy, V. Surface assisted combustion of hydrogen-oxygen mixture in nanobubbles produced by electrolysis. Energies 2017, 10, 178. [Google Scholar] [CrossRef] [Green Version]
  25. Postnikov, A.V.; Uvarov, I.V.; Prokaznikov, A.V.; Svetovoy, V.B. Observation of spontaneous combustion of hydrogen and oxygen in microbubbles. Appl. Phys. Lett. 2016, 108, 121604. [Google Scholar] [CrossRef]
  26. Jain, S.; Qiao, L. Understanding Combustion of H2/O2 Gases inside Nanobubbles Generated by Water Electrolysis Using Reactive Molecular Dynamic Simulations. J. Phys. Chem. A 2018, 122, 5261–5269. [Google Scholar] [CrossRef]
  27. Zhang, D.; Zeng, K. Evaluating the behavior of electrolytic gas bubbles and their effect on the cell voltage in alkaline water electrolysis. Ind. Eng. Chem. Res. 2012, 51, 13825–13832. [Google Scholar] [CrossRef]
  28. Chandran, P.; Bakshi, S.; Chatterjee, D. Study on the characteristics of hydrogen bubble formation and its transport during electrolysis of water. Chem. Eng. Sci. 2015, 138, 99–109. [Google Scholar] [CrossRef]
  29. Scriven, L.E. On the dynamics of phase growth. Chem. Eng. Sci. 1959, 10, 1–13. [Google Scholar] [CrossRef]
  30. Matsuura, K.; Yamanishi, Y.; Guan, C.; Yanase, S. Control of hydrogen bubble plume during electrolysis of water. J. Phys. Commun. 2019, 3, 035012. [Google Scholar] [CrossRef]
  31. Hao, R.; Fan, Y.; Anderson, T.J.; Zhang, B. Imaging Single Nanobubbles of H2 and O2 during the Overall Water Electrolysis with Single-Molecule Fluorescence Microscopy. Anal. Chem. 2020, 92, 3682–3688. [Google Scholar] [CrossRef]
  32. Stetefeld, J.; McKenna, S.A.; Patel, T.R. Dynamic light scattering: A practical guide and applications in biomedical sciences. Biophys. Rev. 2016, 8, 409–427. [Google Scholar] [CrossRef]
  33. Calgaroto, S.; Wilberg, K.Q.; Rubio, J. On the nanobubbles interfacial properties and future applications in flotation. Miner. Eng. 2014, 60, 33–40. [Google Scholar] [CrossRef]
  34. Pohorecki, R.; Moniuk, W.; Bielski, P.; Sobieszuk, P.; Da̧browiecki, G. Bubble diameter correlation via numerical experiment. Chem. Eng. J. 2005, 113, 35–39. [Google Scholar] [CrossRef]
  35. Yue, J.; Chen, G.; Yuan, Q.; Luo, L.; Gonthier, Y. Hydrodynamics and mass transfer characteristics in gas-liquid flow through a rectangular microchannel. Chem. Eng. Sci. 2007, 62, 2096–2108. [Google Scholar] [CrossRef]
  36. Yasui, K.; Tuziuti, T.; Kanematsu, W. Mysteries of bulk nanobubbles (ultrafine bubbles); stability and radical formation. Ultrason. Sonochem. 2018, 48, 259–266. [Google Scholar] [CrossRef]
  37. Zhang, L.J.; Chen, H.; Li, Z.X.; Fang, H.P.; Hu, J. Long lifetime of nanobubbles due to high inner density. Sci. China Ser. G Phys. Mech. Astron. 2008, 51, 219–224. [Google Scholar] [CrossRef]
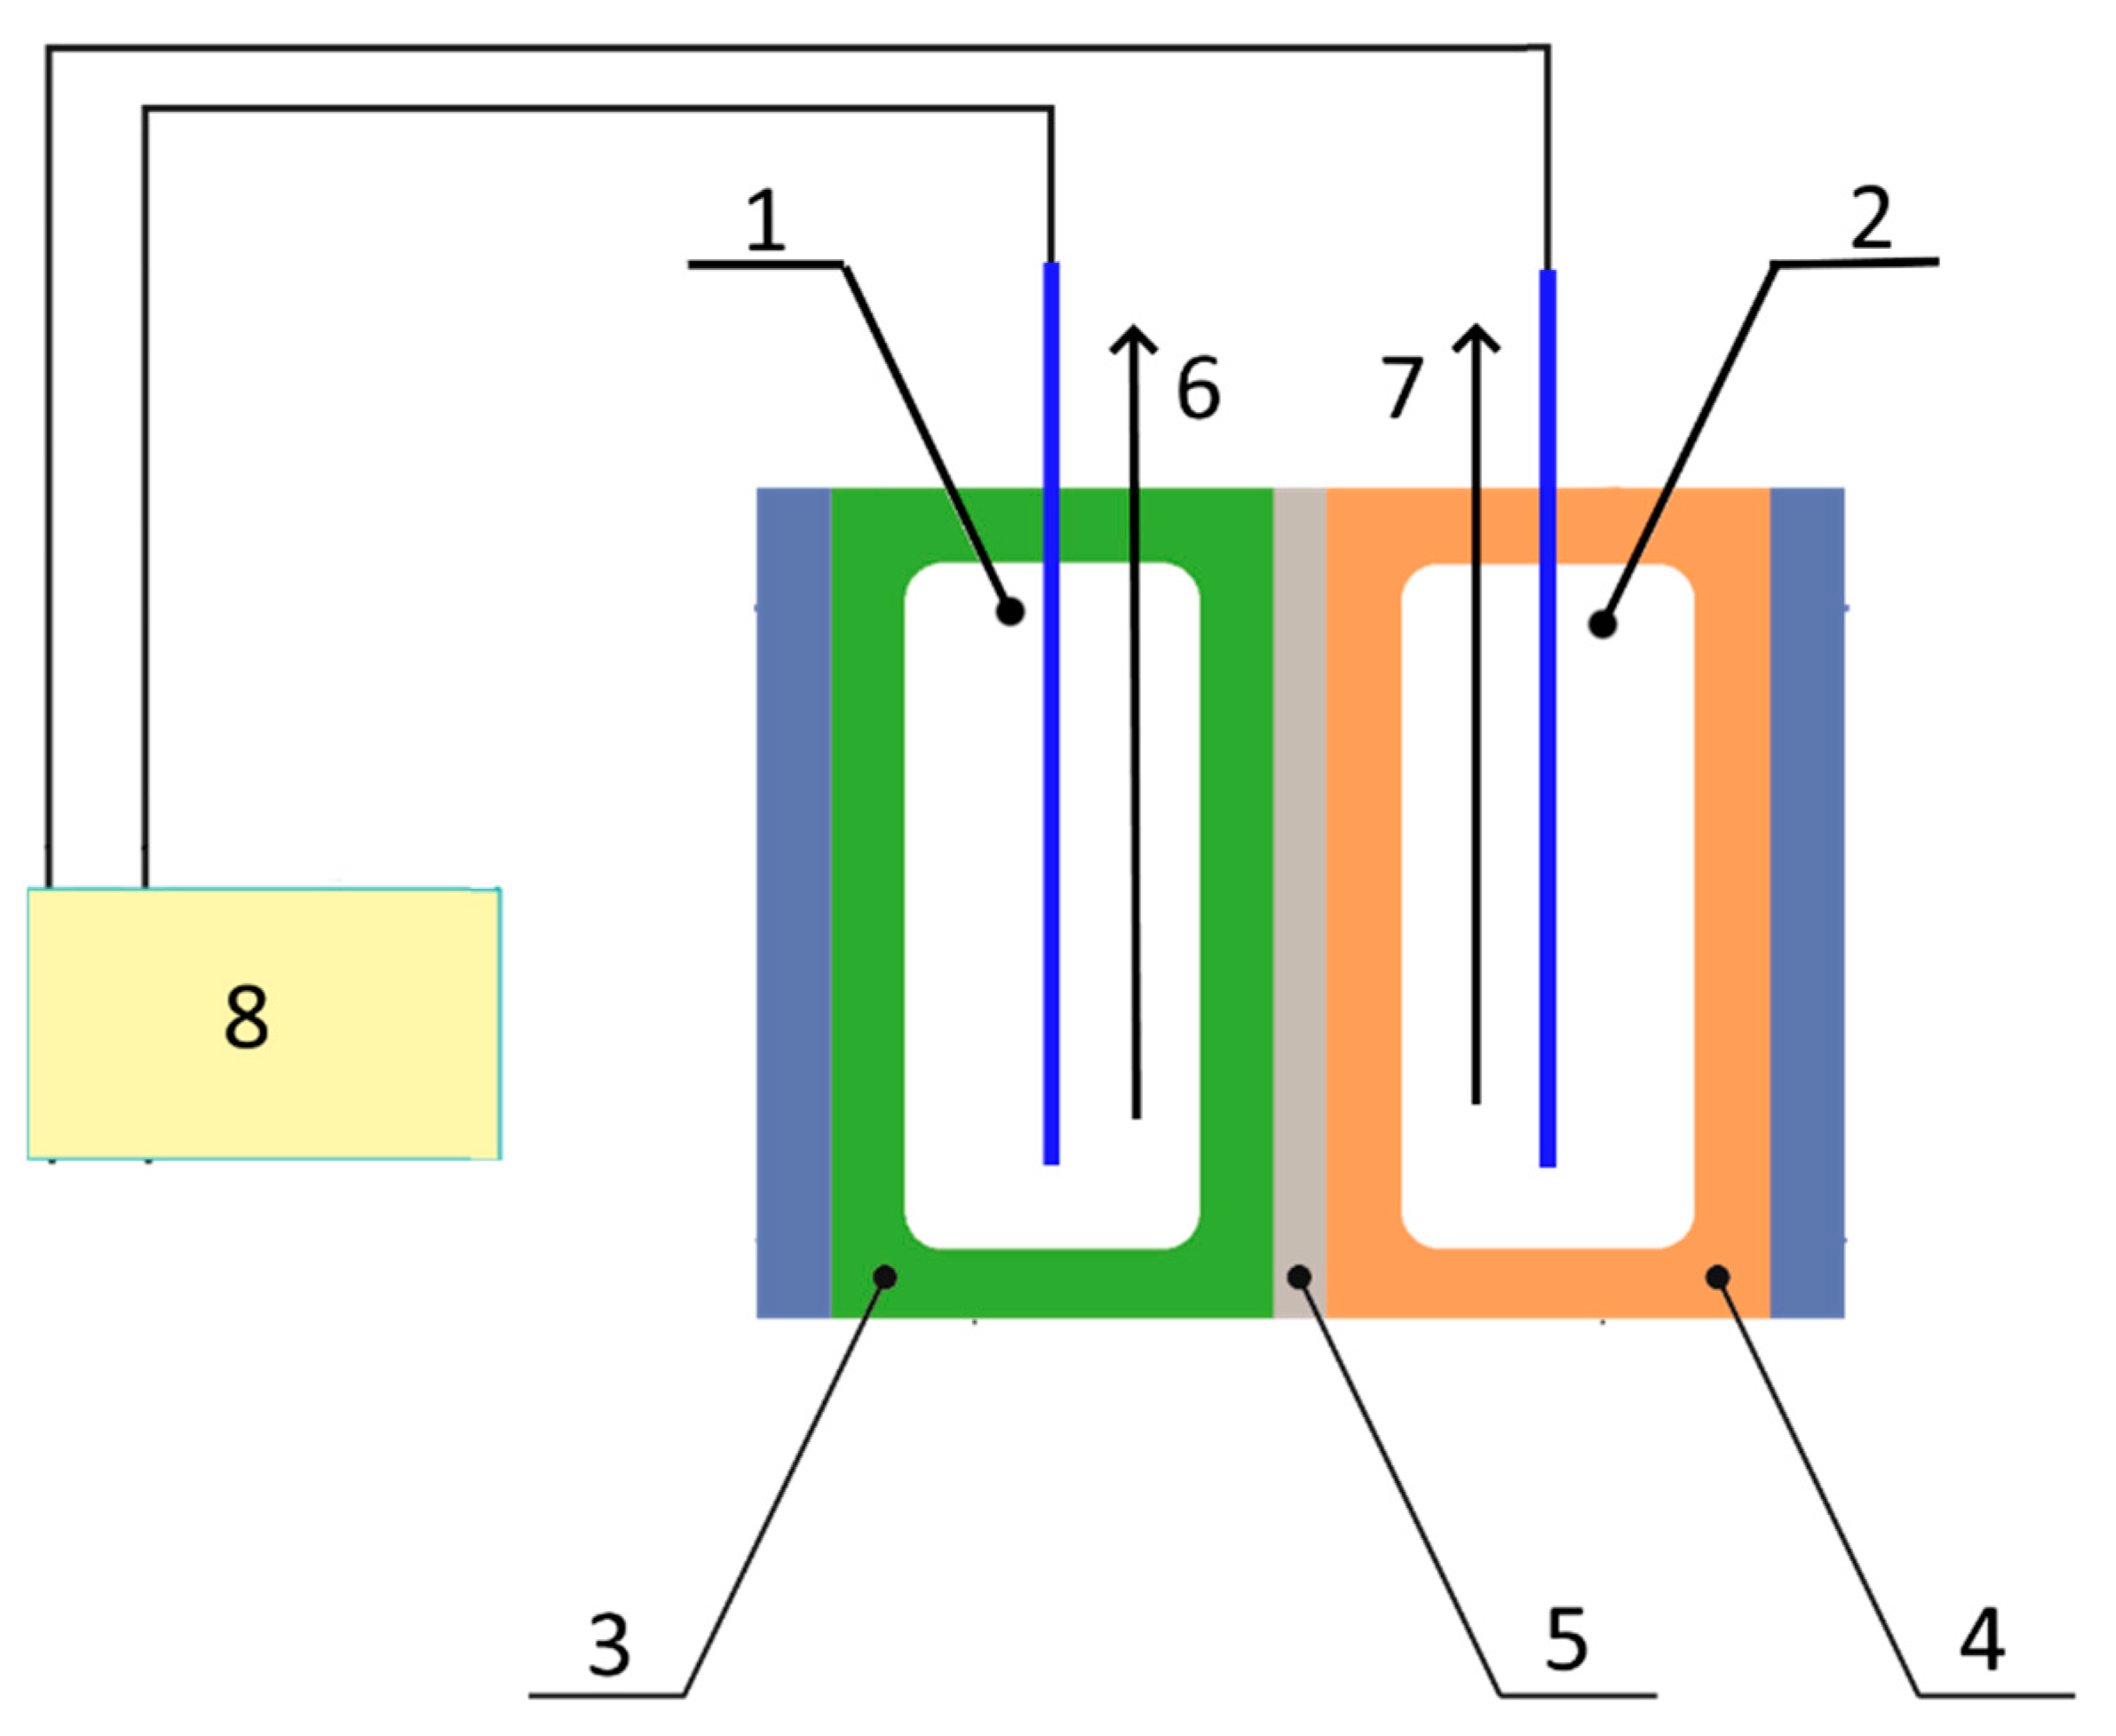
Figure 1. Experimental setup: (1) cathode (2) anode, (3) cathode chamber, (4) anode chamber, (5) Nafion membrane, (6,7) sampling syringes, (8) potentiostat connected to a computer.
Energies 14 02542 g001
Figure 2. Exemplary densities of size distributions of nanobubbles of oxygen (left) and hydrogen (right).
Energies 14 02542 g002
Figure 3. Parity plots for full statistical models and refined models. (a) the full model for oxygen bubbles, (b) refined model for oxygen bubbles, (c) full model for hydrogen bubbles, (d) refined model for hydrogen bubbles.
Energies 14 02542 g003
Figure 4. Parity plots for power models (a) power model for oxygen bubbles, (b) power model for hydrogen bubbles.
Energies 14 02542 g004
Table 1. Values of chosen independent variables for Box–Behnken design.
Independent VariableIndependent Variable Value
Salt concentration [mol/dm3]0.010.100.19
Current density [mA/cm2]20.030.040.0
Time of electrolysis [min]10.020.030.0
Table 2. Values of Sauter diameter of hydrogen and oxygen bubbles in all experiments rounded to the nearest integer.
No.Salt Concentration [mol/dm3]Current Density [mA/cm2]Electrolysis Time [min]Sauter Diameter of Bubbles [nm]
HydrogenOxygen
10.0130.010.0343161
20.0140.020.0226188
30.1020.030.0374404
40.1040.010.0352574
50.1930.030.0398469
60.1030.020.0515376
70.1920.020.0471626
80.1930.010.0462808
90.1940.020.0656439
100.1030.020.0515375
110.1020.010.0472329
120.1040.030.0255361
130.0120.020.0205253
140.0130.030.0141249
150.1030.020.0410376
Table 3. Regression coefficients and corresponding p-values for the full statistical model for both oxygen and hydrogen bubbles. L represents the linear effect; Q represents the quadratic effect.
Variable EffectOxygenHydrogen
Reg. Coeff.p-ValueReg. Coeff.p-Value
Constant term−1013.580.0727717.5150.262
Salt concentration (L)8364.750.00753−2280.240.395
Salt concentration (Q)−2518.490.558−4427.450.424
Current density (L)56.26110.0661−27.15270.414
Current density (Q)−0.4773700.2210.1850450.687
Time of electrolysis (L)3.680730.82731.89210.177
Time of electrolysis (Q)0.6227240.108−1.038340.0499
Salt concentration (L) and current density (L)−106.1520.0636121.7550.0846
Salt concentration (L) and time of electrolysis (L)−118.4710.015538.45330.399
Current density (L) and time of electrolysis (L)−0.7201280.05910.0006715250.999
Table 4. Regression coefficients and corresponding p-values for the refined statistical model for both oxygen and hydrogen bubbles. L represents the linear effect; Q represents the quadratic effect. Two-factor effects are shown as a combination of two other numbered effects.
Variable EffectOxygenHydrogen
Reg. Coeff.p-ValueReg. Coeff.p-Value
Constant term−436.4280.0523351.9900.0355
Salt concentration (L)7115.800.000970--
Salt concentration (Q)--−6569.470.0764
Current density (L)23.48470.0118−11.87710.00595
Current density (Q)----
Time of electrolysis (L)--33.53490.0339
Time of electrolysis (Q)0.6572050.00683−0.9827730.0157
Salt concentration (L) and current density (L)−86.51190.056989.01900.00255
Salt concentration (L) and time of electrolysis (L)−115.8240.00522--
Current density (L) and time of electrolysis (L)−0.6558090.0224--
Publisher’s Note: MDPI stays neutral with regard to jurisdictional claims in published maps and institutional affiliations.