1. Introduction
In this paper Carnote cycle was modified using the popular Vibe function [
1], which was replaced in the theoretical cycle by two isochoric and isothermal transformations. We know from the theory of thermal machines [
2] that the Carnot cycle achieves the highest efficiency at a given temperature difference, while the Otto cycle achieves the highest efficiency for a given compression ratio. Therefore, in the combination of both circuits, it was decided to look for the best solution. Before we go in to that, however, it is necessary to present the already existing solutions that have reached the stage of technical implementation. In this regard, we can find a large amount of scientific information, which is why it was decided to choose those that contain a compendium of knowledge on the development of spark ignition engines or those that have very unusual solutions or have been published recently. We know from the theory of thermal machines [
2] that the Carnot cycle achieves the highest efficiency at a given temperature difference, while the Otto cycle achieves the highest efficiency for a given compression ratio. Therefore, in the combination of both circuits, it was decided to look for the best solution, but before we get to that, it is necessary to present the already existing solutions that have reached the stage of technical implementation. In this regard, we can find a large amount of scientific information, which is why it was decided to choose that which contained a compendium of knowledge on the development of spark ignition engines or that has very unusual solutions or has been published recently. The selection of specific items from the first group was limited to the basic book and review articles, while the second group is the individual choice of the authors. We found a lot of articles on similar topics, but a few of the recently published, in which development concepts in this field could be seen, were selected in spark ignition engines. The authors of the articles had focused on both the historical context and modern applications, giving them a detailed analysis. In this analysis, we found, among others, the aspect related to the timing system control, which currently seems to be the most common in engines, [
3,
4,
5,
6,
7,
8,
9].
The methods mentioned can be applied simultaneously [
6], which can further increase the efficiency [
10,
11,
12,
13,
14,
15]. Despite the benefits presented resulting from the implementation of the Atkinson Miller cycle and the very advanced technical solutions used, for which it would be difficult to find an alternative in the form of a similar value of efficiency, for example [
16], it was decided to conduct a basic analysis of a different way of implementing the engine’s working cycle. The analysis was made because empirical tests confirmed [
17] the possibility of increasing the compression ratio in a spark-ignition internal combustion engine to values greater than 18:1, without harmful detonation as described in [
18,
19,
20,
21,
22]. This, if optimized successfully, could lead to a significant increase in the efficiency of positive-ignition internal combustion engines covering a much wider range of speeds and loads [
16], with a concomitant significant reduction in maximum temperature more than the Atkinson Miller-cycle engines mentioned. This other method, practically unused in internal combustion engines, of influencing the thermodynamic process as a system of two pistons, one of which independently regulates the change of compression ratio, has been conceptually known since 1904. The idea has gradually evolved, achieving full freedom in shaping the circuits and a real technical construction described in a patent from 2013. This method consists of an additional, very fast volume change independent of the crank-piston system caused by an additional piston, which allows, for example, some of the fuel to be burned at a constant temperature. To do this, the reaction time of the additional system should be determined on the basis of the combustion time in spark ignition engines. In this case, we can also find many scientific studies, in which HCCI engines will have the shortest combustion times [
23,
24], while typical combustion descriptions can be found in [
4,
25], and on this basis, we can determine burning rate or duration of burning.
According to [
4], the combustion process of a previously prepared combustible mixture in spark ignition engines takes place spontaneously from the moment of ignition. Of course, this process is determined by the initial thermodynamic parameters, temperature, and pressure, as well as the composition and quality of the combustion mixture preparation. As a rule, the change in volume is neglected, as it is relatively small in the most commonly used crank-piston system, while the rotational speed is taken into account, which forces the duration of the combustion process to be adjusted to the engine′s operating cycle. The authors propose a method consisting of a very quick additional, “compensating” volume change in a place where the reaction of typical kinematic systems is insufficient, that is to say, too slow or too fast, or simply not adjusted. Therefore, the analysis of the required kinematic changes in the range corresponding to the combustion process in a typical spark-ignition piston heat engine between 330 ca and 430 ca, which additionally uses a Fourier series in the final phase will be carried out further. The aim is to induce strictly defined volume changes, i.e., kinematic changes responsible and affecting other thermodynamic parameters, pressure, and temperature during the combustion process. For this analytical task, a new thermodynamic cycle, hereinafter referred to as the proposed one, was selected, with an increased degree of Carnotization, i.e., as close as possible to the Carnot cycle. In practice, we obtain a combustion process with a lower maximum temperature, and thus lower NOx emissions (EURO 6, EURO 7), and at least we maintain the maximum efficiency of the currently used spark-ignition internal combustion engines.
According to the accepted compromise, the proposed thermodynamic cycle can be imagined in a simple way as the Carnot cycle, cut on both sides in the p-V system by isochoric transformations. The proposed cycle is characterized by a high compression ratio, many times lower than in the Carnot cycle, of course, but ranging from 20:1 to even 25:1 [
26]. A detailed description of this cycle is included in [
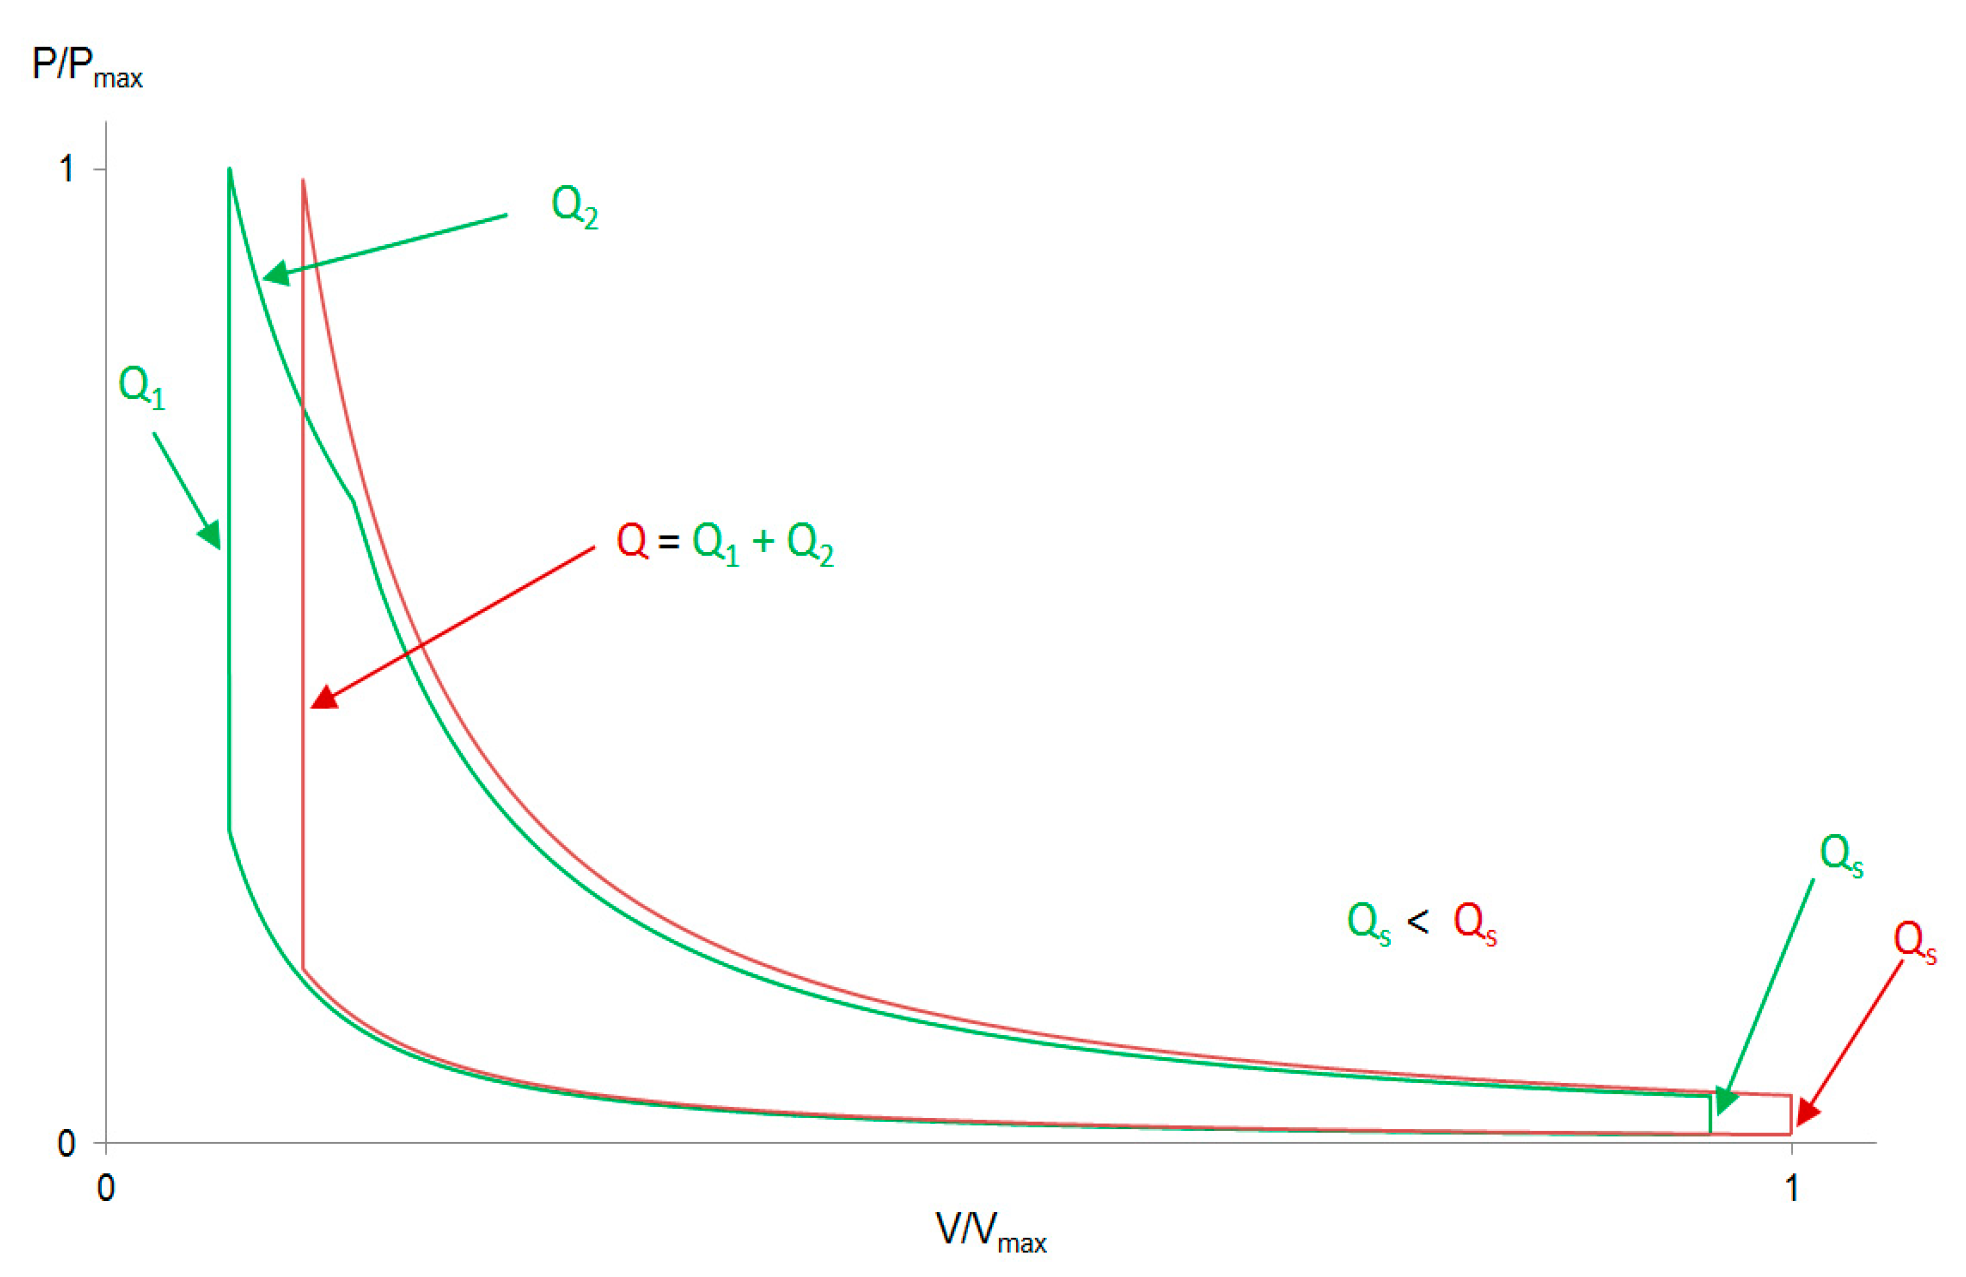
1] along with the derived equations and graphic illustrations. Nevertheless, in order to conduct a clear analysis, it should be cited together with a short description. In
Figure 1, the proposed theoretical cycle, the green color is distinguished by an additional isothermal transformation, which is not taken into account at all in the theoretical analysis of the current internal combustion engines [
2,
10]. At this point it can be added that, for a more general case, the isothermal transformation can be replaced by any polytropic transformation, which has also been described [
27]. For reference purposes, the same figure shows in red the Otto cycle with a typical compression ratio of 11:1 for spark ignition internal combustion engines.
In the proposed cycle, i.e., describing an ideal motor operating at full load, the total energy is supplied to the cycle at a constant volume, the energies Q
1 as in the cycle (Otto) and at a constant temperature, the energy Q
2 as in the cycle (Carnot). The minimum value of the compression ratio for the cycle considered should not be lower than the value of 17:1, otherwise it will not have the acceptable theoretical efficiency value of the Otto cycle with a compression ratio of 11:1. The use of the proposed cycle with a compression ratio lower than 17:1 [
27], which should be emphasized, may be appropriate as aimed at reducing the maximum temperature of the cycle, due to the quality of the fuels used or reducing the emission of unfavorable compounds, for example, such as NOx [
28,
29,
30]. In such a case, it would be advantageous if it would be the first cycle of several successive thermodynamic cycles in a cascade, for example, the main purpose of which would be to improve the unfavorable energy balance of the first. To summarize these brief considerations on the theoretical cycles in
Figure 1, the most expected effect for the proposed theoretical cycle should be the possibility to control the maximum temperature in the cycle while maintaining the highest possible efficiency, and also in a more general case, such as for any polytrope exponent while delivering the second energy quantity Q2. In short, this means obtaining a relationship between the efficiency of the cycle and its maximum temperature. In the case of temperature, it comes down to selecting one of the graphs presented in the one taken from [
1]
Figure 2.
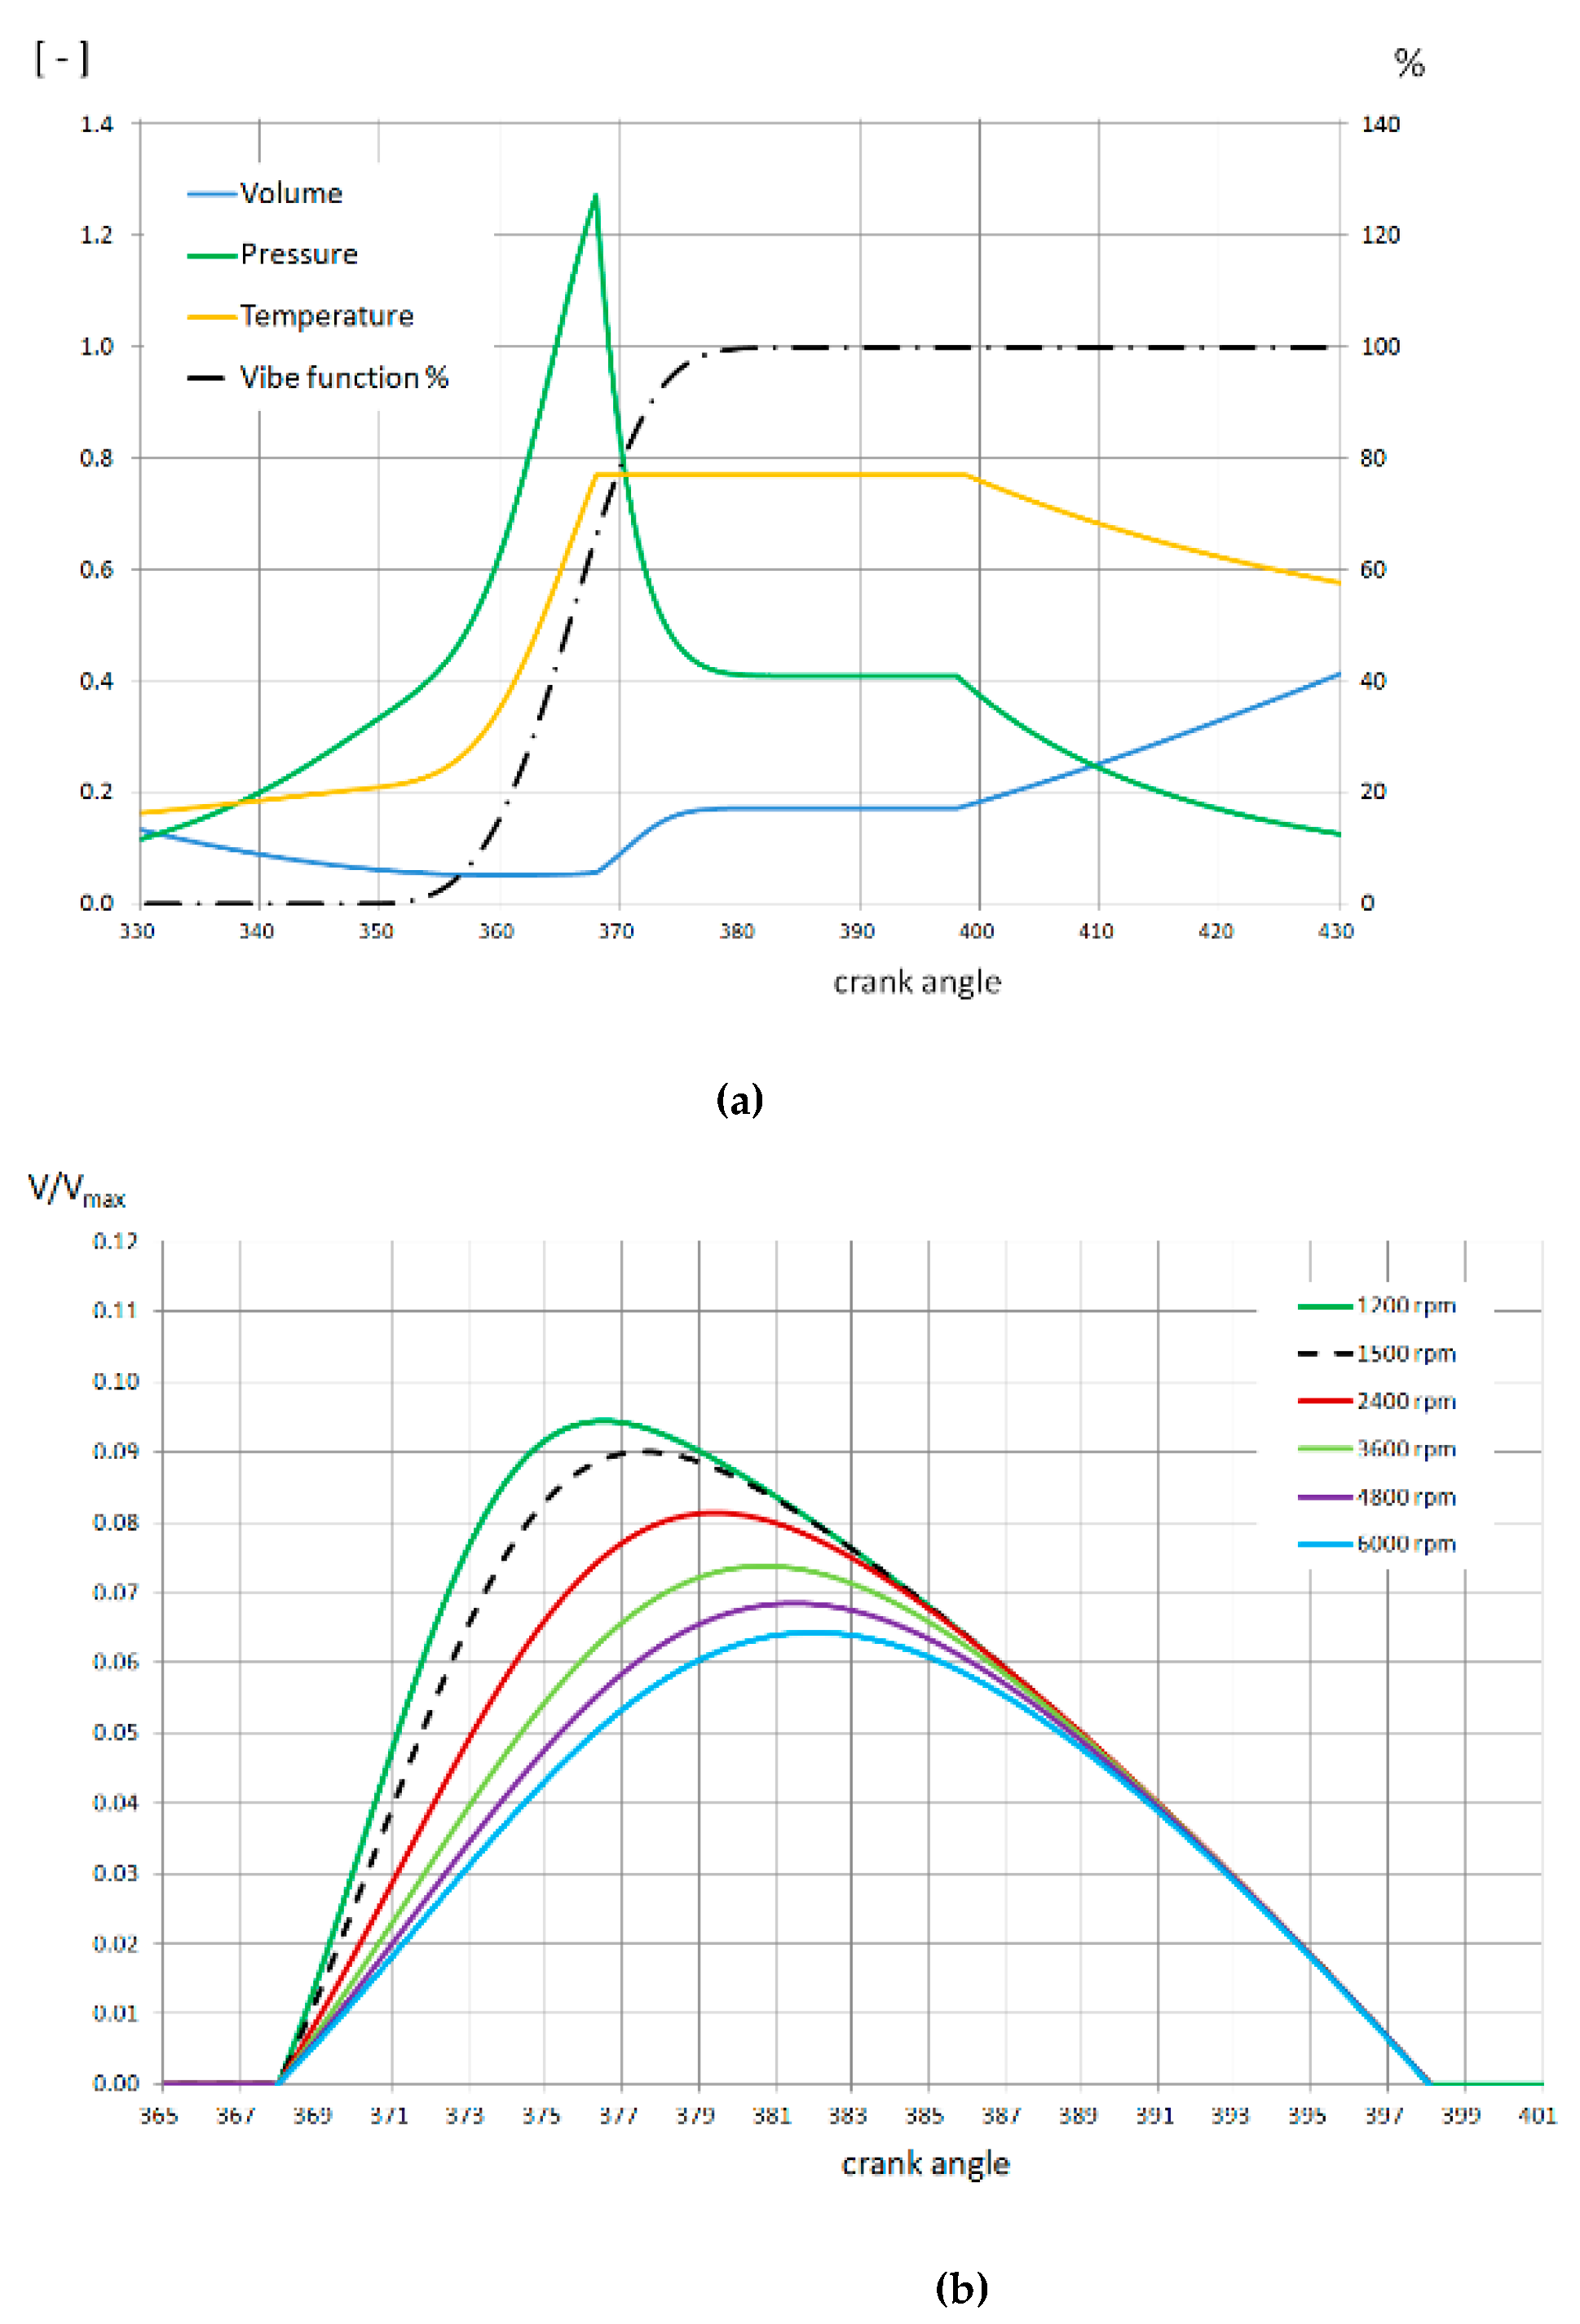
The changes presented in
Figure 2 are relative changes related to the maximum temperature obtained in the theoretical Otto cycle with a compression ratio of 11:1 and cover only the most important parts of the theoretical cycles. Thus, the value of 1 is taken by Otto in red, and the lowest value of 0.74 is in dark green, the proposed circuit. On the other hand, the highest temperature value of as much as 1.08 is in black, the Otto cycle with a compression ratio of 20:1, while variants with polytropic changes in other colors have values lower than 1. Despite having the same compression ratio of 20:1, the dark green graph is the most interesting because it is characterized by the lowest maximum temperature, the cycle in which Q
2 energy is supplied in an isothermal transition as in
Figure 1. For this reason, a mathematical analysis of the problem related to the proposed theoretical cycle was started.
2. Materials and Methods
For the proposed theoretical cycle shown in green in
Figure 1, an analysis was performed in which several necessary assumptions were made. The key assumption marked by No. 1 and dark green
Figure 2 is that kinematic modifications are only sought for isochoric and isothermal transformations in which heat is supplied, which is equivalent to the combustion process in real engines. After adopting the first assumption—the question arose as to how to create a new kinematic system, since theoretical cycles do not take into account the influence of time, and yet they should correlate with real cycles subject to time. Therefore, at this point, the authors proposed adopting further assumptions, which included:
- (1)
The method of heat release as described by the Vibe function with parameters chosen arbitrarily by the Authors, meeting specific requirements for spark ignition engines.
- (2)
There is no additional heat transfer in the compression and expansion stroke other than its supply.
- (3)
The working gas is perfect.
- (4)
Each change in volume is related to the angle of rotation of the crankshaft—as the main kinematic system.
After adopting the above assumptions, the concept of such a transformation of the theoretical cycle may seem strange, but it allows the considerations related to the curve of the combustion and heat transfer process to be omitted [
5]. The omission of these processes allowed for a simplification of the problem which led to the construction of mathematical models with analytical solutions. Since the vast majority of heat engines are internal combustion piston engines containing a typical crank-piston mechanism, it was decided to use this system in further analysis, mainly due to its unquestionable quantitative advantage over other systems and over a hundred years of development history (assumption No. 5). However, at this point, it should be added that although the use of a typical crank-piston system was the most practical because it included the largest number of piston engines—it does not have to be an exception to the analysis. In fact, many other systems can be subjected to a similar analysis, significantly expanding the spectrum of considerations. According to the authors, the analysis of such systems as:
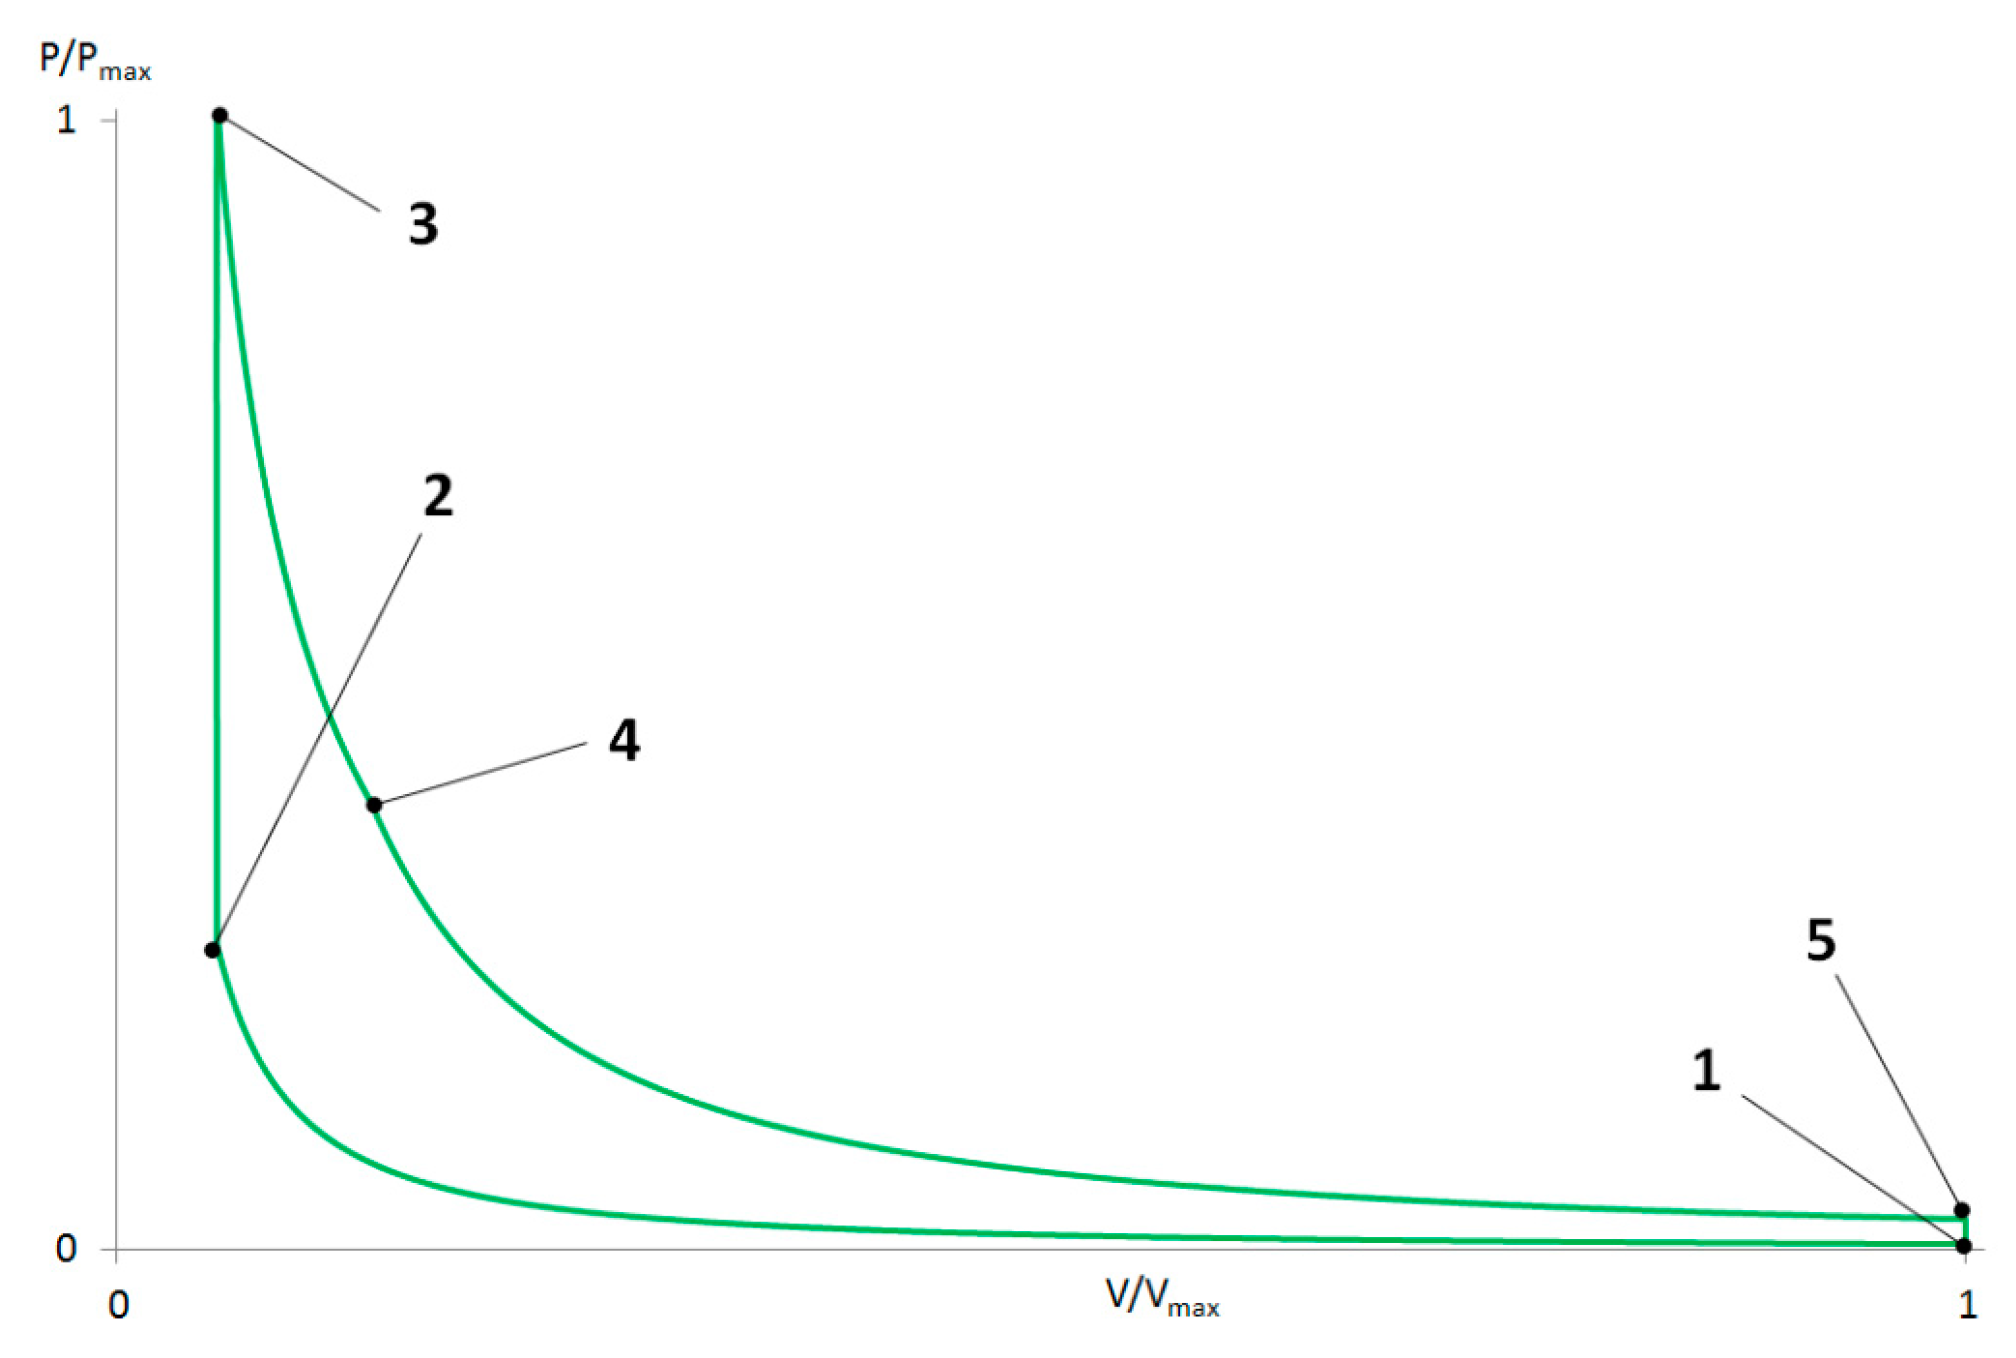
Ultimately, according to assembly No. 5, we thus remained with the first dominant crank-piston kinematic system, while the second kinematic system sought would be the system called “complementary”, a system that adjusted the total kinematics to the desired form. In order to facilitate the description of further mathematical transformations, the theoretical circuit with numbered characteristic points is shown in
Figure 3 again.
In the first step, the transformation consisted of determining the function describing the temperature in advance, which allowed for the elimination of pressure and the transition from the function of two points T = ∫ (p, V) to the side of one variable T = ∫ (p (V), V), i.e., T = ∫ (V). In the second step, it was assumed that the isochoric transformation points 2–3 and the isothermal transformation points 3–4 from
Figure 3 are replaced by the Vibe point, which realistically describes the heat supply to the tools. Adopting the Vibe function described, the ignition moment for the initiation is determined by the ignition advance angle: this caused a slight deformation of isochoric transformations by minimal changes at points 2–3.
The fourth step was to close the closed theoretical open circuit, which gave it the character of a function with the argument of crankshaft rotation. In the last, fifth step, the kinematics created in the fourth step was finally made, the kinematics of the complementary system. The use of the Vibe function to describe the curve of pressure changes in the cylinder as a function of the crankshaft rotation, that is to say to determine the manner in which the Q
1 energy portion and the remaining Q
2 energy portion are released, is an arbitrary decision of the authors. At this point, it should definitely be said that other functions can also be used, which, for example, describe combustion in internal combustion engines in a more accurate manner confirmed by tests taking into account chemical composition [
31,
32,
33,
34].
The Vibe function has many calculation variants [
3,
35,
36] taking into account at least a few parameters, but despite everything, its characteristic shape seems to undergo only a specific stretching or narrowing along the axis of the argument, the crank angle (ca). However, because it was necessary to provide specific parameters of this function, for example, to create graphic illustrations in the further part of the analysis, the influence of several most important parameters necessary to determine the Vibe function was taken into account, which included the following values:
rotational speeds of 1200 rpm, 1500 rpm, 2400 rpm, 3600 rpm, 4800 rpm and 6000 rpm, respectively
compression ratios 14:1, 17:1, 20:1
ignition angle values in the range of 335 ca–350 ca.
The adoption of the aforementioned parameters included in
Table 1 made it possible to obtain the numerical values necessary to calculate the curve of the Vibe function Equation (1).
The description of the kinematics of a specific complementary system requires the adoption of further assumptions containing specific numerical values of the additional volume change. The assumptions made were:
- ○
Maximum temperature in all calculations is constant and 27.5% lower than the maximum temperature in the Otto cycle with a compression ratio of 11:1.
- ○
Each of the back-ups will start a kinematic shift at the same crankshaft position of 368 ca (8 ° ca after TDC).
- ○
The value of the cp/cv exponent will be 1.35 in all of them
After all the energy is supplied, which takes place at the end of the isothermal transformation, the energy from the complementary system is also returned in isothermal transformation, and the complementary system kinematics returns to the starting position. At this point, we can write general equation (2) describing the kinematics together with the complementary kinematics of the engine implementing the isothermal transformation from 368 ca, which after introducing CA as an argument of the function will assume the final form (3).
where:
—the kinematic volume of the engine,
the total volume of the piston,
—the minimal volume of the combustion chamber,
—the displacement volume of the engine,
s—the displacement of the piston,
—the length of the connecting rod,
—the volume of the additional cylinder,
—the area of the surface of the additional piston in the engine’s cylinder.
After introducing the Vibe function and the isothermal transformation conditions, the volume change in the complementary system can be finally written by:
Substituting the numerical values from
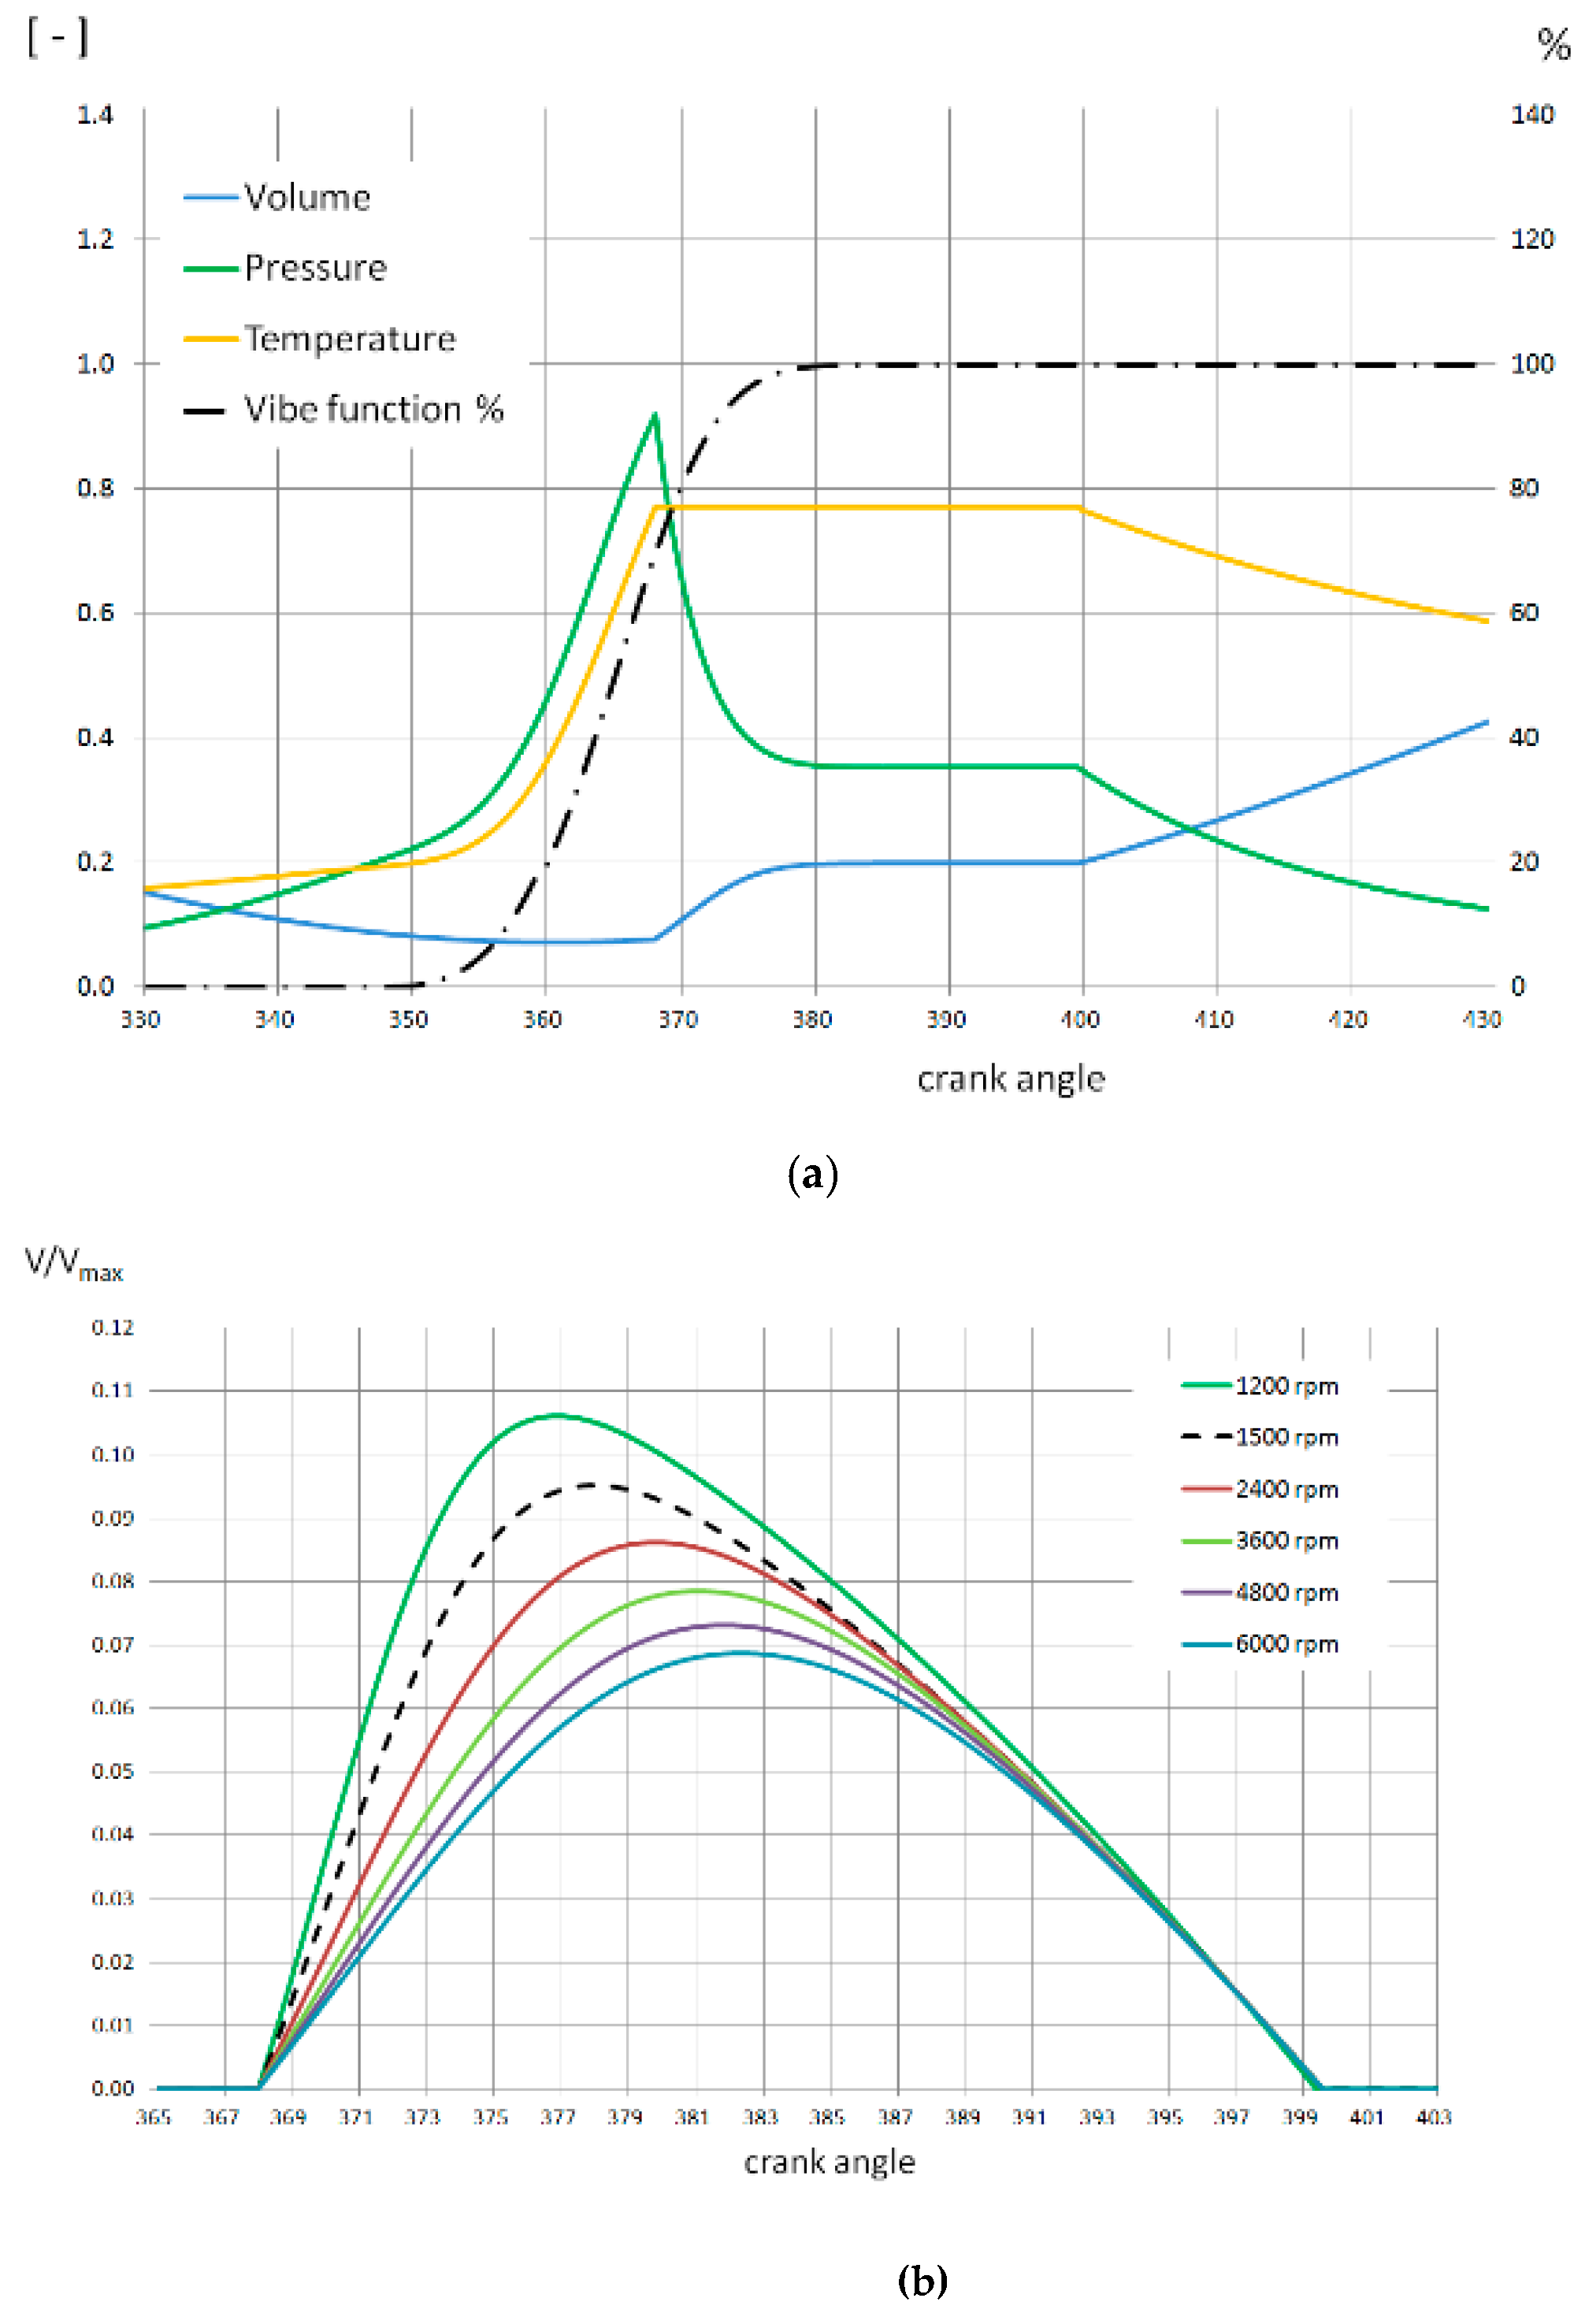
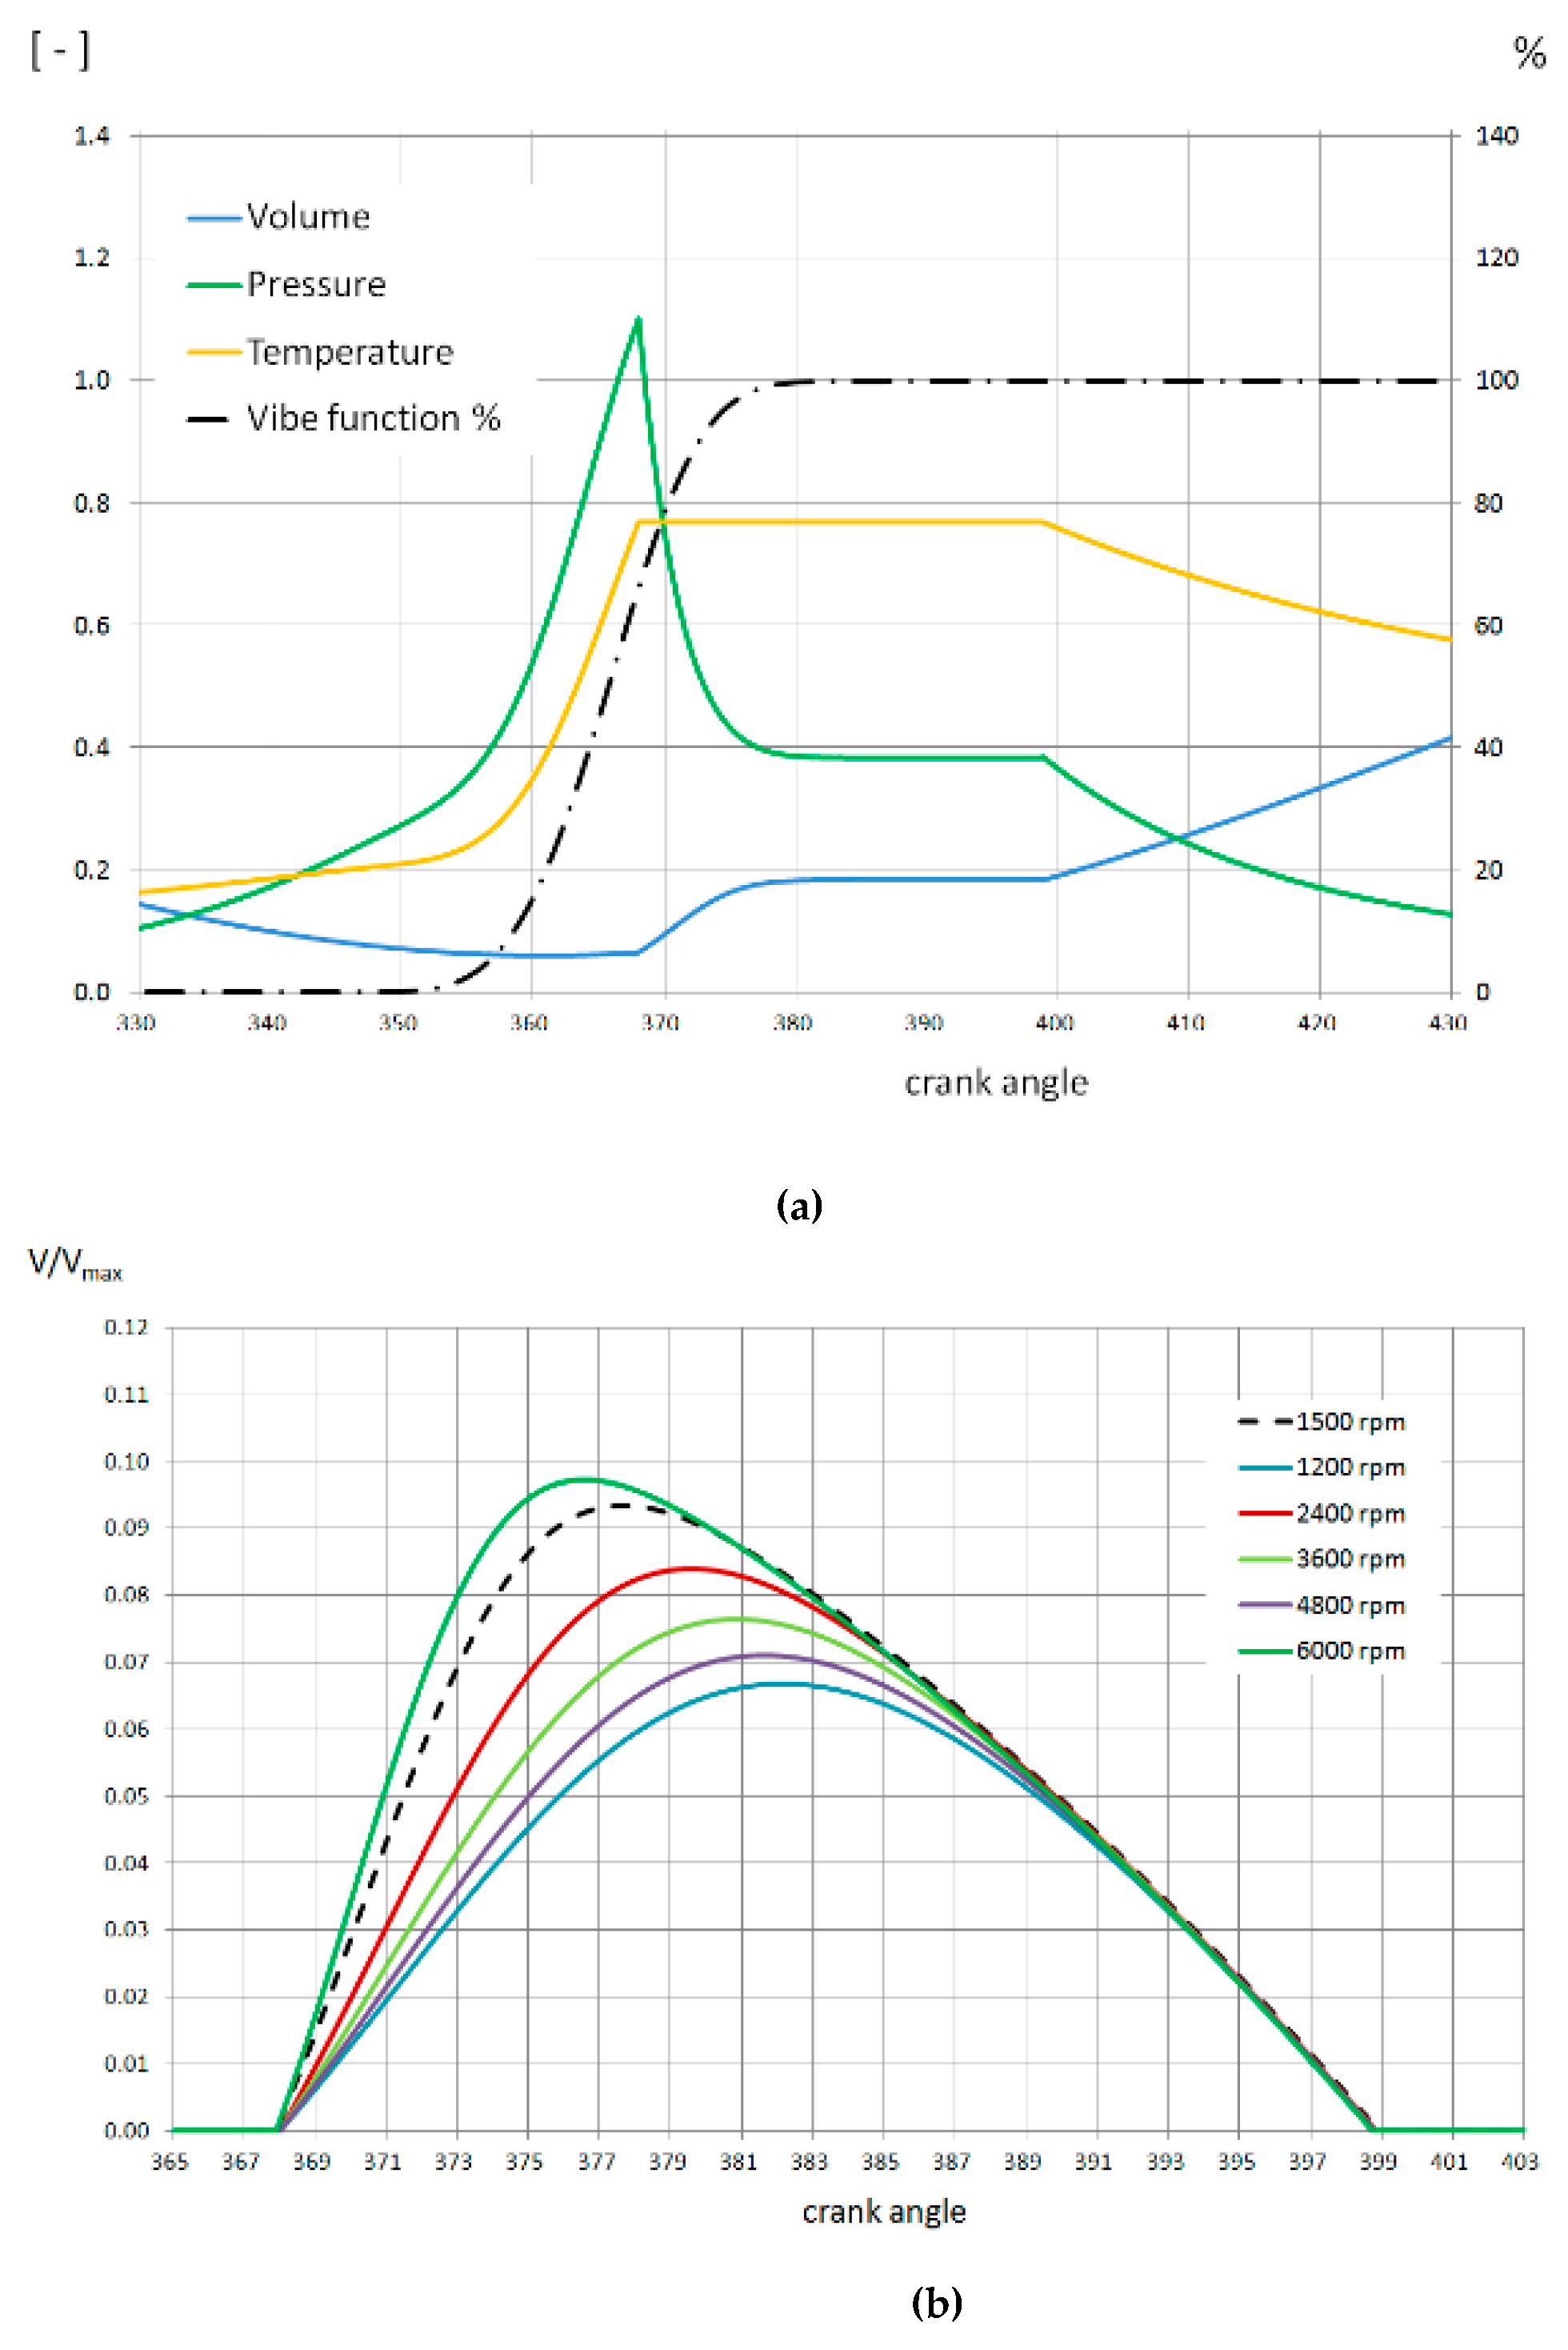
Table 1 into the above equation, subsequent charts from Figures were created. Seventy-four,
Figure 4,
Figure 5 and
Figure 6 illustrating the effect of the complement system. The charts in
Figure 4b,
Figure 5b and
Figure 6b were intentionally scaled in the relative volume, i.e., related to the maximum volume, to show how small the required range of changes is. A characteristic feature of these graphs presented in
Figure 7,
Figure 8 and
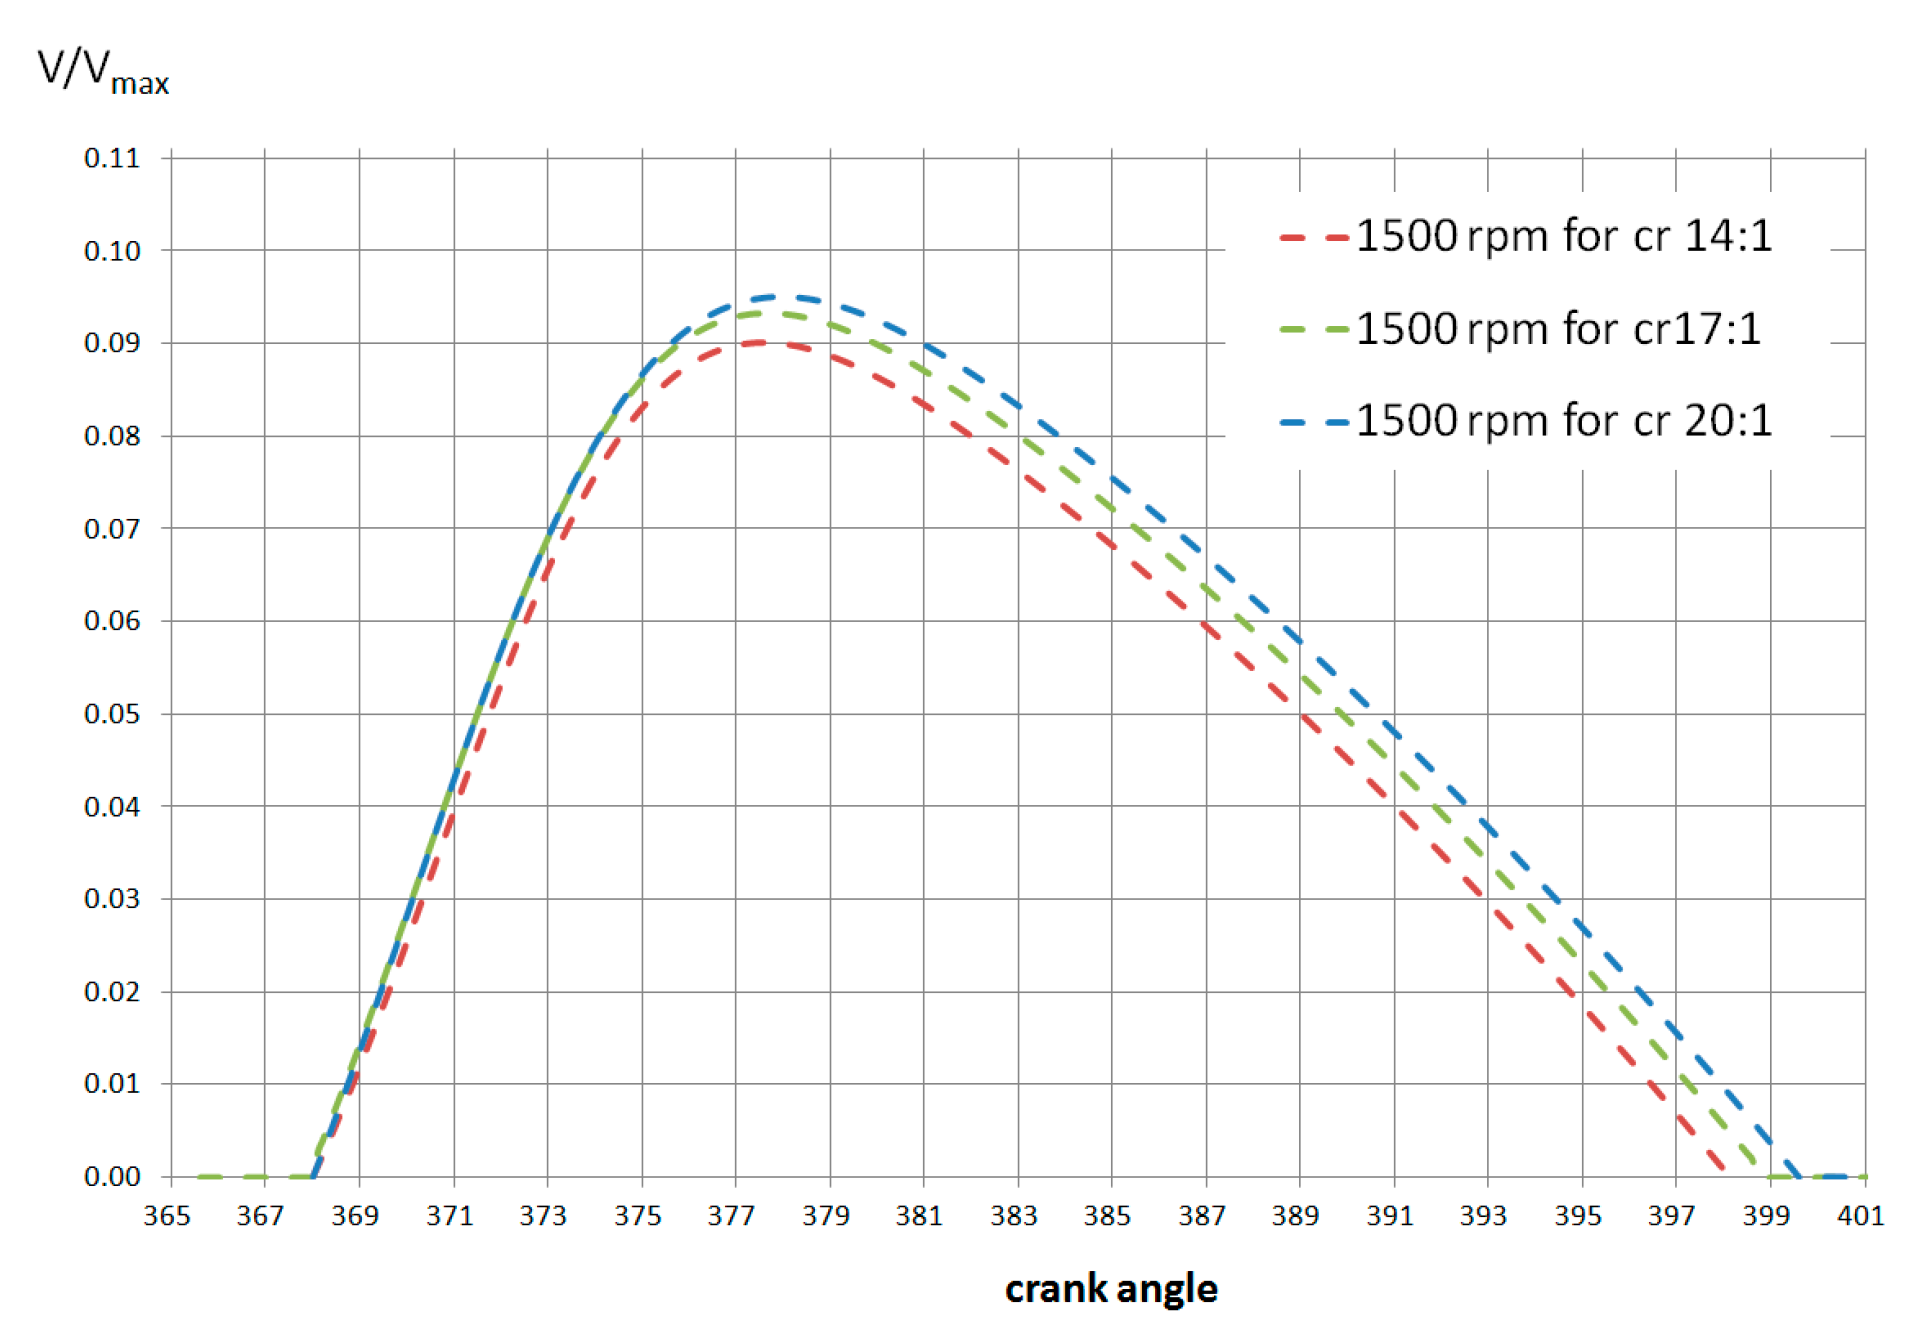
Figure 9 is their smooth course and tendency to decrease changes with increasing rotational speed, which is important in Fourier analysis, which in turn is consistent with logic.
In turn, increasing the compression ratio does not require an increase in the reaction of the complementary system, but a slight acceleration of this reaction.
Performing the calculations according to the mentioned steps and adopting the parameters of the function Vibe from
Table 1 for 1500 rpm, the final result was obtained as illustrated by the graphs in
Figure 4a,
Figure 5a and
Figure 6a. Next to each of the index charts, the required changes to the complementary structure are provided. The dashed line on each
Figure 4b,
Figure 5b and
Figure 6b indicates additional changes in the volume presented in figures with the index a, i.e., 41,
Figure 5a and
Figure 6a, respectively. For the graphs in
Figure 4b,
Figure 5b and
Figure 6b, it can be assessed that the predicted maximum volume change is achieved at a minimum speed of 1200 rpm and remains within 10 to 11% percent of the total volume, which will turn out to be favorable for technical solutions in that they must bring about these changes. In the complementary system, despite the clearly increasing compression ratio, no significant changes in volume can be observed, as shown in
Figure 10. These differences become significant for another parameter determining the curve of the Vibe function, the rotational speed, which varies widely from 1200 rpm up to 6000 rpm, as shown by the colored runs of the complementary circuit in each of the figures. It should be mentioned that the biggest change in the complementary system corresponding to the rotational speed of 1200 rpm is due to the shortening of the Vibe function interval, and in this case, the complementary system is primarily responsible for the volume change. Analogies of this situation can be found in many charts with the maximum torque of real spark ignition engines, where the lack of a complementary system makes it impossible to use the full load, which would certainly result in detonation [
37,
38,
39]. In these graphs, we will see how the load is deliberately reduced to compensate for the slow volume changes favoring the detonation phenomenon, which gradually disappears as the rotational speed increases.
It was possible to complete the analysis at this stage because the kinematics of the complementary system were obtained: it was possible to implement the proposed cycle. However, in the analysis cited there is no recipe for technical implementation. For this purpose, it was decided to use Fourier’s analysis, that is to say its series, the words of which are described by equations well known, for example, describing mechanical oscillators, crank systems, or electrical circuits. Besides this, the Fourier series is used to balance the internal combustion engines themselves [
4], showing that only three words give excellent technical effects in the form of counter-rotating weights compensating for its unbalance. Among other things, further analysis was undertaken for these reasons, assuming that mechanical oscillators would be a specific basis for the search for complementary kinematic systems.
In order to perform a Fourier analysis certain conditions must be met for the function subject to expand into this series, in our case two functions. As a reminder, they are listed below.
We call any series of characters by a trigonometric series:
where: T is a positive real number, each term in the series is a 2T periodic function.
The Weierstrass theorem states that any continuous and periodic function can be approximated with any precision by a trigonometric series. We suppose that we are dealing with a function f integrable on the interval [−T, T]. Here is a trigonometric series, in which the coefficients a
n and b
n are determined from the equations:
we call this the Fourier series. To answer the question when a function f is the sum of its Fourier series, let us enter the Dirichlet conditions:
1. The function f has only a finite number of type I discontinuity points on the interval [−T, T], and in each of these points x_ is equal
The 3rd interval [−T, T] can be divided by points x0, x1, xN on N intervals such that on each interval [xn, xn+1], n = 0,. The, N-1 function is continuous and monotonic.
Theorem 1. If the function f, integrable on the interval [−T, T], satisfies the Dirichlet conditions, it is the sum of its Fourier series.
Note that if a function is odd (i.e., satisfies f (−x) = −f (x)) then only the coefficients bn (and coefficients are zeros) appear in its Fourier solution. Likewise, if the function is even (i.e., satisfies f (x) = f (−x)) then only the coefficients can appear in its Fourier expansion (the coefficients bn are zeros).
In the case of a crankset, the condition for continuity is obvious: the same applies to the Vibe function, which by its nature is continuous, so the above assumptions are met. On the other hand, the measurements of the actual averaged (smooth) pressure curves indicated in the engine almost always seem to be satisfied.
Having quoted the above conditions, it is possible to predict and even expect at this stage that the kinematics of the volume change the system with such a series or a specific number of its words, leading to the creation of an isothermal transformation or another very similar to it in a real engine.
3. Results
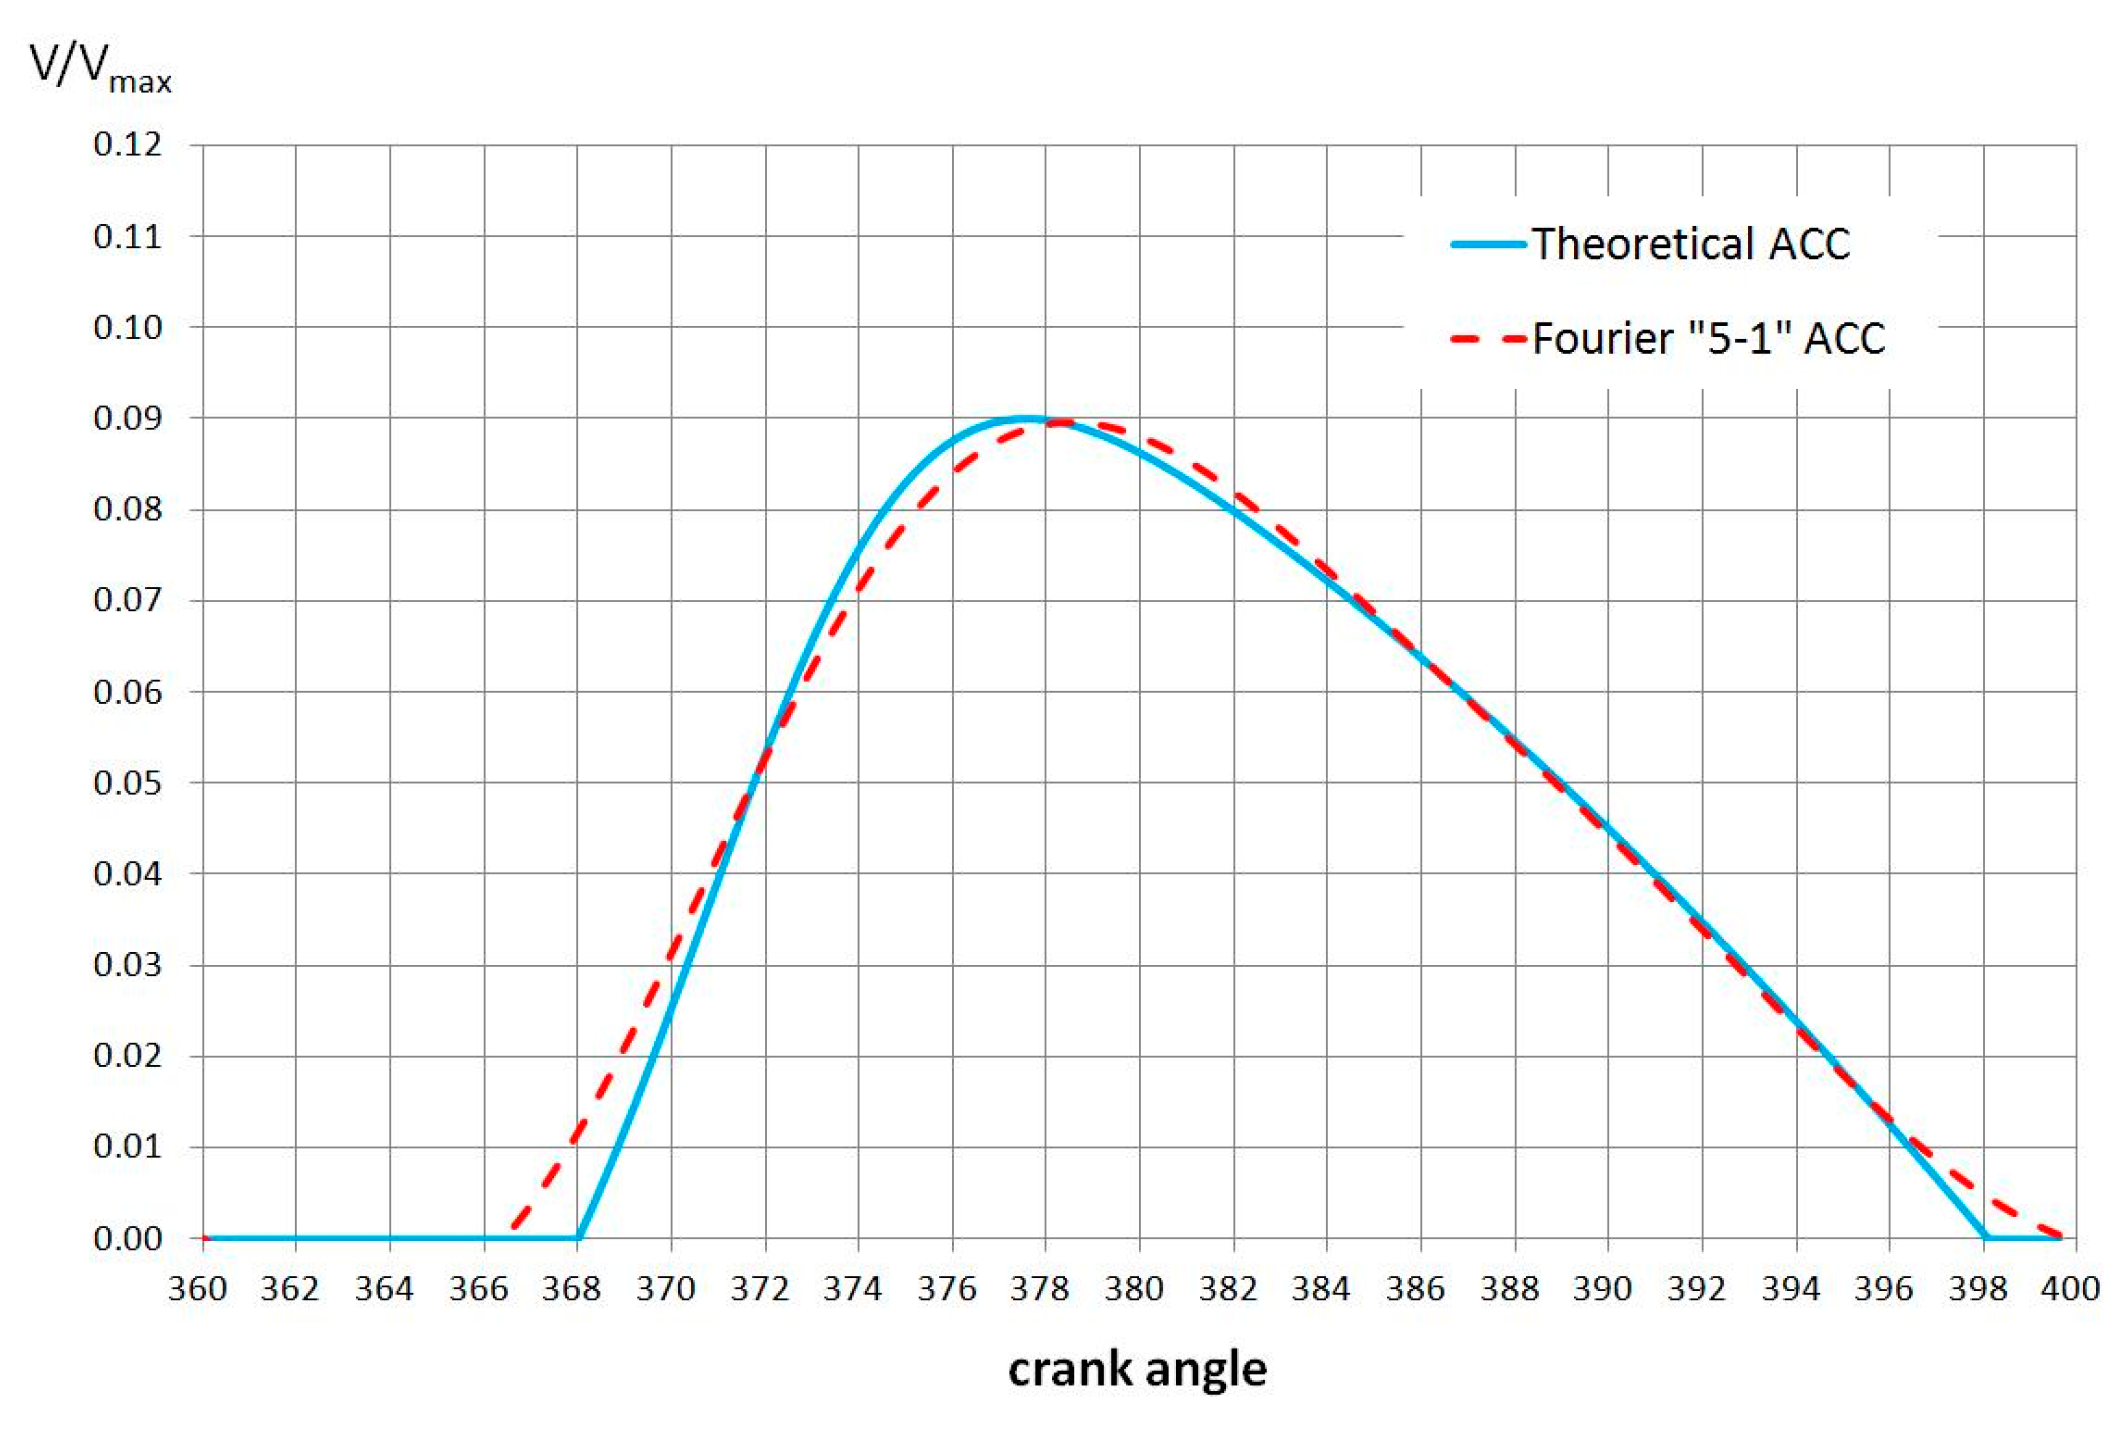
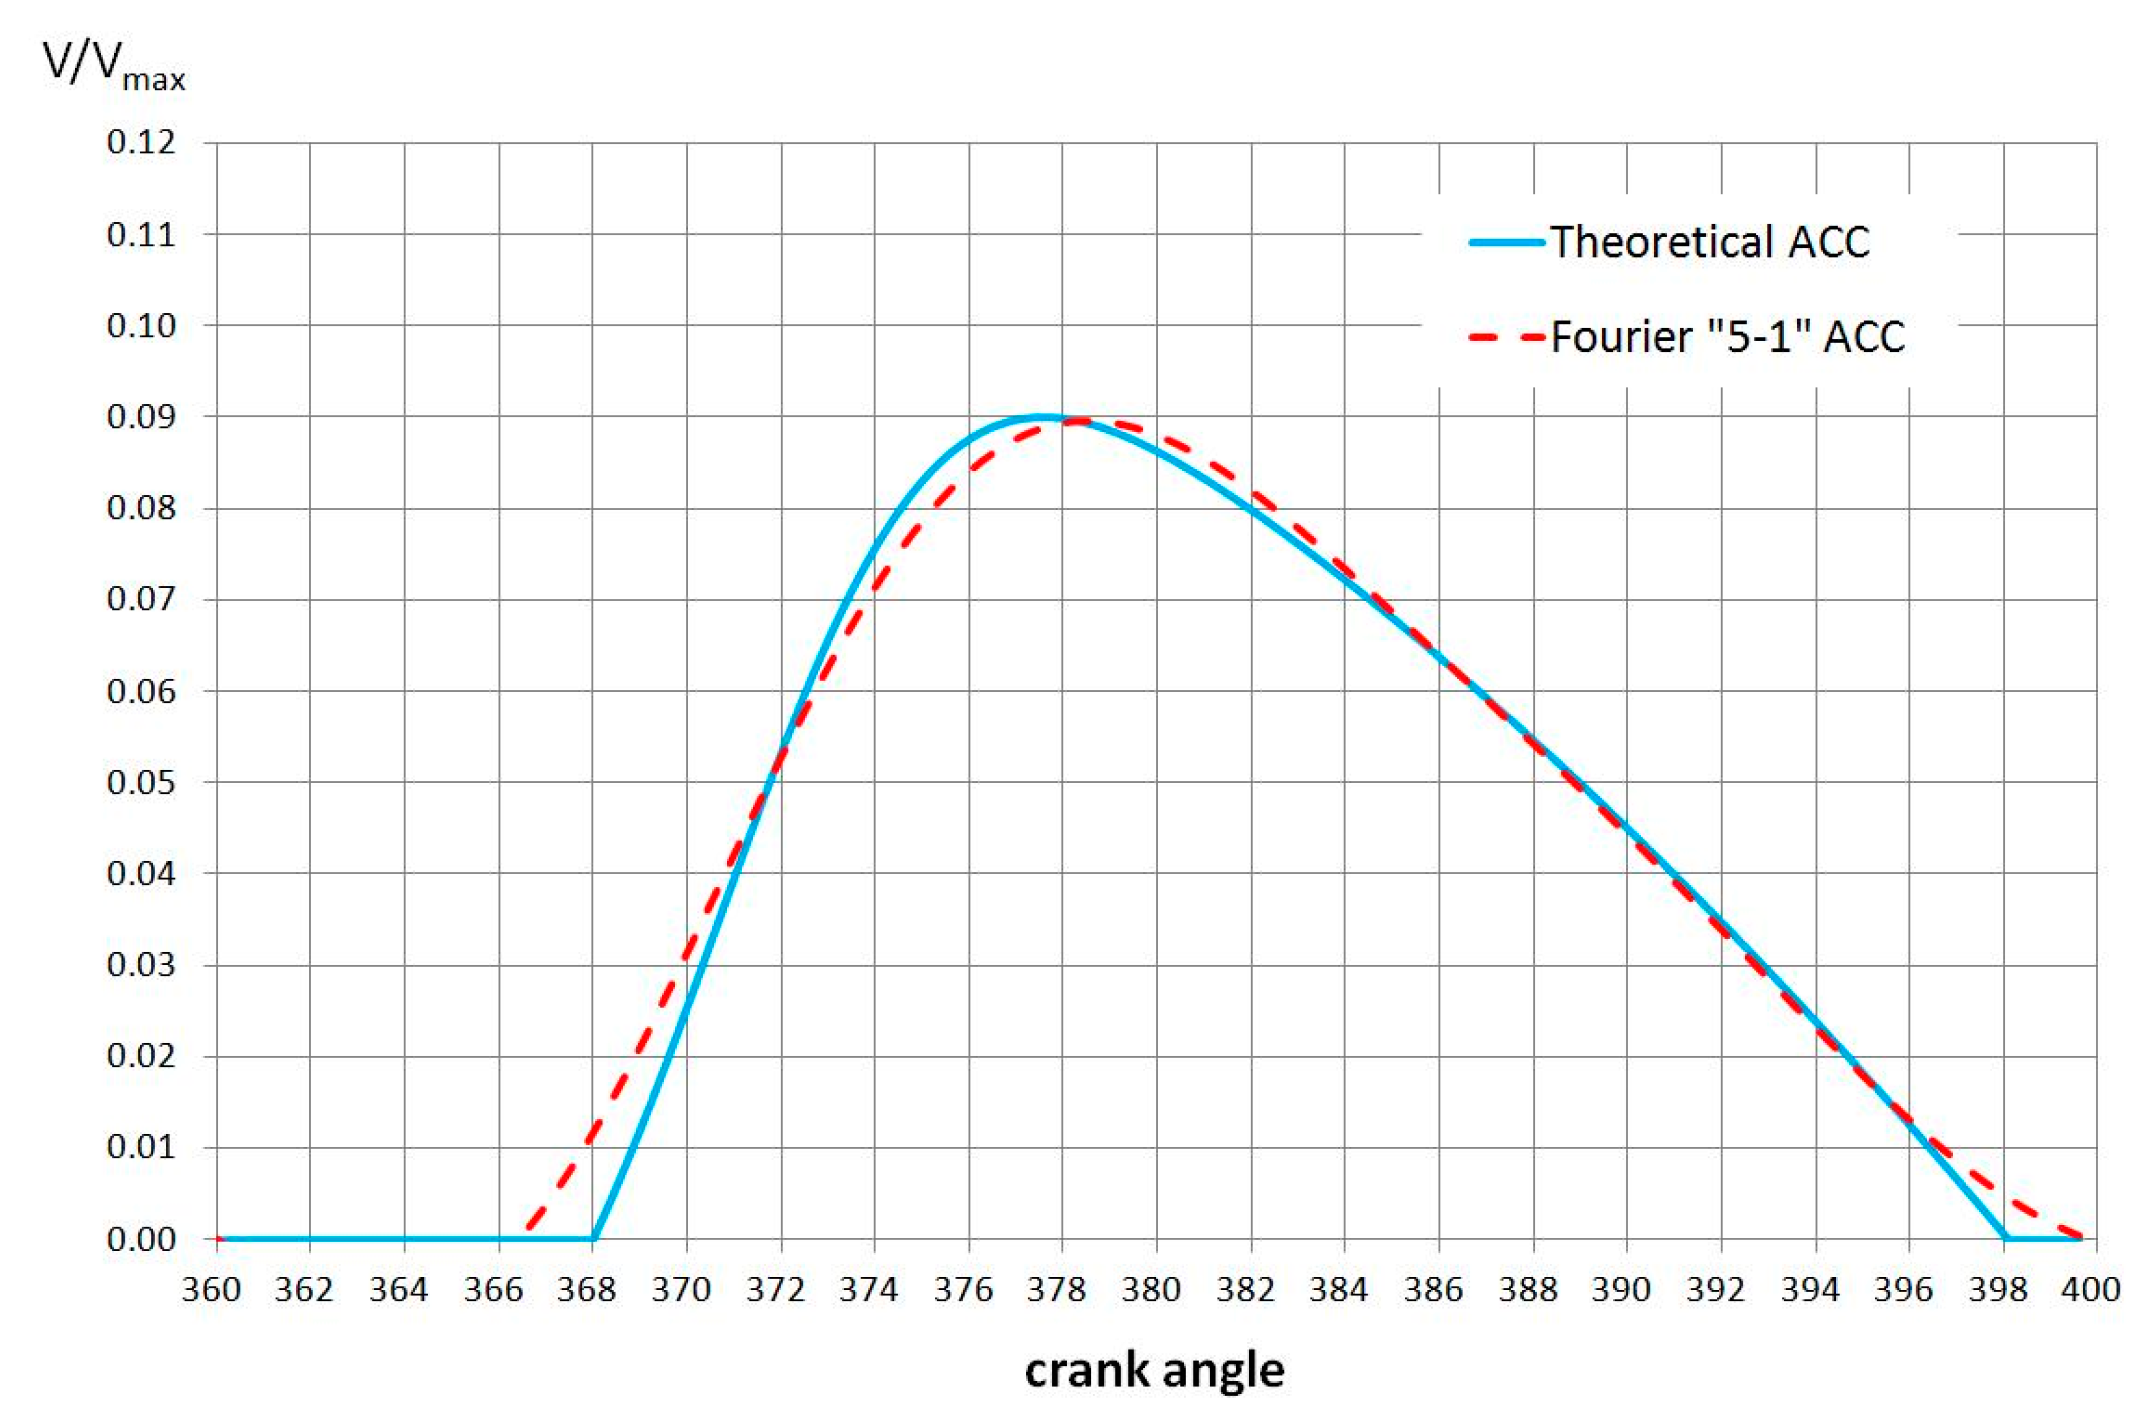
After determining the volume change function in the complementary system, its decomposition into trigonometric functions included in the Fourier series was started. In the analysis carried out below, five words from the Fourier series will be used, but of course, the number of these terms can be increased or decreased by reaching the assumed level of accuracy of the complementary system representation (or other assumed thermodynamic criterion). The numerical values of the coefficients to be developed for the five words as previously are summarized in
Table 2 and the general equation (x) is given below.
After determining these coefficients, one could create graphs analogous to those in
Figure 7,
Figure 8 and
Figure 9,
Figure 4b,
Figure 5b and
Figure 6b, but limited to three selected for 1500 rpm and cr 14:1, cr 17:1 and cr 20:1. On the other hand, the waveforms of the functions created using the Fourier series, which can be found in
Figure 7,
Figure 8 and
Figure 9, were compared with the calculated changes in the volume in the complementary system.
From the analysis performed, which resulted in the comparative graphs in
Figure 7,
Figure 8 and
Figure 9, it appears that there is a potential to replace the complementary system with a finite number of oscillators, allowing for a constant temperature to be obtained during the supply of the second energy portion (combustion in the second phase), for example. Again, at this stage, it would be possible to complete the determination of parameters necessary to build a function with an additional change of volume using the Fourier series, but the system excited at the cost of energy from the circulation, according to the assumptions adopted, should return it back to circulation in the most favorable way possible. In general, it was assumed that the energy absorbed by the make-up system is returned to the engine with an efficiency similar to the cycle realized [
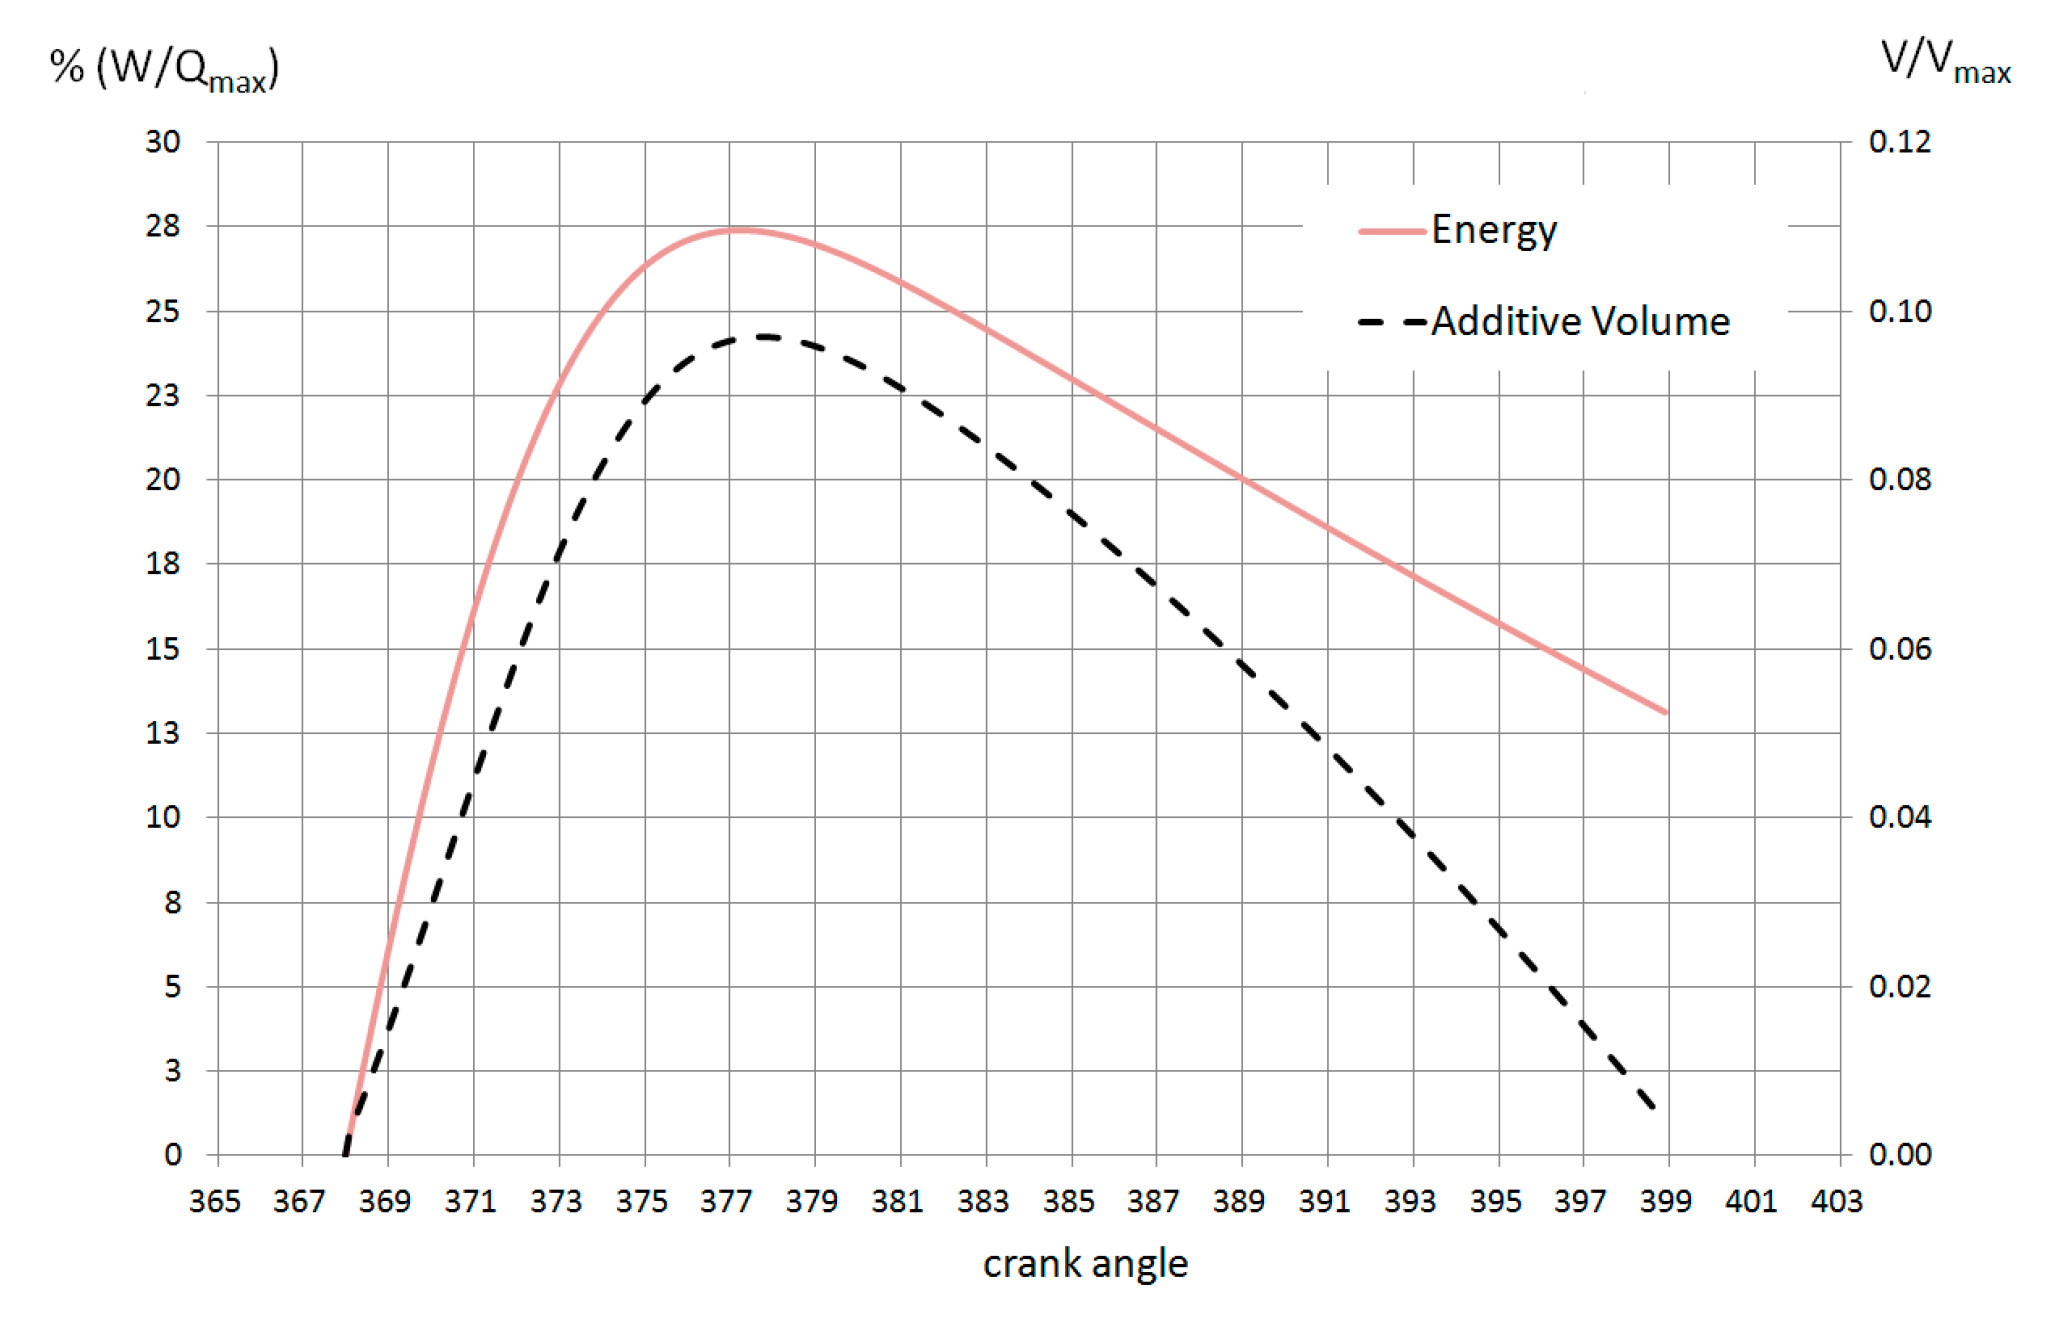
1], which takes place in an isochoric transformation at constant pressure, so it has no thermodynamic effects. This can be imagined in such a way that the increase in volume in the crank-piston system is 100% compensated for by the decreasing volume of the complementary system which returns energy to the circuit (for example in the ACC system). The curve of the relative energy related to the total energy supplied to the circuit in the complementary circuit is shown in
Figure 10, along with the corresponding relative change in volume in this system.
For
Figure 11 presented the change in the flow of relative mechanical energy in the complementary circuit, its efficiency was determined to be approximately 63%, which is a fully acceptable value that meets the criterion adopted in [
1]. The rest of the energy was converted into kinetic energy, which also takes place in real complementary systems, in which, additionally, friction is generated, completely omitted in the considerations. In
Figure 10, we can see how the mechanical energy in the complementary system during volume expansion was accumulated and then returned to circulation during volume reduction, which must take place at a precisely defined angular moment of the cycle and obviously is associated with the very short reaction time of the complementary system, especially for real engines. Summarizing the above considerations, it can be stated that kinematically it would be possible to replace the complementary system with a small number of oscillators, and preferably with one replacing the others, as shown in
Figure 12a,b , which shows the graph with the waveforms of the five Fourier harmonics and the
Figure 12b one-mass equivalent system.
Figure 12a shows forces in multimass systems that would be inherently difficult to control, and how they were eliminated in favor of the more complex single-mass system in
Figure 12b. In this simple way, a technically acceptable solution was obtained that could work in a very unfavorable environment of high pressure temperatures and great acceleration values.
Without going into details of this single-mass system equipped with nonlinear springs and damping the dynamics of the mentioned systems, and limiting only to changes in volume, the drawing with the next diagram is shown in
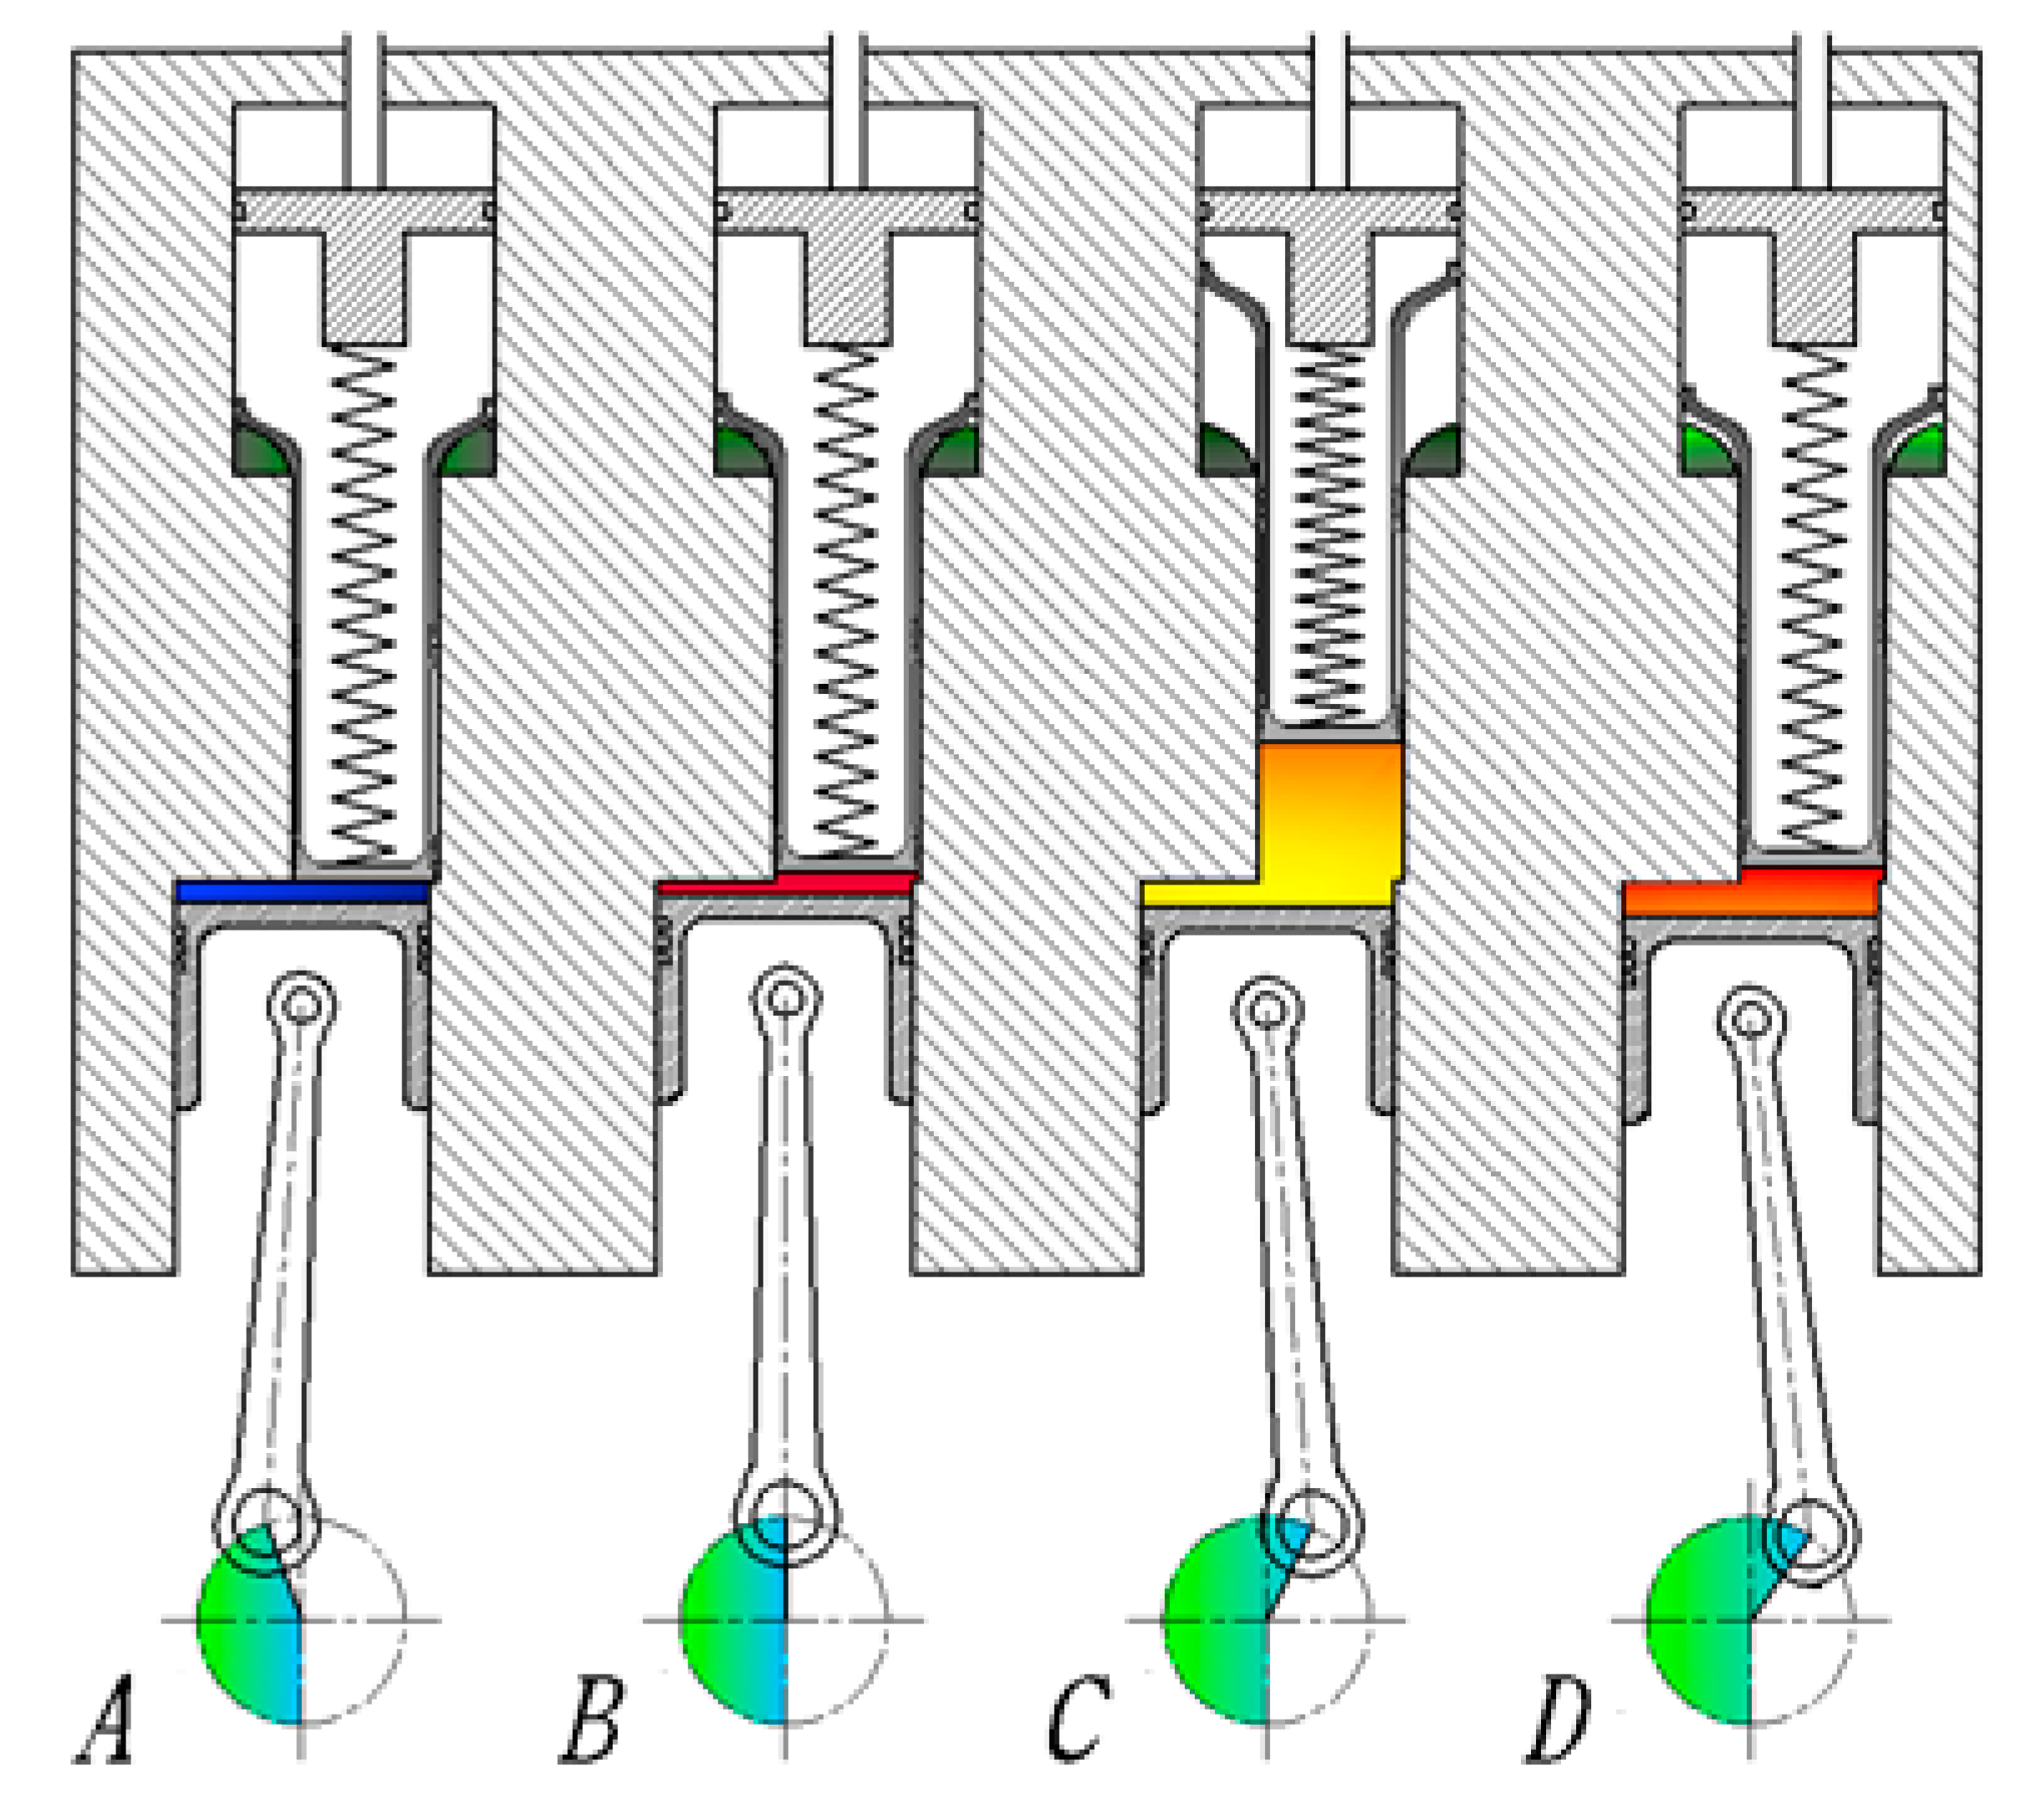
Figure 13, i.e., the expected changes in the position of the single-mass system at its characteristic points with respect to the crankshaft. This time the single-mass circuit has been replaced with the real circuit with the so-called ACC system, which was drawn in the diagram from
Figure 13 in the correct proportions and at characteristic points, and at its characteristic points of location in relation to the crankshaft. In
Figure 13, the complexity of the support from the diagram in
Figure 12b has been replaced by a single symbolic spring. Below the diagram there are typical parameter values for the characteristic positions of the parameter values, which were determined on the basis of empirical tests [
27] obtained for various rotational speeds and loads.
A—ignition moment (30 °–10 ° ca before TDC),
B—TDC.
C—maximum deflection of the piston in the ACC system (20 °–40 ° ca after TDC).
D—first minimum deflection of the additional piston in the ACC system (30 °–60 ° ca after TDC).
It should be noted here that the technical implementation of the adopted concept in a diesel engine requires the necessary condition from the ACC system shown in
Figure 13, which is “appropriate reaction time, i.e., the time in which an additional change in volume occurs, because it must be compatible with time of burning”. In the case under consideration, it was assumed that the time should be comparable to that resulting from the Vibe function, i.e., taking into account the angle of rotation of the crankshaft. Ignoring the detonation combustion situations occurring, for example, in HCCI engines [
9,
11], the combustion time of which is too short (0.05 ms to 0.2 ms), it can be approximated that in the current combustion systems of engines with GI the burning time is between 0.4ms and 3ms, which is mainly due to the load and the combustion system used, which is approximated by the Vibe function [
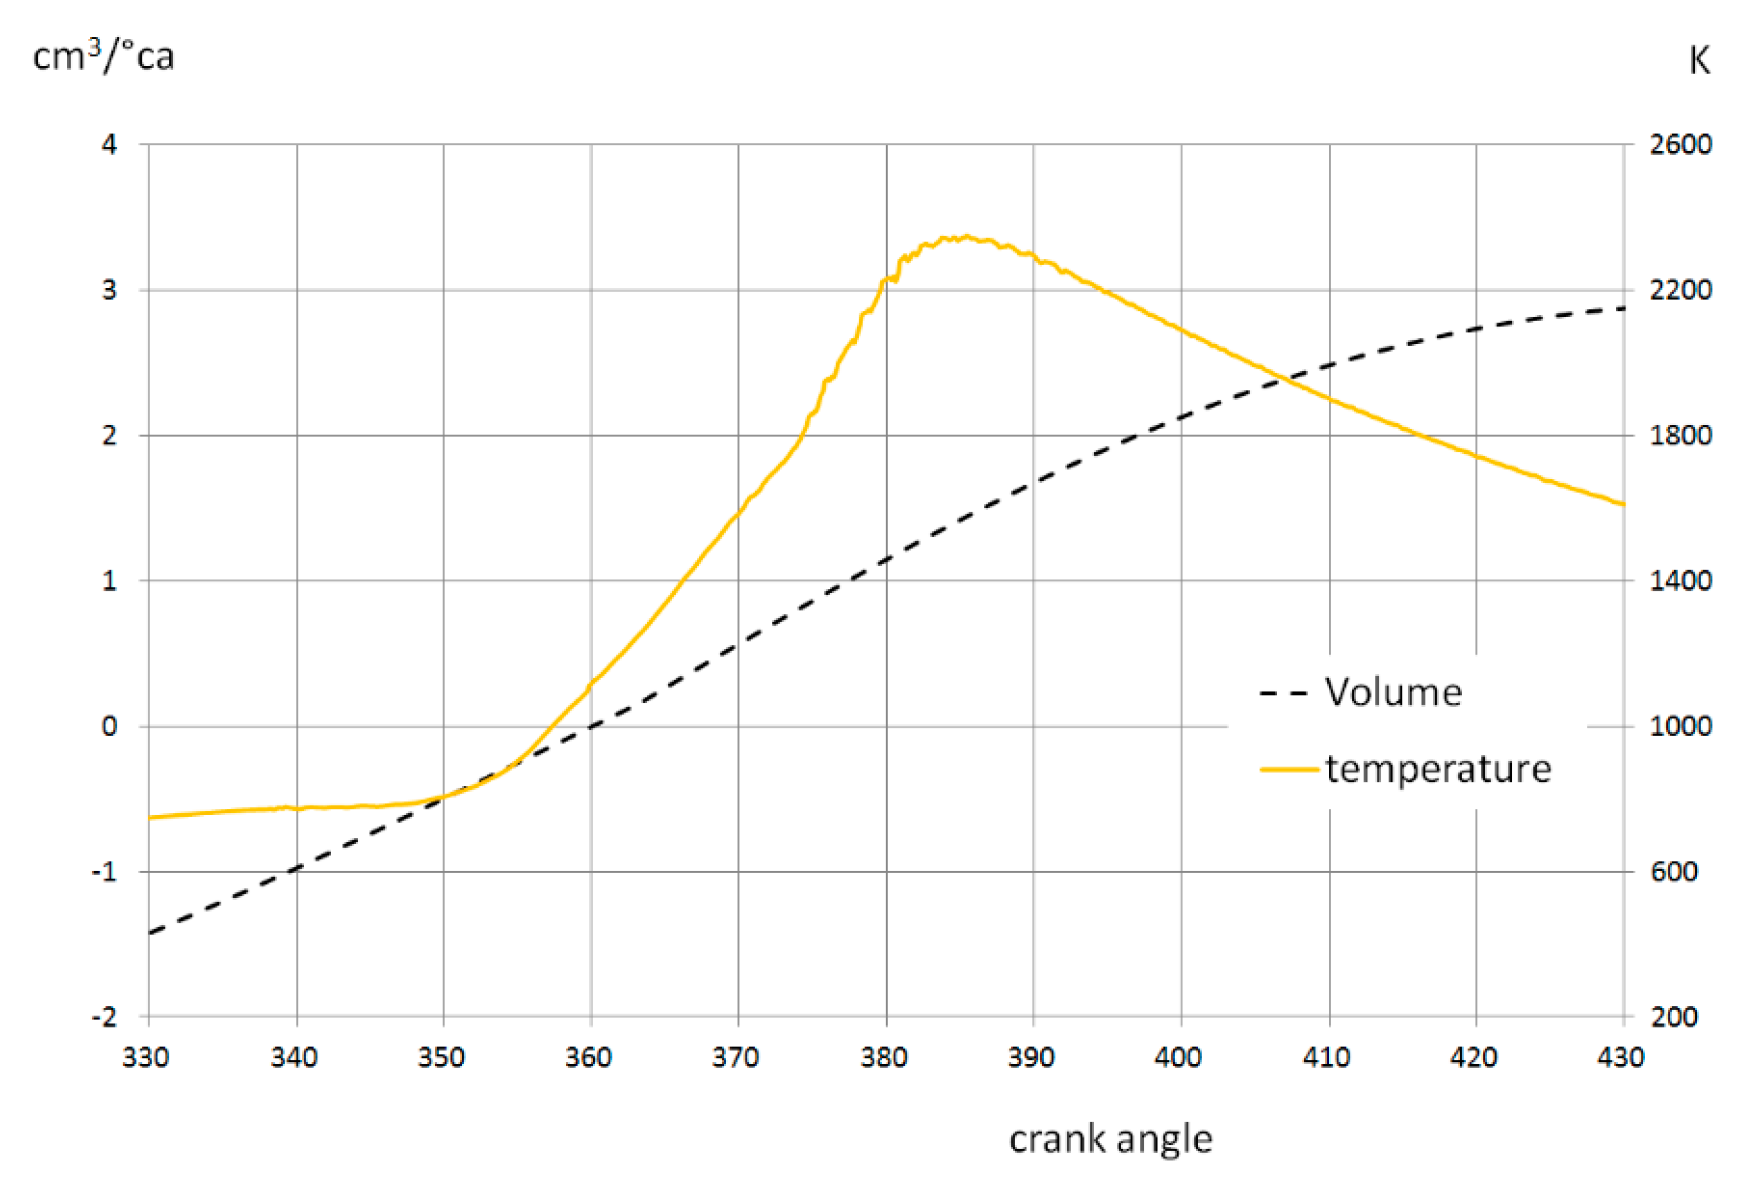
5]. The time from the theoretical analysis is shorter, 50 to 60%, than the empirical results presented in Figures 14–16, because the analysis did not take into account the heat transfer and the effect of slowing down the combustion process for faster volumetric work by the ACC system.
The ACC system, which is a viable technical solution, performs an additional volume change using the so-called additional piston with a very low weight (approximately 130 g) and pneumatic support. Pneumatic support, which is nonlinear by definition, because the Clapeyron equation described with a fair approximation is an advantage, fits better into the cycle modifications. In addition, the system is equipped with the possibility of adjusting the volume and pressure of the supply, allowing the system to be adjusted to various load and rotational speeds. In this respect, kinematically related volume change systems clearly differ from the ACC system with regulation, which allows at least a good kinematic approximation to an ideal complementary system cooperating with a crank-piston system, but there is no problem of energy recuperation, which may ultimately determine the advantage one of the solutions. It is of great importance for the traction motor that the ACC motor works with a very high compression ratio at partial loads at least 18:1.
4. Discussion
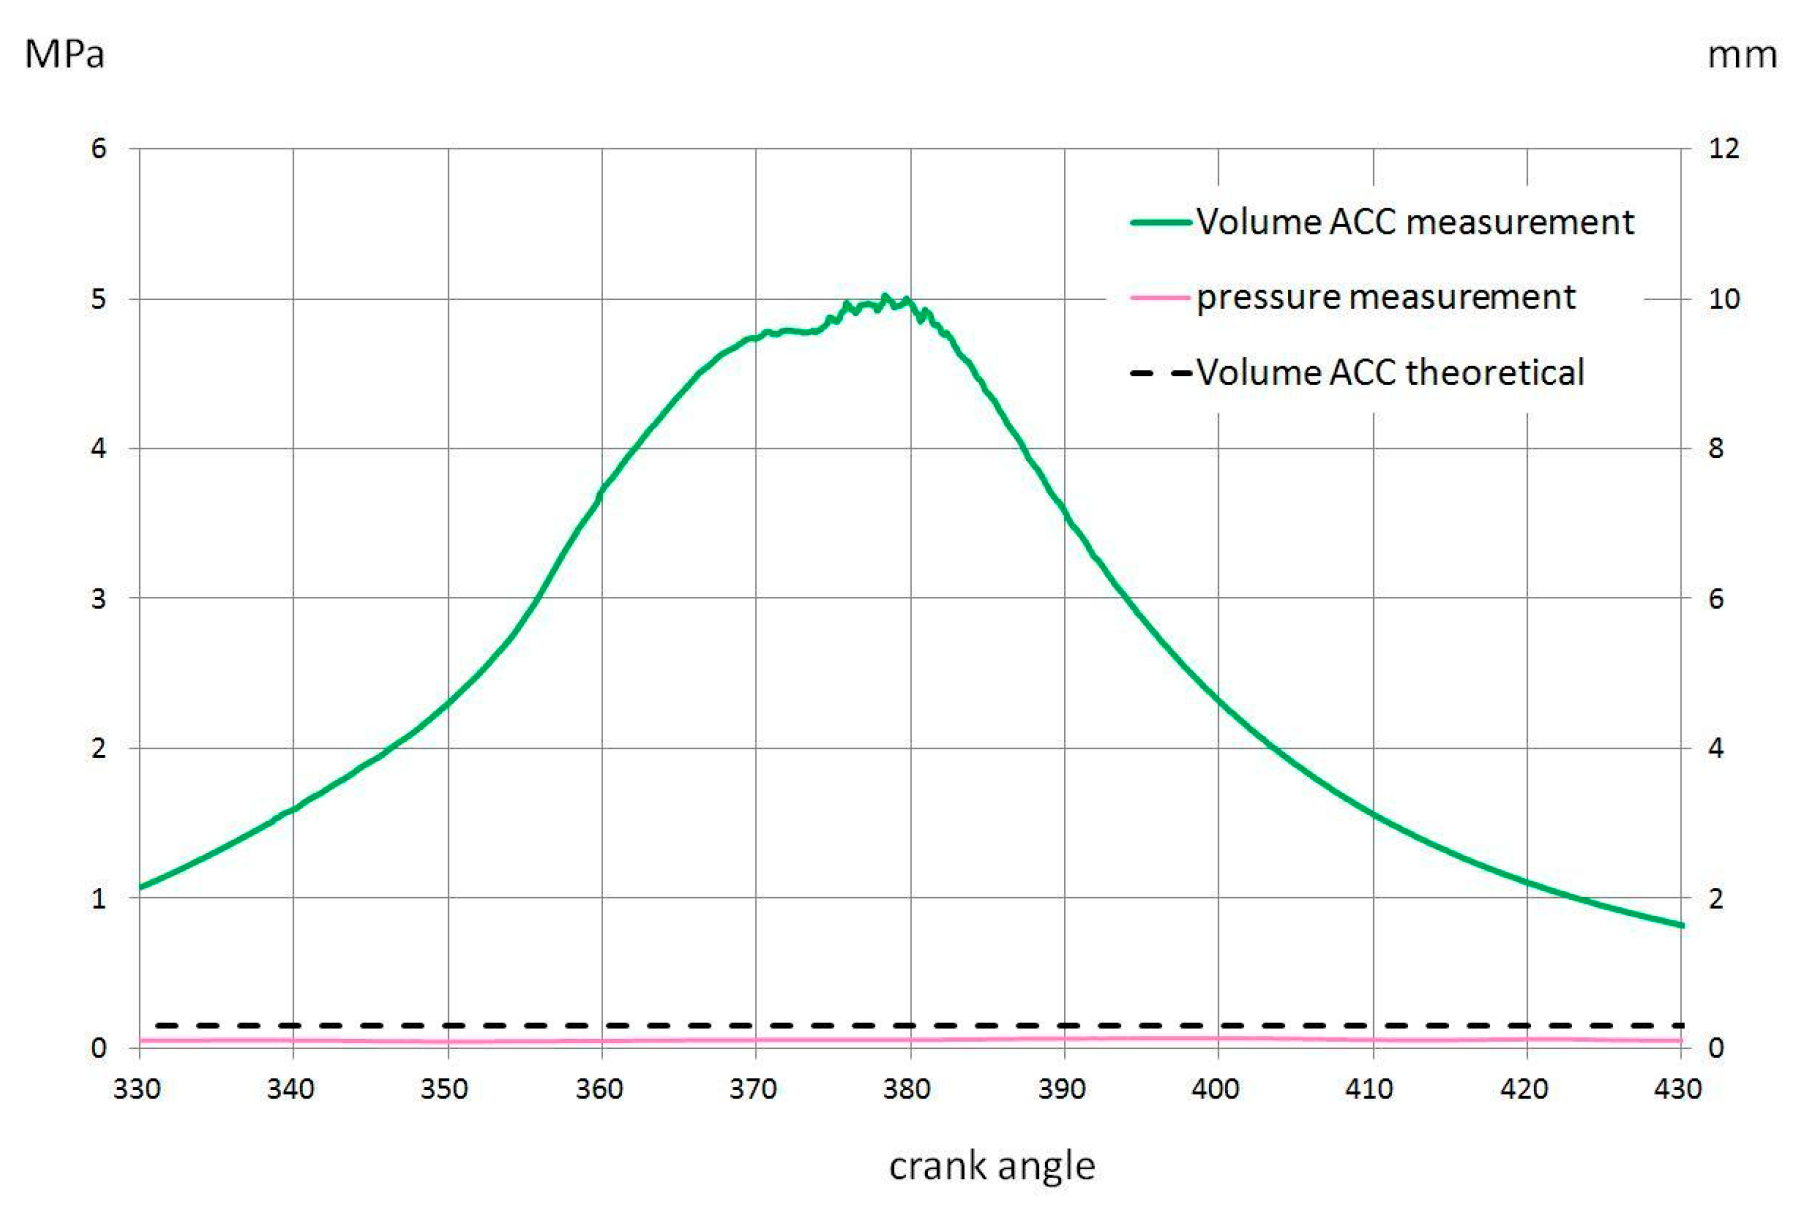
For a credible discussion, empirical measurements made in the engine with the ACC system turned out to be necessary, which eliminated all doubts regarding the technical implementation. The presented measurements were carried out in an engine with a maximum compression ratio of 17.5∶1, in which only one parameter was changed in the ACC system (complementary), it was the value of the supply pressure, which was changed in steps from 13 bar, 11 bar and 10 bar. The value of the rotational speed was close to the value of 1500 rpm ± 15 rpm, which corresponds to the dashed lines in
Figure 14,
Figure 15 and
Figure 16. The results of empirical tests were presented in the form of open diagrams of the pressure course and the change in relative volume caused by the movement of the additional piston from the ACC system. To facilitate the interpretation, the same range of the values of the crankshaft rotation angle from 330 ° ca to 430 ° ca was kept, also in order to show the mutual correlation with the diagrams of theoretical cycles in
Figure 4a,
Figure 5a and
Figure 6a. In the presentation of the results, the following sequence was observed from the highest (13 bar) to the lowest (10 bar) supply pressure of the ACC system. The graphs are presented for an incomplete load by placing on each of the three graphs the corresponding volume change in the theoretical complementary system calculated for a full load using the Vibe function. The graph in
Figure 13 corresponds to the maximum cr 17.1:1 that was achieved at part load (approximately 65%) for a speed of 1500 rpm in the engine without the intervention of the ACC system. The graph from
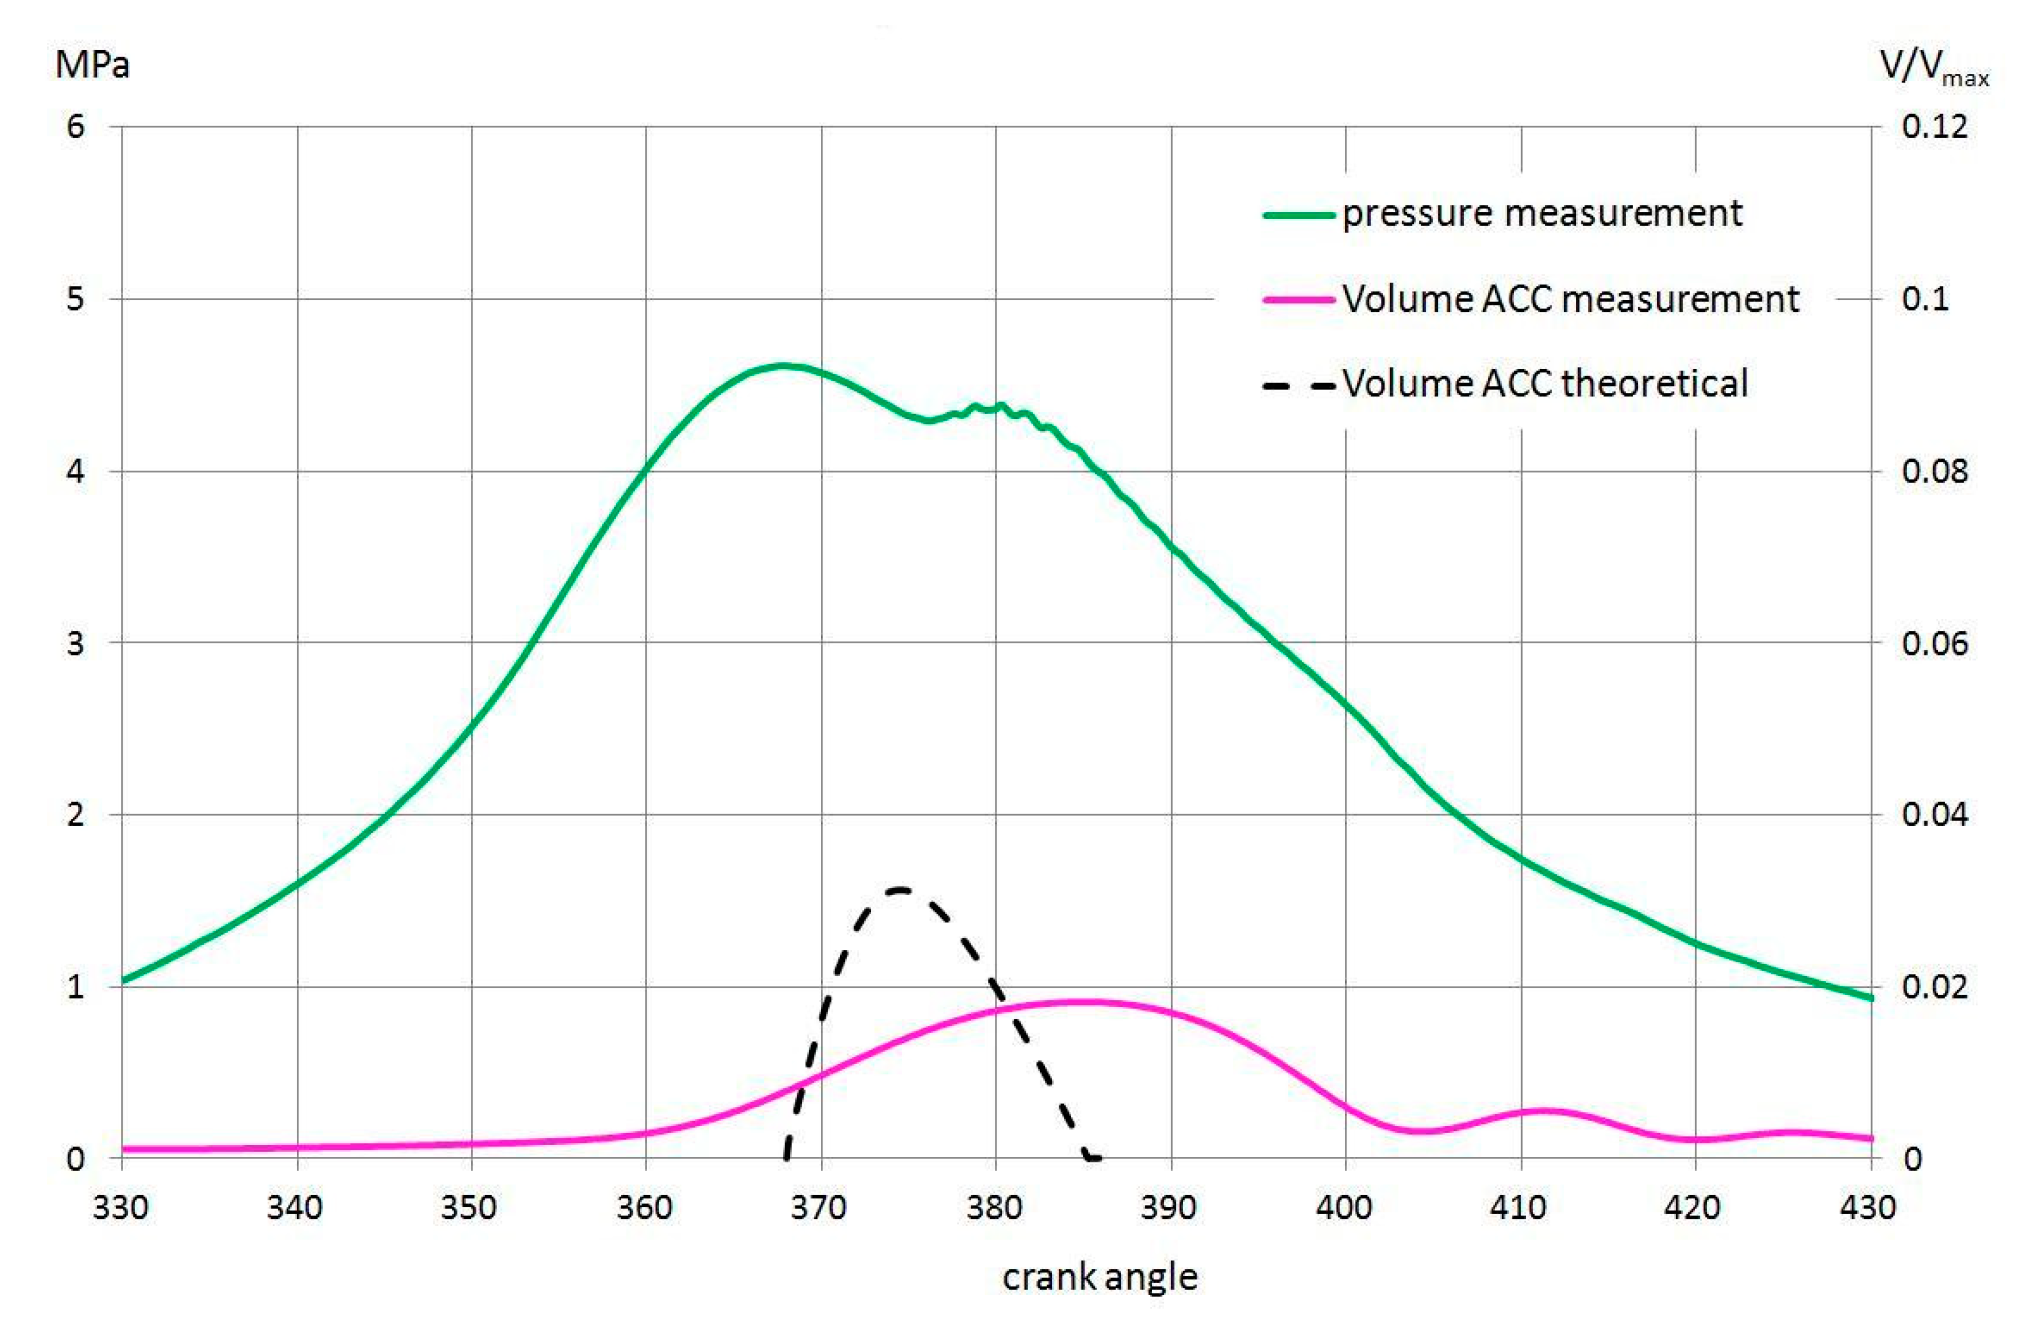
Figure 14 will be a direct reference for the other two from
Figure 15 and
Figure 16, which were created for a similar load, but the effect of ACC operation is visible because the change was caused by reducing the supply pressure of the tank in the system, i.e., the parameters of the symbolic spring from
Figure 13 to the values of 11 bar and 10 bar. In this way, the compression ratio was reduced to cr = 16.3∶1
Figure 15 and cr = 15.8∶1
Figure 16, by modifying the pressure course, and thus also the temperature course after TDC.
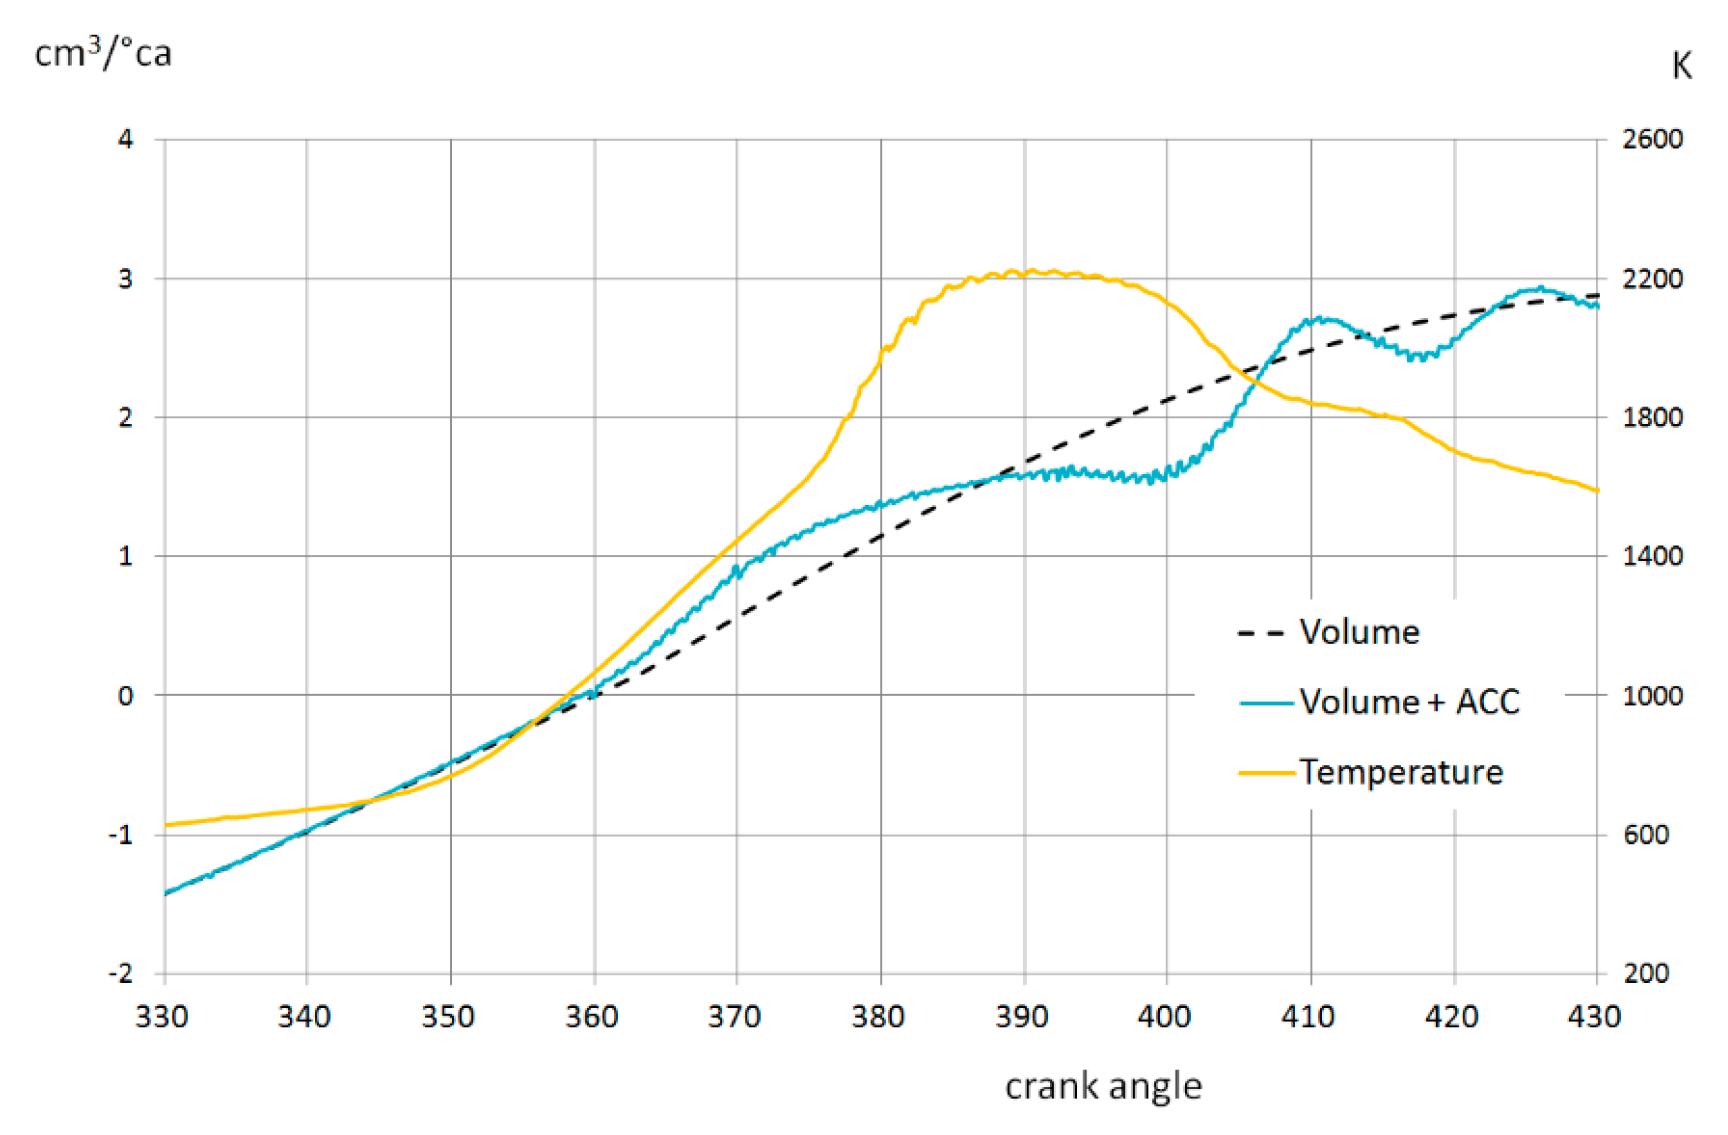
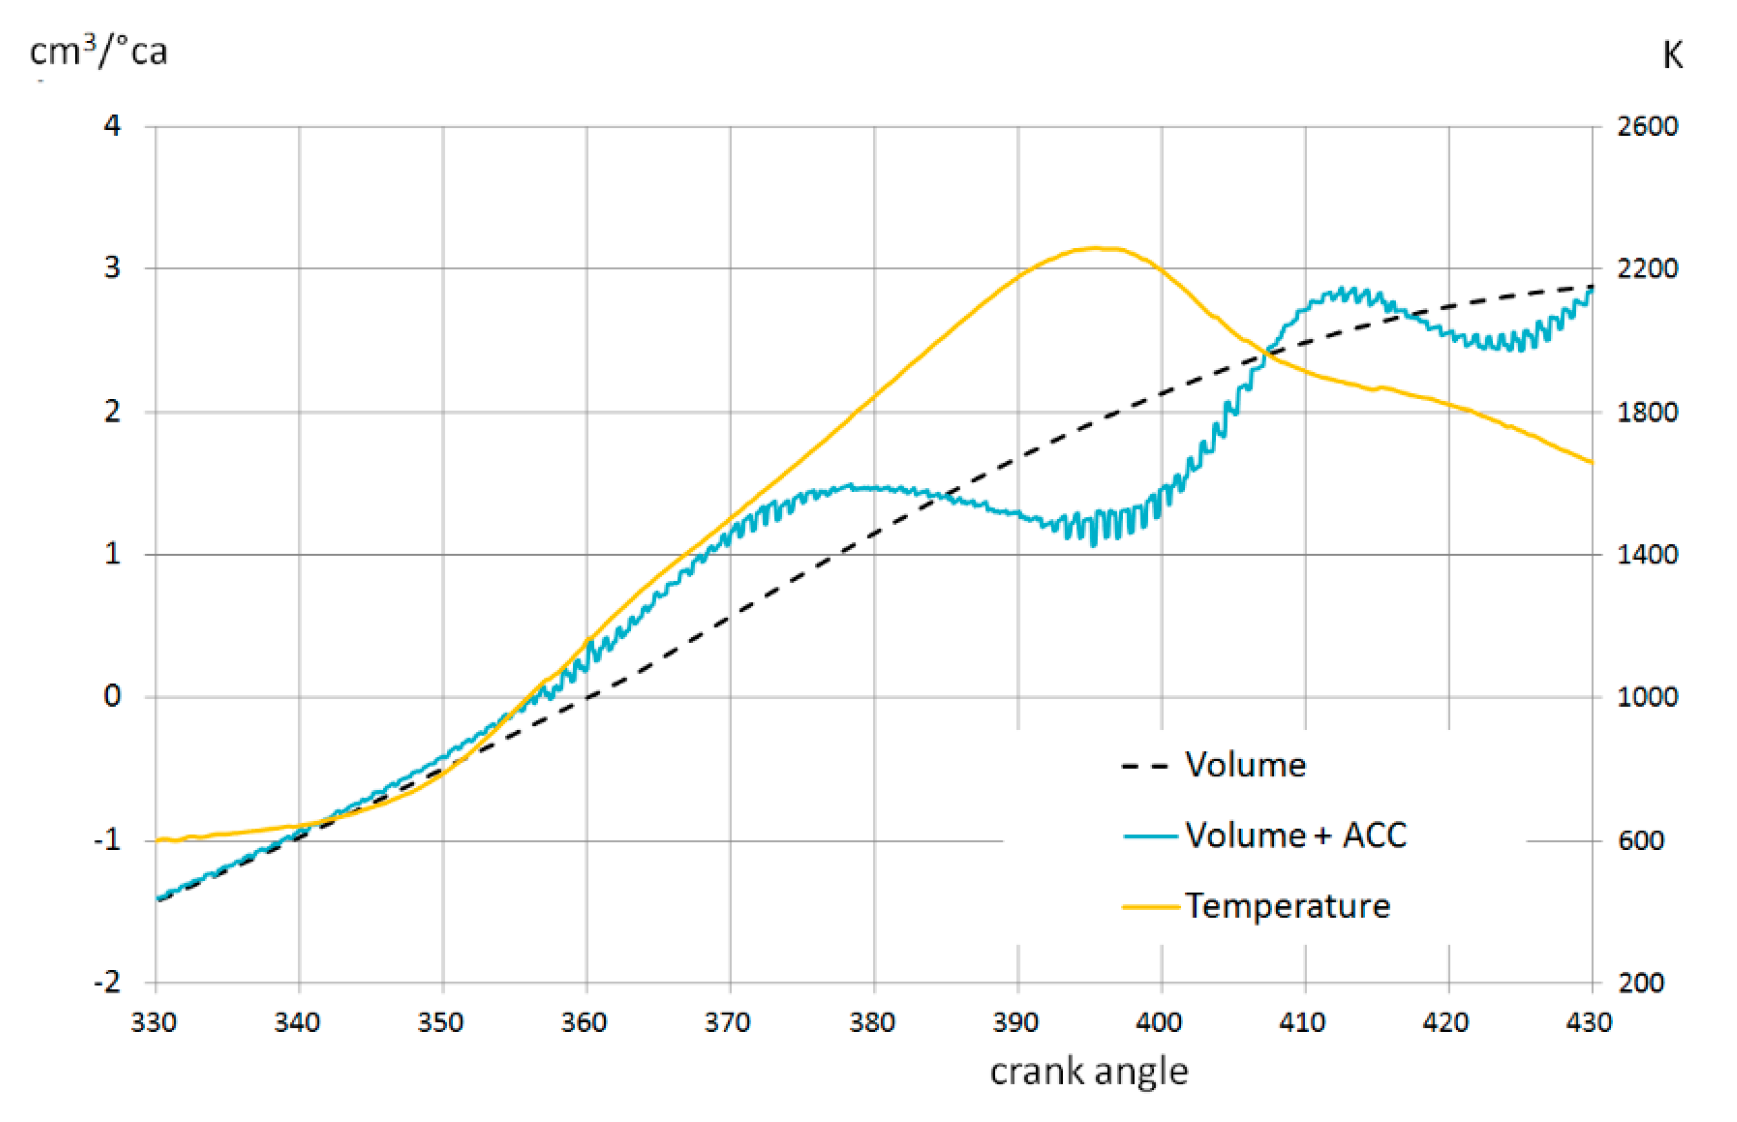
The presented graphs
Figure 15 and
Figure 16 show some delay in the change of the maximum volume between the real ACC system (pink line) and the theoretically determined system (black dashed line), although it should be noted that the phase consistency is quite good for the arbitrary adoption of the values contained in
Table 1. In a real ACC engine we deal with faster work and which slows down the combustion reaction and causes its extension, which, as it turns out, will not prevent the temperature from being kept at a constant level much lower than in theoretical considerations. On the basis of the averaged measurements of the indicated pressure and the total change in the volume of the crank-piston system with the ACC system presented in
Figure 14,
Figure 15 and
Figure 16, the temperature course in the ACC engine was reconstructed using the equations from [
17]. In presenting the results of this simulation, the derivatives of these changes were used instead of changes in the total volume, which were relatively small. This treatment was aimed at sharpening the areas where the influence of the ACC system was most visible.
When assessing the values of the maximum temperature from the graphs in
Figure 17,
Figure 18 and
Figure 19 in the vicinity, we can see that the minimum is present in
Figure 18. This is the most important evidence obtained from the empirical studies, from which directly follows that temperature regulation. It is also obvious that the make-up system must be tuned to a single cycle in the cylinder of the ACC engine in order to properly regulate the maximum temperature. In order to finally confirm the simulation results, the last photoelectric measurements were carried out using a quartz sight glass, behind which a phototransistor was placed to measure the radiation intensity in the combustion chamber and confirm the quality of the simulation based on empirical results. The results of this measurement, combined with the course of the indicated pressure are presented in
Figure 20 and can be considered as fully fledged empirical evidence. Above statement confirm the fact that for properly set parameters of the engine and the ACC system, it is possible to maintain the maximum temperature at a certain level, e.g., close to a constant level. This takes place in the second part of the combustion of the air-fuel mixture in a spark-ignition internal combustion engine and is consistent with the analysis performed.
It should be added that the photoelectric tests conducted were not used to determine a specific value of the maximum temperature, but to show its curve during the combustion process, in the aforementioned verification of the simulation model, because the model showed a clear shift of the temperature maximum in the ACC engine compared to those reported in the literature [
7,
8,
9,
10]. Comparing the simulation curve in
Figure 20 with the curve of the radiation intensity change in
Figure 20, it can be concluded that the simulation model reproducing the temperature from real measurements is correct, and most importantly, phase and characterologically compatible with the photoelectric measurement, which confirms the control concept using the ACC system. The use of a compression ratio above 14:1 in the theoretical analysis may also raise objections, due to the possibility of exceeding the so-called GI in the real engine, self-ignition temperature around TDC point, and inducing detonation combustion. However, the actual engine, as shown in the example of the ACC engine, will require significantly higher values of the ignition advance angle, by at least 5 ca to 15 ca compared to the typical values, which in turn, combined with the very fast response of the ACC system, completely prevents this phenomenon from occurring. An additional situation is improved by the very intense flow of the combustible mixture forced by the additional piston from the ACC system, which eliminates the areas favorable for detonation at full load. During the research conducted, it was always possible to “approach the limit of the detonation”, while avoiding it. For this purpose, a “fine-tuning” effect was used, the control of the supply volume and pressure in the ACC system. It should be added that the Vibe functions were selected due to their frequent use in zero-dimensional models, but in engines equipped with mechanical oscillators (ACC motor), these should undergo additional modifications as the intervention of the ACC system increases. In summary, lowering the combustion temperature while maintaining or increasing the overall efficiency of the engine is possible only by, for example, using mechanical oscillators whose task is a specific manipulation of additional volumetric work in the cycle. This method may in the future lead to the return of the concept of quasi-adiabatic engines, and even engines implementing a cascade of several thermodynamic cycles, increasing the scale of Carnotization. It would be interesting to conduct an analysis on an even more basic level, such as in [
14,
15,
16]. In general, obtaining a certain maximum temperature using the combined kinematics of the crank-piston and the complementary system is theoretically entirely possible, as indicated by the conducted analysis. Unfortunately, the analysis also reveals the following fact, namely that each change in rotational speed requires different kinematics from the complementary system, as shown in
Figure 8,
Figure 9 and
Figure 10. A similar situation takes place when the load changes, as shown by the empirical results in
Figure 17,
Figure 18,
Figure 19 and
Figure 20, and although this case was not considered in the analysis, assuming the maximum (rated) load in advance, its changes should also be taken into account in a broader context.
The conclusion to use the Fourier series to decompose the kinematics of the complementary system into it has a specific purpose. This goal is to identify technical devices that can replace it and reveal physical limitations, related to the masses and frequencies of these devices, for example, on the basis of which it is possible to predefine the geometric dimensions enabling installation in the engine. For these reasons, among others, the number of five words was used, which was considered adequate for the problem under consideration. Moreover, this series can also be optimized by additionally reducing the number of words, for example to three, maintaining a high correlation coefficient. The main assumption in the theoretical considerations was that the functions describing the combustion processes are continuous: therefore, the Vibe function was selected as very good material with which to modify the theoretical cycle.
Although the considerations completely omit the heat transfer and the influence of the additional system on the Vibe combustion function itself, it does not matter for the analysis itself: when the conditions for the continuity of the function and the assumptions of the analysis are met, the issues mentioned also describe continuous functions. What is worth emphasizing in the empirical results is that continuity was inherently maintained despite the interference of the ACC system, and this can be seen in the graphs from
Figure 18,
Figure 19 and
Figure 20. The use of mechanical oscillators as equivalents of Fourier series terms made sense, as shown in the graphs in
Figure 12,
Figure 13 and
Figure 14. On that basis, it could be assumed that a real engine working according to the proposed cycle would always have a lower maximum temperature while maintaining similar or increased efficiency compared to a typical engine with a constant, much lower compression ratio. This is due to the distribution of the supply of the second portion of heat Q2 in a more even, and thus more advantageous way because it enables the use of a significantly higher compression ratio of the main parameter responsible for efficiency. Additionally, taking into account the fact that some of the energy is lost by the complementary system outside the cylinder, one should always expect a lower temperature in the actual engine. The aforementioned ACC engine, presented schematically in
Figure 18, is one of the first examples of this type that to a large extent implements the theoretical concept, which clearly confirms the correctness of the assumptions made.
Figure 18,
Figure 19 and
Figure 20 show a clear correlation between the theoretical and real charts. On this basis, it can be concluded that the concept of controlling the maximum temperature in the internal combustion engine as proposed, using one or more mechanical oscillators, is technically feasible. Importantly, the use of even one nonlinear oscillator with pneumatic support gives measurable results, provided that its parameters are properly selected [
40,
41]. It is very important not to forget that the oscillator influence process consists of two main phases, the accumulation phase, and the energy recuperation phase. For example, in an ACC motor, energy is returned to the motor, and this must in turn be efficient. At this point, the authors propose that this criterion should be the value of the efficiency of the theoretical cycle [
1], which is implemented by the real engine. This should be understood more generally as follows, that the lowest efficiency of the energy transformation performed by mechanical oscillators, for example. In order to obtain a maximum temperature of a specific value in real engines, first of all, it is necessary to indicate the place of change in the volume of the complementary system and to determine experimentally its minimum value.
Based on the theoretical considerations, it can be done only initially, while on the basis of empirical studies, the required volume changes at full load can be quantified and located in a specific place in the engine cycle. According to preliminary studies for the ACC engine, the maximum volume changes are not that large, as they constitute about 15% of the swept volume and approximately occur in places coinciding with the theoretical analysis in which the Vibe function was used. This can be seen especially in
Figure 19, where the highest compliance occurs at the PAE supply pressure of 11 bar. The graphs with lower pressures in
Figure 20 are no longer so consistent, which in turn can be directly explained, before the early or too late reaction of the ACC system, especially for the recuperation phase [
42,
43].
The use of a compression ratio above 14:1 in the theoretical analysis may also raise objections, due to the possibility of exceeding the so-called GI in the real engine self-ignition temperature around the TDC point and inducing detonation combustion. However, the actual engine, as shown in the example of the ACC engine, will require significantly higher values of the ignition advance angle, by at least 5 ca to 15 ca compared to the typical values, which in turn, combined with the very fast response of the ACC system, completely prevents this phenomenon from occurring. An additional situation is improved by the very intense flow of the combustible mixture forced by the additional piston from the ACC system, which eliminates the areas favorable for detonation at full load. During the research conducted, it was always possible to “approach the limit of the detonation”, while avoiding it. For this purpose, the “fine-tuning” effect was used, meaning the control of the supply volume and pressure in the ACC system. It should be added that the Vibe functions were selected due to its frequent use in zero-dimensional models, but in engines equipped with mechanical oscillators (ACC motor) it should undergo additional modifications as the intervention of the ACC system increases.
Summarizing, lowering the combustion temperature while maintaining or increasing the overall efficiency of the engine is possible only by increasing the degree of Carnotization of the engine cycle, by using mechanical oscillators whose task is a specific manipulation of additional volumetric work in the cycle [
44,
45,
46]. This method may in the future lead to the return of the concept of quasi-adiabatic engines, and even engines implementing a cascade of several thermodynamic cycles, increasing the scale of Carnotization. It would be interesting to conduct an analysis at an even more basic level, such as in [
14,
15,
16].
5. Conclusions
The general conclusion is that obtaining a certain maximum temperature using the combined kinematics of the crank-piston and the complementary system is theoretically completely possible, as shown by the analysis carried out. Unfortunately, the analysis also reveals the following fact, namely that each change in rotational speed requires different kinematics from the complementary system, as shown in
Figure 7,
Figure 8 and
Figure 9. Thus, it obviously eliminates constant kinematic systems. The conclusion to use the Fourier series to decompose the kinematics of the complementary system into its terms has a specific purpose. This goal was to identify technical devices that could replace it and to reveal physical limitations, e.g., related to the masses and frequencies of these devices. On this basis, it is possible to predefine, for example, geometric dimensions that enable installation in an internal combustion engine. Among other things, for these reasons, the number of only five terms of the Fourier series was used, which was considered adequate to the problem under consideration. The rest of the series can also be optimized by further reducing the number of words, e.g., to three while maintaining a high correlation coefficient, or in extreme cases to one word, which is the case in the ACC engine. The main assumption in theoretical considerations was that the functions describing the combustion processes are continuous, therefore the Vibe function was selected as very good material to modify the theoretical cycle. Although the considerations completely omit the heat transfer, which is very approximate for the ACC engine at the moment, and the influence of the additional system on the Vibe combustion function, it is of no great importance for the analysis itself—when the conditions of the function continuity are met. What is worth emphasizing in the empirical results, the continuity is inherently preserved despite the interference of the ACC system, and this can be seen in the graphs from
Figure 14,
Figure 15 and
Figure 16. On this basis, it should be assumed that similar results would be obtained by functions taking into account heat transfer or the mentioned alternative kinematic systems. Therefore, the use of mechanical oscillators as equivalents of the terms of the Fourier series makes sense. Based on
Figure 14,
Figure 15 and
Figure 16, it could be assumed that the real engine operating according to the proposed cycle will always have a lower maximum temperature while maintaining a similar or increased efficiency compared to a typical engine by constant significantly lower compression ratio. This is due to the distribution of the supply of the second portion of heat Q2 in a more even manner, allowing the use of a significantly higher compression ratio of the main parameter responsible for efficiency. Taking into account the fact that some of the energy is lost by the complementary system outside the cylinder, you should expect an even lower temperature in the actual engine. The aforementioned ACC engine, presented schematically in
Figure 13, is one of the first examples of this type that to a large extent implements the theoretical concept, which clearly confirms the correctness of the assumptions made.
Moreover, in
Figure 18 and
Figure 19, resulting from the combination of empirical results and simulations, we observed trends in the course of the maximum temperature. In turn, the graph from
Figure 20 can be considered as the final proof that the temperature could be kept at a constant level during the second part of the combustion process. On this basis, it can be concluded that the concept of controlling the maximum temperature in the internal combustion engine as proposed, i.e., using one or more mechanical oscillators, is technically feasible. In the case of oscillators, it is important not to forget that the process of their influence consists of two basic phases, i.e., the accumulation phase and the energy recuperation phase, and this in turn must be done with appropriate efficiency. At this point, the authors propose that this criterion should be the value of the efficiency of the theoretical cycle [
27], which is implemented by the real engine. The general conclusion that can be drawn from the analysis regarding the temperature is to obtain the maximum temperature of a specific value in real engines. First of all, the place of the change in the volume of the complementary system should be indicated, as it was done in the analysis. Then, determine the minimum possible value by means of an experiment, e.g., following the NOx emission because, based on the theoretical considerations, it can only be done initially. According to preliminary studies for the ACC engine with 17.1:1 cr, the maximum volume changes constitute about 15% of the swept volume and approximately occur in places coinciding with the theoretical analysis in which the Vibe function was used. This can be seen especially in
Figure 15, where the highest compliance is achieved at the PAE feed pressure of 11 bar and 1500 rpm. The graphs with lower pressures,
Figure 15, are no longer so consistent, which in turn can be directly explained before the early or too late reaction of the ACC system, especially for the recuperation phase.
Summarizing, lowering the combustion temperature while maintaining or increasing the overall efficiency of the engine is possible only by increasing the degree of Carnotization of the engine cycle, which may occur when we use mechanical oscillators of the first high compression ratio. Several thermodynamic cycles increasing the scale of Carnotization. It would be interesting to carry out an analysis on an even more basic level, such as in [
5,
6,
7]. Therefore, it can be concluded that the concept of maximum temperature control in the internal combustion engine in the proposed one, i.e., using one or more mechanical oscillators is technically achievable. What is important—the use of even one nonlinear oscillator with pneumatic support gives measurable results, provided that its parameters are properly selected.


 ,
, 


