Abstract
The article was motivated by the design of adaptive control algorithms for the control of a a fixed wing unmanned aerial vehicle (UAV). An adaptive system is a system that, with its structure or parameters, adapts to changes in the behavior of the object and based on the knowledge of variable properties, maintains the quality of its regulatory transition. The knowledge gained on this small UAV can be applied to larger aircraft. The creation of the proposed adaptive control into the UAV consisted of the creation of a simulation model of the aircraft based on known physical laws, the properties of the aircraft and a mathematical description. An adaptive PID controller for stabilization with changing coefficients based on the airspeed of the aircraft was designed and simulated. A validated control of the mathematical model of an unmanned aircraft was designed and simulated using the methods of estimation and identification of the UAV model parameter based on measured data from flight tests. Identifying dynamic parameters is a challenging task due to several factors, such as random vibration noise, interference, and sensor measurement uncertainty. The designed adaptive UAV control provides very promising results in improving the controllability of the aircraft while reducing the effect of speed changes on the stability and controllability of the system compared to the conventional PID controller. The comparison was performed on three selected types of PID controllers. The first type had fixed coefficients for the entire range of speeds calculated using the Control toolbox in MatLab. The second type also had constant coefficients over the entire range of speeds calculated using the Naslin method. The third adaptive type of PID controller had variable coefficients based on approximate polynomials dependent on the change in flight speed. The reason for the comparison was to show an increase in margin of stability using the method of variable coefficients of the PID controller based on the change of flight speeds. The obtained results show that the proposed adaptive control algorithm is robust enough to control the movement of the aircraft in the longitudinal plane and due to the introduced process and measurement errors, while the used Kalman filter effectively eliminates these errors.
1. Introduction
At present, aircraft are equipped with various systems for flight automation, their main tasks being to alleviate the load on the aircraft crew, increase safety, comfort, and flight economy. Aircraft flight control is a closed-loop human-aircraft process or an automatic-aircraft control system. The task of suppressing unwanted oscillating movement of the aircraft is transferred to assistance systems that can work simultaneously with the pilot. These systems affect the rudder deflection, which is set by the pilot based on the measured angular velocities of the aircraft around the center of gravity. PID control methods, robust control and progressive fuzzy logic methods are currently used for aircraft control. When applying robust controllers for aircraft control systems, relatively widespread methods of and —synthesis are used. A useful publication in the field of robust management is [1]. The feedback system is robust if its basic qualitative properties such as stability, quality of regulation under the influence of various faults are maintained. When there are changes in the parameters of the object, we need to use adaptive control. The theory of robust control of dynamic systems develops methods for the analysis of robust properties of real objects and proposes controllers that ensure the robustness of the feedback system. The peculiarity of this control theory of dynamical systems is that modelling, analysis of object properties, as well as synthesis of the controller is performed using an incomplete and inaccurate mathematical description of the controlled process [2]. In the past, PID controllers have been used in autopilots from simple control laws to advanced control systems, which are currently being developed into structures with variable coefficients according to flight conditions. In practice, this problem is solved by designing several controllers for linearized models at different operating points, the controllers are subsequently switched according to the current state variables, method (Gain scheduling) [3]. This process of changing the properties of the controller is called adaptation, by which we mean the process of automatic tuning of PID controllers depending on a certain parameter. This automatic tuning can be performed at the request of the operator or automatically when the parameter is changed. Although Gain scheduling is often used in aviation, it also has its disadvantages, which are manifested when the change of the adaptation parameter is significantly fast. The calculation of the PID controller coefficients itself can be a relatively lengthy process in terms of computational time. If the value of the adaptation parameter changes more than once during this process, the quality of the control may decrease [4].
During the design phase of a suitable control system for a fixed wing unmanned aerial vehicle (UAV), it was necessary to create a mathematical-simulation model that served as a test platform for the proposed control algorithms to assess the impact of these algorithms on the properties of the controlled object. The development of a mathematical-simulation model was based on physical quantities obtained during experimental flights and by measuring its aerodynamic and mechanical properties. The created mathematical-simulation model had to meet the specified conditions for accuracy and reliability of simulated quantities with a comparison of quantities obtained by measurements during experimental flights. An approach known as the “six degrees of freedom” (6DOF) was used to create a mathematical-simulation model, which is now widely used in practice. This model serves as a simulation and test platform for developed flight control and stabilization systems. Simulation testing has several advantages, which include mainly low experimental costs, repeatability, and testing critical conditions in which there is no danger. The disadvantage of simulations is their limited the number of processed quantities and inputs, which results in differences between simulated ones and real measured waveforms. Specifically in-flight simulations, the simulation algorithm does not count with environmental changes. Also entered parameters obtained by measurement, calculation or other simulations may not be highly accurate and thus, deviations from the actual state occur in flight simulations. To reduce these and more errors of the simulation model, it is necessary to create the most accurate model of the investigated object (aircraft). It is ensured by entering the most accurate coefficients into the model airplane [5]. The implementation of the mathematical-simulation model was performed in the MatLab/Simulink environment. In the next stage, a control system was created, the task of which was to stabilize the angular velocities of the aircraft. The adaptive control algorithm was designed and tested on the created simulation model longitudinal motion of airplane, verification of the operation to control and stabilize the angular velocity of angle of longitudinal inclination was realized using the simulation model of longitudinal motion [6]. After the design, testing and tuning stage, a comparison of the dynamic properties of the proposed adaptive control algorithm with a simple type of PID controller was performed. The use of a steering assistance system, where a controller is used, whose task is to control angular velocities based on the requirements of the pilot, eliminates the effort and necessary experience of the pilot. Such a control system eliminates the influence of flight parameters on the control because the rudder deflection and angular velocity are no longer directly controlled by the parameter and measured by gyroscopic sensors. Similar systems exist in practice and are described in [7].
In 2008, Leong [5] implemented a nonlinear 6-DOF model for the Yak-54 RC aircraft using the Aerospace Blockset. Advanced Airplane Analysis (AAA) software was used to obtain aerodynamic derivatives. The dynamics of the actuator was modelled by a first-order system. Engine dynamics have been simplified by using a first order time delay. The contact force was calculated based on the dynamic characteristics of the propeller, which were estimated using a computer program called JavaProp.
In 2015, Kamal [8] presented the process of compiling a detailed nonlinear 6-DOF model DOF for a small Tiger-Trainer RC aircraft. The propulsion model with propeller characteristics was investigated based on experimental results of wind tunnel tests, the dynamics of the engine and its servomotor were identified as a first-order model. The complete aircraft simulation model was compiled in the MatLab/Simulink environment, the procedure of tuning the model parameters was carried out using aircraft system identification techniques.
In his work in 2014, Hoffer [9] used system identification using recursive least squares methods with online filtering error as an alternative to analytical methods and wind tunnel testing of a small low-cost fixed-wing UAV. The author analyzed his identification method on UAV systems using MEMS sensors and GPS and their error signals.
In his 2009 work [6] Bazezit determined the stability coefficients of the UAV Trainer60 aircraft model using Tornado software, identified the moments of inertial forces using a special design of pendulum systems. Designed PID controllers for the internal and external loops of the Trainer60 model were simulated for modified modes in the Hardware-in-the-Loop simulator. To achieve accurate low altitude evaluation, an ultrasonic and laser UAV landing meter was used in an urban environment.
In his contribution [10] Al-Mashhadani presented in 2019 an optimal estimation and state estimation approach for controlling UAV parameters under the conditions of random vibration noise and uncertainty. The results showed that to minimize the failure rate of UAVs, the optimal estimation approach for nonlinear parameters should be used rather than a linear deterministic model.
In a 2015 paper Ravi Kumar [11] proved a model for controlling the inclination, tilt and lateral slip of an aircraft using an LQR controller and an LQG controller. The simulation and analysis results showed that the LQR controller gave relatively better performance. The LQG controller achieved very good results with the output of a device with a limited constant shift error, and the Kalman filter was the optimal estimator when working with Gaussian white noise.
Based on [12,13,14] it can be stated that a PID, LFC or LRQ controller can be used to increase the stabilization of the longitudinal inclination angle. The use of one of the controller types will increase the overall stability of the UAV and reduce its susceptibility to noise that may occur in the control process. The system’s response to the required change is shortened and unwanted oscillations are also eliminated. According to [8], in the process of estimating the optimal state of the system, it is also necessary to consider random vibrations caused either by the UAV engine or by external influences, among which the crosswind can be included.
For the needs of simulation of the selected aircraft, we must know its physical properties and be able to describe them mathematically. These are converted into simulation schemes in the form of equations and mathematical operations, the outputs of which correspond to the behavior of the real object. We will use the required rudder deflection as the input variable. The output variable will be the angular velocity of the longitudinal inclination of the aircraft. The creation of an aircraft simulation model is described in the literature [5,8,10]. During the flight, several different types of forces act on the aircraft, the interaction of which affects the movement and position of the aircraft in space: the lift, thrust, aerodynamic drag and weight. These forces are calculated based on the various characteristics of the aircraft. In the case of a small unmanned aircraft, the mass is constant during the flight and the change in gravitational acceleration due to the change in altitude is negligible. Equation (1) describes the dynamic system described by the UAV mathematical model without the influence of interfering signals with the moment of inertia included for the longitudinal movement:
where:
The introduced constants of the transfer function have the form:
where is the rudder deflection angle, is the angle of longitudinal inclination, is the moment coefficients of all forces acting per plane equal to , is the auxiliary coefficient, is the delay time constant, is the lift, is the engine thrust, is the angle of attack, is the gravitational acceleration, is the aerodynamic angle of longitudinal inclination, is the speed of flight, is the engine control lever deflection, is the zero angle of attack, is the wing area, is the air density, is the moment of inertia in the Z axis, is the inclination moment of aerodynamic forces, is the mean length of the aerodynamic chord of the wing. The kinematic relationship between the angles is:
The characteristic equation of the longitudinal inclination of an aircraft usually has two pairs of complexly associated roots, their real parts are usually negative. It is clear from the transfer function that in relation to the longitudinal inclination, the behavior of the aircraft is expressed by the combination of the frequency, proportional derivative, and integration term. Due to the angle of attack, when the rudder is deflected, the aircraft behaves as an oscillating member with its own frequency and damping coefficient . Figure 1 shows angles and basic coordinate systems used in longitudinal motion of UAV.

Figure 1.
Longitudinal movement of the aircraft.
The basic coordinate systems describing the movement of the aircraft include the body frame (index b), aerodynamic (index a) and earth (index e) coordinate system. The aerodynamic coordinate system represented by the X axis with the designation Xa is chosen as the basic coordinate system. The angle between the axis of the aerodynamic and body frame coordinate systems is defined as the angle of attack . The angle between the axis of the aerodynamic and earth coordinate systems is defined as the aerodynamic angle of longitudinal inclination of the airplane . Between the body frame and earth coordinate system, we can detect the angular velocity of the longitudinal inclination of the aircraft.
The UAV management system is based on micro-electro-mechanical systems (MEMS) used for UAV guidance without pilot assistance, consisting of hardware supported by software. The UAV autopilot can navigate the UAV along a reference route or through waypoints. More powerful autopilot systems can control UAVs at every stage of the flight, such as take-off, climb, flight, descent, and landing. Figure 2 shows basic UAV flight control scheme.
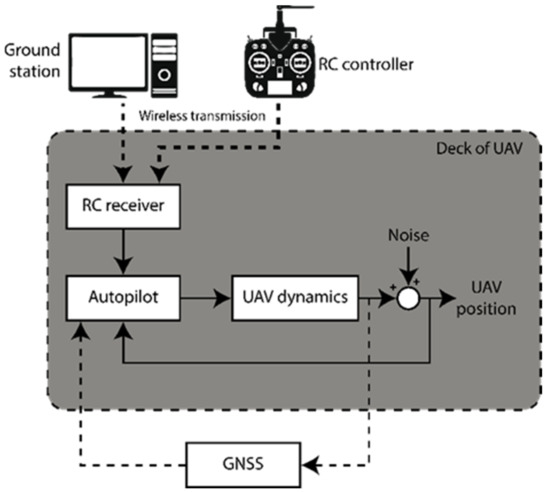
Figure 2.
UAV flight control system.
The UAV autopilot is a closed loop control system consisting of two parts. The first is the observation part, which is represented by an inertial measurement unit (IMU) containing the sensors needed to determine the position of the UAV. The second part of closed loop control system is state estimate part, where the sensor data along with the GPS position information is passed to a filter to make an estimate of the current state, which is needed for later use in driving. This closed-loop system can be presented using the block diagram in Figure 3 [15,16,17].
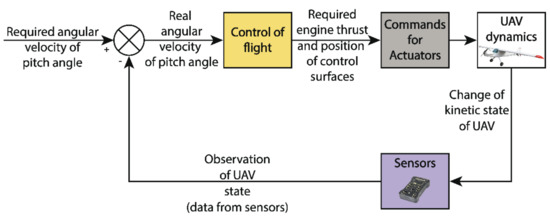
Figure 3.
Block diagram of the UAV control loop.
Primary stabilization performed by an inner loop. The outer loop performs the activity associated with maneuvering and navigating the UAV. The outer loop is also responsible for capturing waypoints. To perform a fully automated UAV flight, it is necessary to use an autopilot that will control this flight. For its proper functionality, the autopilot needs to know the current position of the UAV in space. To determine this position, it is appropriate to use an inertial navigation system (INS), which also includes calculations and corrections. The basic element of every INS is an inertial measurement unit, called IMU. The IMUs have a compact size that allows mounting in a small UAV, but the MEMS-based sensors installed in the IMU do not have such high accuracy. Therefore, further processing of the measured IMU data and correction of the noise entered in the measurement is necessary. The accuracy of the inertial sensors plays a key role in autonomous navigation. The errors of current inertial sensors are approximately 0.01°/h for angular velocity sensors and 100 μg for acceleration sensors. These errors integrate in time and cause a positioning error, which is expressed by the measurement uncertainty per hour, for modern IMU this error is approximately 2 km/h. The measured data from angular velocity sensors represent the vector of angular velocity of navigated object to the inertial coordinate system indicated by the index and measured in the individual axes of the Cartesian coordinate system of object navigation indicated by the index b:
Angular velocities are transformed between the inertial and body frame coordinate systems (subscript ib) with a final transformation into the body frame coordinate system (superscript b).
By mathematically adjusting and integrating angular velocities, we get information about the angular position of the object’s navigation relative to the reference system, such as, tilt, and slope. The data measured by a three-way accelerometer represent a vector of a specific force, resp. vector of acceleration measured in the axes of navigation of the object:
The ability of the algorithm to determine changes in navigation parameters with the required accuracy in a vibrating environment is a critical factor in determining the navigation parameters (angular position) while maintaining the required high accuracy. The source of errors in each IMU sensor can be modelled to create a sensor model. To be able to estimate any significant sources of error whose value cannot be measured, calculated or otherwise determined, parameters describing the behavior of the errors must be included in the sensor model. In practice, simplified error models of inertial sensors are most often used. The simplified error model of the uniaxial angular velocity sensor assumes that the measurable sensor output (in the x, y or z axis) consists of the actual angular velocity , deterministic bias , bias-drift (randomly fluctuating bias is often referred to only as drift) and broadband noise sensor [18].
The paper deals with the creation of a model with an adaptive PID controller, which adjusts its coefficients based on a change in the speed of the UAV and thus increases the stock of stability. A Kalman filter is also created, which by its estimation eliminates interfering influences from the output signals and thus increases the overall stability of the UAV.
2. Materials and Methods
The Department of Avionics, Faculty of Aviation, Technical University in Košice has a “SkyDog” fixed wing unmanned aerial vehicle, which is mostly used for recreational and sport model flying. Figure 4 shows UAV “SkyDog”. The aircraft is remotely controlled by a pilot from the ground using a walkie-talkie. Its control and flight mechanics correspond to large crew aircraft and is therefore suitable for conducting experiments in the field of autonomous aircraft control. It is assumed that the measured results and the proposed systems may be applicable in practice on large commercial aircraft. The “SkyDog” UAV has a wingspan of 2 m and its take-off weight is approximately 8 kg. These parameters allow him to carry a wide range of measuring equipment or small experimental equipment.
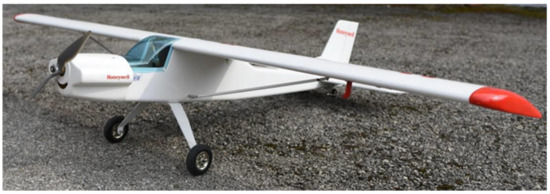
Figure 4.
“SkyDog” fixed wing UAV.
Based on the knowledge of the equations of motion, it is necessary to determine the aerodynamic coefficients for the given type of UAV. The XFLR5 simulation program was used to determine the aerodynamic coefficients of the “SkyDog” UAV. To design systems for this aircraft, it is necessary to mathematically identify the system. In our case, we will consider the movement of the “SkyDog” UAV in the longitudinal plane under the term system. A 6DoF “SkyDog” UAV model will be used for identification. By system identification we mean the search for the relevant transfer function, which most accurately describes the movement of the aircraft in the longitudinal plane. For the possibility of further simulation, it is also necessary to consider action interventions on the control surfaces of the aircraft. In our case, the action intervention is converted by actuators, which convert the electrical signal into an action variable. The action variable is the angle of deflection of the control surface and the actuator is the servo that performs this movement. By obtaining the transfer functions of the actuator and the aircraft itself, it is possible to calculate the PID controller coefficients for the system. Figure 5 shows a control block diagram with a PID controller.

Figure 5.
Block diagram of PID controller.
The coefficients of the regulators were calculated by using the Control toolbox in the MatLabprogram. It is characterized by the short rise time and relatively low overshoots. The mathematical form of the PID controller has the form:
The values of the PID controller coefficients depend on the coefficients of the system transfer function. The transfer function of the actuator is unchanged unless we consider a system failure or change in its properties. The transfer function of the aircraft changes with respect to the current flight speed and the current altitude. In our case, the effect of height is negligible, as we consider a small UAV, whose access is in the tens of meters. However, the effect of speed is considerable because the range of speeds at which the aircraft can perform its flight is in the range of approximately 50 to 150 km/h. If we want to maintain the quality of control in the entire operating range of aircraft speeds and thus increase the overall stability of the system during the entire flight, it is necessary to use one of the methods of adapting the controller to a variable parameter, which in this case it is airspeed [19,20].
To design an optimal “SkyDog” UAV motion control process, model blocks such as the PID controller, actuator transfer function and airplane transfer function need to be integrated into a single transfer function block. Model feedback must also be included in this block. The feedback transfer function has following form:
The Kalman filter is used to estimate the state variables of the system for a given measurement of the output signals of the system containing the measured noise. Figure 6 shows a block diagram of the Kalman filter connection.
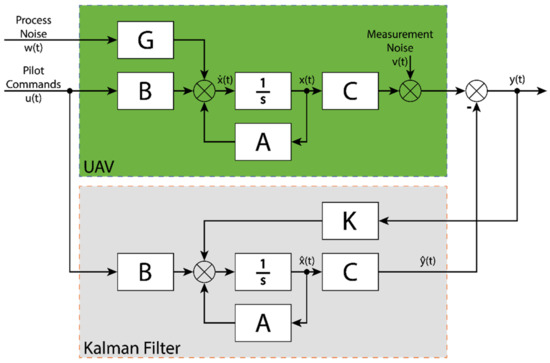
Figure 6.
Block diagram of Kalman filter.
The filter estimation is optimal in the sense that the sum of the errors of the estimated state variables at any time has the smallest possible value. We consider the difference between the estimate processed by the filter and the actual value of the system state variable to be an estimation error. Thus, the Kalman filter is used for the best determination of variables, in other words the optimal suppression of the measured noise. When estimating the state vector, we start from the equations characterizing the discrete state space. The considered n-dimensional Gaussian white noise has a mean value equal to zero. It is necessary to perform an IMU analysis installed in the UAV, as its sensors introduce errors into the measurement process. These errors can cause a decrease in the stability and manageability of the UAV. In terms of sensor error analysis, Allan variance method is one of the basic tools for analysis. Its use is determined by the IEEE standard [21], which defines not only the application of this tool, but also the procedure of analysis of results. The result is the representation of noise in the output of the IMU inertial sensors in terms of long-term development introduced into the UAV control.
Figure 7 shows the types of noise that can be identified from the Allan variation graph.
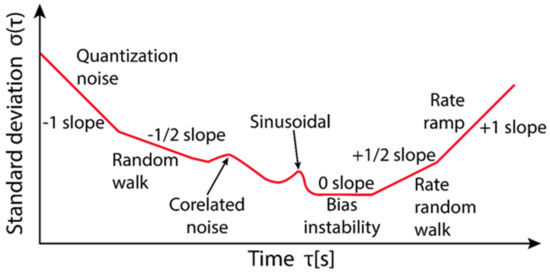
Figure 7.
Identification of noises from the Allan variation graph.
Process noise is created by disturbances that act on the UAV during flight and landing, these are moments caused by horizontal and vertical air flow. The action of the wind causes a change in the modulus of the airspeed vector, the angle of attack, the tilt angle, and the tilt speed. Another component of the process failure is the pilot himself in the control of the UAV as a member of the control complex. The pilot’s sensory organs perform the function of sensors, the pilot uses the central nervous system to process information. It uses executive bodies for the implementation of operations, the interconnection of the above elements acts in unity as a regulatory member. The simplified theory of the pilot-operator model, designed to control the longitudinal motion of the aircraft, is a rough empirical value of the real values needed to mathematically express the task of controlling the angle of inclination θ and angle of attack α at different speeds of flight UAV. At present, experimental methods for determining the pilot’s ability to control a given type of UAV are well developed, using special simulators, together with mathematical models of the properties of a “piloted UAV”. For the spectral density of random perturbations of air flow functions, for the longitudinal axis we start from the relation:
where is turbulence intensity value, is angular velocity, . is air speed, Lx is a measure of the lengths of turbulence acting on the individual components of the velocity vector which has the form:
where is the altitude. The intensity of turbulence acting on the UAV can be calculated according to the relation:
where is wind speed at the altitude of 6 m. For slight turbulence, this value is given by wind speed , for medium turbulence and for strong turbulence .
Based on these process noise components, the process error vector was determined is the vector of process errors (Gaussian white noise with zero mean value):
Measurement noise is generated by the UAV sensors themselves and their error models. For the analysis of the sensors, a static measurement of the IMU UAV was performed, focused on the measurement errors of the IMU PixHawk PX-4 gyroscope. Static measurements were performed in a time window of 3 h with a sampling frequency of 100 Hz. The IMU was stored in a horizontal position isolated from the surroundings, thus ensuring the stability of the measurement and the elimination of interfering vibrations. As little as the angular velocity of the Earth’s rotation is negligible, we can assume that the data measured by the gyroscope in the Y-axis show the magnitude of the individual errors affecting the IMU measurements. For recognizing the measuring noise, the measurement results were analyzed by Allan variation. The coefficients for the noise mechanisms angle random walk and bias drift were determined from the Allan variation graph. The bias drift value for the Y-axis gyroscope is . The standard deviation of the wideband noise representing the angle random walk is . It should be noted that although the static measurement was performed for 3 h, the “SkyDog” UAV can fly approximately 40 min with a maximum flight altitude of approximately 150 m. Based on these components of the measuring noise, the measurement error vector was determined. The measurement error vector is (Gaussian white noise with zero mean value):
The connected Kalman filter estimates the non-measurable output of the longitudinal slope of the UAV and filters the noisy signals from the other outputs of airspeed, angle of attack and roll rate. In the design of Kalman filter, the covariance of the Q and R matrix proved to be optimal. In determining the covariance matrices of Q and R, it was necessary to find a compromise between the accuracy of the estimate and the smoothing of noisy signals. The diagonal elements of the matrix represent the scatter of the individual sensors and in the simulations, they had . Optimization of Q and R matrices is essential for the best possible KF response to noisy signals, wind gusts, pilot characteristics or an inaccurate aircraft model.
To use the UAV model in the Kalman filter, it is necessary to convert the created state space of the UAV model into its discrete form. Discrete state space is characterized by the following relationships:
where is an n-dimensional state vector, is an m-dimensional measurement vector, is an m-dimensional measurement error vector (Gaussian white noise), is the input signal, is an n-dimensional Gaussian white noise with zero mean, is a system matrix of , is an excitation matrix of , is an output matrix of , is a direct feedback matrix bonds if is the sample number. To calculate the matrices of the discrete state space, it is possible to fully use the matrices of the continuous state space , , and . The value of the matrix is determined from the matrix for continuous state space model using the following relation:
We determine the matrix from the matrix for continuous state space model using the relation:
where is the discretization time and is the unit matrix. The matrices and remain unchanged as in the continuous state space, as the output equation does not change with the initial conditions of the state vector when converting from the continuous shape to the discrete shape.
3. Results
The values of forces and moments acting on the aircraft also affect the geometric coefficients. These coefficients are affected by the dimensions of the aircraft and were obtained from the technical documentation and the measurement of the aircraft itself. Table 1 shows the identified geometric coefficients that were used in the next step of creating the “SkyDog” UAV simulation model.

Table 1.
“SkyDog” geometric coefficients.
Using the XFLR5 program, aerodynamic coefficients for UAV “SkyDog” were obtained. Their values are given in Table 2.

Table 2.
“SkyDog” aerodynamic coefficients.
Based on the obtained aerodynamic coefficients shown in Table 2, a mathematical simulation model of the dynamic movement of the “SkyDog” UAV was created as shown in the Figure 8. Simulations were performed at a sampling time of .
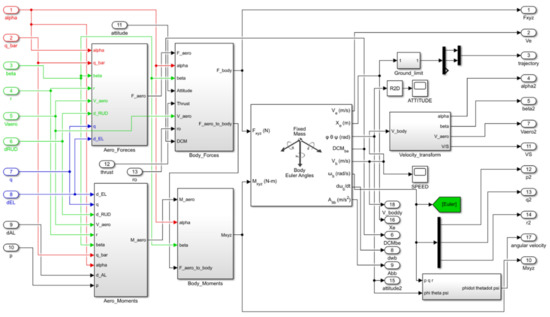
Figure 8.
Mathematical simulation 6DoF model of the dynamic movement of the “SkyDog” UAV.
To verify it, a comparison was made in the longitudinal plane. During the comparison, the angle of longitudinal inclination of the aircraft was observed in a few seconds because the deviation of the simulated data from the measured ones increases with time. This phenomenon is since the model does not include forces acting on the aircraft during real flight. This force group can include wind forces and the like. The simulation model is not expected to deviate zero from a real aircraft. The essence of creating the model is to interpret as accurately as possible realistically the outputs measured during the flight of the aircraft in a simulation environment under the same initial conditions. Figure 9 shows a comparison of the angle of longitudinal inclination during real and simulation flight.
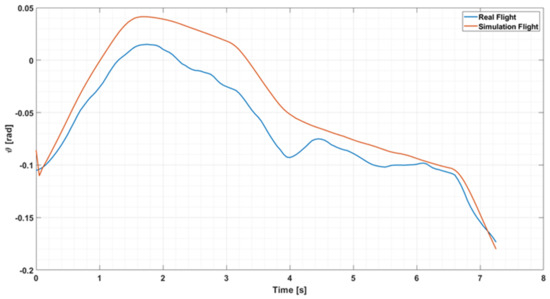
Figure 9.
Comparison of real and simulation flight in the longitudinal plane.
As can be seen, the simulated output course of the pitch angle is almost identical to the course during the experimental flight. In the monitored section, the absolute difference between these two values is 0.046 series. The accuracy of position angle simulation is important for the further design of flight stabilization and control systems, as position angle output information enters control systems. Therefore, great emphasis is placed on the accuracy of the simulation in position angles of the aircraft. Using the 6-DOF model UAV, the waveforms of the input signal in the form of rudder deflection and the output signals in the form of the angular velocity of the longitudinal inclination were obtained. Using the Gauss-Neton iteration method, a transfer function describing the motion of the UAV in the longitudinal plane was obtained. Its mathematical form is as follows:
Based on the knowledge of the transfer function, mathematical forms of approximate polynomials for individual members of the transfer function were created, the shape of which is:
The transfer function was calculated for a constant flight speed of 90 km/h. This flight speed was chosen because it is the “SkyDog” UAV cruising speed and so a substantial part of the experimental flights take place at approximately this speed. The same method was used to determine the transfer functions at the other two speeds, namely 60 km/h and 120 km/h. The transfer functions for the given flight speeds have the following form:
As mentioned in the previous chapter, it is also necessary to know the transfer function of the actuator that controls the control surfaces of the aircraft. The measurement therefore obtained the transfer function of the actuator for its mathematical model, which has the form:
The input to the actuator block is the required rudder deflection and the output is the real rudder deflection. The transfer function of the actuator is already included in the transfer functions of the airplane, insofar as these transfer functions were calculated from the data measured during the flight. After obtaining mathematical models of the aircraft and actuator, it was possible to design a PID controller. Since the transfer function of the aircraft also changes with the change of air speed, it is necessary to change the PID controller coefficients so that its properties are preserved together with the stability and controllability of the object. For this reason, the approximation polynomials of the PID controller coefficients were mathematically expressed by tuning the parameters for the variable flight speed in the MatLab program. Equations (34)–(37) describe the mathematical form of the approximate polynomial for the calculation of the individual PID controller coefficients:
Based on the knowledge of the approximate polynomials, it is possible to calculate the PID controller coefficients for all speeds in the “SkyDog” UAV operating speed range. Table 3 shows the coefficients for the individual speeds.

Table 3.
PID controller coefficients for individual airspeeds.
After the identification of mathematical models for individual blocks simulating the longitudinal movement of the “SkyDog” UAV, it is possible to combine them into a complex transfer function, which is needed for further processing. We consider the transfer function to be a complex transfer function, which includes the transfer functions of the designed PID controller, the servo mechanism, and the “SkyDog” UAV transfer function itself. Complex transfer functions for simulations converted at flight speeds of 60, 90 and 120 km/h have the following form:
Bode diagrams can be used to evaluate the adaptive controller. Logarithmic amplitude-frequency characteristics are an expression of the properties of transfer functions and angular velocity. Analysis of the tilting properties of the aircraft shows that the parameters of its longitudinal movement, i.e., its natural frequency and the coefficient of relative damping, do not differ from the required values. The optimal values of the natural frequency and the coefficients of ratio damping and from the pilot’s point of view were determined correctly.
The Bode diagrams presented below were created based on the general “SkyDog” UAV transfer function given in Equation (24), which is bound to the approximation polynomials of the individual members of the transfer function given in Equations (25)–(29) for variable flight speed. The transfer function thus created was multiplied by the transfer function of the created PID controller and analyzed by Bode diagrams. Two types of robust controllers were used for comparison. The first robust controller used coefficients calculated using the Control Toolbox in MatLab for a speed of 90 km/h, while the second type of robust controller uses coefficients calculated by Naslin’s method. These coefficients were subsequently applied to the entire range of “SkyDog” UAV flight speeds. The third type of controller comparison is an adaptive controller, which calculates the values of the coefficients based on the change in UAV flight speed, which are shown in Table 3. In each experiment, the margin of stability of the overall system in the transmission and phase characteristics was monitored. The first simulation experiment followed the properties of a system that used a classical PID controller with constant coefficients for a range of speeds. The coefficients have the following values: ; ; and . The graphical result of the experiment is shown in Figure 10.
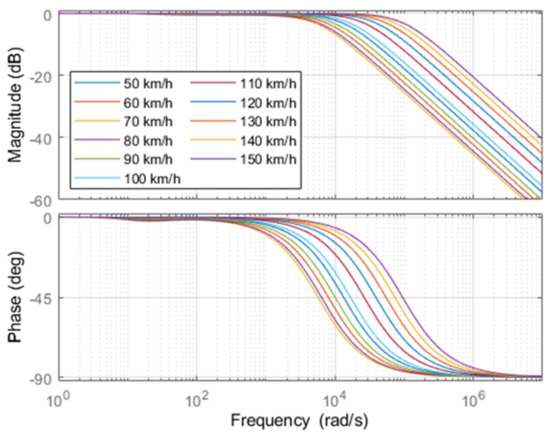
Figure 10.
Bode diagrams for a classic PID controller.
The first condition for maintaining the stability of the system is that at the moment when the transmission characteristic reaches the value 0 dB, the phase shift does not exceed the value −180°. The second condition says that, when the phase characteristic exceeds the value −180°, the transmission system must be less than 0 dB. The difference between these values is called the margin of stability. The larger the margin of stability, the more stable the system. From the simulation graph the first conditions are met to what extent the phase shift of the system is less than −180°. Since the system never reaches a phase shift of −180°, the system is always stable from the point of view of the second condition. Failure to exceed the phase shift value of −180° means that the supply of stability in the transmission characteristic is infinite. In the second experiment, a system using a PID controller with coefficients determined by Naslin’s method was monitored.
The coefficients were constant for the whole range of velocities and had the following values: ; ; and . The graphical result of the experiment is shown in Figure 11.
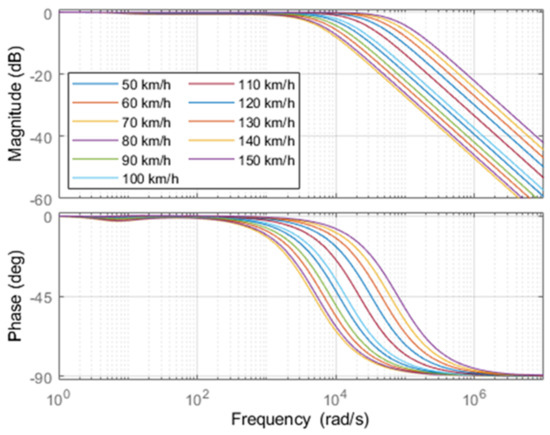
Figure 11.
Bode diagrams for PID controller using Naslin’s method.
This type of PID controller meets the stability conditions as well as the previous type of controller. The third type of PID controller investigated is an adaptive controller using the Gain scheduling method. The controller coefficients are calculated based on the approximate polynomials dependent on the UAV airspeed. The value of the coefficients for each speed is shown in Table 3. The graphical result is shown in Figure 12.
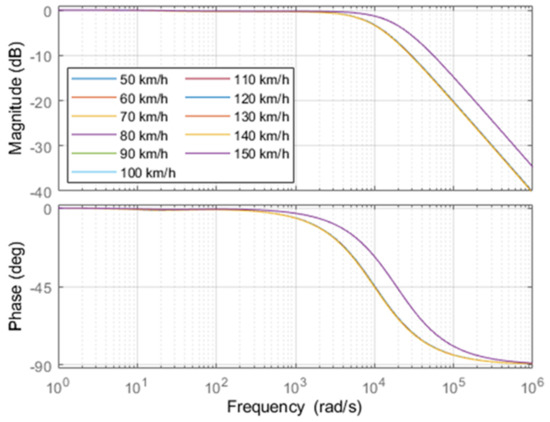
Figure 12.
Bode diagrams for adaptive PID controller.
As can be seen from the graphs, the use of such a controller ensures the same result at almost the entire range of speeds. The system again meets both conditions and therefore the supply of stability in the transmission part is infinite. At 150 km/h the system has different transmission and frequency characteristics from other simulated speeds. This phenomenon may be since the UAV can fly at a speed of 150 km/h, but its stability is beginning to decline. From the created complex transfer function for the longitudinal movement of the “SkyDog” UAV it is possible to create a model in the state space. By performing the conversion to the state space, we get three models in the state space, which the individual matrices have the following form:
Model at 60 km/h:
Model at 90 km/h:
Model at 120 km/h:
The matrices and are the same for all speeds and have the form:
Simulations were performed with the UAV model for three selected speeds. Process noise was estimated based on the assumed pilot control errors, the effect of atmospheric errors up to a height of 150 m. This process noise is then transformed into velocity, angle of attack, angle of longitudinal inclination and angular velocity of UAV in longitudinal inclination.
To the extent that the Kalman filter works in discrete time, it is necessary to convert the created models in state space into a discrete form. Based on Equations (22) and (23), we create models in a discrete state space with a discretization time s. Matrices and remain the same even in the discrete form of state space:
Matrices and change their shape in a discrete form and have the following shape. Discrete time model at 60 km/h:
Discrete time model at 90 km/h:
Discrete time model at 120 km/h:
Since the proposed model of the longitudinal inclination introduces process noise and measurement noise into the process, it is necessary to define these two parameters, for which a static measurement of the IMH PixHawk PX-4 was performed. The IMU is installed on board the “SkyDog” UAV and has the task of measuring and storing flight data. During the static measurement, the IMU was statically stored on a flat surface, which means that the output data of the accelerometers and gyroscopes correspond to their noise, which they introduce into the measurement. In the case of the longitudinal movement of the UAV, the simulations require data from a gyroscope, which has its axis of sensitivity identical to the y-axis of the aircraft coordinate system. The Allan variation method was used for sensor analysis. Graphs of the Allan variation for the acceleration and angular velocity sensors of all three aircraft axes are shown in Figure 13. The initial analysis was performed for all three axes of the IMU PixHawk PX-4 accelerometers and gyroscopes. To what extent we simulate the longitudinal movement of the aircraft, the Y-axis gyroscope data is authoritative for us. The basic parameter by which it is possible to determine the accuracy of the sensor is the standard deviation of broadband noise, known as angular random walk (ARW). In the Allan variation graph, this noise mechanism is defined by the standard by a curve with a slope of . For our chosen gyroscope, the standard deviation value of the wideband noise is 7.3548 × 10⁻⁴. The second parameter determining the accuracy of the sensor is the bias instability, which is defined by a curve with a slope of 0. The size of the bias instability in the gyroscope’s Y axis is 8.0878 × 10⁻⁵.
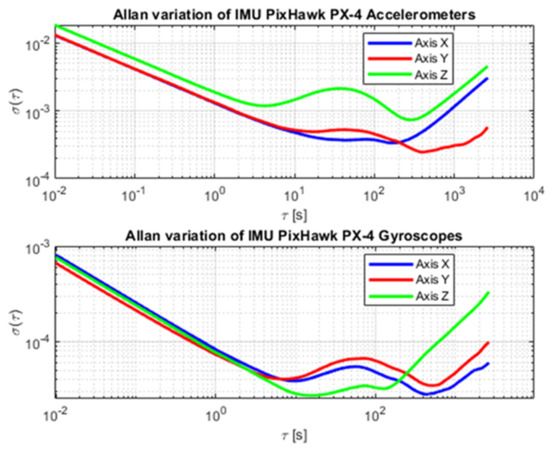
Figure 13.
Graphs of Allan variation of IMH PixHawk PX-4 sensors.
We defined the standard deviation of the measured noise signal of the IMU gyroscope as process noise. The value of measurement uncertainty type A was chosen for the measurement noise. The resulting noise values are:
The UAV model has thus been created, which is shown in Figure 14.
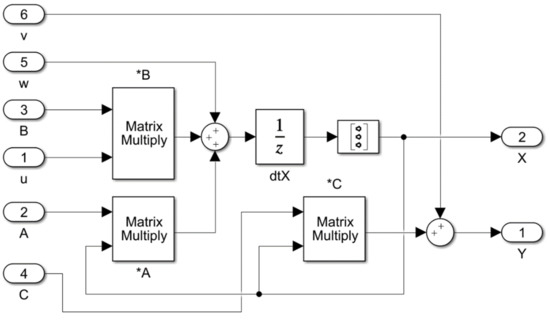
Figure 14.
Created model of longitudinal movement of UAV including noise.
The output of the models created in this way is very noisy compared to the ideal model. The output of the model with the noises is shown in Figure 15. The figure shows the change in the angular velocity of the longitudinal inclination over time.
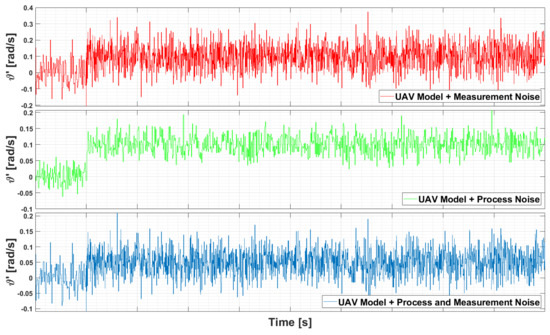
Figure 15.
Graphical outputs of created UAV models including noises for a speed of 90 km/h.
Two types of Kalman filters have been developed to effectively filter such a signal as well as to estimate the state. For its correct functionality, it is necessary to determine the covariance of the matrix and , which significantly affect the calculation of the gain of the Kalman filter. The values of covariance matrices were determined by estimation and their size is:
For the and was determined, a gain was calculated for each of the three simulated velocities, the value of which is:
Created models of Kalman filters are shown in Figure 16.
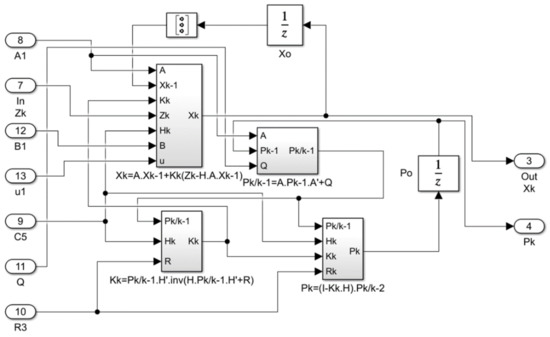
Figure 16.
Created model of Kalman filters for UAV models.
Figure 17 shows the real state of the system and an estimate of the state of the system for the calculated gain and their statistical data at a UAV speed of 90 km/h.
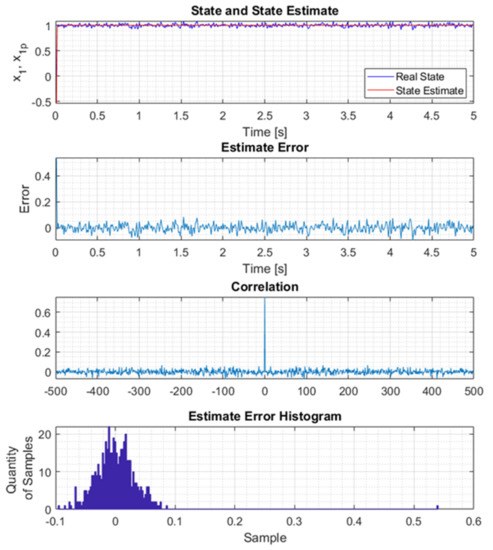
Figure 17.
The course of the system state and its estimation for the calculated gain.
Figure 18 shows that the proposed adaptive controller loaded with process noise and measurement errors using a Kalman filter optimally monitors the angular velocity UAV with minimal errors. The conclusions resulting from the plots shown in Figure 17 confirm the values of covariance errors. The figure shows the change in the angular velocity of the longitudinal inclination over time.
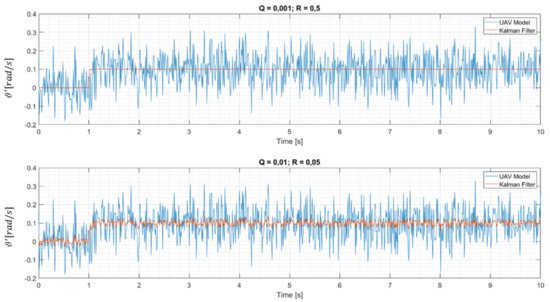
Figure 18.
Graphical course of angular velocity for UAV speed 90 km/h.
The values of the covariance errors of the unfiltered signal and the signal after filtering at selected values of the and matrices are given in Table 4.

Table 4.
Error covariance of Kalman filter at selected values of Q and R matrices.
4. Discussion
The stability and controllability of UAVs in critical flight situations can be reduced by induced illicit, but also accidental stimuli or conditions. The mentioned properties of the control complex can be the cause of dangerous conditions that require risky decisions of the operator—pilot or the intervention of assistance systems. This paper describes the physical properties of the UAV control object on a mathematical model in the form of nonlinear equations, these equations are linearized and then implemented in the software environment. Applied methods of aircraft control in longitudinal motion were analyzed on classical approaches and on new progressive methods. The PID parameters of a robust and adaptive controller for longitudinal control of a fixed-wing unmanned aircraft were determined by the method of analysis and synthesis. The proposed optimal discrete Kalman filter allows to determine the optimal discrete output signal (angular velocity information), while very effectively eliminating modulated process and measurement noise for different UAV speeds (Figure 15 and Figure 16). The function of the longitudinal velocity angular velocity estimation algorithm has been successfully applied not only to the model UAV but also its involvement with adaptive flight control systems. The requirements for the created control system were determined by the criteria contained in the identification of the control object so that the control system was robust enough to ensure the stability of the system at different speeds of the UAV. At the same time, the proposed control system is characterized by a certain degree of adaptation, the advantages of adaptation were visible compared to the use of the classic robust controller in Figure 11. To meet the main goal, it was necessary to sunk one of the sub-goals. The created simulation model works based on known mathematical relations describing the motion of an aircraft in three-dimensional space with six degrees of freedom. The construction of the model was based on the technical knowledge of the selected UAV and simulation experiments. This model is characterized by relative simplicity with relatively high accuracy of simulation. An adaptive controller was designed together with an aircraft model for a selected speed range which was burdened by process and measurement errors. The designed controller using Kalman filter optimally monitored the angular velocity of the UAV in the longitudinal plane with minimal errors, which is documented in Figure 16. The conclusions from Table 4 confirm the allowable values of covariation errors of our proposed adaptive UAV control system.
Author Contributions
Conceptualization, D.M., R.B. and M.S.; methodology, R.B.; validation, D.M., R.B. and M.S.; formal analysis, D.M., R.B. and M.S.; investigation, D.M. and R.B.; data curation, D.M. and M.S.; writing—original draft preparation, D.M. and M.S.; writing—review and editing, D.M. and R.B.; visualization, D.M.; supervision, R.B.; funding acquisition, R.B. All authors have read and agreed to the published version of the manuscript.
Funding
This research received no external funding.
Institutional Review Board Statement
Not applicable.
Informed Consent Statement
Not applicable.
Data Availability Statement
Not applicable.
Acknowledgments
This work was supported by project no. KEGA 044TUKE-4/2019—a small, unmanned airplane—the platform for education in the area of intelligent avionics.
Conflicts of Interest
The authors declare no conflict of interest.
References
- Szászi, I.; Kulcsár, B. Robust Control and Fault Detection Filter Design for Aircraft Pitch Axis. Period. Polytech. Transp. Eng. 2001, 29, 83–100. [Google Scholar]
- Liu, M.; Egan, G.K.; Santoso, F. Modeling, Autopilot Design, and Field Tuningof a UAV With Minimum Control Surfaces. IEEE Trans. Control Syst. Technol. 2015, 23, 2353–2360. [Google Scholar] [CrossRef]
- Raju, S.S.; Srividya, A.; Sudarsan, S.; Kiran, R. Design and Implementation of Model Predictive Control for Non-Linear System and Performance Comparison with Conventional PID. In Proceedings of the IX Control Instrumentation System Conference, Manipal, Karnataka, India, 16–17 November 2012. [Google Scholar]
- Aishah, J.; Fitri, Y.; Hatta, A.; Zainudin, A.R.; Shamsul, S.; Rudzidatulm, A.D.; Ab Rashid, M.Z.; Azizan, A.; Mori, Y. Improvement of Pitch Motion Control of an Aircraft Systems. TELKOMNIKA 2018, 16, 2263–2274. [Google Scholar]
- Leong, H.I. Development of a 6DoF Nonlinear Simulation Model Enhanced with Fine Tuning Procedures. Ph.D. Thesis, University of Kansas, Lawrence, KS, USA, 2008. [Google Scholar]
- Bayezit, I. The Autonomy of Fixed-Wing Aerial Vehicles and Experimental Design Steps on Implementing Autonomous Navigation, Landing And Take Off Operations For The Trainer60 Model Aircraft. In Proceedings of the 5th Ankara International Aerospace Conference, METU, Ankara, Turkey, 17–19 August 2009. [Google Scholar]
- Vural, M.; Nicolai, L.M. Estimating R/C Model Aerodynamics and Performance; Illinois Institute of Technology: Chicago, IL, USA, 2009. [Google Scholar]
- Kamal, A.M.; Bayoumy, A.A.; Elshabka, A. Modeling, Analysis and Validation of a Small Airplane Flight Dynamics. In Proceedings of the AIAA Modeling and Simulation Technologies Conference, Kissimmee, FL, USA, 5–9 January 2015. [Google Scholar]
- Hoffer, N.V. System Identification of a Small Low-Cost Unmanned Aerial Vehicle Using Flight Data from Low-Cost Sensors. Ph.D. Thesis, Utah State University, Logan, UT, USA, 2014. [Google Scholar]
- Al-Mashhadani, M.A. Optimal control and state estimation for unmanned aerial vehicle under random vibration and uncertainty. Meas. Control. 2019, 52, 1264–1271. [Google Scholar] [CrossRef]
- Ravi Kumar, M.G.; Ramamurthy, T.V. Fault Detection of Aircraft Plant Using KALMAN FILTER. IJCTA 2015, 8, 923–932. [Google Scholar]
- Ingabire, A.; Sklyarov, A.A. Control of longitudinal flight dynamics of a fixedwing UAV using LQR, LQG and nonlinear control. E3S Web Conf. 2019, 104, 02001. [Google Scholar] [CrossRef]
- Hajiyev, C.; Vural, S.Y. LQR Controller with Kalman Estimator Applied to UAV Longitudinal Dynamics. Positioning 2013, 4, 36–41. [Google Scholar] [CrossRef]
- Chrif, L.; Kadda, Z.M. Aircraft Control System Using LQG and LQR Controller with Optimal Estimation-Kalman Filter Design. Procedia Eng. 2014, 80, 245–257. [Google Scholar] [CrossRef]
- Ahmed, W.; Li, Z.; Maqsood, H.; Anwar, B. System Modeling and Controller Design for Lateral and Longitudinal Motion of F-16. Autom. Control Intell. Syst. 2019, 4, 39–45. [Google Scholar] [CrossRef]
- Chaoqiang, L. An Estimation Method for Aircraft Longitudinal Static Stability Prior to Flight Test. In Proceedings of the 2nd International Conference on Computer Application and System Modeling, Taiyuan, Shanxi, China, 27–29 July 2012. [Google Scholar]
- Chao, H.Y.; Cao, Y.C.; Chen, Y.Q. Autopilots for Small Unmanned Aerial Vehicles: A Survey. Int. J. Control Autom. Syst. 2010, 8, 36–44. [Google Scholar] [CrossRef]
- Titterton, D.; Weston, J. Strapdown Inertial Technology; Institution of Engineering and Technology: Stevenage, UK, 2004. [Google Scholar]
- Noshahri, H.; Kharrati, H. PID controller design for unmanned aerial vehicle using genetic algorithm. In Proceedings of the 23rd International Symposium on Industrial Electronics, Istanbul, Turkey, 1–4 June 2014. [Google Scholar] [CrossRef]
- Mehdi, H. Unmanned Aerial Systems, Chapter 22—UAV geofencing: Navigation of UVAs in constrained environments. In Theoretical Foundation and ApplicationsAdvances in Nonlinear Dynamics and Chaos (ANDC); Academic Press: Cambridge, MA, USA, 2021; pp. 567–594. [Google Scholar]
- Freescale Semiconductor, Inc. Allan Variance: Noise Analysis for Gyroscopes 2015. Available online: https://telesens.co/wp-content/uploads/2017/05/AllanVariance5087-1.pdf (accessed on 10 February 2015).
Publisher’s Note: MDPI stays neutral with regard to jurisdictional claims in published maps and institutional affiliations. |
© 2021 by the authors. Licensee MDPI, Basel, Switzerland. This article is an open access article distributed under the terms and conditions of the Creative Commons Attribution (CC BY) license (https://creativecommons.org/licenses/by/4.0/).