Abstract
The condensation of humid air is a crucial step in air conditioning and process engineering. However, the models that describe the condensation of vapour in the presence of a non-condensable gas require time-consuming numerical calculations that go beyond the Nusselt film theory. Only a small number of publications exist, where simple and computationally effective correlations for the condensation of water vapour in the presence of air are presented for specially designed condenser heat exchangers. Therefore, the objective of this paper is to extend the existing semi-empirical correlations for different geometries and process parameters. For the purpose of the study, an experimental setup with two different condenser heat exchangers based on vertical plates (height 74 mm) and horizontal tubes (3 tubes, diameter 40 mm and 7 tubes, diameter 15 mm) was built. Additionally, based on existing correlations, we developed two semi-empirical models that predict the condensation mass flux for the proposed geometries. Here, we report that the agreement between the experimental and theoretical values predicted by the new, semi-empirical correlations is excellent, with an average uncertainty of less than ±6%. Their usability was demonstrated by a possibly significant performance improvement of the condenser inside a condensation-type tumble dryer.
1. Introduction
Investigations of the phenomenon of vapour condensation in the presence of a non-condensable gas (NCG) already exist for several applications/systems/devices, including passive cooling systems in nuclear power plants, water-desalination systems, the purification of toxic gases from exhaust gases, absorption systems, energy-regeneration systems, and large industrial heat pipes [1].
The presence of an NCG negatively influences the heat-transfer coefficient. The NCG, which does not diffuse into the condensate film, accumulates at the liquid–gas interface (Figure 1a). This accumulation lowers the mass transfer of vapour from the bulk flow of the binary (vapour/NCG) gaseous mixture to the liquid–condensate film due to the additional diffusion resistance in the boundary layer of the vapour/NCG mixture. The accumulation also decreases the saturation temperature at which the condensation occurs, being lower than the saturation temperature of the bulk flow of the vapour/NCG mixture. The temperature at the liquid–gas interface can therefore be regarded as the saturation temperature at which the condensation occurs, which leads to a reduction in the condensation heat transfer (Figure 1b).
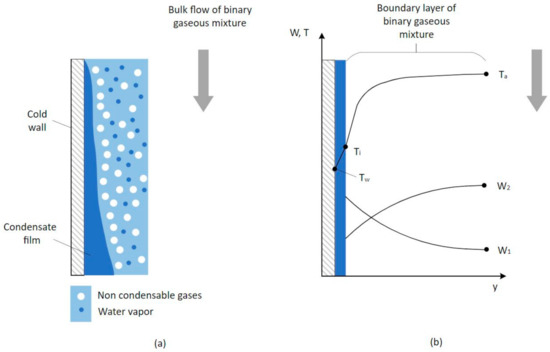
Figure 1.
(a) Schematic diagram of the condensation of a vapour in the presence of a NCG [2]. The mass fraction of NCG molecules increases at the liquid–gas interface, thus increasing the diffusion resistance of the vapour molecules into the condensate film. (b) Variation of mass fractions (W) of the vapour (index 2), the NCG (index 1), and the temperatures of the wall (index w), interface (index i), and bulk-flow mixture (index a) in the direction perpendicular to the bulk flow of the binary gaseous mixture [3].
In the following two sub-sections we present studies concerning convection condensation from the convective flow of vapours in the presence of an NCG on plates and channels, and on vertical tubes. The condensation of several different binary/tertiary mixtures has been studied theoretically, numerically, and experimentally for various cases and process parameters.
1.1. Condensation of Vapour on Vertical Plates in the Presence of a NCG
Asano et al. [4] compared experimental measurements with theoretical results, which were obtained using a boundary-layer theory and a similarity transformation, for forced convection film condensation of different fluids and their vapours (water vapour, methanol, benzene and carbon tetrachloride) on a vertical plate in the presence of air. For most of the investigated cases the difference between the theoretical and experimental results was less than 30%. Cheng and Jun-ming [5] numerically investigated the forced convection film condensation of humid air on a vertical plate using a mathematical model built on the full boundary-layer equations. The results were compared with the numerical and experimental data of other researchers. The agreement with the numerical data from other studies was good, with differences of around 1%, but there were larger discrepancies with the experimental data, with differences of up to 50%. Karkozska [6] theoretically and numerically investigated the forced convection condensation of water vapour on vertical and horizontal plates. The influence of different parameters on the condensation rate were studied in detail and the underlying physical processes were elucidated. The authors analysed the condensation of a binary mixture of water vapour and air and a ternary mixture containing water vapour, air and helium. While the results for both cases showed similar behaviour in terms of the experimental data, large differences between the theoretical and experimental data of more than 50% were observed. Bum-Jin et al. [7] presented experimental results comparing the film-wise and drop-wise free convection condensation of water vapour on a vertical plate with and without the presence of air. It was shown that even a small concentration of air has a very detrimental effect on the heat-transfer rate. More specifically, decreases in the heat-transfer rate of factors of roughly 5 and 1 were obtained for the drop-wise and film-wise condensations, respectively.
For both the laminar and turbulent regimes, Yi et al. [8] applied the numerical volume-of-fluid method to simulate the water-vapour-and-air mixture condensation on a vertical plate for the inlet-air mass fraction in the range 0.05 to 0.5. The results were compared with experimentally obtained correlations from the existing literature. Differences between the numerical and experimental results were small for large air mass fractions at the inlet (in the range of a few percent for air mass fractions of 0.4 and more).
For the vertical parallel-plate channels, Siow et al. [9] presented detailed numerical results for laminar-film condensation in the case of humid air flowing downwards. The condensation was investigated at different absolute pressures, inlet-to-wall temperature differences, inlet Reynolds numbers, and inlet-air concentrations. This was achieved by solving the boundary-layer equations with a fully coupled implicit numerical approach. Charef et al. [10] numerically analysed the heat-and-mass transfer of liquid-film condensation from humid air flowing downwards along an inclined channel. An implicit finite-difference method was used to solve the laminar boundary-layer equations. The results showed that increasing the angle of inclination affects the rate of condensation only slightly. Saraireh et al. [11] theoretically investigated the condensation of a humid-air flow in a vertical channel. The obtained differential equations from the theoretical model were discretized into finite-difference equations and solved using the fourth-order Runge-Kutta method. The solutions showed satisfactory agreement with the experimental data. Most differences between the theoretically and experimentally obtained results were in the range between 10% and 50%.
1.2. Condensation of Vapours on Horizontal Tubes in the Presence of a NCG
A uniform Nusselt number for laminar, wavy and turbulent regimes was obtained by Gnielinski [12] for the forced convection film condensation of a pure vapour on a horizontal tube. This correlation was experimentally verified and the differences between the theoretical and experimental data were, for most cases, less than 20%, though some larger differences (up to 40%) did occur. Fouda et al. [13] theoretically and experimentally investigated the film condensation of humid air on a horizontal tube in a laminar regime to obtain the Nusselt and Sherwood numbers. The theoretical part was performed by solving conservation equations using the Runge-Kutta fourth-order method accompanied with the shooting method. From the results they defined the correlation for the local Sherwood and Nusselt numbers. Using experimental data, they also determined a correlation for the average Sherwood and Nusselt numbers that predicted around 75% of the experimental data to within ±25%. Saleh and Ormiston [14,15] presented a two-phase numerical model of laminar film condensation based on elliptic Navier-Stokes equations and applied it for the case of humid-air flow over a horizontal tube. The equations were solved using a segregated solution method based on a finite-volume approach. For the case of condensation in a turbulent regime, Chen and Lin [16] presented a numerical model for studying turbulent film condensation in the presence of non-condensable gases over a horizontal tube. The model was based on the governing equations of the two-phase boundary-layer theory that were modified to include turbulence and for the case of water vapour and humid air. The set of equations was solved using the finite-volume method. The results for heat-transfer coefficients were compared with the experimental data of other researchers. The agreement at lower velocities was good, with most differences being less than 20%. However, for higher velocities, the difference was significantly larger. Minko et al. [17] presented the results of numerical analyses on humid-air condensation on a horizontal tube for both laminar and turbulent flows. The results showed good agreement with the experimental data, with most of the differences being less than 20%. For the numerical part, the flow of humid air was described using Navier–Stokes equations in the laminar regime and RANS equations in the turbulent regime. Lee and Rose [18,19] experimentally evaluated the heat-transfer characteristics for the forced convection film condensation of pure vapours (steam and R113) and vapour-gas mixtures (steam/air, steam/hydrogen, R113/air and R113/hydrogen) over a single horizontal tube.
A comprehensive literature overview of the current state of this field shows a lack of simple, yet effective, analytical or empirical models that would make it possible to calculate the condensation mass fluxes for vapours with a NCG for different operating conditions and different types of surfaces. Several research studies employed advanced numerical approaches, i.e., computational fluid dynamics or different numerical methods (finite elements or finite control volumes). The main goal of this study was twofold: (i.) to adjust the existing analytical and semi-empirical correlations to provide simple and computationally efficient correlations that describe the condensation of water vapour in the presence of air, referring to the geometries and process parameters presented in this research study and (ii.) to demonstrate that newly developed correlations could predict results with satisfactory agreement and could be used for evaluating the condensation mass flux rate for different types of condensers.
2. Experimental Setup
To evaluate the condensation mass flux on vertical plates and horizontal tubes the experimental setup shown in Figure 2 was designed. The setup was based on a closed air loop. The detailed technical specifications of the instruments are presented in Table 1.
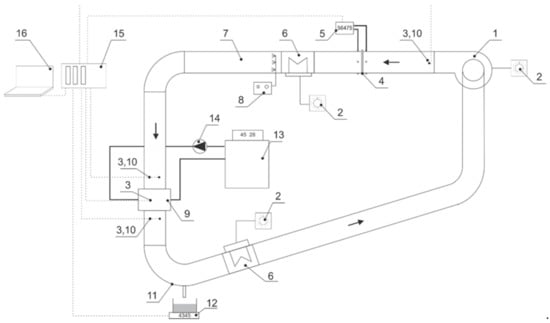
Figure 2.
Schematic of the experimental setup: 1—radial ventilator, 2—single-phase voltage variac, 3—temperature sensor, 4—orifice meter, 5—differential pressure transmitter, 6—air heater, 7—humidifier chamber, 8—water pump, 9—test chamber, 10—humidifier sensor, 11—condensate collector, 12—scale, 13—temperature-controlled water bath, 14—circulation pump, 15—data-acquisition system, 16—computer.

Table 1.
Technical specifications of the measuring equipment.
To provide the necessary flow of humid air through the test chamber a radial ventilator was used. The volumetric flow rate of the dehumidified humid air (location 4) is measured with an orifice meter according to SIST EN ISO 5801 [20] and SIST EN ISO 5167-2 [21]. The humidification system (location 7) consists of high pressure and a fine nozzle orifice. The system produces water droplets with an estimated diameter of 10–15 µm. In order to remove the water droplets from the humid air before the inlet to the test chamber, the humidifier chamber contains drift eliminators. The condensation is collected in the lowest part of the setup, where the condensation mass flow was determined by weighing (location 12). Two electric heaters are used for heating the air. The water used for cooling the condensation surfaces is prepared in a temperature-controlled water bath and circulates in a closed loop. To prevent any additional condensation on the inner surface of the air ducts, thermal insulation (thickness 13 mm, thermal conductivity ≤ 0.036 W/mK at 0 °C) was installed.
The measuring uncertainty of the condensation mass flux as a result of the condensation on the inner surface of the air duct before and after the test chamber was evaluated separately. We performed separate experiments by using a test chamber without horizontal tubes/vertical plates. Measurements were performed at different volume flows and temperatures of the humid air. The measurement data are represented by Equation (1), which denotes the uncertainty of the measured condensation mass flow in the test chamber
(kg/s). The equation considers the average humid-air temperature and . The validity of Equation (1) is the temperature range of the humid air between 30 °C and 75 °C.
The test chamber has a rectangular cross-section with dimensions of 208 × 308 mm2. Figure 3 shows a section of the test chamber with horizontal tubes. The studied horizontal-tube condensers consist of two fluid streams separated by a solid wall. The cooling water flows inside the horizontal tubes, while the humid air flows downwards and in a cross flow with the cooling water. Two different copper-based condensers were analysed, one with three tubes in a row with the outer diameter of a tube being 40 mm, and another one with seven tubes in a row with the outer diameter of a tube being 15 mm. The width of both condensers is 208 mm and the wall thickness is 1 mm. Both condensers have approximately the same heat-transfer area. All the condensation surfaces, including the tubes and all the inner walls of the condensers, are made from copper.
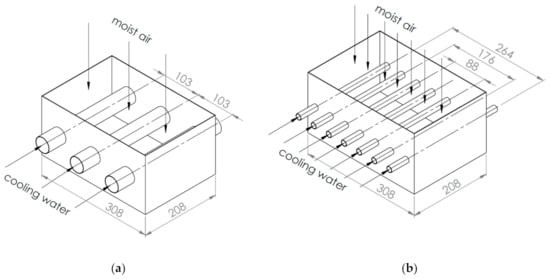
Figure 3.
Section of test chamber with horizontal copper tubes with: (a) 3 tubes in a row, d = 40 mm and (b) 7 tubes in a row, d = 15 mm.
Figure 4 shows the section of the test chamber with vertical plates. The studied condenser consists of two fluid streams separated by a solid wall. The cooling water flows inside the vertical plates, while the humid air flows downwards and in a cross flow with the cooling water. The number of vertical plates was 8, the height of the plates was 74 mm, the width of the chamber was 208 mm, while the condenser’s wall thickness was 1 mm. All the condensation surfaces, including the vertical plates and all the inner walls of the condenser, are made from copper.
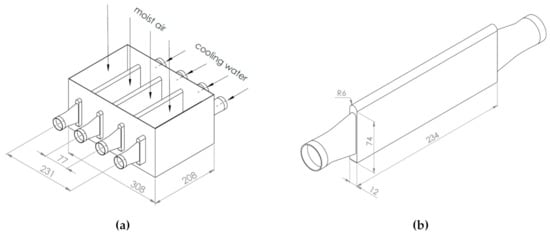
Figure 4.
Section of test chamber with three vertical copper plates. (a) test chamber with four vertical flat plates; (b) single vertical flat plate.
3. Semi-Empirical Correlations for Water-Vapour Condensation in the Presence of Air
Semi-empirical correlations describing the condensation of water vapour in the presence of air presented in this paper are based on already-published correlations. We have chosen two existing correlations that describe this process for two geometries: vertical flat plates and an outer surface of horizontal tubes. The main goal of this subsection was twofold: to validate the existing correlations on the presented geometries and to determine the empirical coefficients based on our experimental data.
3.1. Determination of Empirical Coefficients for Vertical Flat Plates
The preliminary literature survey regarding the most appropriate existing correlation for the condensation of water vapour in the presence of air on the vertical plates identified the semi-empirical model of Corradini [22]. It turns out that this correlation is based on the Nusselt film theory and can be easily modified according to our own experimental analysis on vertical flat plates. The author derived a condensation model for forced and natural convection by extending the Reynolds–Colburn analogy for heat-and-momentum transfer to mass-and-momentum transfer. An experimental validation of this model was performed on the basis of an experimental dataset provided by Uchida et al. [23] and Tagami [24]. The basic equation for calculating the condensation mass flux [kg/sm2], averaged over the length x = 0 to L in the case of the condensation of water vapour in the presence of air on a single vertical flat plate is shown with Equation (2). The derivation of this equation is provided in Appendix A.1 by Equations (A1) to (A7).
Related to this equation, the author states the following constants in the article [22]: β = 0.037, φ = 1.
The other variables are: –Reynolds number of humid air bulk flow, –Schmidt number of bulk flow, –velocity of the humid air at the inlet of the test chamber [m/s], –dimensionless coefficient [/], –mass fraction of water vapour in bulk flow [/], –the density of humid air, determined for the average value of the humid-air temperature and the temperature at the liquid–gas interface [kg/m3],
–mass fraction of water vapour at the liquid–gas interface [/], –density of humid air for the temperature at the liquid–gas interface [kg/m3],
–specific heat of condensate at constant pressure [J/kgK], temperature at the liquid–gas interface [K], –plate wall temperature [K] and –heat of vaporisation of the condensate [J/kg].
A comparison of the results obtained using Equation (2) with the results provided by experiment reveals an average discrepancy of −50%, as shown in Figure 5 and Table A1 in the Appendix A. The most likely reason for such a difference is the different geometries, covered by Equation (2) and our experiment. In order to further confirm the accuracy of the results (model M1 verification) provided by Equation (2), we also calculated the condensation mass fluxes with four other models M2–M5, see also Table 2. The application range of all the existing models M1–M5 are given in Table A2 in the Appendix A. The comparison of the agreements of all five models (M1–M5) with the experimental data shows that the agreement is from −25% to −69% (Figure 5 and Table A1 in the Appendix A). In other words, the condensation mass fluxes calculated from all five models are of the same order of magnitude, although all the models underpredict the condensation mass flux rates in comparison with the experimental results.

Figure 5.
Comparison between our experimental and calculated condensation mass fluxes, obtained using existing models [3,22,25,26].

Table 2.
Existing models used for the comparison with the experimental results for the case of the condensation of water vapour on vertical flat plates.
The next step involved a determination of the empirical coefficients of Equation (2), which is schematically shown in Figure 6a. The main goal of this process was to adjust the existing model M1 to a different range of process parameters and to the geometry presented in our study. This was achieved by calculating the Pearson correlation coefficient r [27]. This coefficient demonstrates the impact of different variables on the ratio between the experimental and theoretical data. For the variable that is the most correlated with the ratio (has the highest absolute value of Pearson’s coefficient), a correlation between the ratio and the variable was determined. This correlation was then multiplied by Equation (3) and so a new empirical constant was obtained.
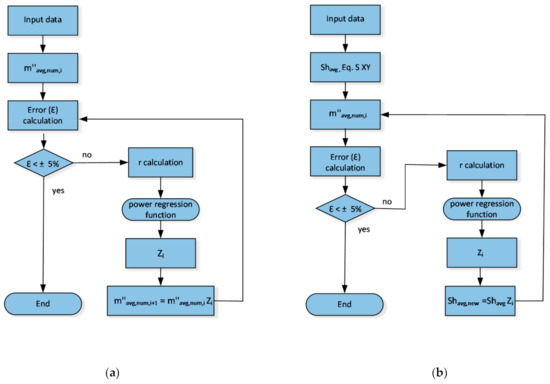
Figure 6.
Calculation procedure for determining a semi-empirical correlation for the mass flux for (a) the vertical plates and (b) the horizontal tubes.
Based
on calculations, we found that the most correlated variables were the velocity of the bulk flow (with ), the Reynolds number (with ), and the Schmidt number (with ). For , a correlation was determined based on the power–regression function (Figure 7) as:
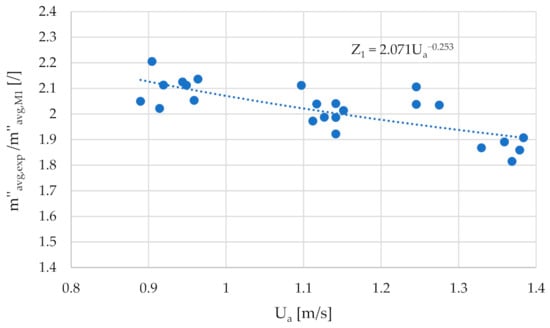
Figure 7.
Dependence of the ratio of the experimental and calculated condensation mass flux on the inlet velocity of the bulk flow of humid air.
Empirical coefficients for the model M1 were therefore determined by the multiplication of Equation (2) by Equation (3). The final empirical coefficients were determined as β = 0.0766 and φ = 0.747, and the final experimentally validated correlation for the calculation of the condensation mass flux is as follows:
The next step involved a calculation of the average discrepancy between the experimental and calculated data based on the corrected model M1. At the beginning of this process, we set the threshold value of the accuracy to ±5.0%. As the first iteration yielded a significant decrease in the average uncertainty to ±3%, the iteration process stopped. A detailed presentation of the results can be found in Section 4.1.
The final correlation for determining the condensation mass flux of the water vapour in the presence of air on vertical plates Equation (4) is valid for the following process listed in Table 3.

Table 3.
Range of process parameters valid for Equation (4).
3.2. Determination of Empirical Coefficients for Horizonal Tubes
The mass transfer during the film condensation of humid air on horizontal tubes was first experimentally analysed for different inlet conditions, as summarized in Table 4. After this, we determined the correlation for the condensation of humid air, by modifying the semi-empirical model of Fouda et al. [13]. They performed a theoretical and experimental study of the condensation process for different inlet conditions (i.e., relative humidity, humid-air flow rate, temperature difference between the humid-air dew point and the tube-wall temperature) on a single horizontal copper tube with an outer diameter of 40 mm and a length of 1000 mm. Fundamental equations for determining the condensation rate as well as Fouda’s correlation for the average Sherwood number are presented in the Appendix A.4 by Equations (A29)–(A34). We determined a new correlation for the Sherwood number in order to improve the existing correlation and extend it to a wider range of parameters and tube geometries. All the thermodynamic properties were calculated using the CoolProp [28] library.

Table 4.
Range of process parameters valid for the new, semi-empirical correlation Equation (11).
A comparison between our experimental data for the condensation mass flux and the results obtained with the correlation of Fouda et al. [13] shows that their correlation overpredicts the experimental result by 74% for a condenser with a three-tube row, and in the case of the seven-tube row by 206% (Figure 8). The main reason for this discrepancy was the difference in the range of Reynolds numbers between our experimental results and the range of application of Fouda’s correlation. In our experimental measurements, the Reynolds numbers were Re = 1600–2800 for tubes with 40 mm outer diameter and for tubes with 15 mm outer diameter the Reynolds numbers were Re = 600–1100. The Fouda’s correlation is valid for higher Reynolds numbers Re = 2000–8000 and was validated on a tube with 40 mm outer diameter. Since the Fouda’s correlation is only valid for a single tube, large deviations between the experimental results and the predicted values are expected, especially for 7 tubes with smaller diameters.
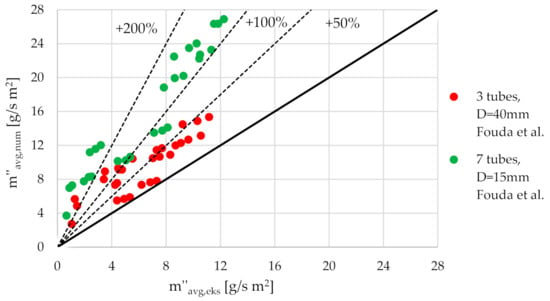
Figure 8.
Comparison between experimental and calculated condensation mass fluxes, obtained using the existing model [13].
Therefore, Fouda’s correlation was modified with our experimental results on both condensers Equation (5). The term Z in Equation (5) consists of four empirical coefficients (Z1, Z2, Z3, Z4), where each represents a correction of the variable that influences the condensation rate.
The calculation
procedure for determining the empirical coefficients is shown in Figure 6b and is similar to the one used for vertical plates. The entire procedure must be repeated a number of times until the difference between the experimental and predicted condensation mass fluxes is less than 5%. In each step of the calculation procedure, a new variable is correlated. The considered variables were: the tube outer diameter , the temperature difference between the inlet humid air and the wall , the bulk flow inlet temperature , and the bulk flow rate . A new empirical coefficient (Zi) was determined for each variable, which improves the accuracy of the semi-empirical model Equations (6)–(9). The maximum number of steps in the calculation procedure is determined with the number of considered variables. The order of corrected variables was determined by the values of the Pearson coefficient r between selected variables and the ratio of the experimental and theoretical results in each step. For the variable with the highest Pearson coefficient r, the empirical correlation between the ratio of our experimental results and theoretical results from the Fouda correlation was determined. This was done by employing a power–regression function, as shown in Figure 9.
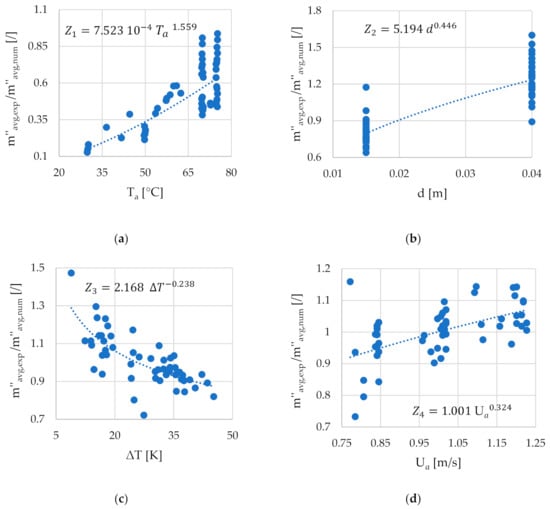
Figure 9.
Functional dependence of the ratio of the experimental and calculated condensation mass flux and (a) temperature of humid air; (b) tube outer diameter; (c) temperature difference between humid air and wall; (d) humid-air velocity.
The newly obtained correlation represented the empirical coefficient Zi, where i represents the number of steps in the calculation procedure. The empirical coefficient was then multiplied by the Fouda correlation for the Sherwood number. A new average Sherwood number and a new ratio between the experimental and predicted condensation mass flux were then calculated. If the accuracy of the ratio was less than 5%, the new correlation was considered final. Otherwise, the whole procedure was repeated again for the remaining variables.
In our study, this procedure was repeated four times, resulting in four different empirical coefficients: Z1 Equation (6), Z2 Equation (7), Z3 Equation (8), Z4 Equation (9). In the first step, the correlated variable was the humid-air inlet temperature Ta and the accuracy of the correlation was ƐZ1 = ±23.2%. In the second step, the correlated variable was the tube outer diameter d and the accuracy improved by a further 13%, i.e., ƐZ2 = ±10.2%. This was followed by a correlation with the temperature difference between the humid air and the wall
(ƐZ3 = ±6.1%) and in the fourth step the correlated variable was the humid-air inlet velocity
(ƐZ4 = ±5.2%). With each empirical coefficient, the correlation’s accuracy improved until a satisfactory agreement was reached. At the beginning of this process, we set the threshold value of the accuracy to ±5.0%. Since all the viable variables were used for the correction, we stopped the process after the fourth iteration.
The final formulation of the proposed term Z is defined as:
The proposed modified correlation for the Sherwood number
is given in Equation (6).
where Re is the Reynolds number [/], RH is the relative humidity [/], is the dew-point temperature of the humid air [°C], is the wall temperature [°C], and is the temperature of the humid air [°C].
The average condensation mass flux is as follows:
where is the mass diffusivity [m2/s], is the density of humid air at the liquid–gas interface and is the density of humid air, and [kg/m3], respectively.
The final correlation for determining the condensate mass flux Equation (11) of the humid air on the horizontal tubes is applicable to the parametric range listed in Table 4 and for laminar, steady flow with constant physical properties.
4. Results and Discussion
Within this section the results related to the experimental validation of the modified models for the calculation of water-vapour condensation in the presence of air on vertical flat plates and horizontal tubes are presented. The usability of the proposed semi-empirical correlations is also demonstrated by the evaluation of the condenser performance inside a condensation tumble dryer (CTD), which can be found in the Appendix A.8 and Appendix A.9.
4.1. Experimental Validation-Vertical Flat Plates
On the basis of Equation (4), which shows the final correlation for the calculation of the condensation mass flux we calculated new values for the process parameters, defined in Table A1 in the Appendix A and Figure 10. Both the table and Figure 10 shows the experimental, corrected (M1), and uncorrected (M1–M5) model-based values of the condensation mass flux in the case of the condensation of water vapour in the presence of air on the vertical flat plates. Within Table A1, the first three columns represent the following three process parameters: temperature of the humid air (Ta), temperature difference between the humid air and the outside surface of the plate wall (Ta–Tw), and humid-air volume flow (). These parameters indicate the parameters for which the experiments were performed and the parameters that served as the input data for the calculations based on the models M1–M5. Additional input data used for the calculations are shown in Table 5. The condensation surface area in Table 5 represents the external area of all the vertical flat plates.
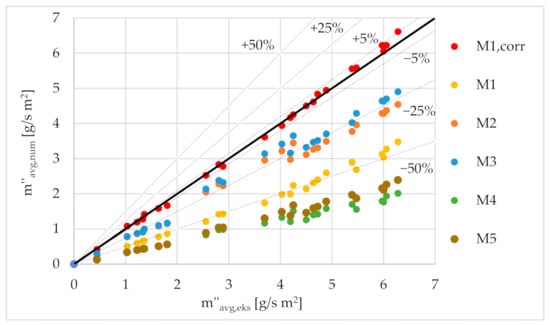
Figure 10.
Comparison between the experimental, model-based theoretical values based on models M1–M5 and the model-based corrected (M1,corr) calculated values of the condensation mass fluxes.

Table 5.
Additional input data used for the calculation of the condensation mass flux.
Based on the results shown in Figure 10 and Table A1, we can see that the agreement between the new, semi-empirical model and the experimentally obtained condensation mass flux values are within ±5%. In short, the agreement is satisfactory, within ±3%. As noted before (related to Figure 5), all the theoretical models underpredict the condensation mass flux from −25% to 69%. According to the application range of those models, the process parameters of our experiments are relevant for all the listed models M1–M5. The main reason for such a discrepancy between the predicted and experimental values is the fact that the geometry of the test section with the vertical plates is slightly different to the geometry for which the existing correlations are applicable (single vertical plate vs. eight vertical plates, forming vertical channels).
4.2. Experimental Validation-Horizontal Tubes
The results from the final correlation for the calculation of the condensation mass flux Equation (11) are validated against the experimental data measured on the condensers with three and seven tubes in a row. The theoretical values of m’’avg,num were calculated using Equation (11) for the measured process parameters listed in Table A3 in the Appendix A. Table A3 shows the process parameters for which the experiments were performed and the parameters that served as the input data for the calculations. Those process parameters were: temperature of the bulk flow of the humid air (Ta), temperature difference between the humid air and the outside surface of the plate wall (Ta−Tw), and the humid-air volume flow (). Additional input data needed for the theoretical calculations are presented in Table 5. The condensation surface area in Table 5 represents the external area of a single horizontal tube, multiplied by the number of tubes used in the study. The cross-section of the inlet humid air is the same for both condensers because the same test cell was used for both, as described in Section 2. It is clear from Figure 11 and Table A3 that the results obtained with the new, semi-empirical model and the experimentally obtained condensation mass-flux values are in good agreement, with the average uncertainty being less than ±6%. To be specific, all the predicted mass-flux values were within ±5.2%.
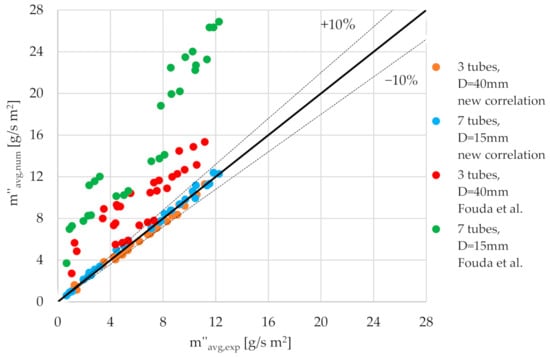
Figure 11.
Comparison of the experimentally defined condensation mass fluxes compared with the theoretical results obtained from the modified correlation in Equation (11) and the theoretical results from the Fouda et al. correlation [13].
5. Conclusions
The presence of a non-condensable gas during the condensation of a vapour has a significant impact on the condensation mass-flux rate. Even a small amount of air significantly decreases the heat-transfer coefficient and reduces the condensation mass flux. This study concentrated on theoretical and experimental investigations of water-vapour condensation in the presence of a non-condensable gas (in this case air) on vertical plates and horizontal tubes.
The main goal was to obtain validated semi-empirical correlations that cover geometries based on vertical plates with a height of 74 mm, and on three and seven horizontal tubes with outer diameters of 40 mm and 15 mm, respectively. The semi-empirical correlation for vertical plates Equation (4) and for horizontal tubes Equation (11) were obtained by modifying existing correlations from the literature with the Z terms (Equation (3) for vertical plates and Equations (6)–(9) for horizontal tubes). The semi-empirical correlation for vertical plates and for horizontal tubes in the form of Equation (4) and Equation (11), respectively, were obtained. Here we report that the agreements between the experimental and calculated condensation mass-flux rates based on semi-empirical correlations are now between ±3% to ±6% for vertical plates and horizontal tubes, respectively.
The main advantages of the proposed semi-empirical models are their simplicity, short computational times, and that they can be easily used for a wide range of applications.
Within the appendix of this paper the usability of the proposed correlations was further demonstrated by an evaluation of potential condensers inside a condensation tumble dryer. Here we show that for the same operational and process parameters, the newly proposed condensers can achieve condensation mass flux rates that are more than 100% higher. The best geometry in terms of mass-flux rates is based on seven horizontal tubes with an outer diameter of 15 mm, as it shows almost four times higher rates (6.9 vs. 1.7 g/s m2) compared to the existing condenser inside the tumble dryer. An additional parametric analysis showed the possibility of either reducing the temperature difference between the humid air and the walls, or of reducing the temperature of the air inside the drum of the tumble dryer. This potential reduction could have a huge impact on the longevity of textiles, as a lower air temperature leads to less fibre degradation during the process of textile drying.
Author Contributions
Conceptualization, K.A. and G.P.; methodology, P.P. and P.N.; software, Ž.T., P.P., and P.N.; validation, Ž.T., P.P., and P.N.; formal analysis, P.P. and P.N.; investigation, P.P. and P.N.; resources, K.A.; data curation, V.B.; writing—original draft preparation, P.P. and P.N.; writing—review and editing, K.A., P.P., and P.N.; visualization, P.P., P.N., and V.B.; supervision, K.A.; project administration, K.A.; funding acquisition, K.A. All authors have read and agreed to the published version of the manuscript.
Funding
Industrial project, Research and development in heat and mass processes in household appliances; Gorenje, 2017–2020.
Institutional Review Board Statement
Not applicable.
Informed Consent Statement
Not applicable.
Data Availability Statement
Not applicable.
Conflicts of Interest
The authors declare no conflict of interest.
Nomenclature
| cp | specific heat of condensate [J/kg K] |
| C | molar concentration [mol/m3]; function [/] |
| C0 | dimensionless coefficient [/] |
| d | tube outer diameter [m] |
| D | mass diffusivity [m2/s] |
| g | mass-transfer coefficient [m/s]; mass-transfer conductance [1/s m2] |
| h | transfer coefficient [m/s]; specific enthalpy [J/kg] |
| k | condensation thermal conductivity [W/m K] |
| L | length [m] |
| m | function |
| mass flow [kg/s] | |
| mass flux [kg/s m2] | |
| M | molecular mass [kg/mol] |
| dimensionless condensate mass flux [/] | |
| p | pressure [kPa] |
| r | Pearson correlation coefficient [/] |
| R | variable [/]; universal gas constant [J/kmol K] |
| RH | relative humidity [/] |
| T | temperature [°C, K] |
| U | velocity [m/s] |
| volume flow [m3/s] | |
| W | mass fraction [/] |
| Y | molar fraction [/] |
| Z | function variable [/] |
| Greek letters | |
| β | constant [/] |
| ε | uncertainty [%] |
| Φ | constant [/] |
| φ | constant [/] |
| ρ | density [kg/m3] |
| µ | dynamic viscosity [kg/m s] |
| Subscripts | |
| 1 | non-condensable gas (air) |
| 2 | (water) vapour |
| a | humid air; absolute |
| avg | average |
| c | condensation; condensate |
| dew | dew-point |
| exp | experimental |
| F | forced convection condensation |
| fg | vaporisation |
| i | interface |
| in | inlet |
| L | length |
| m | mass; mixture |
| M | Model M1-M5 |
| num | numerical |
| out | outlet |
| R | ratio of air mass fractions |
| V | humid air inside the vapour boundary layer |
| w | plate/tube wall |
| Dimensionless quantities | |
| Re | Reynolds number |
| Sc | Schmidt number |
| Sh | Sherwood number |
Appendix A
Appendix A.1. Derivation of the Semi-Empirical Models M1–M5
- Model M1 [22]
Equation (A1) represents the average condensation mass flux [kg/sm2], which is the basis for obtaining a modified Equation (2) in Section 3.1.
where: denotes the temperature of the humid air [K] and denotes the temperature at the liquid–gas interface [K], which is calculated using the algorithm presented by Fujii et al. [3], denotes the condensation heat-transfer coefficient [W/m2K], denotes modified condensation heat of vaporisation [J/kg]:
where denotes the condensation heat of vaporisation [J/kg], denotes the specific heat of the condensate at constant pressure [J/kg K], denotes the wall plate temperature [K].
To calculate the condensation heat-transfer coefficient, there are several correlations that depend on the geometry of the model, the properties and the velocity of the humid air. We used the correlation based on the work of Corradini [22]. The equation for hc is defined as:
where denotes the condensate molecular mass [kg/mol], and are molar concentrations of the water vapour inside the humid air and at the liquid–gas interface [mol/m3], respectively, denotes the corrected mass-transfer coefficient [m/s]. This coefficient already includes a correction that is valid for higher mass-transfer rates. This coefficient is calculated as:
where denotes the mass-transfer coefficient in the case of lower mass-transfer rates [m/s], while [/] is calculated with the following equation:
The variable is calculated as:
where and represent the molar fractions of water vapour inside the humid air and at the liquid–gas interface [/], respectively. The variable g is defined by the equation:
where denotes the Reynolds number of humid-air bulk flow, also considering the height L of vertical plates [/], denotes the Schmidt number of the bulk flow [/] and denotes the inlet velocity of the bulk flow, respectively [m/s].
- Model M2 [3]
The condensation mass flux [kg/s m2] in the case of the Fujii [3] algebraic method–M2, has been calculated based on the following equation:
where denotes the dynamic viscosity of humid air inside the vapour boundary layer [kg/s m], L is the height of the vertical plates [m], is the dimensionless condensate mass flux defined by the physical properties of the vapour mixture for forced-convection condensation [/]. has already been defined during the model M1 derivation. can be calculated using the following equation:
where denotes the function [/] of Schmidt (Sc) number [/] of humid air inside the vapour boundary layer, defined by equation:
Here represents the ratio of air mass fractions [/], as defined by the following equation:
where denotes the mass fraction of dry air at the liquid–gas interface [/], is the mass fraction of air in the condensate [/] (is equal to 0) and denotes the mass fraction of air in the bulk flow [/]. The exponent m [/] can be calculated with the following equation:
where the variable R [/] is calculated as:
and denote a condensate density [kg/m3] and dynamic viscosity [kg/s m], respectively, while and denote the density [kg/m3] and dynamic viscosity [kg/s m], of humid air inside the vapour boundary layer.
- Model M3 [3]
The second model, provided by Fujii [3]–M3, is based on the stagnant film theory. The condensation mass flux [kg/s m2] is calculated based on the following two equations:
All the variables share the same definitions as in the case of the model M2.
- Model M4 [26]
The fourth model M4 for the calculation of the condensation mass flux [kg/s m2] is based on the stagnant film theory, provided by Kim et al. [26]:
Condensation heat-transfer coefficient [W/m2 K] can be calculated using the equation:
The variable g denotes a mass-transfer conductance [1/s m2], and can be calculated using the equation:
All the variables inside Equations (A16)–(A18) were defined during the derivation of model M1.
- Model M5 [25]
Liao proposed the following equation to calculate the condensation mass flux [kg/s m2], which is denoted as model M5:
All the variables in Equation (A19) were already defined during the derivation of model M1. Unlike other models, the condensation heat-transfer coefficient [W/m2 K] is calculated with a different approach as:
where Sh represents the Sherwood number for condensation. The denotes the height of the vertical plates [m], while the denotes a condensation thermal conductivity [W/m K], which can be calculated using the following Equation (A21):
where and were already defined during the derivation of model M1. denotes the absolute pressure [Pa], D denotes the diffusivity of water vapour in air [m2/s], and [kg/kmol] denote the molecular mass of water vapour and air, respectively, R denotes the universal gas constant [J/kmol K] and denotes the average temperature [K], calculated using Equation (A22).
The variable can be calculated using the following equation:
All the variables in Equation (A23) were defined during the derivation of the model M2. The variable can be calculated using Equation (A24):
where and [kg/kmol] denote the mixture molecular mass in the bulk flow and at the liquid-vapour interface, respectively, and denotes the average mixture molecular mass [kg/kmol]. and are calculated using the following equations:
while is calculated using the following equation:
All the variables in Equations (A25)–(A27) were defined during the derivation of the models M1 and M2. denotes the log mean of molar fraction of water vapour and is calculated as:
Both molar fractions in Equation (A28) were defined during the derivation of model M1.
Appendix A.2. Experimental and Theoretical Results–Vertical Plates

Table A1.
Condensation mass fluxes obtained with our experiments, corrected M1 model, and five non-corrected (M1–M5) models and at different parameters: temperature of humid air (Ta), temperature difference between humid air and the wall (Ta−Tw) and volumetric flow rate of the humid air ().
Table A1.
Condensation mass fluxes obtained with our experiments, corrected M1 model, and five non-corrected (M1–M5) models and at different parameters: temperature of humid air (Ta), temperature difference between humid air and the wall (Ta−Tw) and volumetric flow rate of the humid air ().
| Ta [°C] | Ta−Tw [K] | ||||||||
|---|---|---|---|---|---|---|---|---|---|
| 30.2 | 19.7 | 0.051 | 0.44 | 0.44 | 0.20 | 0.29 | 0.29 | 0.13 | 0.13 |
| 49.8 | 18.4 | 0.072 | 1.33 | 1.25 | 0.66 | 0.92 | 0.91 | 0.44 | 0.43 |
| 49.9 | 29.4 | 0.062 | 1.64 | 1.55 | 0.78 | 1.10 | 1.08 | 0.50 | 0.51 |
| 49.9 | 29.3 | 0.070 | 1.81 | 1.65 | 0.86 | 1.17 | 1.15 | 0.55 | 0.56 |
| 49.9 | 18.6 | 0.051 | 1.03 | 1.07 | 0.51 | 0.79 | 0.78 | 0.34 | 0.34 |
| 50 | 29.8 | 0.050 | 1.36 | 1.41 | 0.67 | 1.00 | 0.98 | 0.43 | 0.44 |
| 50 | 18.6 | 0.063 | 1.22 | 1.19 | 0.60 | 0.88 | 0.86 | 0.40 | 0.40 |
| 69.3 | 43.7 | 0.063 | 4.72 | 4.74 | 2.40 | 3.52 | 3.31 | 1.42 | 1.64 |
| 69.7 | 16.5 | 0.070 | 2.89 | 2.84 | 1.43 | 2.33 | 2.23 | 0.99 | 1.04 |
| 69.8 | 35.4 | 0.076 | 4.89 | 4.83 | 2.60 | 3.71 | 3.49 | 1.58 | 1.78 |
| 70 | 43.8 | 0.052 | 4.50 | 4.46 | 2.14 | 3.32 | 3.12 | 1.26 | 1.46 |
| 70 | 36.3 | 0.053 | 4.19 | 4.13 | 1.99 | 3.16 | 2.98 | 1.21 | 1.37 |
| 70 | 35.9 | 0.065 | 4.64 | 4.52 | 2.31 | 3.47 | 3.27 | 1.40 | 1.59 |
| 70.1 | 44.1 | 0.075 | 5.39 | 5.41 | 2.90 | 4.02 | 3.78 | 1.70 | 1.97 |
| 70.1 | 17.4 | 0.053 | 2.56 | 2.61 | 1.21 | 2.14 | 2.05 | 0.83 | 0.89 |
| 70.4 | 17.3 | 0.064 | 2.81 | 2.90 | 1.42 | 2.38 | 2.28 | 0.98 | 1.04 |
| 73.5 | 38.1 | 0.078 | 6.06 | 6.08 | 3.28 | 4.70 | 4.37 | 1.93 | 2.26 |
| 73.6 | 42.7 | 0.077 | 6.28 | 6.45 | 3.48 | 4.90 | 4.54 | 2.01 | 2.39 |
| 74.1 | 43.8 | 0.064 | 5.97 | 6.12 | 3.13 | 4.64 | 4.29 | 1.79 | 2.16 |
| 74.8 | 39.9 | 0.054 | 5.47 | 5.55 | 2.68 | 4.29 | 3.96 | 1.56 | 1.87 |
| 74.8 | 39.6 | 0.063 | 6.00 | 5.99 | 3.04 | 4.64 | 4.28 | 1.77 | 2.11 |
| 74.9 | 19.8 | 0.078 | 4.25 | 4.40 | 2.24 | 3.65 | 3.45 | 1.51 | 1.68 |
| 75 | 20.6 | 0.054 | 3.69 | 3.79 | 1.74 | 3.14 | 2.96 | 1.16 | 1.30 |
| 75.1 | 20.4 | 0.064 | 4.03 | 4.12 | 1.98 | 3.42 | 3.22 | 1.33 | 1.49 |
| Average uncertainty [%]: | / | 3 | 50 | 24 | 27 | 69 | 65 | ||
Appendix A.3. Application Range of Existing Semi-Empirical Correlations–Vertical Plates
Table A2 shows the application range of the existing semi-empirical correlations M1–M5 for the calculation of the condensation mass flux in the case of vertical plates.

Table A2.
Application range of existing semi-empirical correlations M1–M5.
Table A2.
Application range of existing semi-empirical correlations M1–M5.
| M1 [22] |
|
| M2 [3] |
|
| M3 [3] |
|
| M4 [26] |
|
| M5 [25] |
|
Appendix A.4. Derivation of Equation for Calculating the Condensation Mass Flux on Horizontal Tubes
To obtain the condensation mass flux it is necessary to know the mass-transfer coefficient on the condensing surface. By introducing the Sherwood number, the corresponding average mass coefficient can be determined:
where is the average Sherwood number [/], D is the mass diffusivity [m2/s], and d is the tube’s outer diameter [m]. The condensation mass flux can be defined as follows:
where is the density of humid air, and is the density of humid air at the liquid–gas interface [kg/m3].
In this study, the following correlation for the Sherwood number is obtained from the work of Fouda et al. [13]. Their correlation was then modified and extended for a wider range of parameters and the condenser’s geometry based on our own experimental data.
Their experimental correlation for the average Sherwood number is defined as follows:
where Sc is the Schmidt number [/], Re is the Reynolds number [/], RH is the relative humidity [/], is the dew-point temperature of humid air [°C], is the tube wall temperature [°C], and is the temperature of humid air [°C] in the main flow.
The Reynolds number is defined as:
where is the humid-air velocity [m/s], d is the tube’s outer diameter [m], and is the dynamic viscosity of the humid air [kg/ms].
The Schmidt number can be expressed as:
By combining Equation (A29), Equation (A30) and Equation (A31), the equation for the condensate mass flux can be rewritten as follows:
The correlation of Fouda et al. [13] for determining the condensate mass flux on the horizontal tube is limited within the following ranges described in Table A4. Flow is assumed to be laminar, steady, and with constant physical properties. Their experimental correlation for an average Sherwood number could predict 72–75% of the experimental data within an uncertainty of ±25%.
Appendix A.5. Experimental and Theoretical Results–Horizontal Tubes and Range of Process Parameters Valid for Existing Correlation for Horizontal Tubes

Table A3.
Condensation mass fluxes obtained from our experiments and from theoretical calculations with the modified correlation from Fouda et al. [13] ( and the newly developed correlation at different parameters: temperature of humid air, temperature difference between humid air and the wall, and volumetric flow rate of the humid air for 3-tube row condenser, d = 40 mm, and 7-tube row condenser, d = 15 mm.
| 3-Tube Row Condenser, d = 40 mm | 7-Tube Row Condenser, d = 15 mm | ||||||||||
|---|---|---|---|---|---|---|---|---|---|---|---|
| Ta [°C] | Ta−Tw [K] | Ta [°C] | Ta−Tw [K] | ||||||||
| 36.5 | 24.6 | 0.049 | 1.44 | 4.85 | 1.15 | 29.8 | 17.6 | 0.061 | 0.89 | 6.98 | 0.90 |
| 53.6 | 35.7 | 0.064 | 3.50 | 8.92 | 3.83 | 30 | 17.6 | 0.070 | 1.08 | 7.28 | 0.99 |
| 57.3 | 35.5 | 0.064 | 4.47 | 9.31 | 4.45 | 30.2 | 8.9 | 0.070 | 0.67 | 3.71 | 0.60 |
| 57.5 | 33 | 0.074 | 4.53 | 9.13 | 4.67 | 49.8 | 24.9 | 0.052 | 2.39 | 11.18 | 2.80 |
| 59.9 | 24.7 | 0.074 | 4.25 | 7.34 | 4.29 | 49.6 | 24.2 | 0.063 | 2.81 | 11.57 | 3.10 |
| 60.9 | 26.2 | 0.065 | 4.39 | 7.55 | 4.28 | 50 | 24.1 | 0.071 | 3.19 | 12.02 | 3.40 |
| 54.3 | 31.5 | 0.064 | 3.42 | 8.00 | 3.60 | 69.9 | 37.8 | 0.054 | 8.58 | 22.47 | 8.78 |
| 58.7 | 34.1 | 0.064 | 4.75 | 9.14 | 4.56 | 70.0 | 37 | 0.065 | 9.69 | 23.48 | 9.83 |
| 41.7 | 27.4 | 0.050 | 1.28 | 5.66 | 1.61 | 69.7 | 36 | 0.077 | 10.25 | 24.02 | 10.61 |
| 44.6 | 12.4 | 0.050 | 1.06 | 2.73 | 1.04 | 75.1 | 40.5 | 0.054 | 11.53 | 26.33 | 11.34 |
| 62.4 | 37.6 | 0.062 | 5.53 | 10.42 | 5.53 | 74.7 | 39.1 | 0.065 | 12.25 | 26.88 | 12.28 |
| 70.2 | 37.6 | 0.054 | 7.31 | 11.44 | 6.98 | 72.8 | 37.3 | 0.078 | 11.83 | 26.34 | 12.39 |
| 69.7 | 36.2 | 0.065 | 7.69 | 11.65 | 7.55 | 49.9 | 16.8 | 0.052 | 1.94 | 7.76 | 2.14 |
| 69.9 | 35.1 | 0.077 | 8.69 | 11.99 | 8.28 | 50.1 | 16.8 | 0.063 | 2.31 | 8.26 | 2.45 |
| 74.7 | 45.2 | 0.054 | 9.22 | 14.48 | 9.33 | 49.8 | 16.3 | 0.071 | 2.53 | 8.31 | 2.56 |
| 74.7 | 43.6 | 0.065 | 10.31 | 14.87 | 10.24 | 70.1 | 30.4 | 0.054 | 7.83 | 18.82 | 7.76 |
| 74.7 | 42.2 | 0.078 | 11.17 | 15.34 | 11.30 | 70.2 | 30.3 | 0.065 | 8.64 | 19.94 | 8.77 |
| 70.1 | 33.9 | 0.054 | 7.03 | 10.48 | 6.54 | 69.7 | 29.2 | 0.077 | 9.28 | 20.19 | 9.37 |
| 69.7 | 32.5 | 0.065 | 7.53 | 10.66 | 7.08 | 74.8 | 33.1 | 0.054 | 10.44 | 22.23 | 9.94 |
| 69.9 | 31.3 | 0.076 | 8.31 | 10.89 | 7.72 | 75 | 32.4 | 0.065 | 11.33 | 23.26 | 11.16 |
| 74.9 | 36.5 | 0.054 | 9.08 | 12.28 | 8.36 | 72.7 | 31 | 0.079 | 10.50 | 22.71 | 11.17 |
| 75 | 35.4 | 0.064 | 9.64 | 12.67 | 9.21 | 70.2 | 14.7 | 0.054 | 4.44 | 10.14 | 5.00 |
| 75.2 | 34.2 | 0.078 | 10.56 | 13.14 | 10.29 | 69.7 | 14.1 | 0.065 | 5.03 | 10.24 | 5.36 |
| 69.8 | 16 | 0.054 | 4.39 | 5.50 | 4.07 | 69.9 | 13.9 | 0.076 | 5.36 | 10.65 | 5.90 |
| 69.9 | 15.5 | 0.065 | 4.92 | 5.68 | 4.51 | 75.2 | 17.9 | 0.054 | 7.11 | 13.49 | 7.06 |
| 69.9 | 15.2 | 0.077 | 5.33 | 5.88 | 4.96 | 75 | 17.2 | 0.065 | 7.72 | 13.75 | 7.68 |
| 75 | 19.5 | 0.054 | 6.19 | 7.34 | 5.81 | 74.9 | 16.6 | 0.079 | 8.11 | 14.10 | 8.44 |
| 75.2 | 19 | 0.065 | 6.83 | 7.64 | 6.47 | ||||||
| 75.2 | 18.2 | 0.078 | 7.31 | 7.80 | 7.10 | ||||||
| Average uncertainty [%]: | / | 35.6 | 5.7 | Average uncertainty [%]: | / | 61.5 | 4.7 | ||||

Table A4.
Range of process parameters valid for existing correlation for horizontal tubes [13].
Table A4.
Range of process parameters valid for existing correlation for horizontal tubes [13].
| Parameter | Range |
|---|---|
| Tube diameter | 40 |
| Tube length | 1000 |
| Humid-air inlet temperature [°C] | 29.8–75.2 |
| Temperature difference between humid air and the tube wall [K] | 5; 10 |
| Tube wall temperature [°C] | 11.9–58.3 |
| Reynolds number [/] | 2000–8000 |
| Relative humidity [%] | 60–95 |
Appendix A.6. Calculation of the Average Uncertainty between the Experimental and Theoretical Values
The average uncertainty between the experimentally obtained condensation mass fluxes and the mass fluxes determined by empirical correlations was calculated using the following equation:
where i starts at 1 and ends with N. The upper limit for the summation N represents the number of all the measurements performed on an individual condenser geometry.
Appendix A.7. Reference Measurements on Condensation Tumble Dryer
To obtain the average condensation mass flux for a condenser inside the condensation tumble dryer, three reference measurements were performed on a commercial condenser type tumble dryer with the conditioned cotton test load of 7000 g ±1%. All the tests were performed according to the standard procedure for tumble dryers, IEC 61121 (2013) [29]. Therefore, a walk-in thermostatic chamber was used to control the required ambient conditions of 23 ± 2 °C and 55 ± 5%. Before starting the drying process, the test load was wetted and spun dried with a washing machine to reach a required textile water content of 60% ±1% [30]. The test load was inserted into the drum in a particular order, always following the same procedure, as described by Gatarić et al. [31]. All the measurements were performed using the standard cotton-drying program (IEC 61121). After the drying process was complete, the water content of the textiles had to be equal to 0% ± 3% to be considered dry, otherwise the test was not considered valid [30]. Table A5 shows the following average values: temperature of humid air, temperature difference between bulk flow, and the condenser’s wall, volumetric flow rate of bulk flow, and condensation mass.

Table A5.
Average results obtained from three reference measurements on a commercially available condenser tumble dryer.
Table A5.
Average results obtained from three reference measurements on a commercially available condenser tumble dryer.
| Ta [°C] | Ta−Tw [K] | ||
|---|---|---|---|
| 73.8 | 27.4 | 0.038 | 1.72 |
Appendix A.8. Evaluation of Potential Condensers Inside a Condensation Tumble Dryer
The corrected models presented in Section 3.1 and Section 3.2 were used to evaluate potential condensers based on vertical plates and horizontal tubes for application in a commercial tumble dryer Therefore, the main goal of this section is to evaluate the performance of the condensers in terms of condensing mass-flux rates under the real operating conditions of a tumble dryer, which are as follows:
- Condenser inlet temperature of humid air Ta: 73.8 °C
- Condenser inlet relative humidity of humid air RH: 100%
- Temperature difference between humid air and the plate/tube wall Ta−Tw: 27.4 K
- Volume flow of humid air : 0.038 m3/s
The operating conditions were obtained with the reference measurements from a tumble dryer. The details of the reference-measurement procedures are described in Appendix A.7. The wall temperature is determined as the average of the measured temperatures over the entire length of the wall.
Based on Figure A1 it is clear that all three condensers based on tubes and plates exceed the performance of the existing condenser inside the condensation tumble dryer in terms of condensation mass-flux rates by more than 100%. The maximum value of the condensation mass flux can be obtained by a condenser with seven horizontal tubes with an outside diameter of 15 mm. A condenser with three horizontal tubes with an outer diameter of 40 mm achieves a 21% lower value of the condensation mass-flux rate compared to a condenser with seven tubes. For the condenser with vertical plates, the difference is 49%.
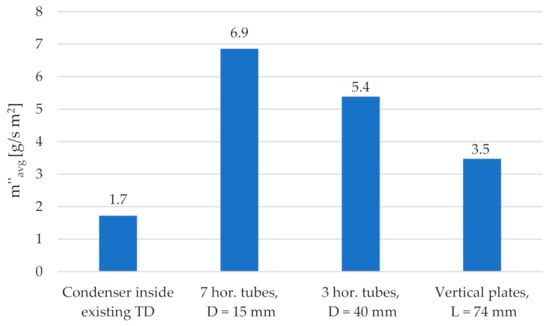
Figure A1.
Comparison of condensation mass-flux rates of tube- and plate-based condensers with the condenser inside the condensation tumble dryer under real operating conditions.
Appendix A.9. Parametric Analysis
Here we describe a comparison between all three presented geometries in terms of condensation mass fluxes for various inlet conditions, as listed in Table A6. The effects of the humid-air temperature and the temperature difference between the humid air and the wall on the condensation rate at different humid-air flow rates are examined and presented in Figure A2. The relationship between the condensation rate and the humid-air temperature at different flow rates for air ranges from 0.056 to 0.078 m3/s, showing that the air flow rate has almost no influence on the condensation process, which is also evident from Equations (3), (6), and (11). It is clear from Figure A2 that the temperature difference between the air and the tube wall has a remarkable effect on the condensation rate, which is even more noticeable at larger temperature differences between the air and the tube wall. Similar observations also apply to the vertical plates. Increasing the temperature difference as well as the air temperature enhances the rate of condensation, especially for air temperatures higher than 45 °C. This comparison proved that the seven-tube row condenser has the most suitable geometry of all three condensers. In the former situation, the condensation mass flux is higher for more densely distributed tubes with a smaller diameter than for a smaller number of tubes with a larger diameter. However, this must be taken with some consideration, as the employed Equations (5)–(11) apply only for laminar, steady-state air flow. Namely, if the tubes were to be arranged more closely together, the air flow would become more turbulent and different conditions would apply. In the former situation, the mass fluxes for the three-tube-row condenser are, on average, 13% lower than the condenser with a seven-tube row having a smaller diameter. On the other hand, the geometry with vertical flat plates demonstrates significantly lower mass fluxes, by 89% and 119%, compared with the geometries with three and seven tubes, respectively.

Table A6.
Range of parameters used for parametric analysis.
Table A6.
Range of parameters used for parametric analysis.
| Parameter | |
|---|---|
| Humid-air temperature (Ta) [°C] | 30–70 |
| Temperature difference between the humid air and the plates/tubes wall (Ta−Tw) [K] | 10; 26; 40 |
| Volume flow of the humid air () [m3/s] | 0.056; 0.078 |
| Absolute pressure (pa) [kPa] | 101.3 |
| Relative humidity of humid air RH [%] | 100 |
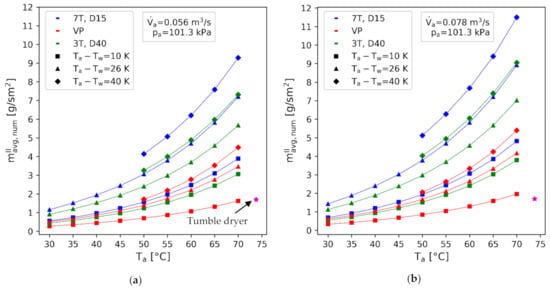
Figure A2.
Condensation mass fluxes, calculated on the basis of corrected correlations for the presented geometries based on three and seven tubes and vertical flat plates in relation to the temperature difference between the humid air and the tube/plate wall, humid-air temperature and volume flows of humid air of (a) 0.056 m3/h and (b) 0.078 m3/s. The magenta star denotes the condensation mass-flux rate of the existing condenser in the tumble dryer for process parameters described in Appendix A.7.
The existing condenser in the condensing tumble dryer achieved a condensation mass flux of m’’exp,avg = 1.7 g/s m2 for certain operating parameters described in Appendix A.8. This value is represented by the magenta star in Figure A2. The same condensation mass flux can be achieved with the condenser based on vertical plates in certain scenarios: either in the case of small temperature differences (around 10 K), where the temperature of the humid air should be around 70 °C. Additionally, the same rate can be achieved with a humid-air temperature above 50 °C, while ensuring larger temperature differences (40 K). On the other hand, the geometry based on tubes could enable similar values of the mass-flux rates at a significantly lower humid-air temperature and temperature differences between the humid air and the tube wall. At a temperature difference of 26 K, this rate could be exceeded at a much lower air temperature of 42.5 °C. The reduction of the air temperature at which textiles are tumble dried is of utmost importance, as high temperatures have been linked to increased damage to the fabric and the degradation of its mechanical properties [32]. This parametric study shows that by employing newly proposed geometries, tumble drying can be performed at significantly lower humid-air temperatures.
References
- Ma, X.-H.; Zhou, X.-D.; Lan, Z.; Li, Y.-M.; Zhang, Y. Condensation heat transfer enhancement in the presence of non-condensable gas using the interfacial effect of dropwise condensation. Int. J. Heat Mass Transf. 2008, 51, 1728–1737. [Google Scholar] [CrossRef]
- Cengel, Y.A.; Ghajar, A.J. Heat and Mass Transfer: Fundamentals and Applications, 5th ed.; McGraw-Hill Education: New York, NY, USA, 2015. [Google Scholar]
- Fujii, T. Theory of Laminar Film Condensation, 1st ed.; Springer: New York, NY, USA, 1991. [Google Scholar]
- Asano, K.; Nakano, Y.; Inaba, M. Forced convection film condensation of vapors in the presence of noncondensable gas on a small vertical flat plate. J. Chem. Eng. Jpn. 1979, 12, 196–202. [Google Scholar] [CrossRef]
- Li, C.; Li, J. Laminar Forced Convection Heat and Mass Transfer of Humid Air across a Vertical Plate with Condensation. Chin. J. Chem. Eng. 2011, 19, 944–954. [Google Scholar] [CrossRef]
- Karkoszka, K. Mechanistic Modelling of Water Vapour Condensation in Presence of Noncondensable Gases. Ph.D. Thesis, School of Engineering Sciences, KTH, Stockholm, Sweden, 2007. [Google Scholar]
- Bum-Jin, C.; Sin, K.; Chan, K.M.; Ahmadinejad, M. Experimental comparison of film-wise and drop-wise condensations of steam on vertical flat plates with the presence of air. Int. Commun. Heat Mass Transf. 2004, 31, 1067–1074. [Google Scholar] [CrossRef]
- Yi, Q.; Tian, M.; Fang, D. CFD simulation of air-steam condensation on an isothermal vertical plate. Int. J. Heat Technol. 2015, 33, 25–32. [Google Scholar] [CrossRef]
- Siow, E.C.; Ormiston, S.J.; Soliman, H.M. A two-phase model for laminar film condensation from steam-air mixtures in vertical parallel-plate channels. Heat Mass Transf. 2004, 40, 365–375. [Google Scholar] [CrossRef]
- Charef, A.; Feddaoui, M.; Alla, A.N.; Najim, M. Numerical study of humid air condensation in presence of non-condensable gas along an inclined channel. Energy Procedia 2017, 139, 128–133. [Google Scholar] [CrossRef]
- Saraireh, M.; Li, J.D.; Thorpe, G. Modelling of heat and mass transfer involving vapour condensation in the presence of non-condensable gases. In Proceedings of the 17th Australasian Fluid Mechanics Conference, Auckland, New Zealand, 5–9 December 2010. [Google Scholar]
- Gnielinski, V.V. Berechnung mittlerer Wärme- und Stoffübergangskoeffizienten an laminar und turbulent überströmten Einzelkörpern mit Hilfe einer einheitlichen Gleichung. Forsch. Ing. 1975, 41, 145–153. [Google Scholar] [CrossRef]
- Fouda, A.; Wasel, M.; Hamed, A.; Zeidan, E.-S.B.; Elattar, H. Investigation of the condensation process of moist air around horizontal pipe. Int. J. Therm. Sci. 2015, 90, 38–52. [Google Scholar] [CrossRef]
- Saleh, E.A. Detailed Two-Phase Modelling of Film Condensation on a Horizontal Tube. Ph.D. Thesis, University of Manitoba, Winnipeg, MB, Canada, 2016. [Google Scholar]
- Saleh, E.A.; Ormiston, S.J. An elliptic two-phase numerical model of laminar film condensation from a steam-air mixture flowing over a horizontal tube. Int. J. Heat Mass Transf. 2017, 112, 676–688. [Google Scholar] [CrossRef]
- Chen, C.-K.; Lin, Y.-T. Turbulent film condensation in the presence of non-condensable gases over a horizontal tube. Int. J. Therm. Sci. 2009, 48, 1777–1785. [Google Scholar] [CrossRef]
- Minko, K.B.; Yankov, G.G.; O Milman, O.; Krylov, V.S. A numerical model of forced convection condensation on a horizontal tube in the presence of noncondensables. J. Phys. Conf. Ser. 2017, 891, 12138. [Google Scholar] [CrossRef]
- Lee, W.C. Filmwise Condensation on a Horizontal Tube in the Presence of Forced Convection and Non-Condensing Gas. Ph.D. Thesis, University of London, London, UK, 1982. [Google Scholar]
- Lee, W.; Rose, J. Forced convection film condensation on a horizontal tube with and without non-condensing gases. Int. J. Heat Mass Transf. 1984, 27, 519–528. [Google Scholar] [CrossRef]
- EN ISO 5801:2017. Fans—Performance Testing Using Standardized Airways (ISO 5801:2017); International Organization for Standardization (ISO): Geneva, Switzerland, 2018.
- SIST EN ISO 5167-2:2004. Measurement of Fluid Flow by Means of Pressure Differential Devices Inserted in Circular Cross-Section Conduits Running Full—Part 2: Orifice Plates (ISO 5167-2:2003); Slovenian Institute for Standardization (SIST): Ljubljana, Slovenia, 2003.
- Corradini, M.L. Turbulent Condensation on a Cold Wall in the Presence of a Noncondensable Gas. Nucl. Technol. 1984, 64, 186–195. [Google Scholar] [CrossRef]
- Uchida, H.; Oyama, A.; Togo, Y. Evaluation of Post-Incident Cooling Systems of Light Water Power Reactors; Tokyo University: Tokyo, Japan, 1964. [Google Scholar]
- Tagami, T. Interim Report on Safety Assessments and Facilities Establishment Project in Japan for Period Ending June 1965 (No. 1). Prepare for the National Reactor Testing Station February 28, 1966, (Unpublished work).
- Liao, Y.; Vierow, K. A Generalized Diffusion Layer Model for Condensation of Vapor with Noncondensable Gases. J. Heat Transf. 2007, 129, 988–994. [Google Scholar] [CrossRef]
- Kim, M.; Corradini, M. Modeling of condensation heat transfer in a reactor containment. Nucl. Eng. Des. 1990, 118, 193–212. [Google Scholar] [CrossRef]
- Kirch, W. (Ed.) Pearson’s Correlation Coefficient. In Encyclopedia of Public Health; Springer: Dordrecht, The Netherlands, 2008; pp. 1090–1091. [Google Scholar]
- Bell, I.H.; Wronski, J.; Quoilin, S.; Lemort, V. Pure and Pseudo-pure Fluid Thermophysical Property Evaluation and the Open-Source Thermophysical Property Library CoolProp. Ind. Eng. Chem. Res. 2014, 53, 2498–2508. [Google Scholar] [CrossRef] [PubMed]
- SIST EN 61121:2013/A11:2019. Tumble Dryers for Household Use—Methods for Measuring the Performance; Slovenian Institute for Standardization (SIST): Ljubljana, Slovenia, 2019.
- Petelin, N.; Gataric, P.; Kitanovski, A.; Poredoš, A. Modelling and experimental evaluation of a condenser for a heat-pump tumble dryer. In Proceedings of the 25th IIR International Congress of Refrigeration, Montréal, QC, Canada, 24–30 August 2019. [Google Scholar]
- Gatarić, P.; Širok, B.; Hočevar, M.; Novak, L. Modeling of heat pump tumble dryer energy consumption and drying time. Dry. Technol. 2018, 37, 1396–1404. [Google Scholar] [CrossRef]
- Buisson, Y.; French, A.; Conrad, D.; Roy, P.; Rajasekaran, K. Qualitative and Quantitative Evaluation of Cotton Fabric Damage by Tumble Drying. Text. Res. J. 2000, 70, 739–743. [Google Scholar] [CrossRef]
Publisher’s Note: MDPI stays neutral with regard to jurisdictional claims in published maps and institutional affiliations. |
© 2021 by the authors. Licensee MDPI, Basel, Switzerland. This article is an open access article distributed under the terms and conditions of the Creative Commons Attribution (CC BY) license (https://creativecommons.org/licenses/by/4.0/).