Article

Developing a Decision Tree Algorithm for Wind Power Plants Siting and Sizing in Distribution Networks

by
Santosh Ghimire
and
Seyed Morteza Alizadeh
*
Engineering Institute of Technology, Faculty of Electrical Engineering and Industrial Automation, Melbourne, VIC 3000, Australia
*
Author to whom correspondence should be addressed.
Energies 2021, 14(8), 2293; https://doi.org/10.3390/en14082293
Submission received: 24 March 2021 / Revised: 14 April 2021 / Accepted: 16 April 2021 / Published: 19 April 2021
(This article belongs to the Special Issue Future Wind Power Plants: Challenges and Developments)

Abstract

:
The interconnection of wind power plants (WPPs) with distribution networks has posed many challenges concerned with voltage stability at the point of common coupling (PCC). In a distribution network connected WPP, the short-circuit ratio (SCR) and impedance angle ratio seen at PCC (X/RPCC) are the most important parameters, which affect the PCC voltage (VPCC) stability. Hence, design engineers need to conduct the WPP siting and sizing assessment considering the SCR and X/RPCC seen at each potential PCC site to ensure that the voltage stability requirements defined by grid codes are provided. In various literature works, optimal siting and sizing of distributed generation in distribution networks (DG) has been carried out using analytical, numerical, and heuristics approaches. The majority of these methods require performing computational tasks or simulate the whole distribution network, which is complex and time-consuming. In addition, other works proposed to simplify the WPP siting and sizing have limited accuracy. To address the aforementioned issues, in this paper, a decision tree algorithm-based model was developed for WPP siting and sizing in distribution networks. The proposed model eliminates the need to simulate the whole system and provides a higher accuracy compared to the similar previous works. For this purpose, the model accurately predicts key voltage stability criteria at a given interconnection point, including VPCC profile and maximum permissible wind power generation, using the SCR and X/RPCC values seen at that point. The results confirmed the proposed model provides a noticeable high accuracy in predicting the voltage stability criteria under various validation scenarios considered.

1. Introduction

Wind power is one of the most sustainable, abundant and cost-effective energy sources [1,2]. A large portion of wind power is being injected into distribution systems through small wind power plants (WPPs). According to voltage regulation requirements defined by grid codes in various countries, such as Australia, the UK and Canada, the interconnection of WPPs to distribution networks must ensure that the steady-state voltage at the point of common coupling (PCC) is maintained between 95% and 105% of the rated grid voltage [3]. At a given distribution network connected WPP, the steady-state voltage at the PCC (VPCC) is significantly impacted by short circuit capacity (SCC), short circuit ratio (SCR) and overall system impedance angle ratio seen at that site expressed by the X/RPCC. These parameters are explained as follows:
  • SCC: The amount of power that flows through a specified point when a short-circuit fault occurs at that point is expressed by SCC. The value of SCC depends on rated voltage (Vrated) and short-circuit impedance (Zsc) and is given as in (1) [4].
    SCC = 3 2 × V rated × I sc = 3 2 V rated 2 Z sc
  • SCR: The ratio between the grid’s SCC and the power injected by WPP is given by SCR. At the PCC bus of a distribution system connected to WPP, SCR quantifies the bus strength against the power quality issues caused by the wind power penetration. The value of SCR is calculated, as shown in (2) [4].
    SCR = SCC P wind
Given that wind turbine generators are generally installed on areas located far from the distribution substation, e.g., hilltops and close by the ocean, the output electrical power is transmitted to the grid through long lines. This results in large short-circuit impedance (Zsc) and small SCC and SCR [1,5]. Typically, the SCR value is less than 10 in distribution grid-connected WPPs. The small range of SCR, in turn, causes high voltage variations and power Quality issues at the PCC [4]. Hence, there is a tradeoff between the value of SCR and the voltage stability in distribution systems connected to WPP.
  • X/RPCC: The grid impedance angle ratio seen at the PCC bus is defined by the X/RPCC. The value of the X/RPCC is determined by the ratio of Thevenin equivalent reactance and Thevenin equivalent resistance seen from that specified point [4]. The internal reactance of distribution lines is small, making the equivalent X/R value seen at the PCC small. The majority of existing approaches proposed for mitigating the voltage stability issues through reactive power compensation are applicable to power transmission networks where the X/R ratio is large [6]. Hence, these methods are not appropriate for distribution networks.
Given the significance of the three aforementioned parameters in the PCC voltage stability in distribution systems connected to WPP, designers should select an optimal PCC site where the values of SCC and X/RPCC ensure the VPCC stability requirements defined by the grid codes. In addition, given the relation between wind power penetration and SCR, engineers need to define the maximum power that can be injected by WPP, ensuring that VPCC is maintained within the standard range, i.e., 0.95 pu < VPCC < 1.05 pu.
Different approaches have been proposed in the literature for siting and sizing of distributed generators (DGs) in distribution networks. Authors in [7] applied analytical methods for sizing and siting of DGs to minimize power losses in the system. Such analytical methods require calculating the system bus impedance matrix, the inverse of bus admittance matrix and Jacobean matrix. Given the large size of distribution networks, calculating these matrices is computationally demanding [1]. In [8], A. Keane and M. O’Malley proposed linear programming (LP)-based DG allocation method for harvesting maximum DG energy and minimizing the voltage variations in an Irish 38-KV seven-bus radial distribution network. Mixed-integer nonlinear programming (MINLP)-based method has been studied in [9] to determine the optimal combination of different renewable DGs with minimum power loss in an IEEE-RTS 41-bus test system. Similarly, dynamic programming (DP) has been utilized in [10] for optimal allocation of DGs for power-loss reduction and reliability improvement in a 9-bus radial test distribution system. The main drawback of the methods proposed in [8,9,10] is that the methods rely on simulation of the whole distribution system, which is a complicated and time-consuming task and requires specifications of each system component [11].
Heuristics methods have been commonly used in optimal distributed generation placement (ODGP) because of their simplicity, generality, flexibility and superiority in solving optimization problems [12]. Ali et al. in [13] investigated four DG sizing and siting methods based on simulated annealing (SA), variable search environment descending (VSED), genetic algorithm (GA) and hybrid genetic algorithm (HGA) to minimize the power loss and improve the voltage profile in IEEE standard 34 bus test distribution. Similarly, particle swarm optimization (PSO) has been applied for sizing and sitting of DGs in [14] to improve voltage profile and minimize the cost of power losses in four different bus systems: 12-, 15-, 33- and 69-bus system. Ant colony optimization (ACO) has been utilized in [12] to determine the optimal sizing and placement of multiple DGs using a 69-bus distribution system. Artificial bee colony (ABC) algorithm has been proposed for optimal placement and sizing of DGs in [15] for improvement of voltage profile in IEEE 33, 69 and 229 bus system. In addition, other heuristics methods, such as harmony search (HS), differential evolution (DE), Tabu search (TS) etc., have been applied for DG optimal sizing and siting. These methods can deal with large and complex ODGP and provide a near-optimal solution. However, similar to the previous analytical methods discussed earlier, the heuristic methods also rely on simulation of a whole distribution system, which is complex and time-consuming [11]. Moreover, the accuracy of the heuristic methods depends on the tuning of optimization parameters, such as crossover and mutation in GA [13], acceleration constants (c1, c2) in PSO [14], etc. Improper tuning of these parameters may lead to higher computational effort and adversely affect the accuracy of the prediction [4]. In addition, using analytical approaches and artificial intelligence (AI)-based methods for WPP siting and sizing produces unrealistic results as the reactive power exchanged between the grid and WPP is considered to be zero in these methods [4].
To address the aforementioned issues related to using analytical and AI-based methods, it is required to simplify the WPP sizing and siting in distribution systems using more efficient and accurate approaches. As a suitable approach for WPP sizing in the distribution systems, the author in [5] developed a mathematical relation between VPCC and SCR for a test system with 0 ≤ SCR ≤ 2.5. Referring to [5], VPCC can be taken as a quadratic function of SCR. However, the equation proposed in [5] did not consider the relation between VPCC and X/RPCC ratio. Given the significant effect of the X/RPCC ratio on VPCC stability, the lack of consideration of the relationship between these parameters adversely impacts the accuracy and validation of the relation proposed in [5]. In addition, in the majority of actual distribution networks, the SCR value is more than 2.5 [16]. Given that the mathematical model has been tested for 0 ≤ SCR ≤ 2.5, the validity of the proposed relation in [5] for a system with SCR > 2.5 is ambiguous. The aforementioned issues concerned with the mathematical relation proposed in [5] were addressed and removed by a more comprehensive mathematical model proposed in our previous work presented in [1]. The model expressed the mathematical relation between the VPCC variation, SCR and X/RPCC ratio for various test distribution networks connected to induction generator (IG) and doubly-fed induction generator (DFIG)-based WPPs. For IG-based WPPs, two mathematical relations were developed regarding the range of the X/RPCC: an exponential function for WPPs with the X/RPCC < 2 and a quadratic function for WPPs with the X/RPCC > 2. Furthermore, for DFIG-based WPPs, a mathematical relation was developed considering that the X/RPCC < 2. The mathematical method presented in [1] is one of the most valuable and comprehensive approaches expressing the relationships between VPCC and the main PCC parameters of distribution network connected WPPs. Such a mathematical model enables the prediction of the key VPCC stability criteria, including VPCC profile, step-VPCC variation and maximum permissible size of WPP. Taking advantage of the predicted VPCC parameters, the design engineers can easily find the best bus for the interconnection of a WPP without carrying out complex and time-demanding computational tasks and simulating the test systems. However, the results obtained in [1] demonstrated that the accuracy of the mathematical relations is adversely impacted when SCR and X/RPCC ratios are small. In addition, for IG-based WPPs, the accuracy of the proposed relations is low when the X/RPCC is around 2. Hence, although the method proposed in [1] simplifies the WPP siting and sizing process compared to the other existing methods, its accuracy is impacted by small SCR and X/RPCC ratios, which, in turn, limits the method applicability. To address this issue and increase the prediction accuracy, the mathematical model proposed in [1] was replaced by a decision tree algorithm-based method in this paper. Therefore, in this work, a decision tree algorithm method was developed to model the relation between VPCC variation (dVPCC), SCR and X/RPCC. The input parameters of the proposed decision tree-based model are SCR and X/RPCC, which are the baseline characteristics of distribution feeders and easily available in any power system network. Using the values of input parameters, the model precisely predicts the Pwind-dVPCC characteristic, which can then be used for optimal WPP siting and sizing. The decision tree algorithm is one of the supervised learning algorithms and can be implemented for regression and classification problems [17]. The accuracy of the decision tree algorithm in predicting output parameters is enhanced by training decision trees with a large training data set [17]. In this study, the X/RPCC-dVPCC data points were initially obtained using simulation test systems with different SCR values. Later on, the simulation results were extended to enlarge the training data set. The extended data were then used to develop the decision tree algorithm-based model. The proposed decision tree-based model enables to plot Pwind versus dVPCC and provides the design engineer with insightful information to carry out an initial predictive assessment on the key power quality parameters at the PCC of WPPs, including VPCC profile, and maximum permissible power can be injected into the distribution network (Pwind_max). Taking advantage of the power quality parameters predicted by the proposed decision tree algorithm, WPP planning engineers can easily estimate the optimal size of WPP and select the most appropriate site for the interconnection of WPP to distribution networks where the voltage stability requirements defined by the grid codes are provided with very high accuracy. Hence, the main contribution of this work to the existing knowledge is to simplify the WPP sizing and siting analysis as well as achieving a noticeable higher accuracy compared to the similar methods recently published in the literature. The aims of this study were to:
  • Develop a novel voltage stability decision tree algorithm-based model predicting the key power quality components at a given PCC bus, i.e., VPCC and Pwind, based on the values of SCR and X/RPCC seen at that bus;
  • Simplify the siting and sizing of IG- and DFIG-based WPPs in weak distribution network;
  • Increase the prediction accuracy compared to the voltage stability mathematical model presented in [1].
The paper structure is as follows: Section 2 outlines and discusses the methodology and different steps followed to develop the decision tree algorithm-based model. Section 3 presents the validation results obtained and compares the accuracy of the proposed model with similar previous techniques. Section 4 explains the significance and novelty of the work and its application in predicting the key voltage stability criteria and analyzing the WPP siting and sizing. Finally, Section 5 summarizes the highlights of this work.

2. Methodology

The overall methodology used in developing the decision tree algorithm for predicting the aforementioned power quality parameters is presented as follows:
  • Data collection and extension: In this study, the X/RPCC-dVPCC characteristics were required for test systems with different SCR ratios. For this purpose, the X/RPCC-dVPCC data points were obtained simulating the test systems from authors’ previous work presented in [1]. As discussed earlier, the higher accuracy of the prediction can be achieved by increasing the number of data points. However, the size of simulation data obtained by the test systems is small due to the limited capability of the MATLAB/Simulink solver in providing X/RPCC-dVPCC data points. Hence the obtained simulation data were then extended to obtain large training data set. In this work, the extension of simulation data was conducted using Microsoft Excel.
  • Developing decision tree algorithm: The extended data were then trained in the decision tree in the MATLAB (version 2014a developed by MathWorks) to formulate a model for predicting dVPCC using the values of SCR and X/RPCC. Boosted regression decision tree was utilized to predict the voltage profile from given network parameters (SCR and X/RPCC).

2.1. Data Collection and Extension

Modeling of decision tree requires a training data set based on which it creates a model for the prediction of unknown feature from known features [18]. The aim of this study was to develop a model that predicts voltage variations in response to changes in wind power generation (Pwind) at a given PCC bus with specific SCC and X/R values. Hence, to develop such a predictive model, it is required to obtain a training data set, which includes X/RPCC-dVPCC values for a range of SCR ratios. In this study, the initial training data set was obtained using four simulation test systems considered in the authors’ previous work presented in [1]. The test systems were simulated based on the IEEE 9-bus and IEEE 37-bus distribution network models. Given that the power quality issues in distribution network-connected WPPs are mainly related to the PCC sites with SCR < 10, the SCR range considered in this study is 4 < SCR < 10. In addition, the range of the X/RPCC considered is based on the analysis results gained using actual distribution systems presented in [19].
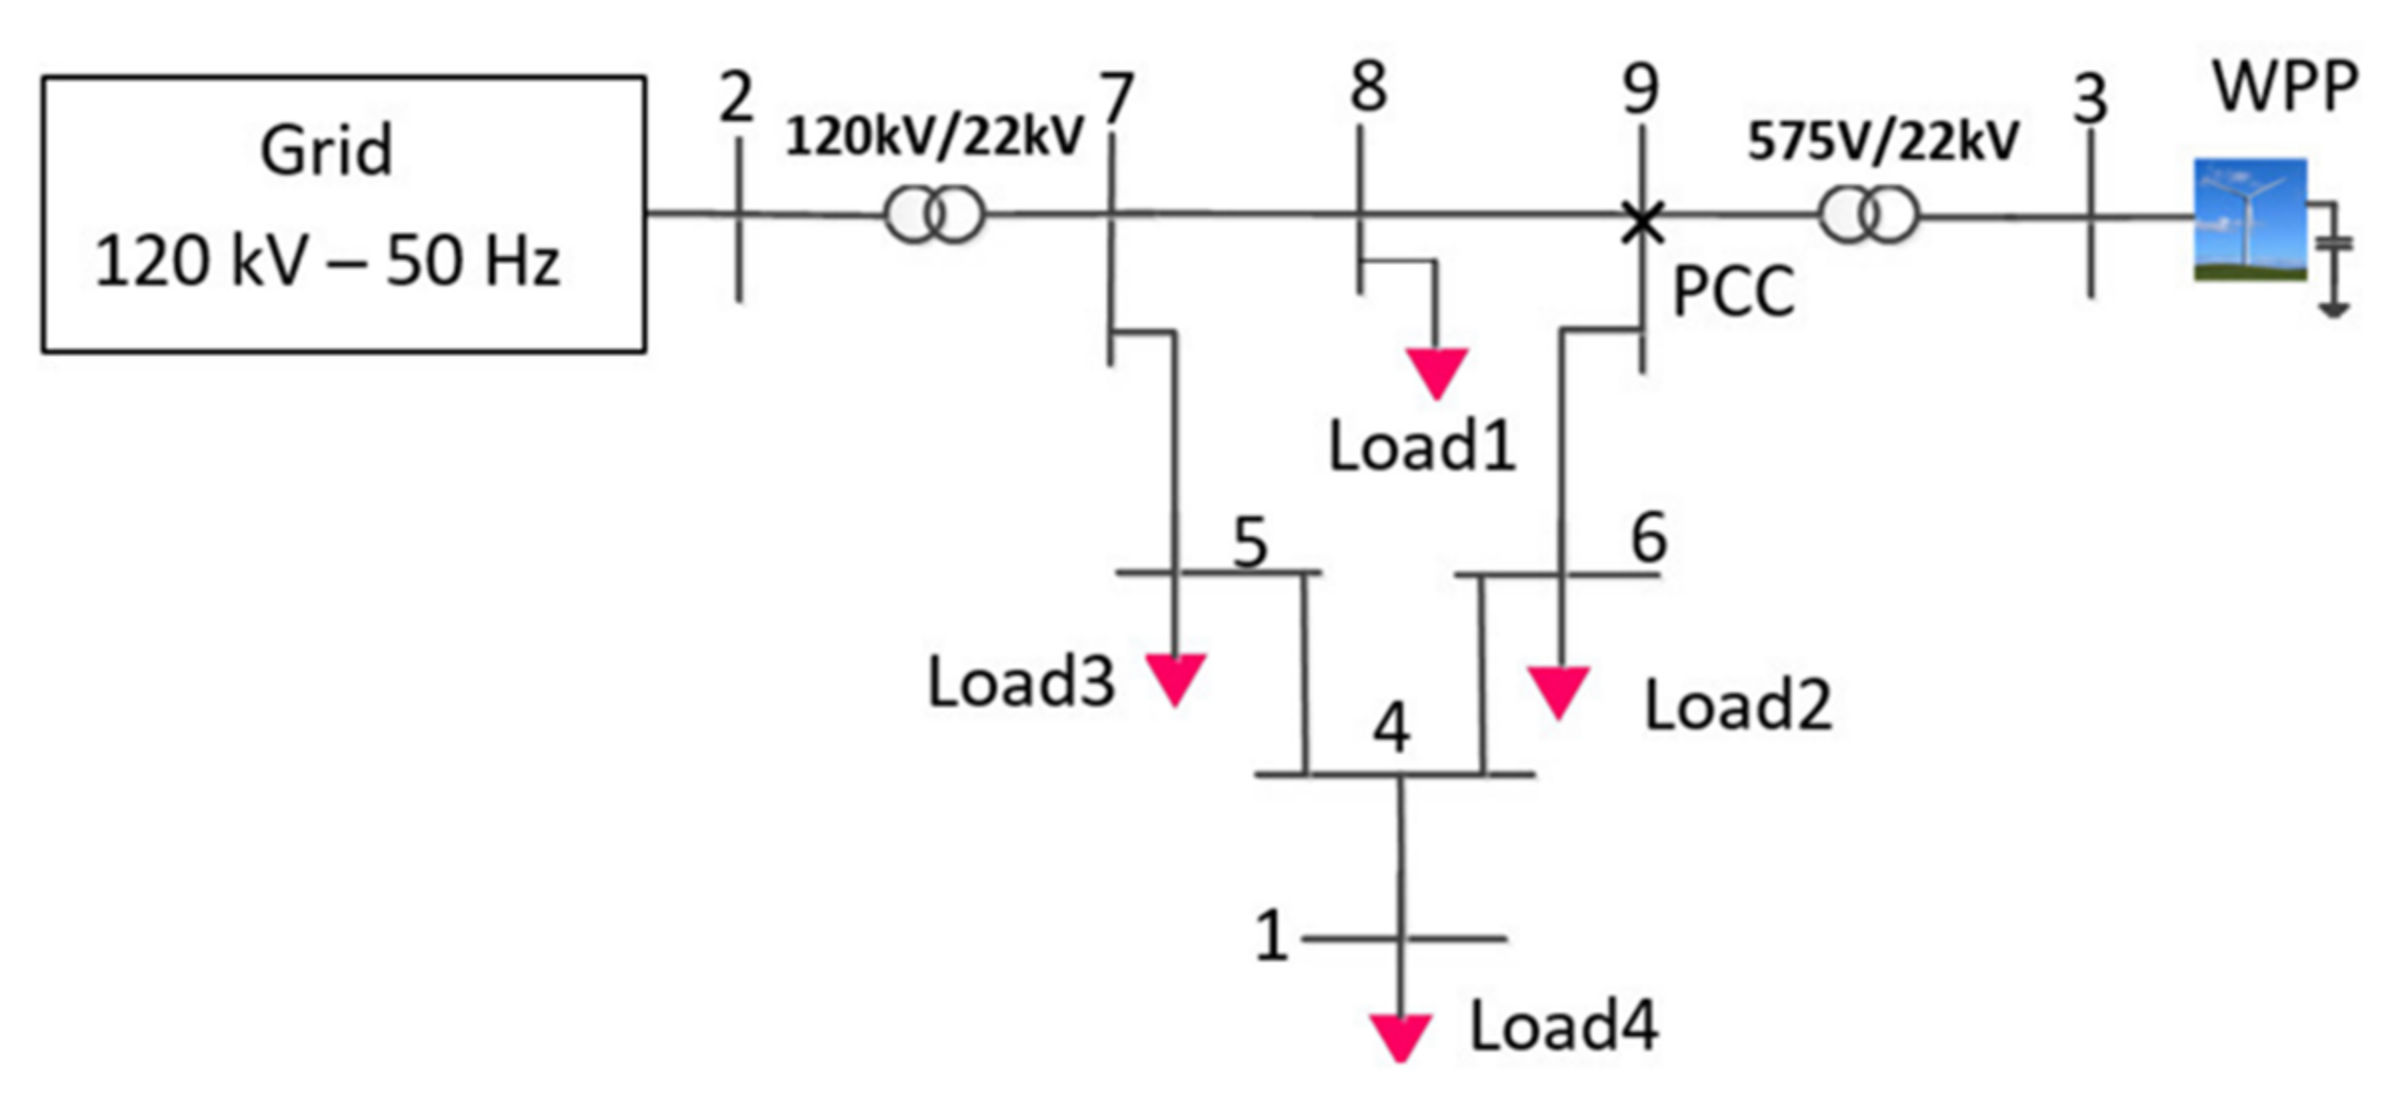
In this study, the analysis was carried out for both IG and DFIG-based WPP. Figure 1 and Figure 2 show the single-line block diagram of the test systems. The specifications of the test systems were discussed and presented in the authors’ previous work available in [1].
As shown in Figure 1 and Figure 2, the PCC site in the 37-bus and 9-bus test systems are Bus 6 and Bus 9, respectively. The lengths of the lines are different among the four test systems considered resulting in different SCC and SCR values. For each test system, the SCC, Pwind and the corresponding SCR values are as presented in Table 1.
From Table 1, it can be observed that Test 1 is weaker than the other test systems as it has the lowest SCR value. On the other hand, the highest SCR value is related to Test 4, making this test system stiffer than the other systems considered.
For each test system shown in Table 1, the X/RPCC ratio was changed to monitor the corresponding VPCC value, while the values of SCC, Pwind and SCR are constant. Having the X/RPCC-dVPCC data points, the VPCC variation was calculated using (3).
dV PCC = V PCC V initial ,
where VPCC signifies the PCC voltage value after the Pwind is generated and injected into the test distribution systems and Vinitial is the PCC voltage value before the WPP connection when the Pwind = 0.
Referring to [1], the Vinitial value at the PCC of test systems was considered to be 0.98 p.u.
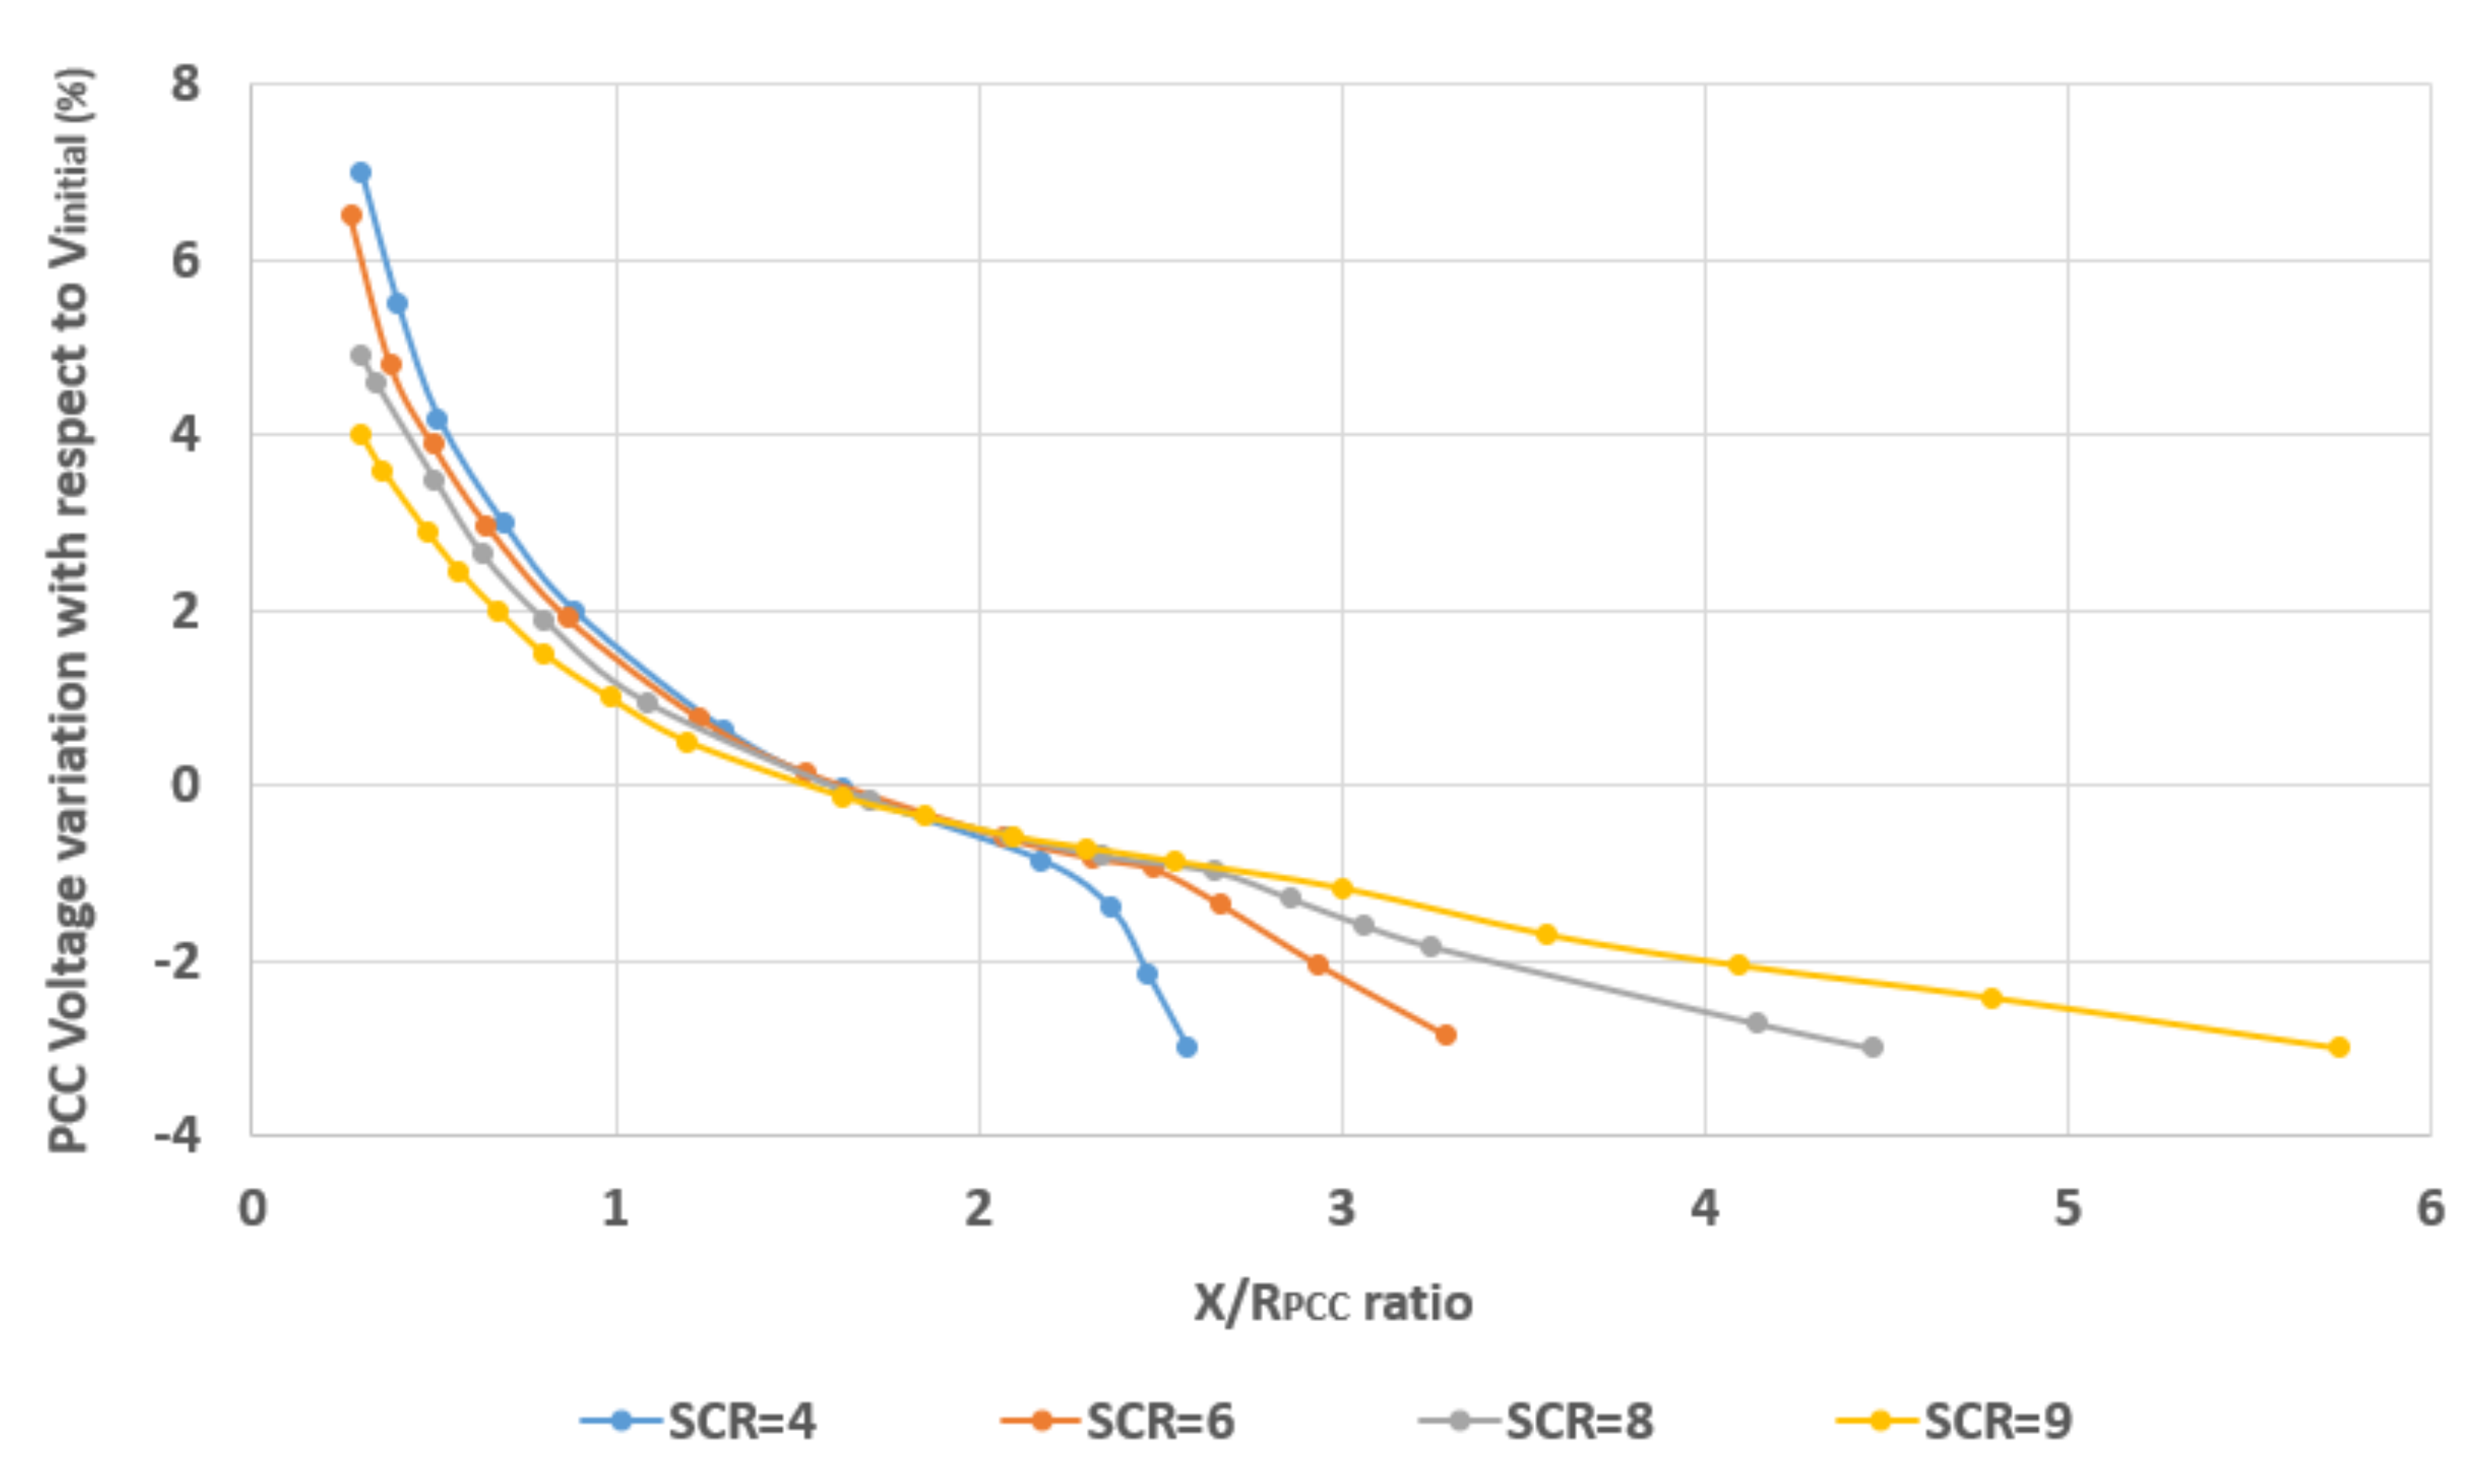
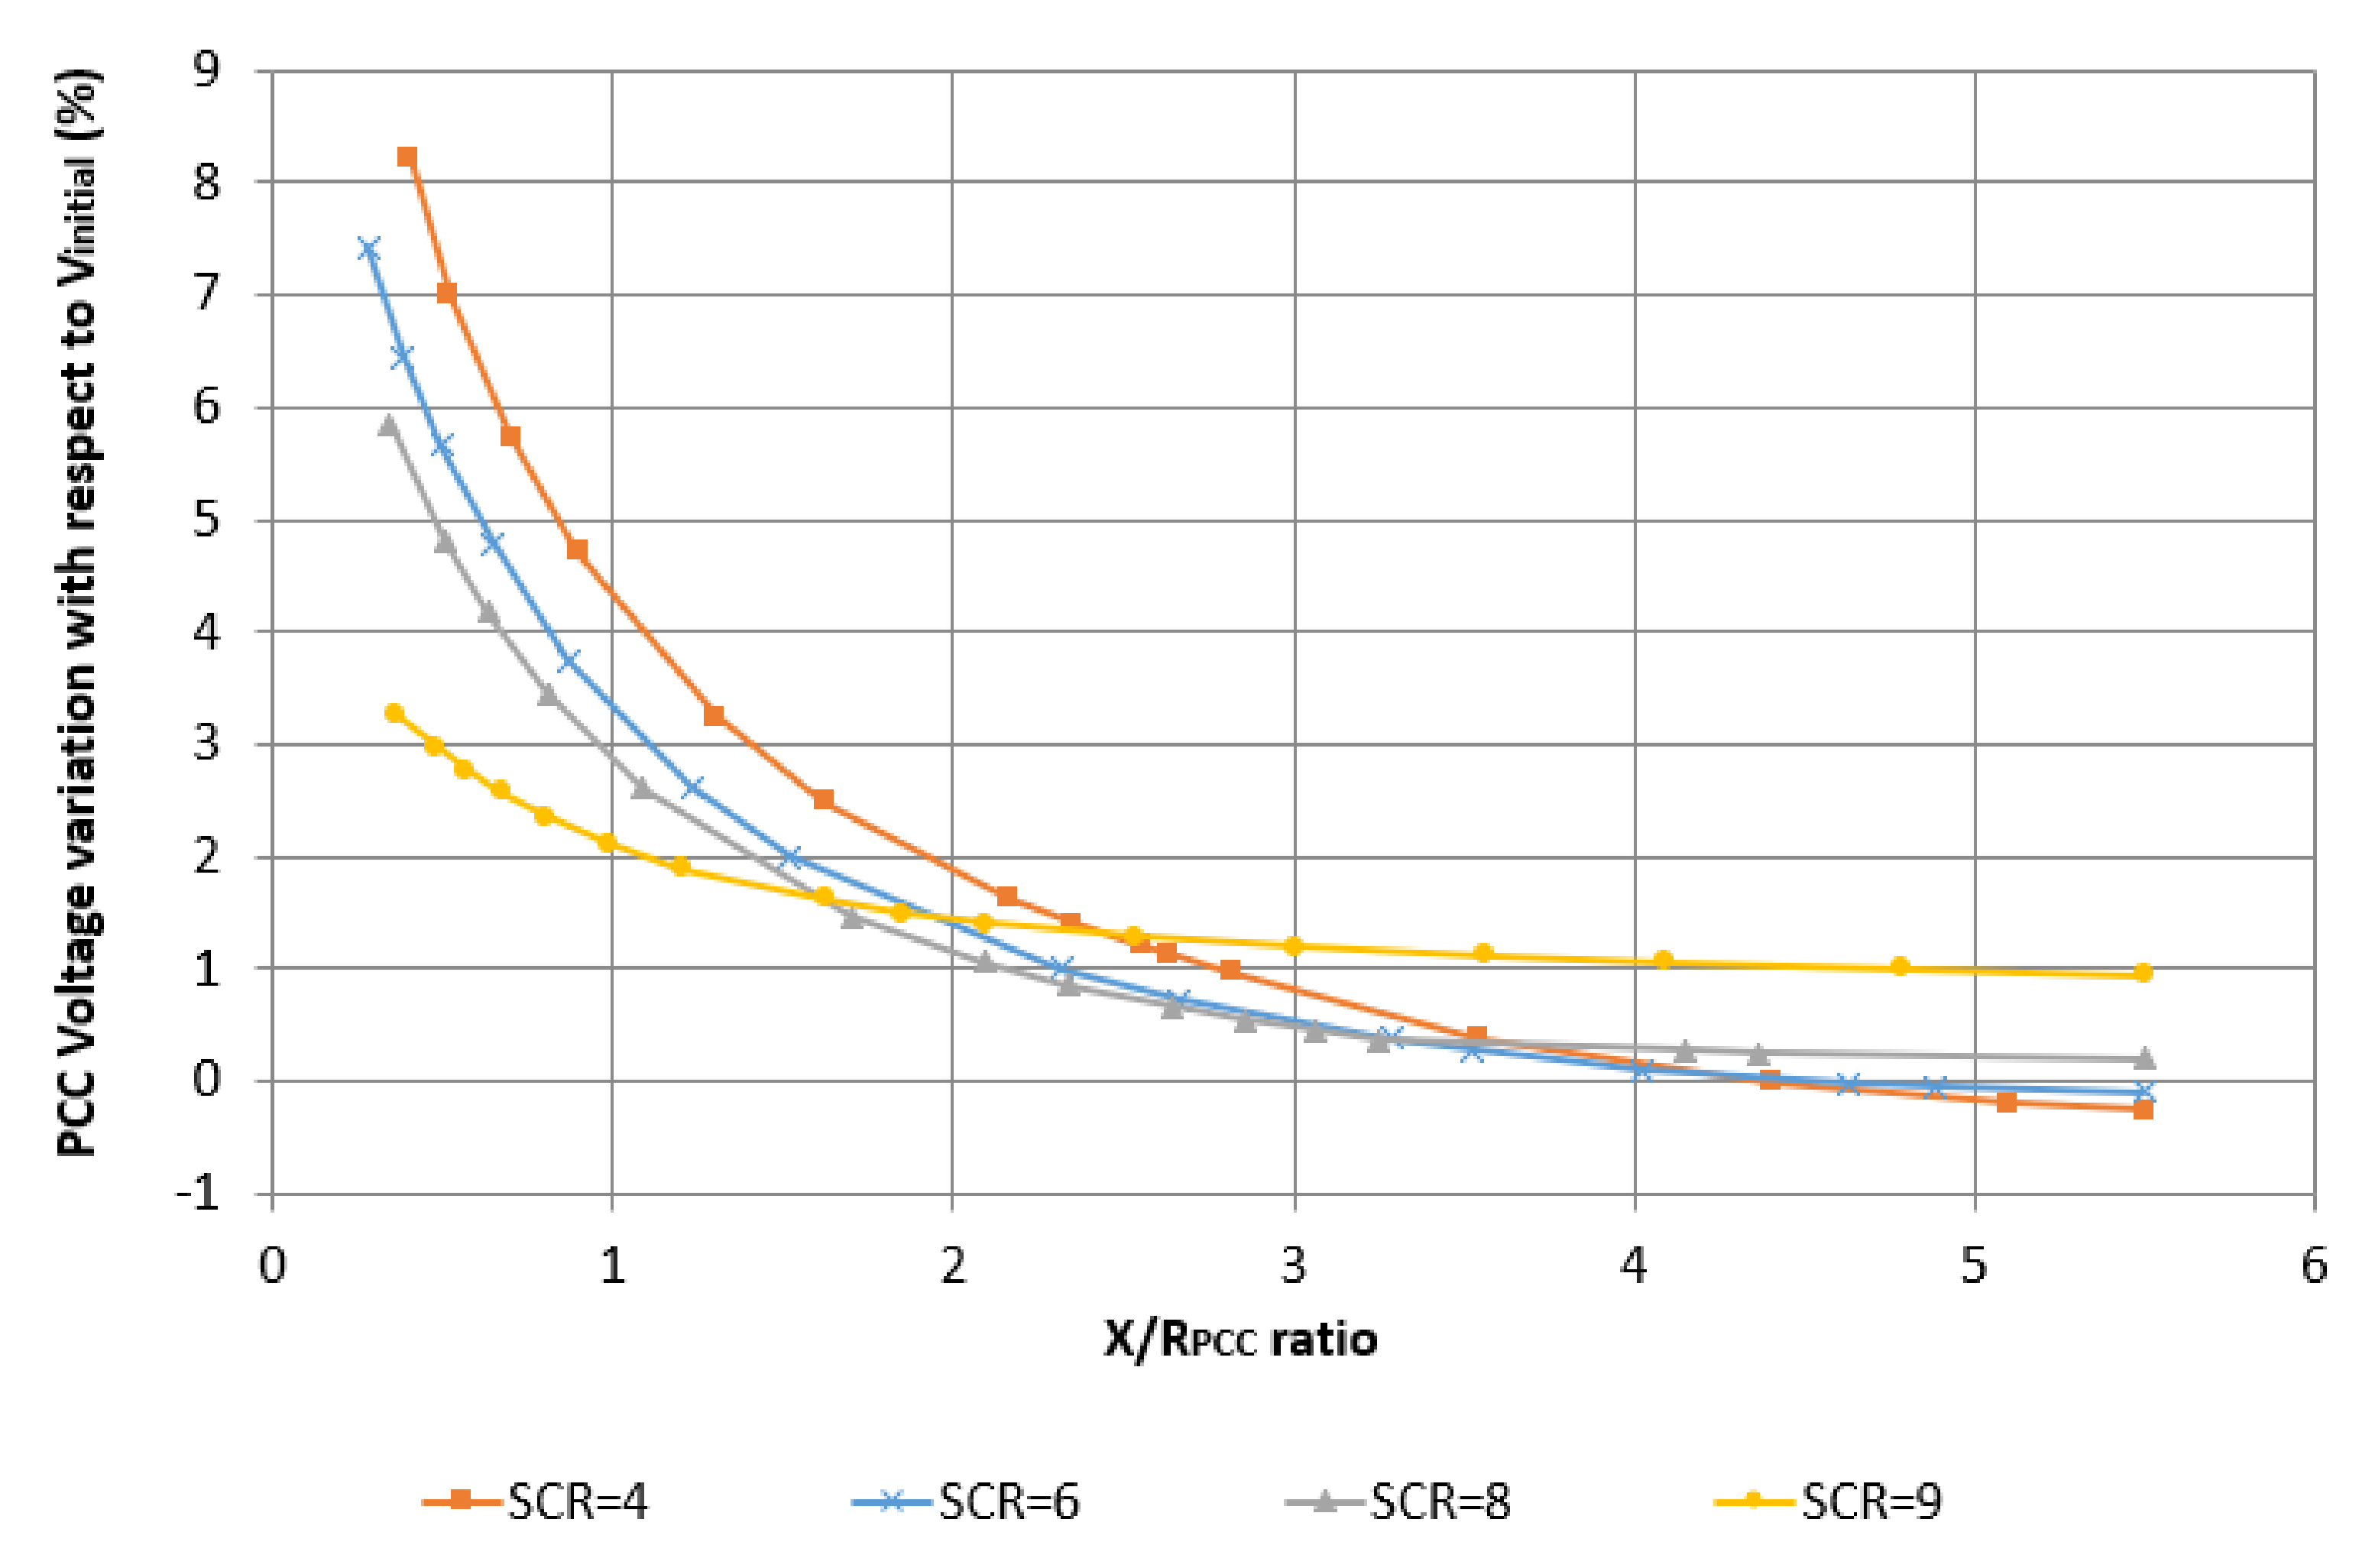
Figure 3 and Figure 4 show the X/RPCC-dVPCC characteristics for the IG and DFIG-based test WPPs, respectively.
As discussed, for the X/RPCC-dVPCC curve characteristics presented in Figure 3 and Figure 4, the mathematical functions of graphs with the best fit were developed in [1]. However, as discussed by the authors in [1], the prediction error of the method presented in [1] is high for interconnection points with a small SCC, SCR and X/RPCC ratio. In this study, the mathematical model developed in [1] was replaced by a decision tree algorithm to improve the prediction accuracy. The algorithm was developed using the X/RPCC-dVPCC data points presented in Figure 3 and Figure 4. As discussed earlier, to obtain the X/RPCC-dVPCC data points, in each simulation test system with the characteristics shown in Table 1, the X/RPCC ratio was changed, and the corresponding dVPCC was monitored. However, MATLAB/Simulink solver was not able to show the difference in dVPCC value when the X/RPCC was slightly changed. For example, when the X/RPCC was changed by 1%, the dVPCC value obtained by the simulation models was constant, meaning that the change in the X/RPCC was not reflected in the dVPCC value. The limited capability of the MATLAB/Simulink solver in providing exclusive dVPCC value for each X/RPCC value resulted in collecting a small number of the X/RPCC-dVPCC data points. Hence, only 15 data points were obtained from each simulation test system. On the other hand, the prediction accuracy of the algorithm is increased if the larger data set is used to train the decision tree algorithm [17]. Given that the number of data points obtained by the simulation models is not sufficient for training the decision tree algorithm, the data were extended to obtain large training data set.
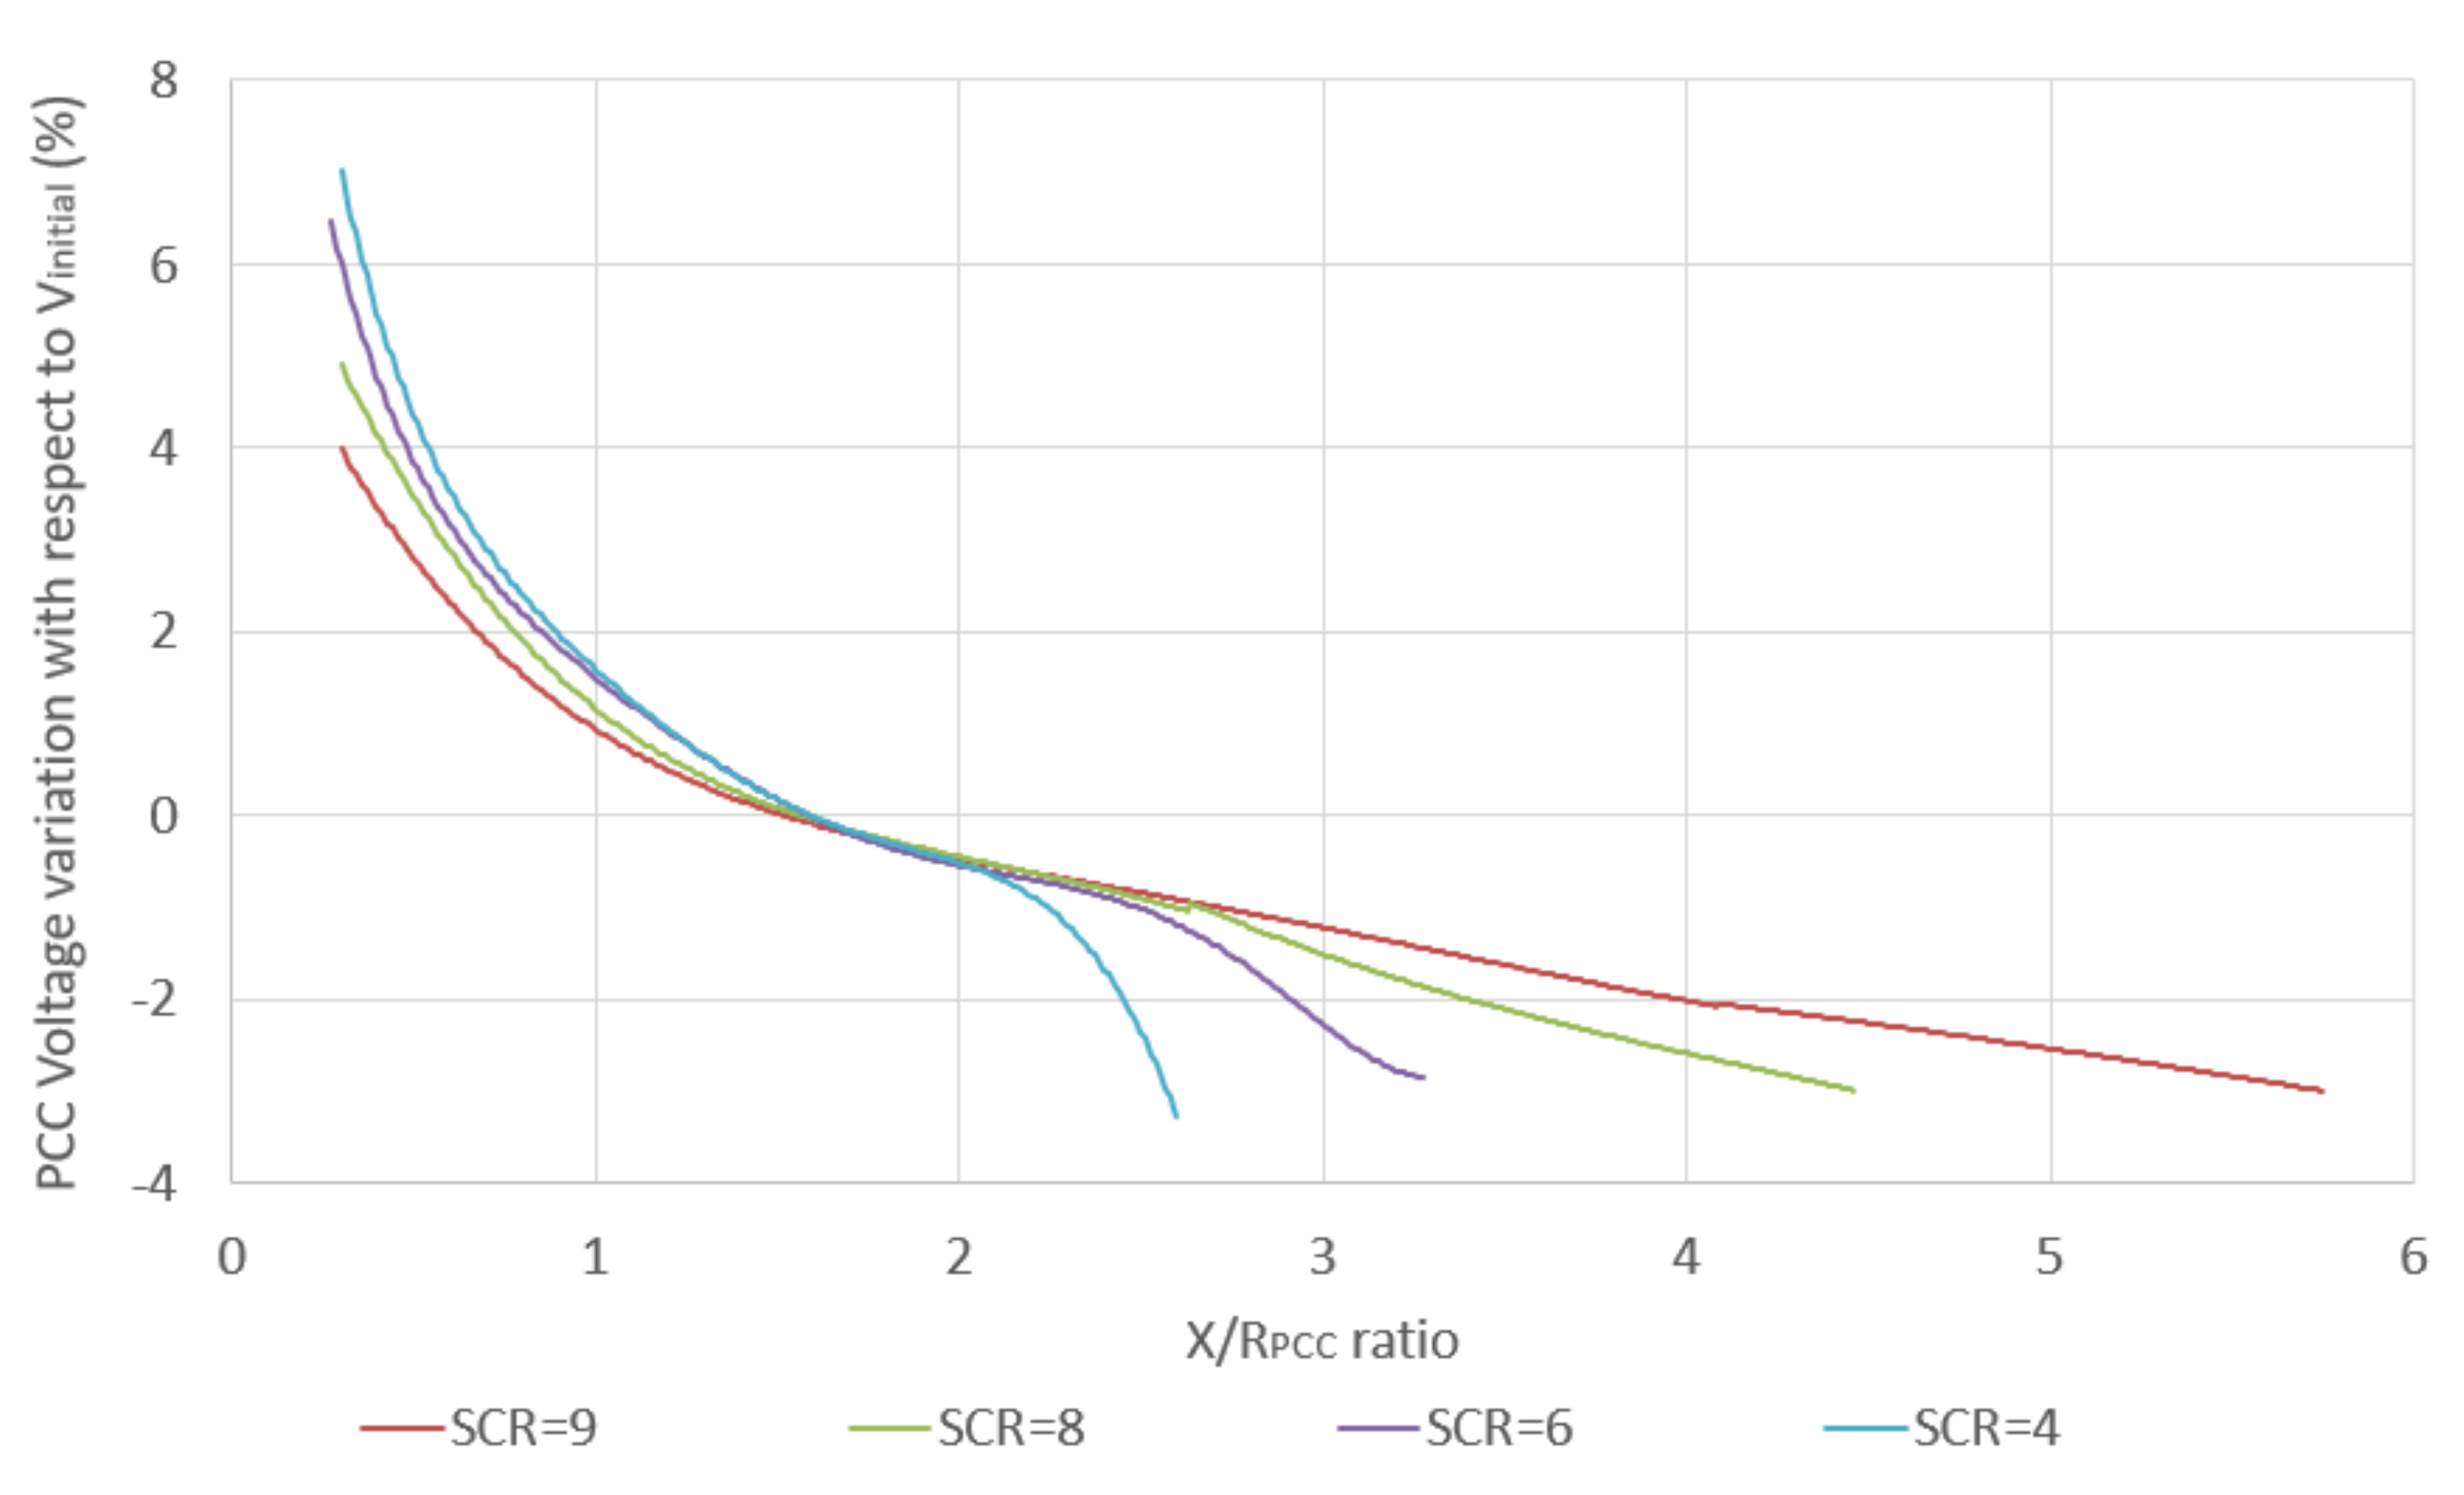
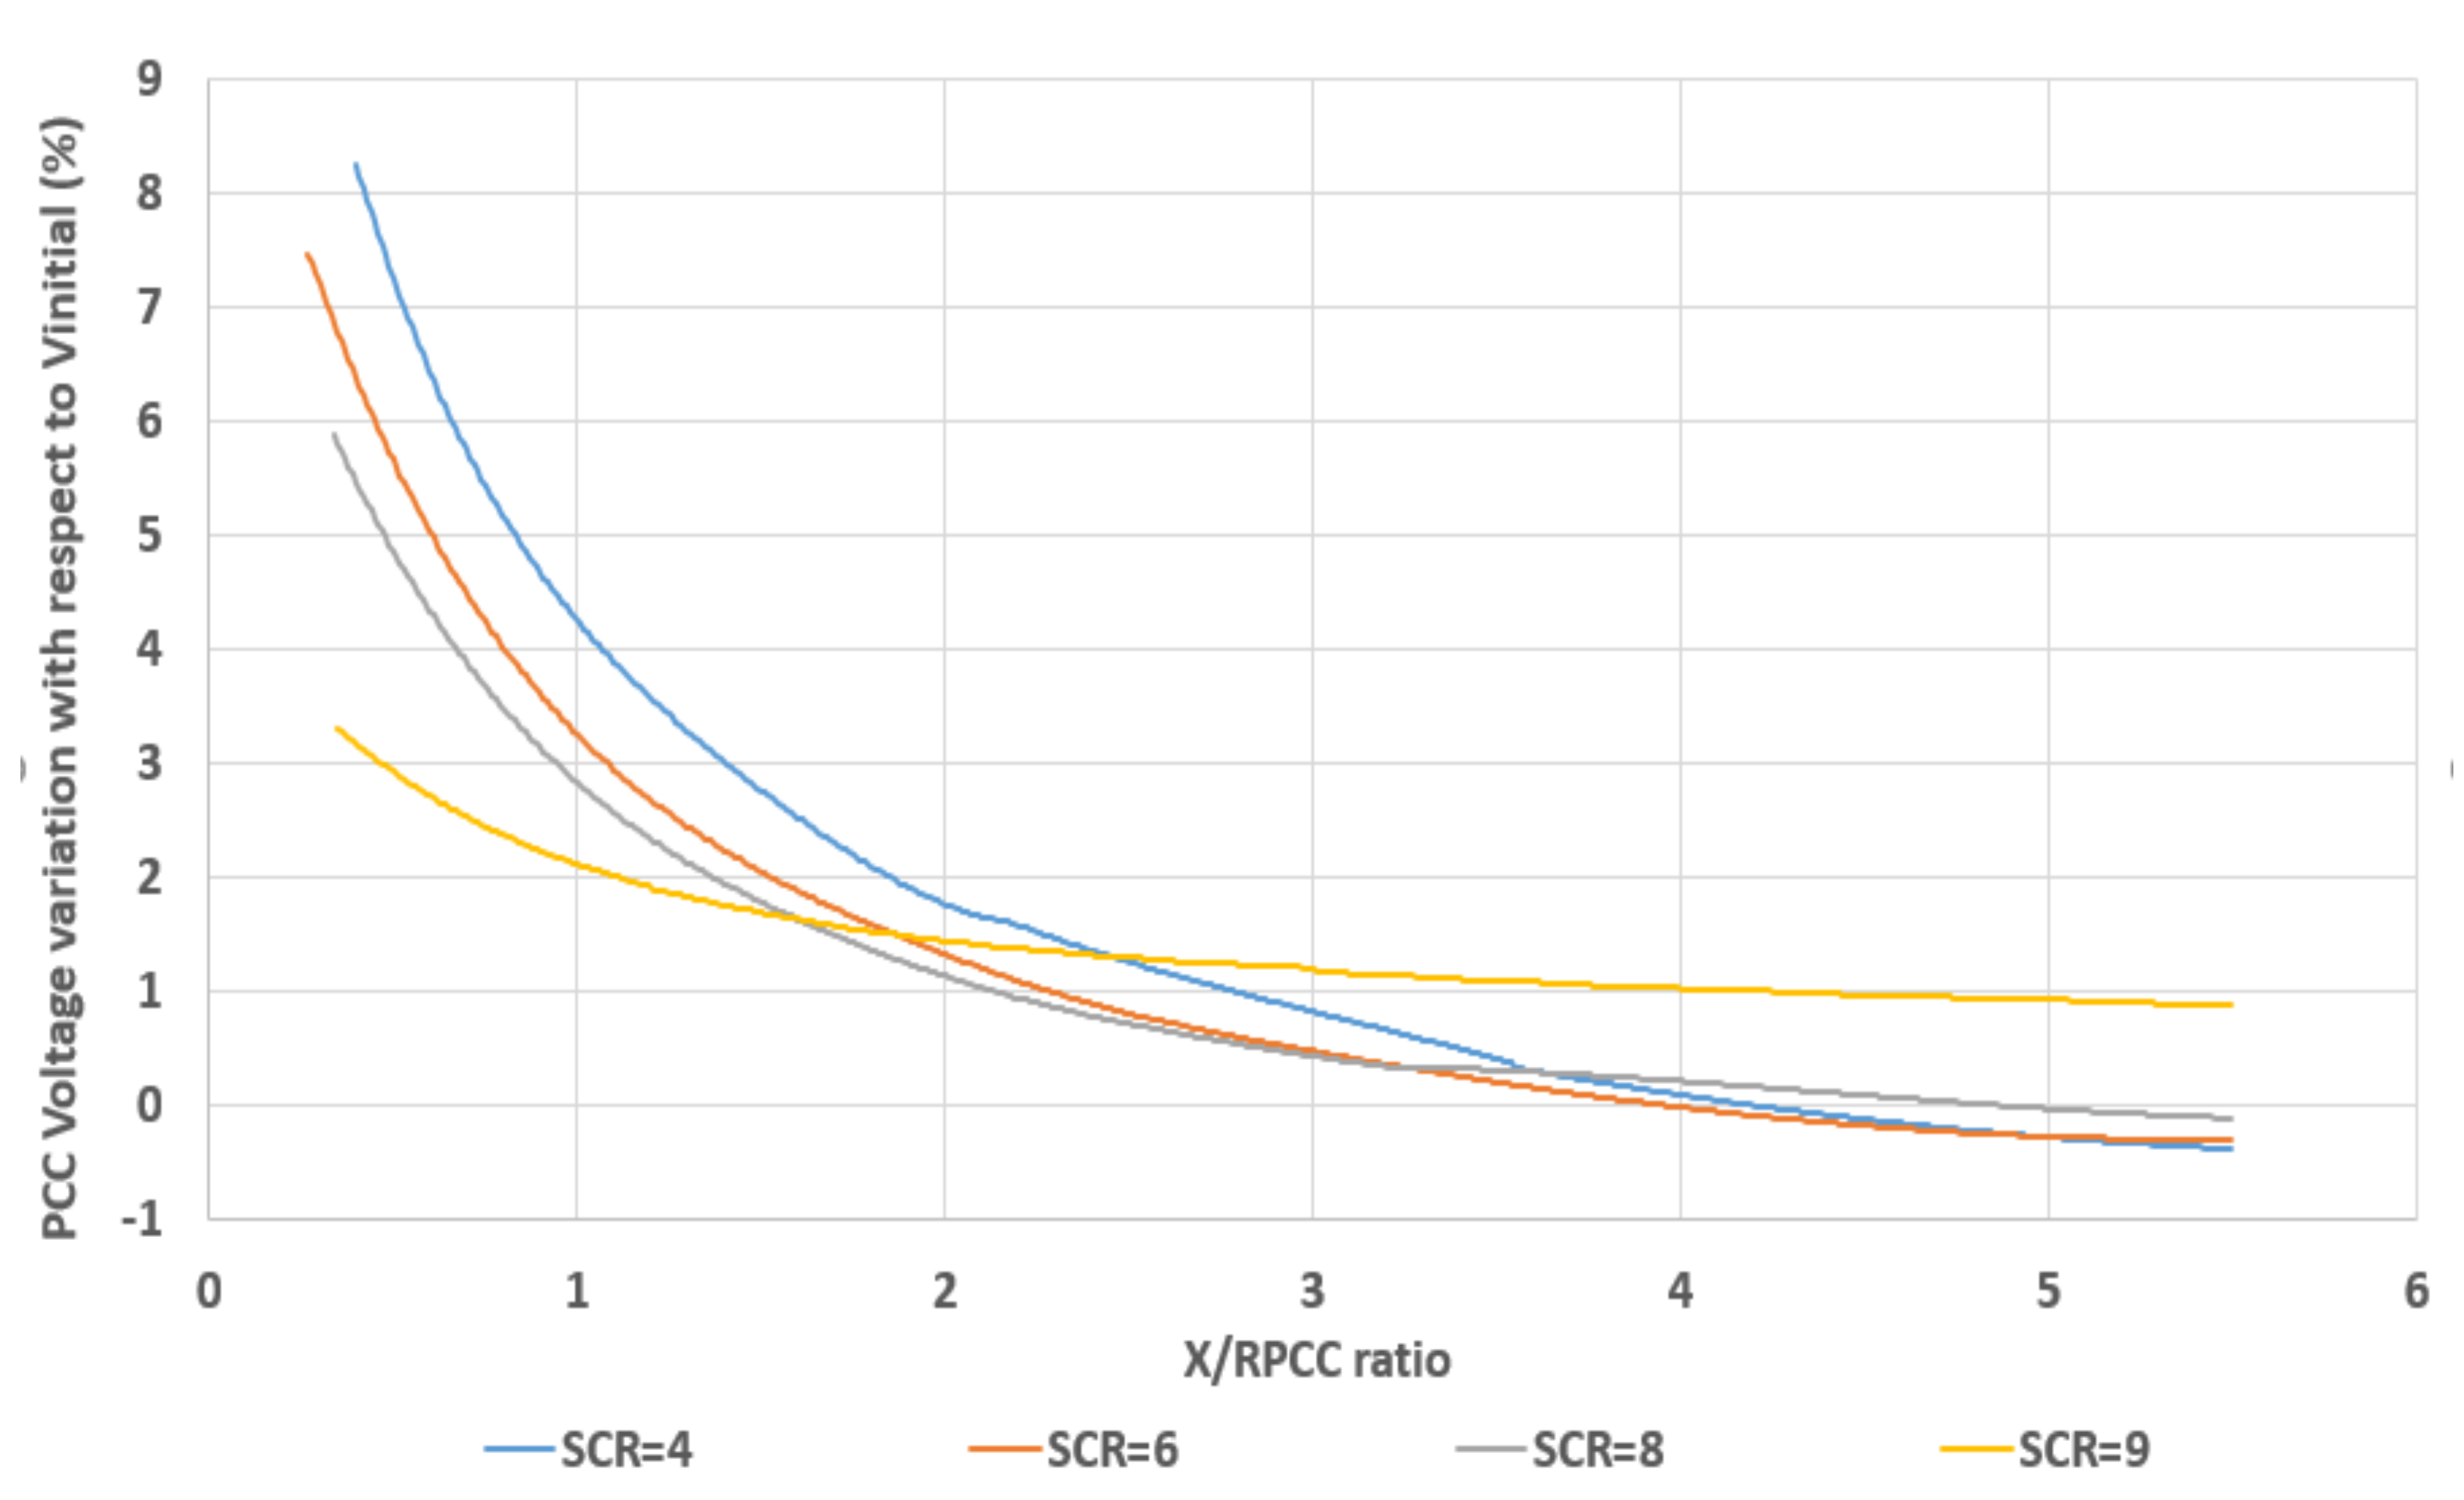
In this study, Microsoft Excel (Microsoft office 2013 developed by Microsoft) was used to extend the simulated data by forming a trendline between dVPCC and X/RPCC for each SCR level. Higher-order polynomials were fitted, maximizing R2 value by trial and error method. R2 value represents the goodness of fit and lies between 0 and 1. R2 closer to 1 represents a better fit [20] and can represent more data points. The best-fit polynomial was then utilized to determine dVPCC from the X/RPCC, forming a large dataset for each SCR level. Finally, the extended X/RPCC-dVPCC data were obtained for both IG- and DFIG-based WPPs, as shown in Figure 5 and Figure 6, respectively.
The dataset presented in Figure 5 and Figure 6 contains a large dataset (on average 500 data points for each test system), which is appropriate to be used as training data set in the next step.

2.2. Decision Tree Algorithm

The decision tree algorithm is one of the machine-learning (ML) algorithms, which develops regression or classification models forming a tree structure [21]. The model is trained to predict the class or value of a target parameter using learning decision rules inferred from prior data (training data) [22]. As discussed, the better prediction accuracy of the decision tree-based model can be achieved by using larger training data set [17]. The training data set must contain the values of feature and response variables. Feature variables are those, which are being given to the model as input and the response variable is the model output.
As discussed in the previous section, the proposed decision tree-based model is developed using the training data set containing 90% of extended values of the X/RPCC-dVPCC obtained for each SCR value shown in Figure 5 and Figure 6, whereas 10% of extended data were set aside as test data set.
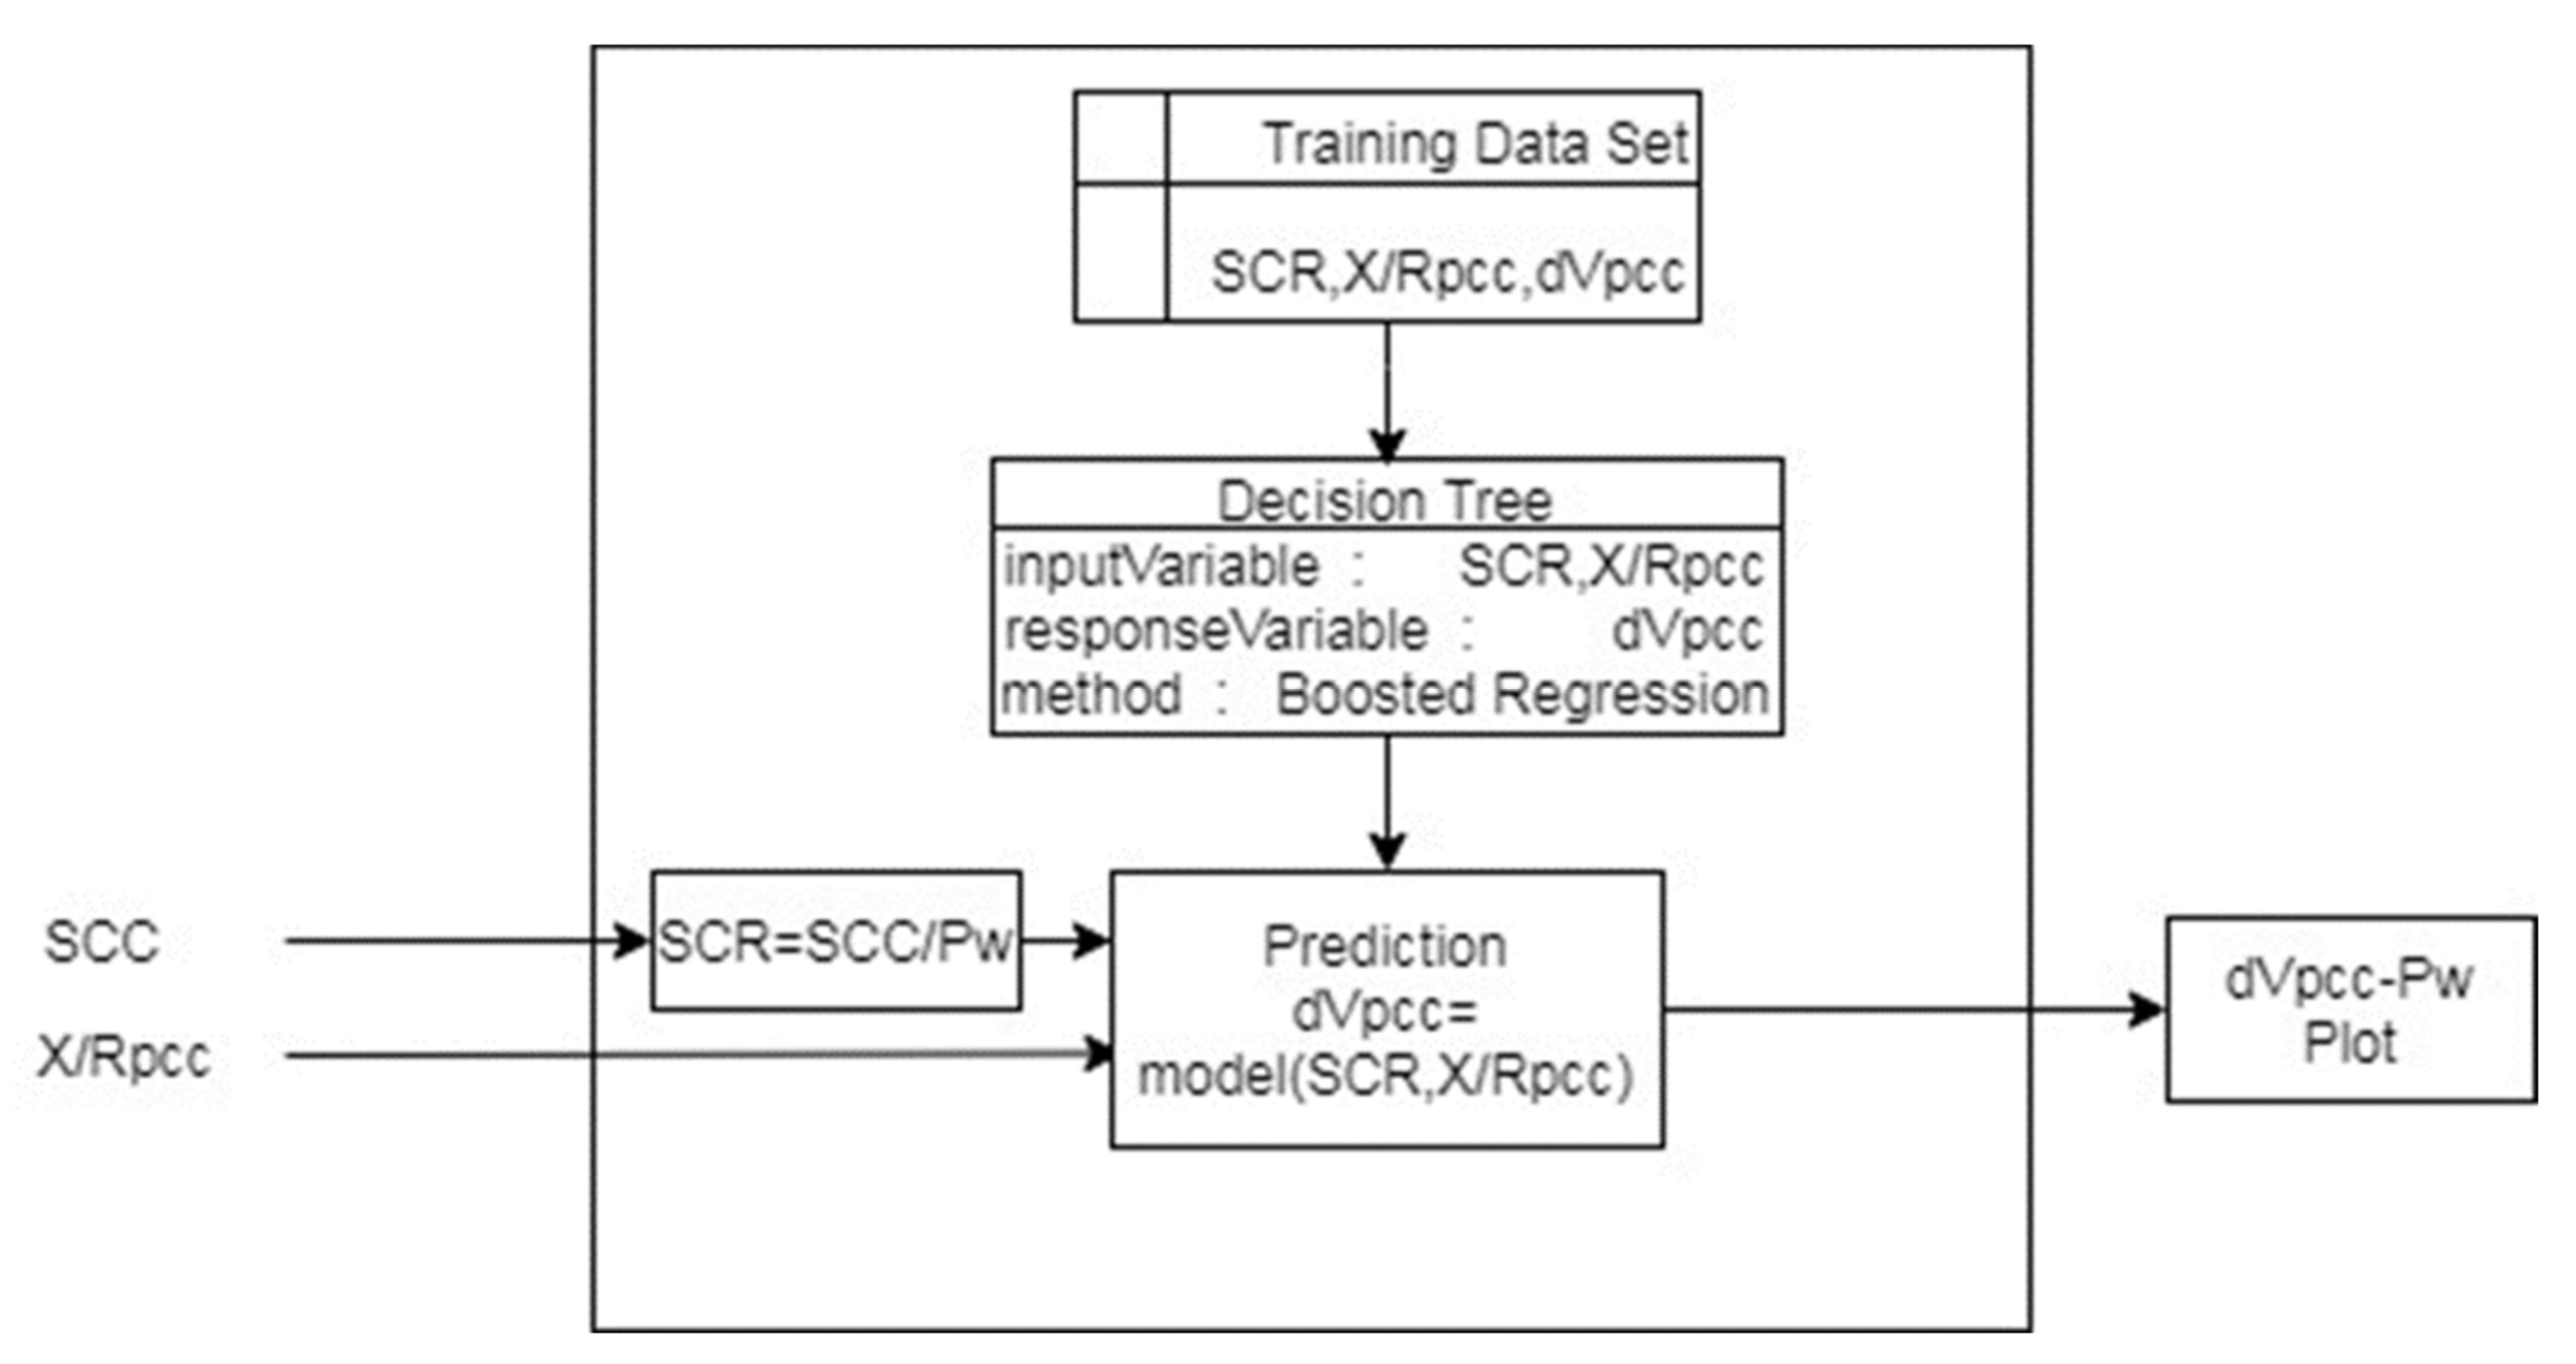
The block diagram of the proposed algorithm is presented in Figure 7.
As shown in Figure 7, the input parameters of the proposed model are X/RPCC and the ratio between SCC and Pwind, i.e., SCR. The model can predict the Pwind-dVPCC characteristic curve using the value of input parameters.
In this study, MATLAB (MATLAB R2014a developed by MathWorks) was used to create the decision tree algorithm. This study aimed to develop a model from a numerical set of data, which suits the regression tree model. An ensemble-learning was utilized for training decision trees with “input variables” and “response variables” provided in the extended datasheet. Ensemble learning provides the best solution using multiple learning algorithms to increase the efficiency of the prediction [23].
To develop the decision-tree algorithm in MATLAB, it is required to accurately define the values of algorithm parameters. The minimum number of training data per leaf of the decision tree is denoted by minimum leaf size. Large minimum leaf size values increase the prediction error, and small values lead to overfitting [18]. The value of minimum leaf size should be at least 5 to prevent noises due to overfitting, while an increase in the leaf size will start deviating from the actual pattern of the data and increases the prediction error [18]. The losses in the decision tree model from the actual pattern of data can be determined using the MATLAB function “loss()”. As an example, when the minimum leaf size is increased from 5 to 10, the value calculated by loss() function is increased, which indicates that the developed model skewed from the actual pattern. Hence, in this study, the value of minimum leaf size was considered to be 5 to ensure that the actual pattern of the data is reflected in the prediction. The other decision tree parameters should be selected, which provides a better prediction for the regression data. Furthermore, the least square boosting method (“LSBoost”) was selected for boosting the decision tree algorithm. The pseudo-code for developing the decision tree algorithm is provided in Table 2.

3. Results and Discussion

This section provides the analysis studies carried out to verify the accuracy of the proposed decision tree-based model in predicting the Pwind-dVPCC characteristic for different test systems. In this regard, the Pwind-dVPCC characteristics plotted by the proposed model were compared with the reference characteristics given by the IEEE test systems presented in Figure 5 and Figure 6. In addition, the Pwind-dVPCC characteristics gained by the proposed decision tree algorithm-based model were compared with the results obtained by one of the most efficient methods presented in [1], which is capable of simplifying the WPP sizing and siting. Both IG and DFIG-based WPPs were considered in the verification analysis.

3.1. IG-Based WPPs

Nine test systems were considered with different SCC and X/RPCC values, as shown in Table 3.
For each scenario, the considered test system was run to obtain the dVPCC for various Pwind values. Having the simulation results, the reference Pwind-dVPCC characteristic was plotted for each scenario. In addition, the Pwind-dVPCC characteristics were obtained for each scenario using the decision tree-based model developed in this paper and the mathematical model proposed in [1] considering the SCC and X/RPCC ratios presented in Table 3. Given that the analysis was carried out for the IG-based WPP, the following equations were depicted from [1] to calculate dVPCC.
dV PCC = 0.0912 e 0.29 × X / R PCC × SCC P wind + 0.0067   For   the   X / R PCC   <   2
dV PCC = 0.0013 0.0427 X / R PCC × P wind SCC + 0.002 X / R PCC × P wind SCC 2 For   the   X / R PCC   >   2
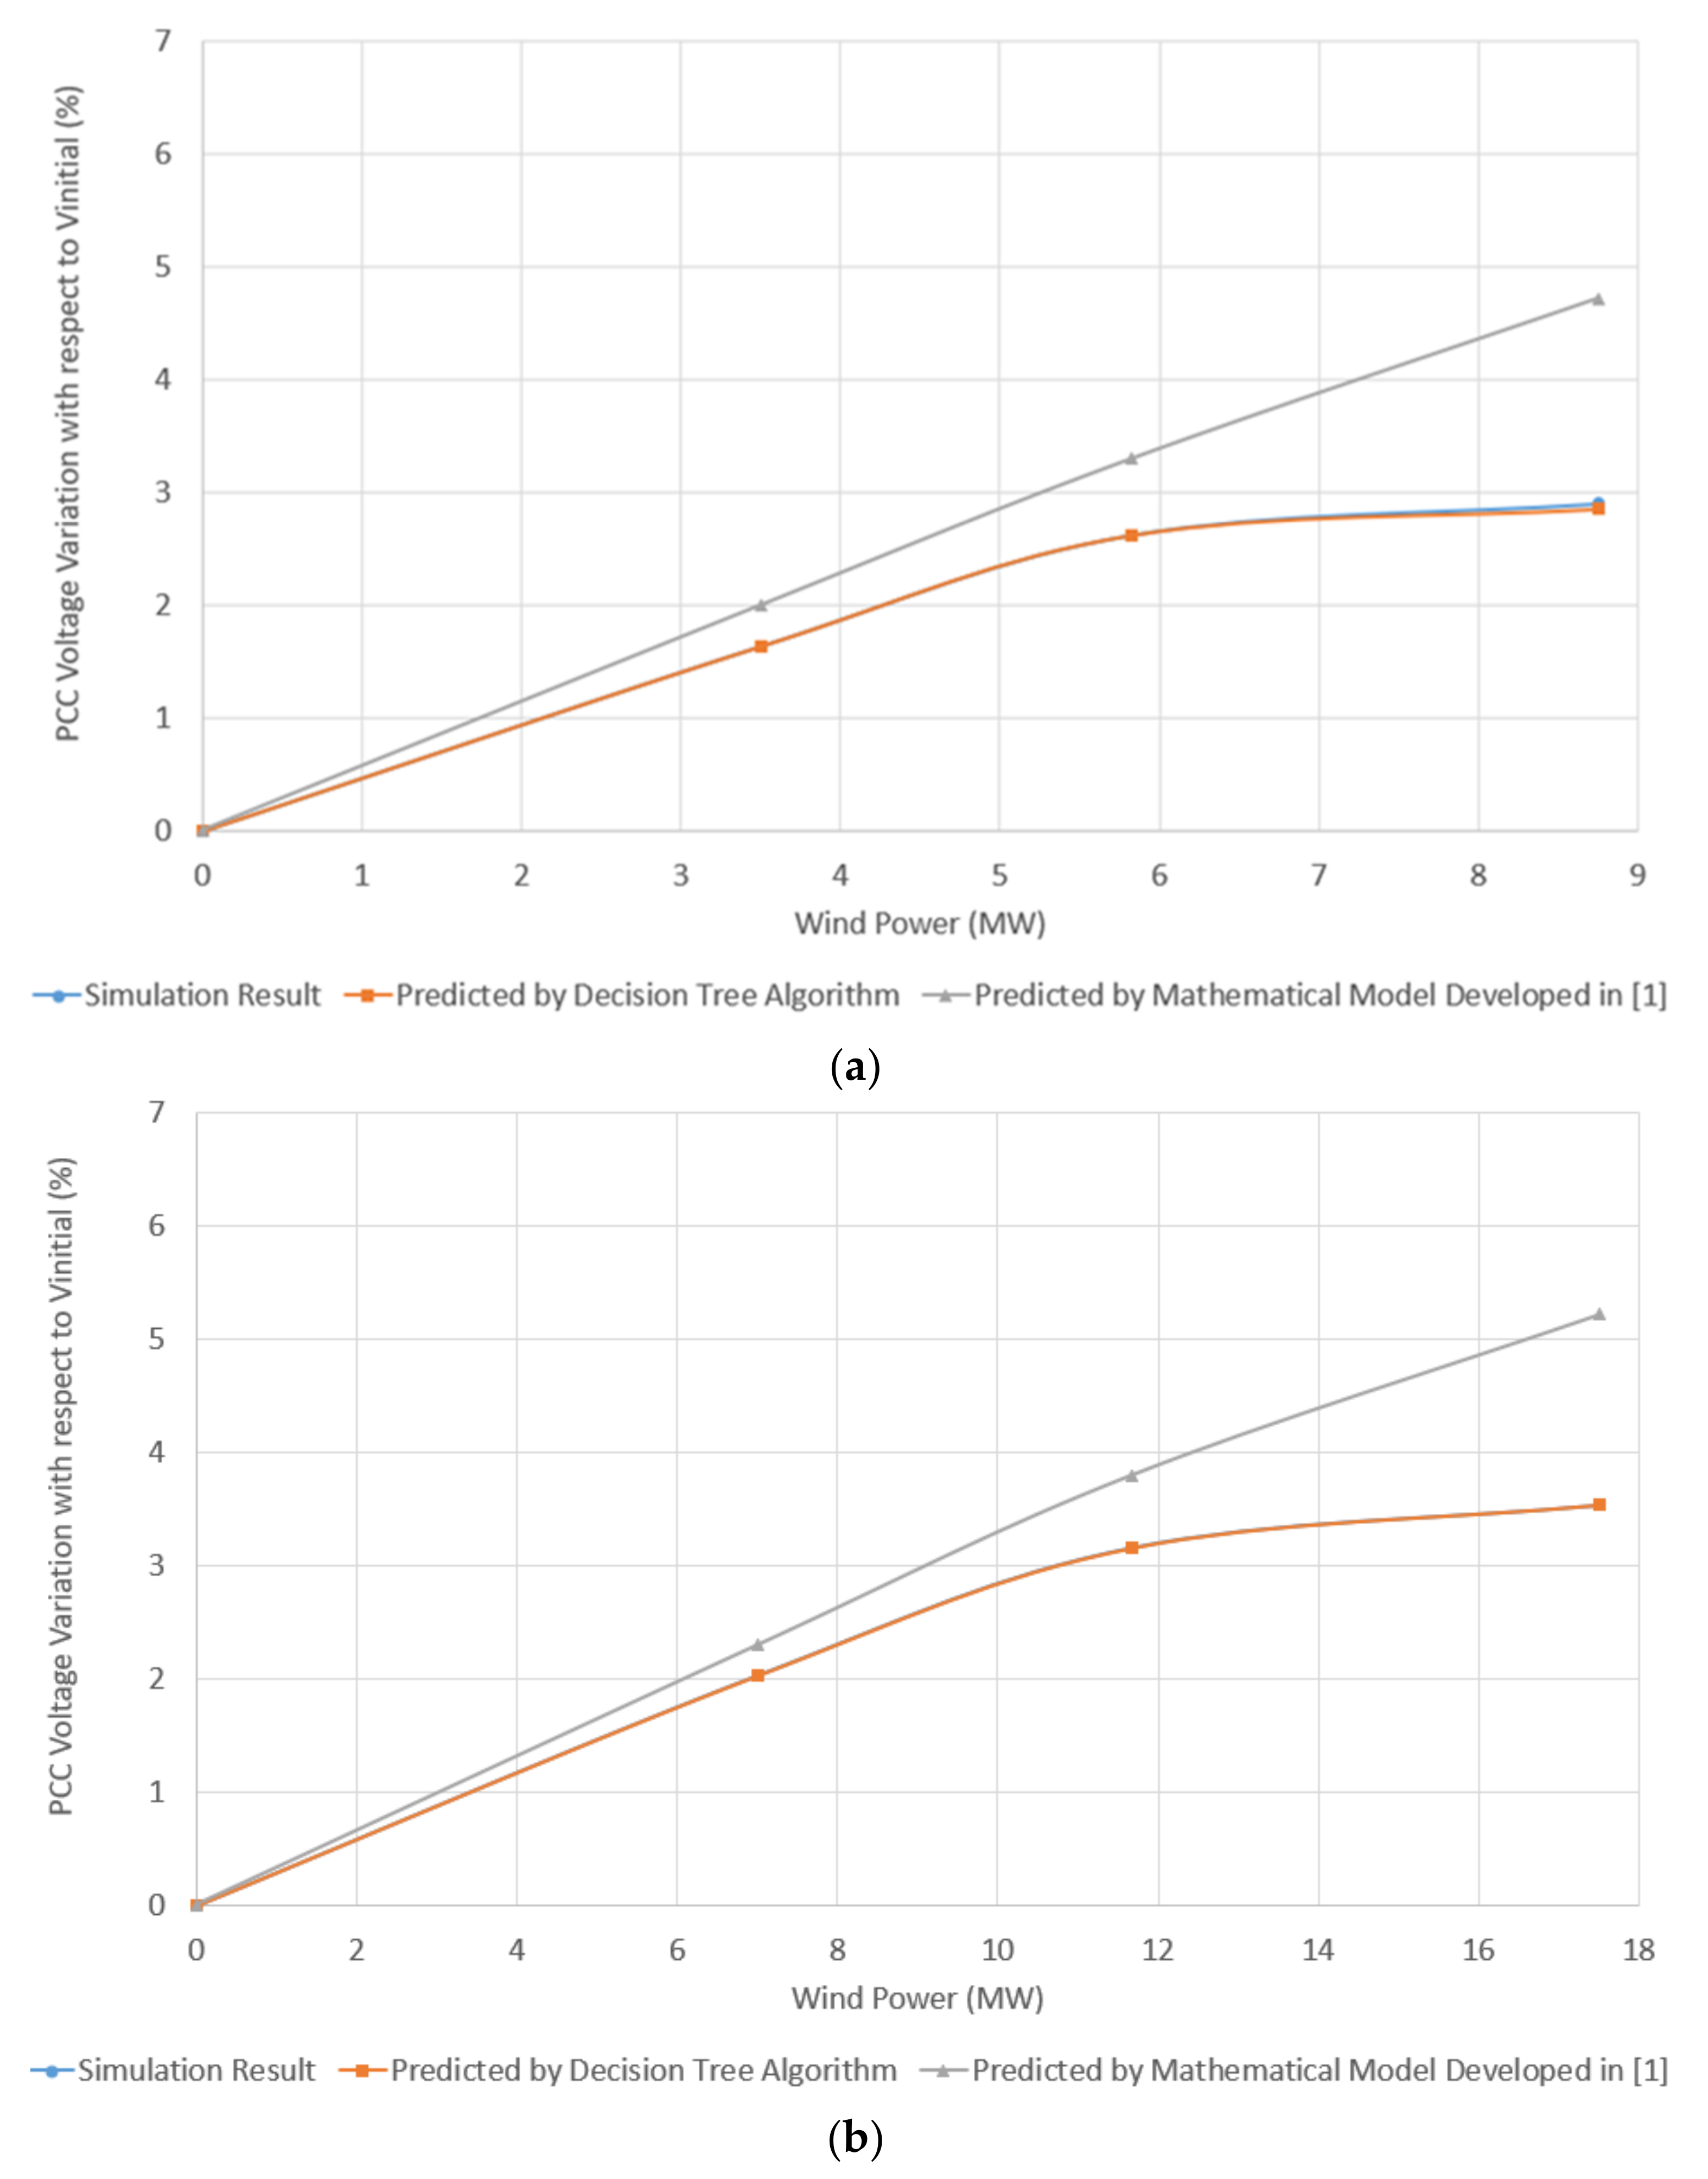
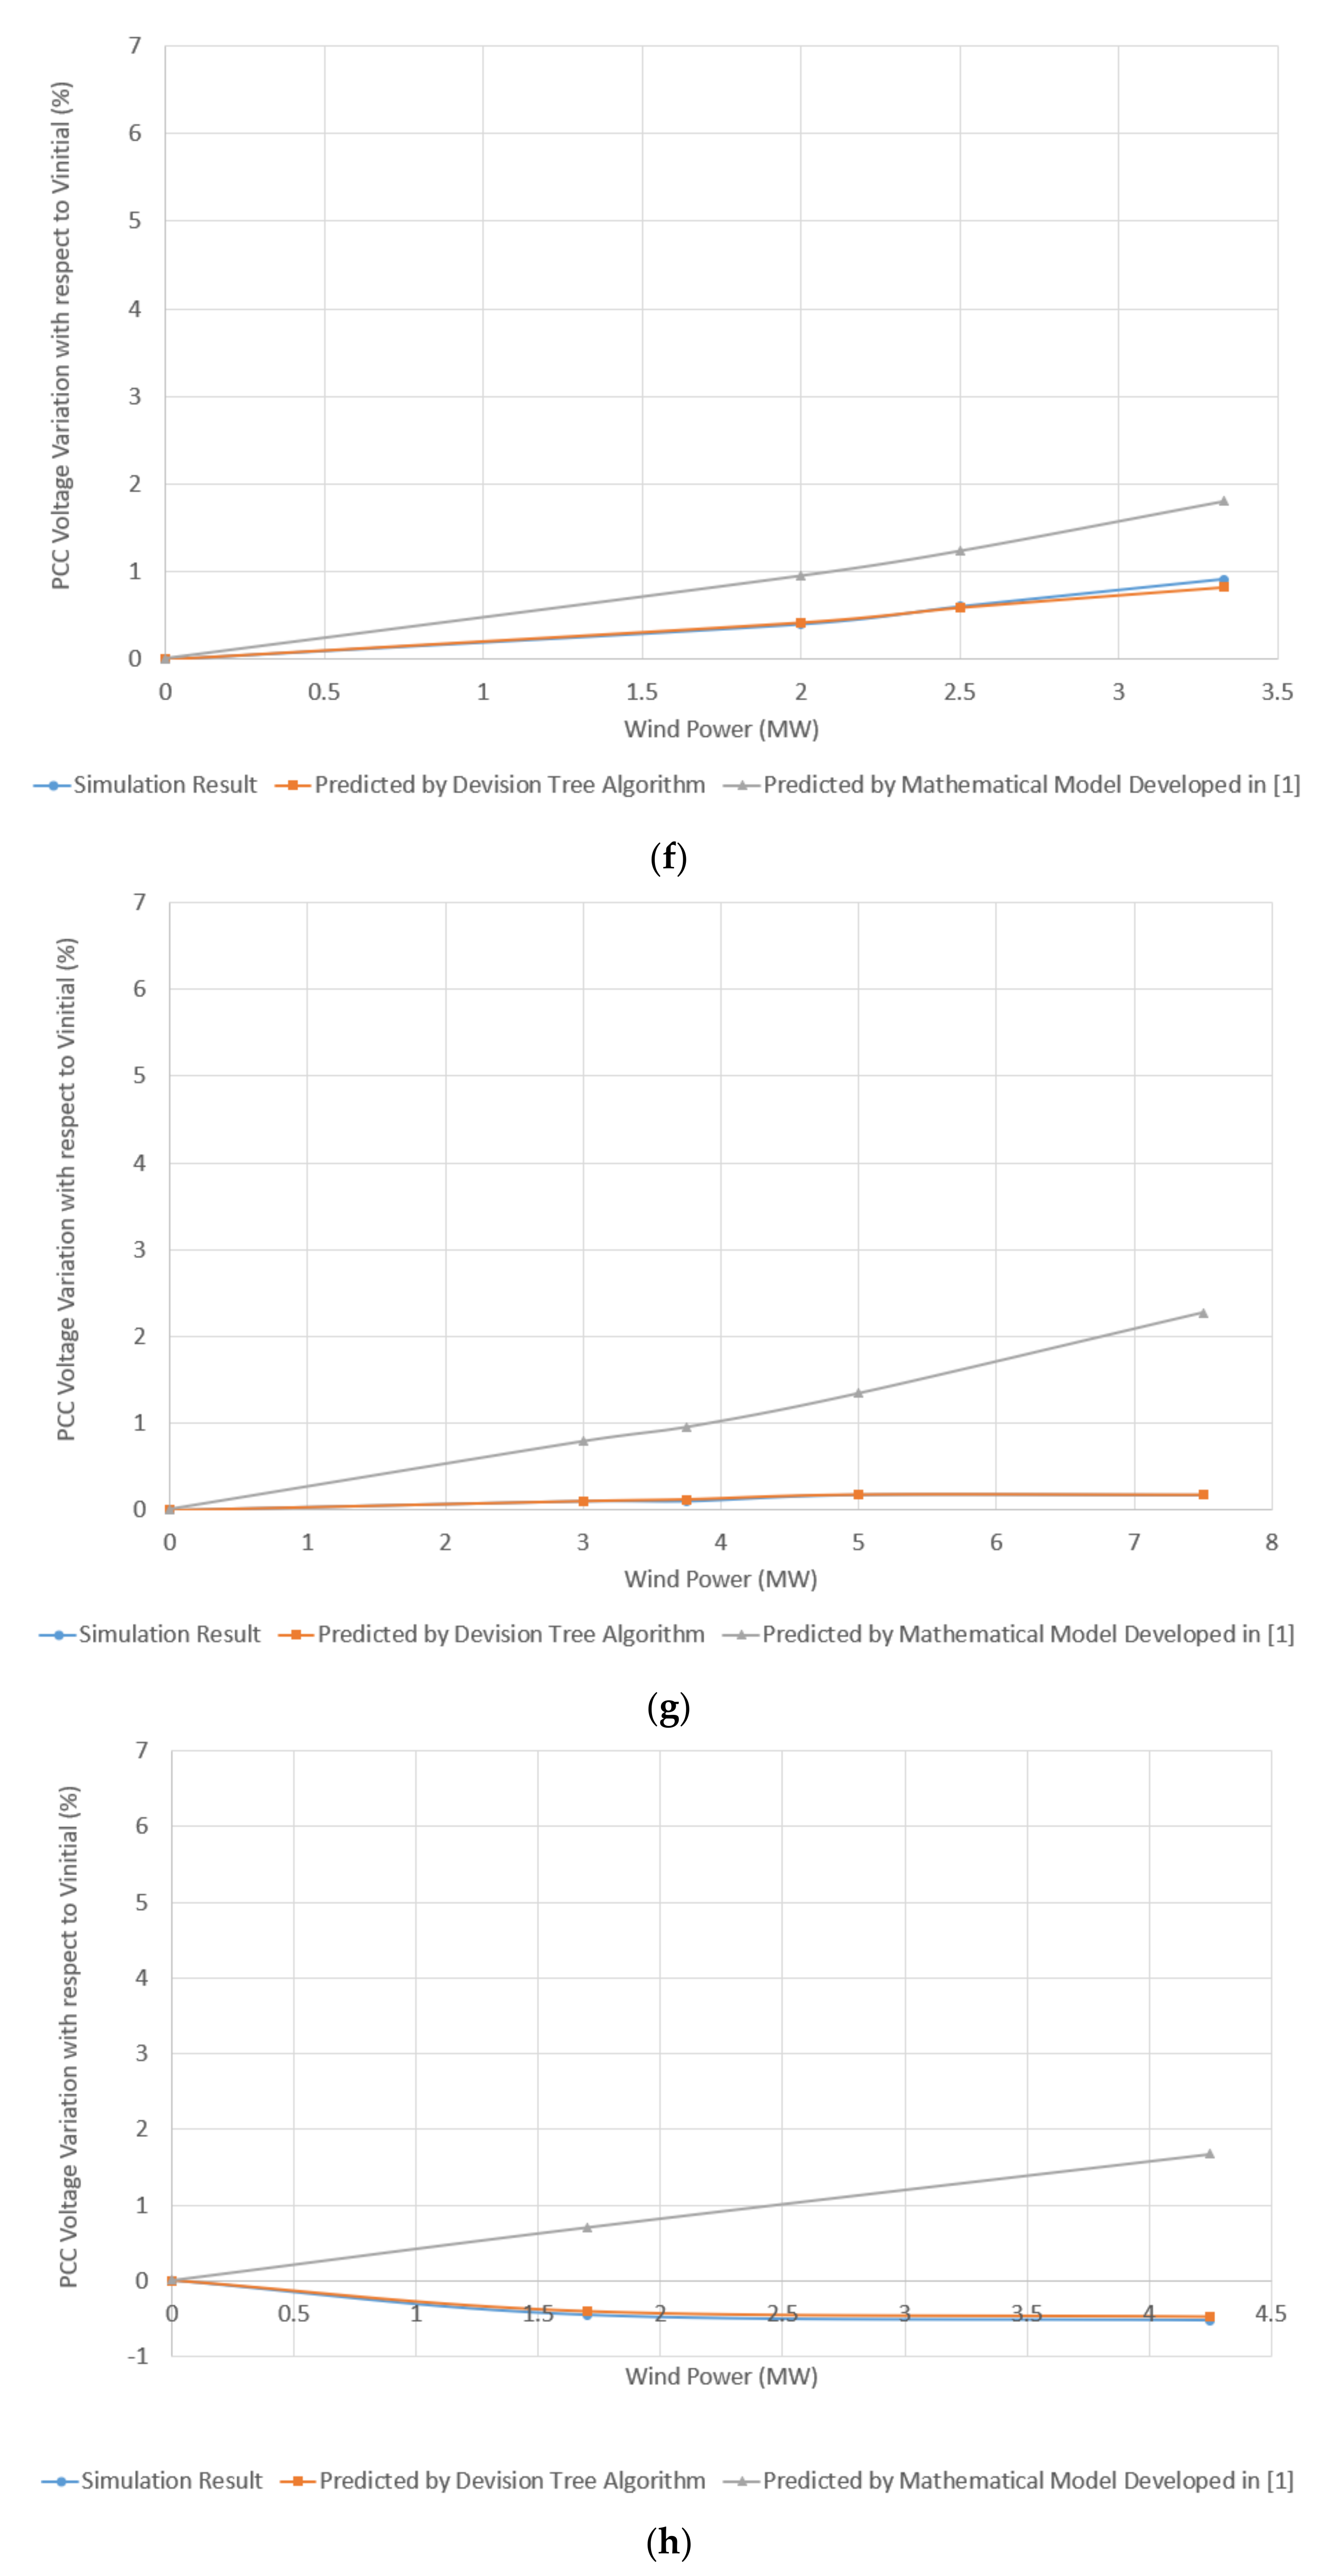
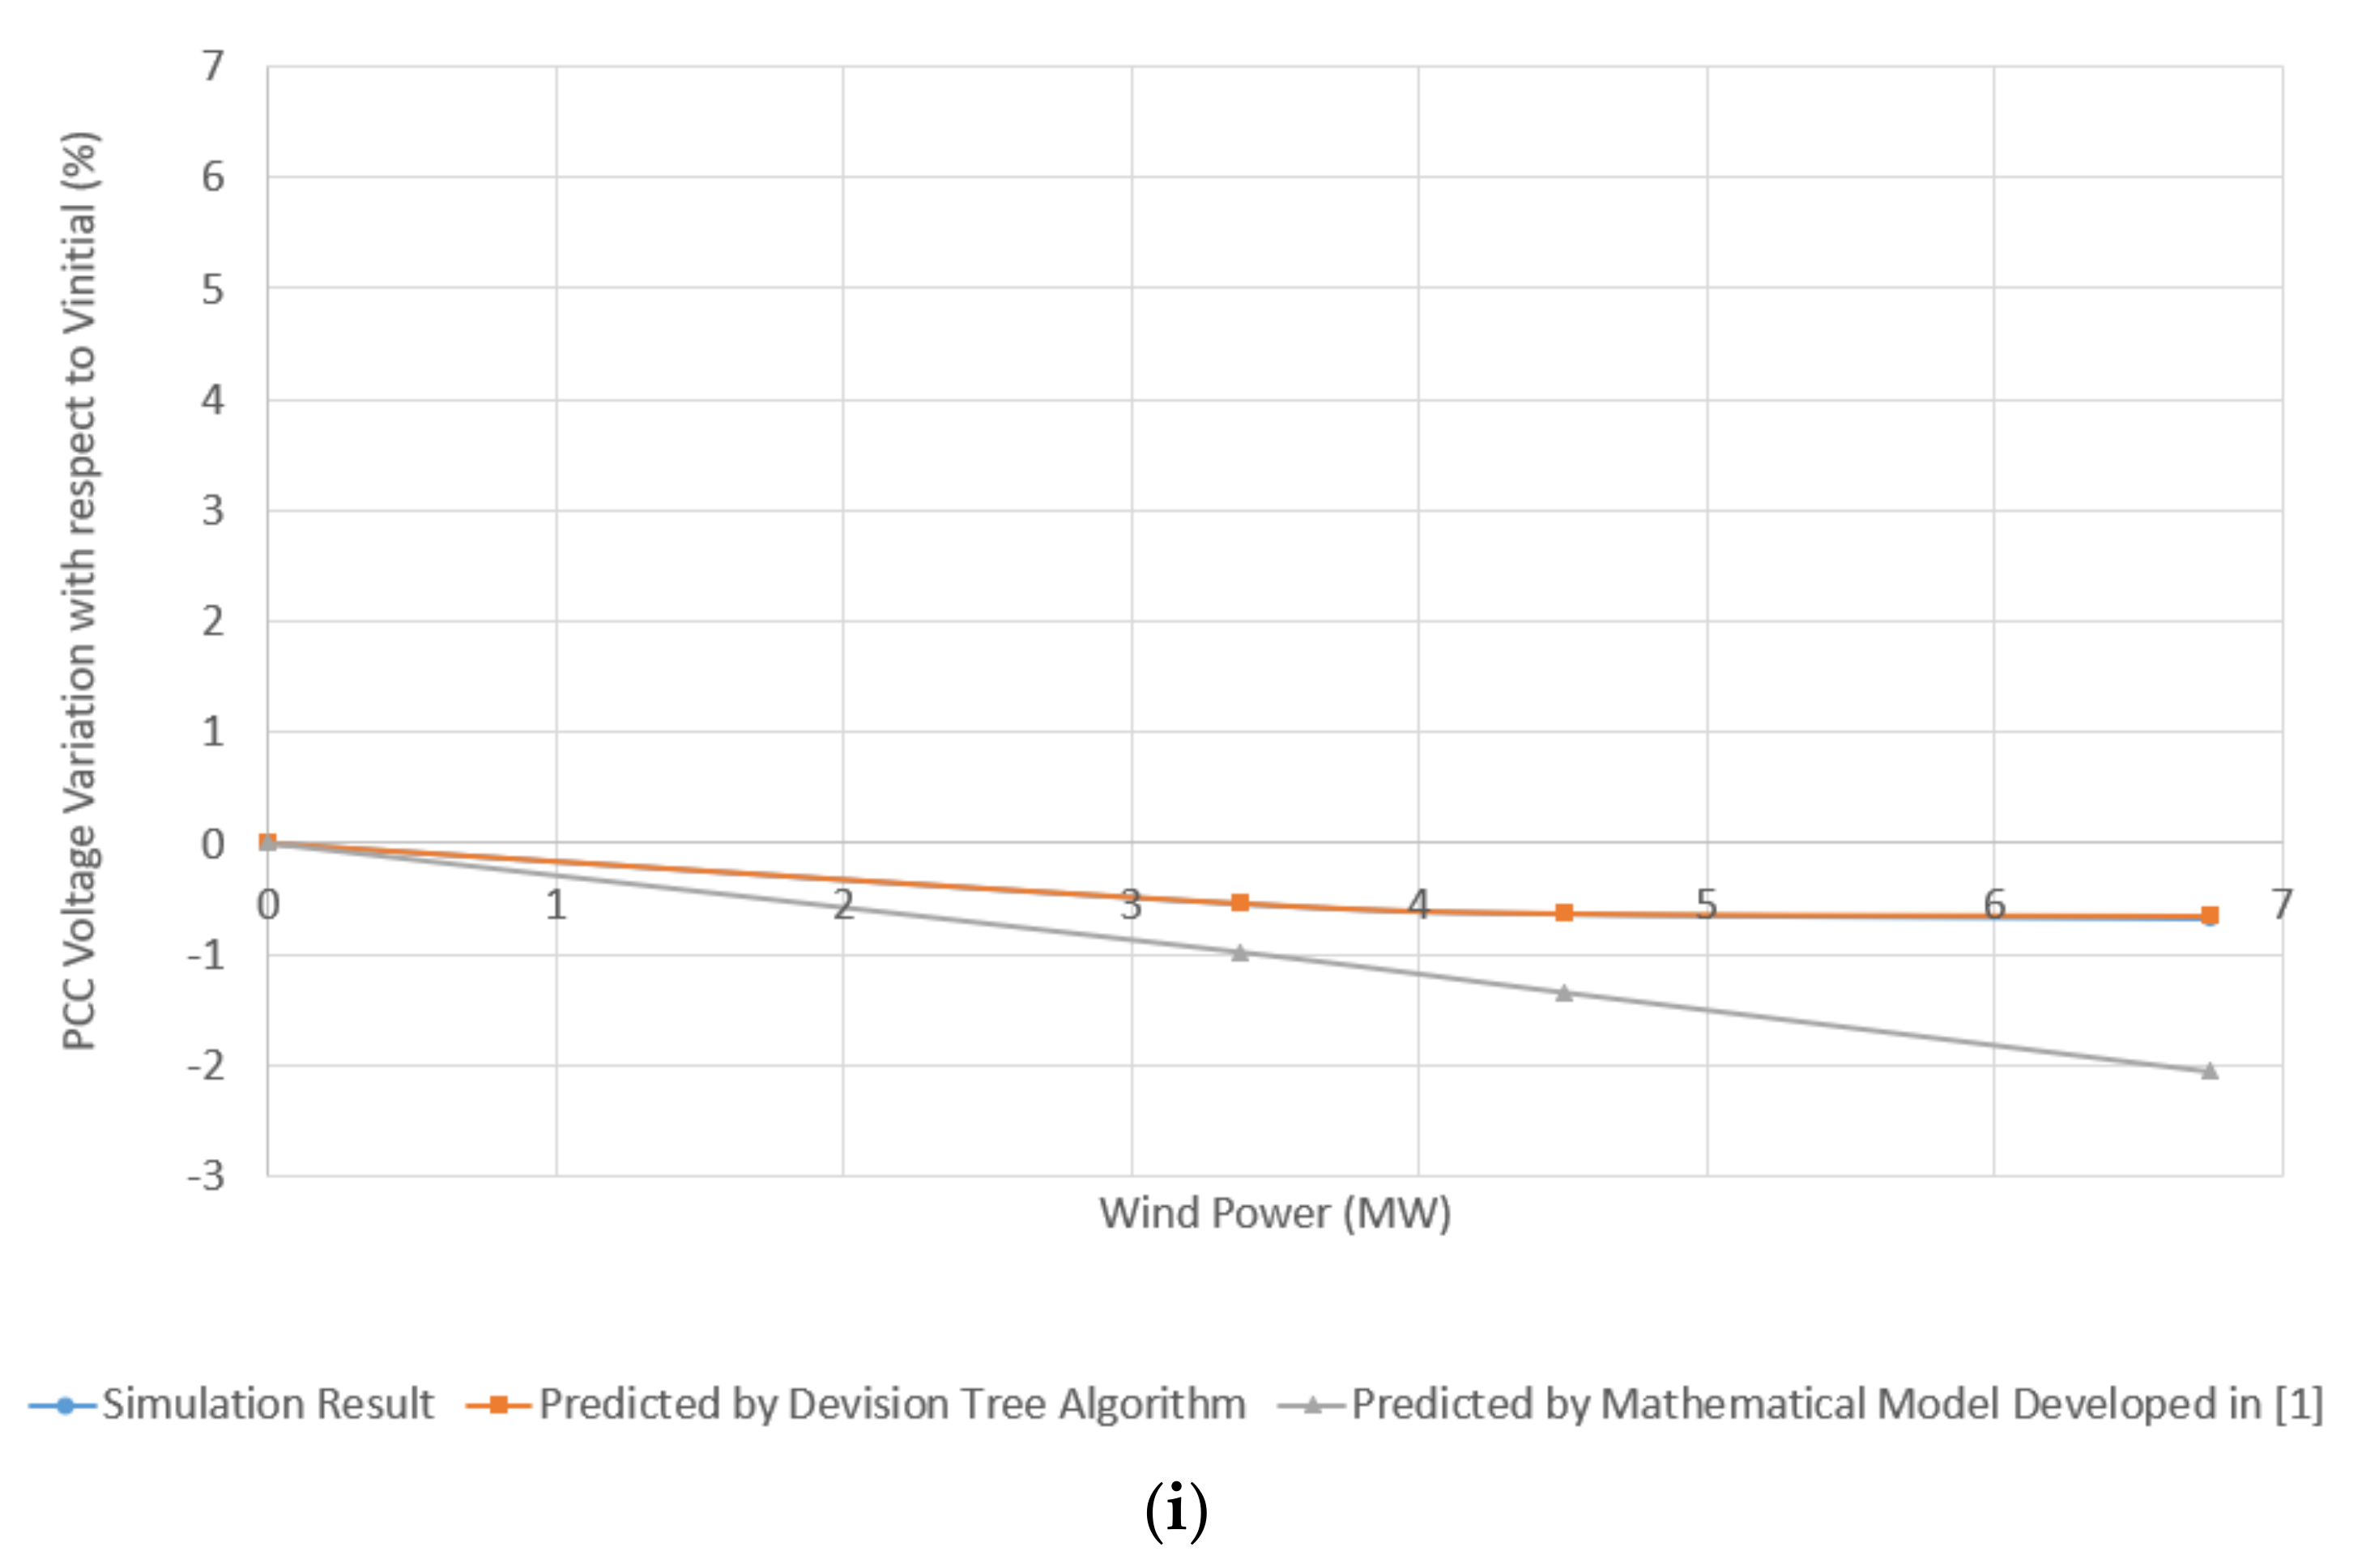
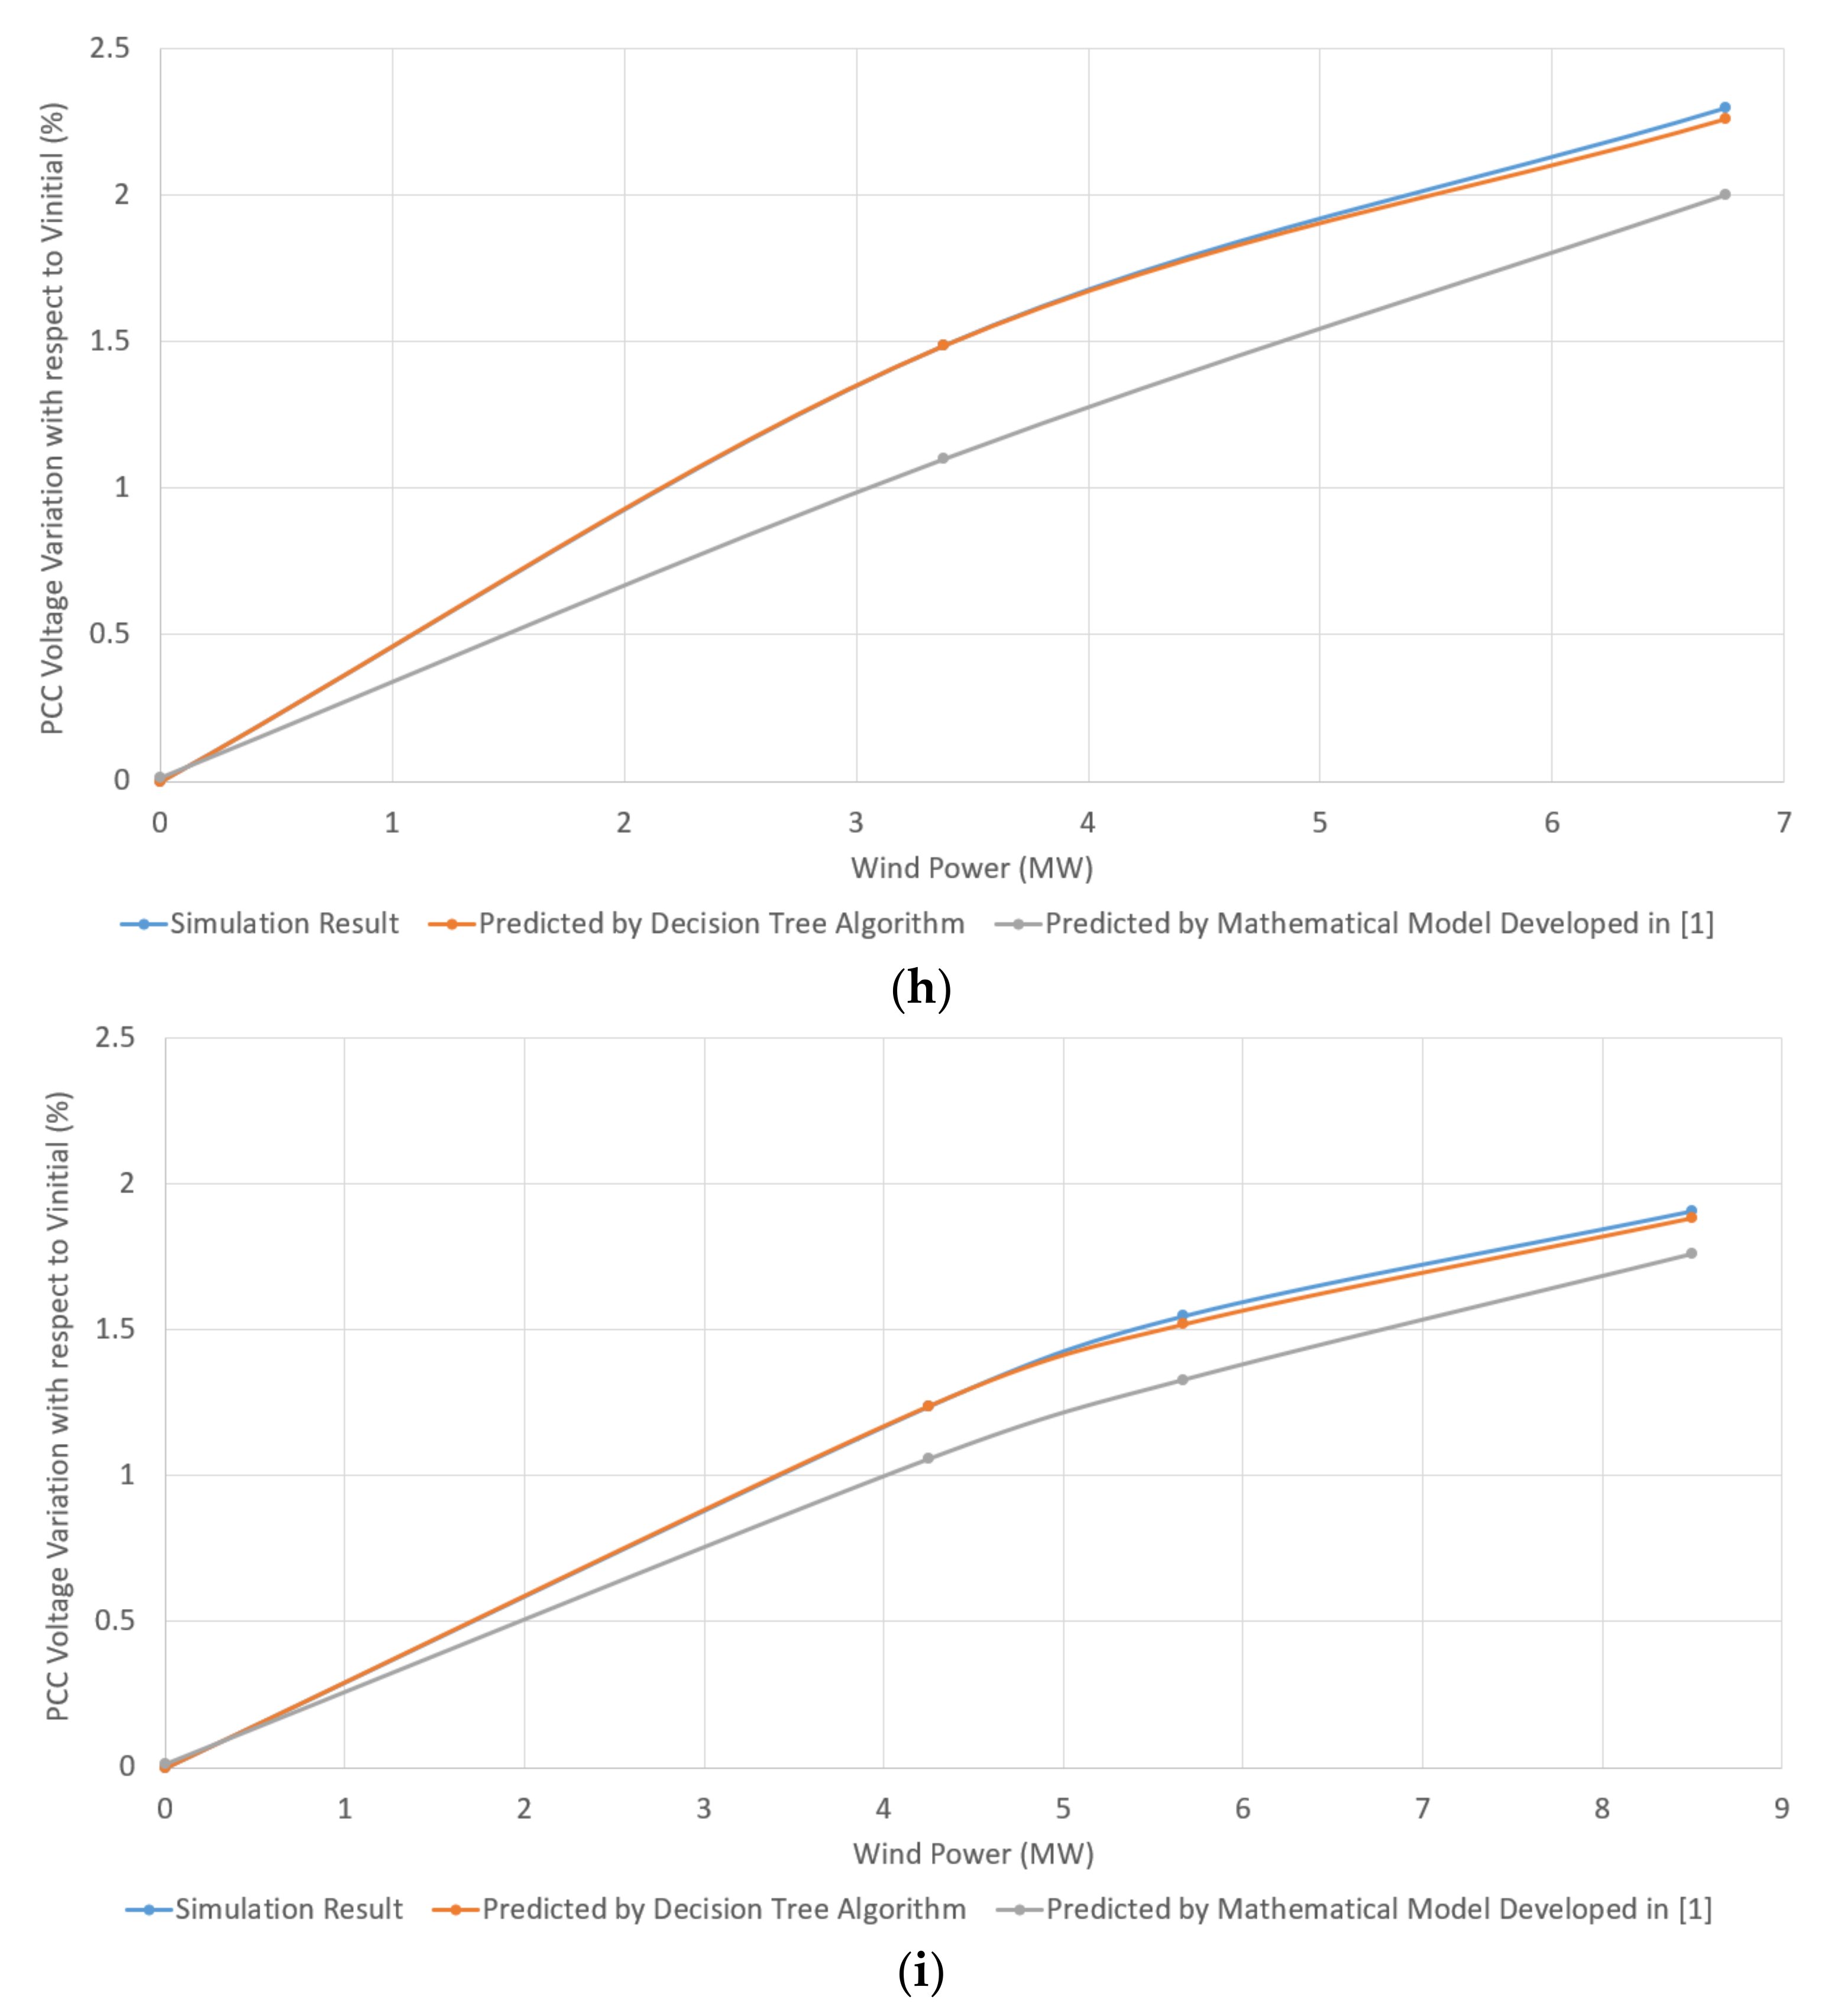
Figure 8a–i shows the results obtained for the scenarios stated in Table 3.
As shown in Figure 8a–i, for all scenarios considered in Table 3, the Pwind-dVPCC characteristics predicted by the decision tree-based model developed in this paper follow the reference graphs obtained by the simulation test models even when the large wind power generation weakens the PCC feeder. As discussed earlier, at the weak PCC sites, the large wind power penetration makes the SCR value small. Hence, the small SCR values do not adversely impact the accuracy of the proposed model in predicting the Pwind-dVPCC characteristics. On the other hand, the results demonstrate that the curves predicted by the mathematical relations proposed in [1] largely deviate from the reference graphs, especially when the SCR value is small due to the large wind power generation. Hence, as the authors mentioned in [1], the accuracy of the mathematical model is adversely impacted at weak PCC where the grid’s SCC and SCR are small. For example, referring to Figure 8c,d related to the results for the scenarios with the small grid’s SCC, i.e., Scenario 3 with an SCC of 15MVA and Scenario 4 with an SCC of 18 MVA, the highest error between the reference graphs and the characteristics predicted by the proposed decision tree algorithm is less than 0.5%. However, Figure 8c,d show that the error between the reference curve and the curve predicted by the equations proposed in [1] is more than 1% when the wind power generation is around 4 MW, which corresponds to the SCR of around 4.
One of the other advantages of the proposed decision tree-based model over the mathematical method developed in [1] is to provide significantly high accuracy in predicting the Pwind-dVPCC characteristic when the X/R ratio is around 2. From the results presented in Figure 8h,i related to the scenarios with X/R ratio close to 2, i.e., Scenarios 8 and 9, it shown that the error between the curves plotted by the decision tree-based model and the corresponding reference curves is negligible. However, the results in Figure 8h,i show that curve characteristics plotted by the mathematical model noticeably deviate from the reference graphs when the X/RPCC ratio is around 2, and the wind power generation is large.
Generally, the results in Figure 8a–i demonstrate that the Pwind-dVPCC characteristics plotted by the proposed decision tree-based model follow the corresponding reference graphs for different ranges of the X/RPCC ratio and wind power penetration, whereas the accuracy of the mathematical model in predicting the characteristics is decreased when wind power generation is increased and/or the X/RPCC ratio is around 2.

3.2. DFIG-Based WPPs

This section discusses the analysis conducted to validate the accuracy of the decision tree-based model developed in this work in predicting the Pwind-dVPCC characteristics for the DFIG-based WPPs. Nine test systems were considered with the SCC and X/RPCC values shown in Table 4.
Similar to the verification studies carried out for the IG-based WPPs, for each test system shown in Table 4, the curves predicted using the proposed model are compared with the reference curves obtained using the simulation results and the curves plotted by the mathematical model proposed in [1]. Referring to [1], for the DFIG-based WPPs, the dVPCC is given by:
dV PCC = 0.01 + 0.101 × e 0.347 × SCR × X / R PCC
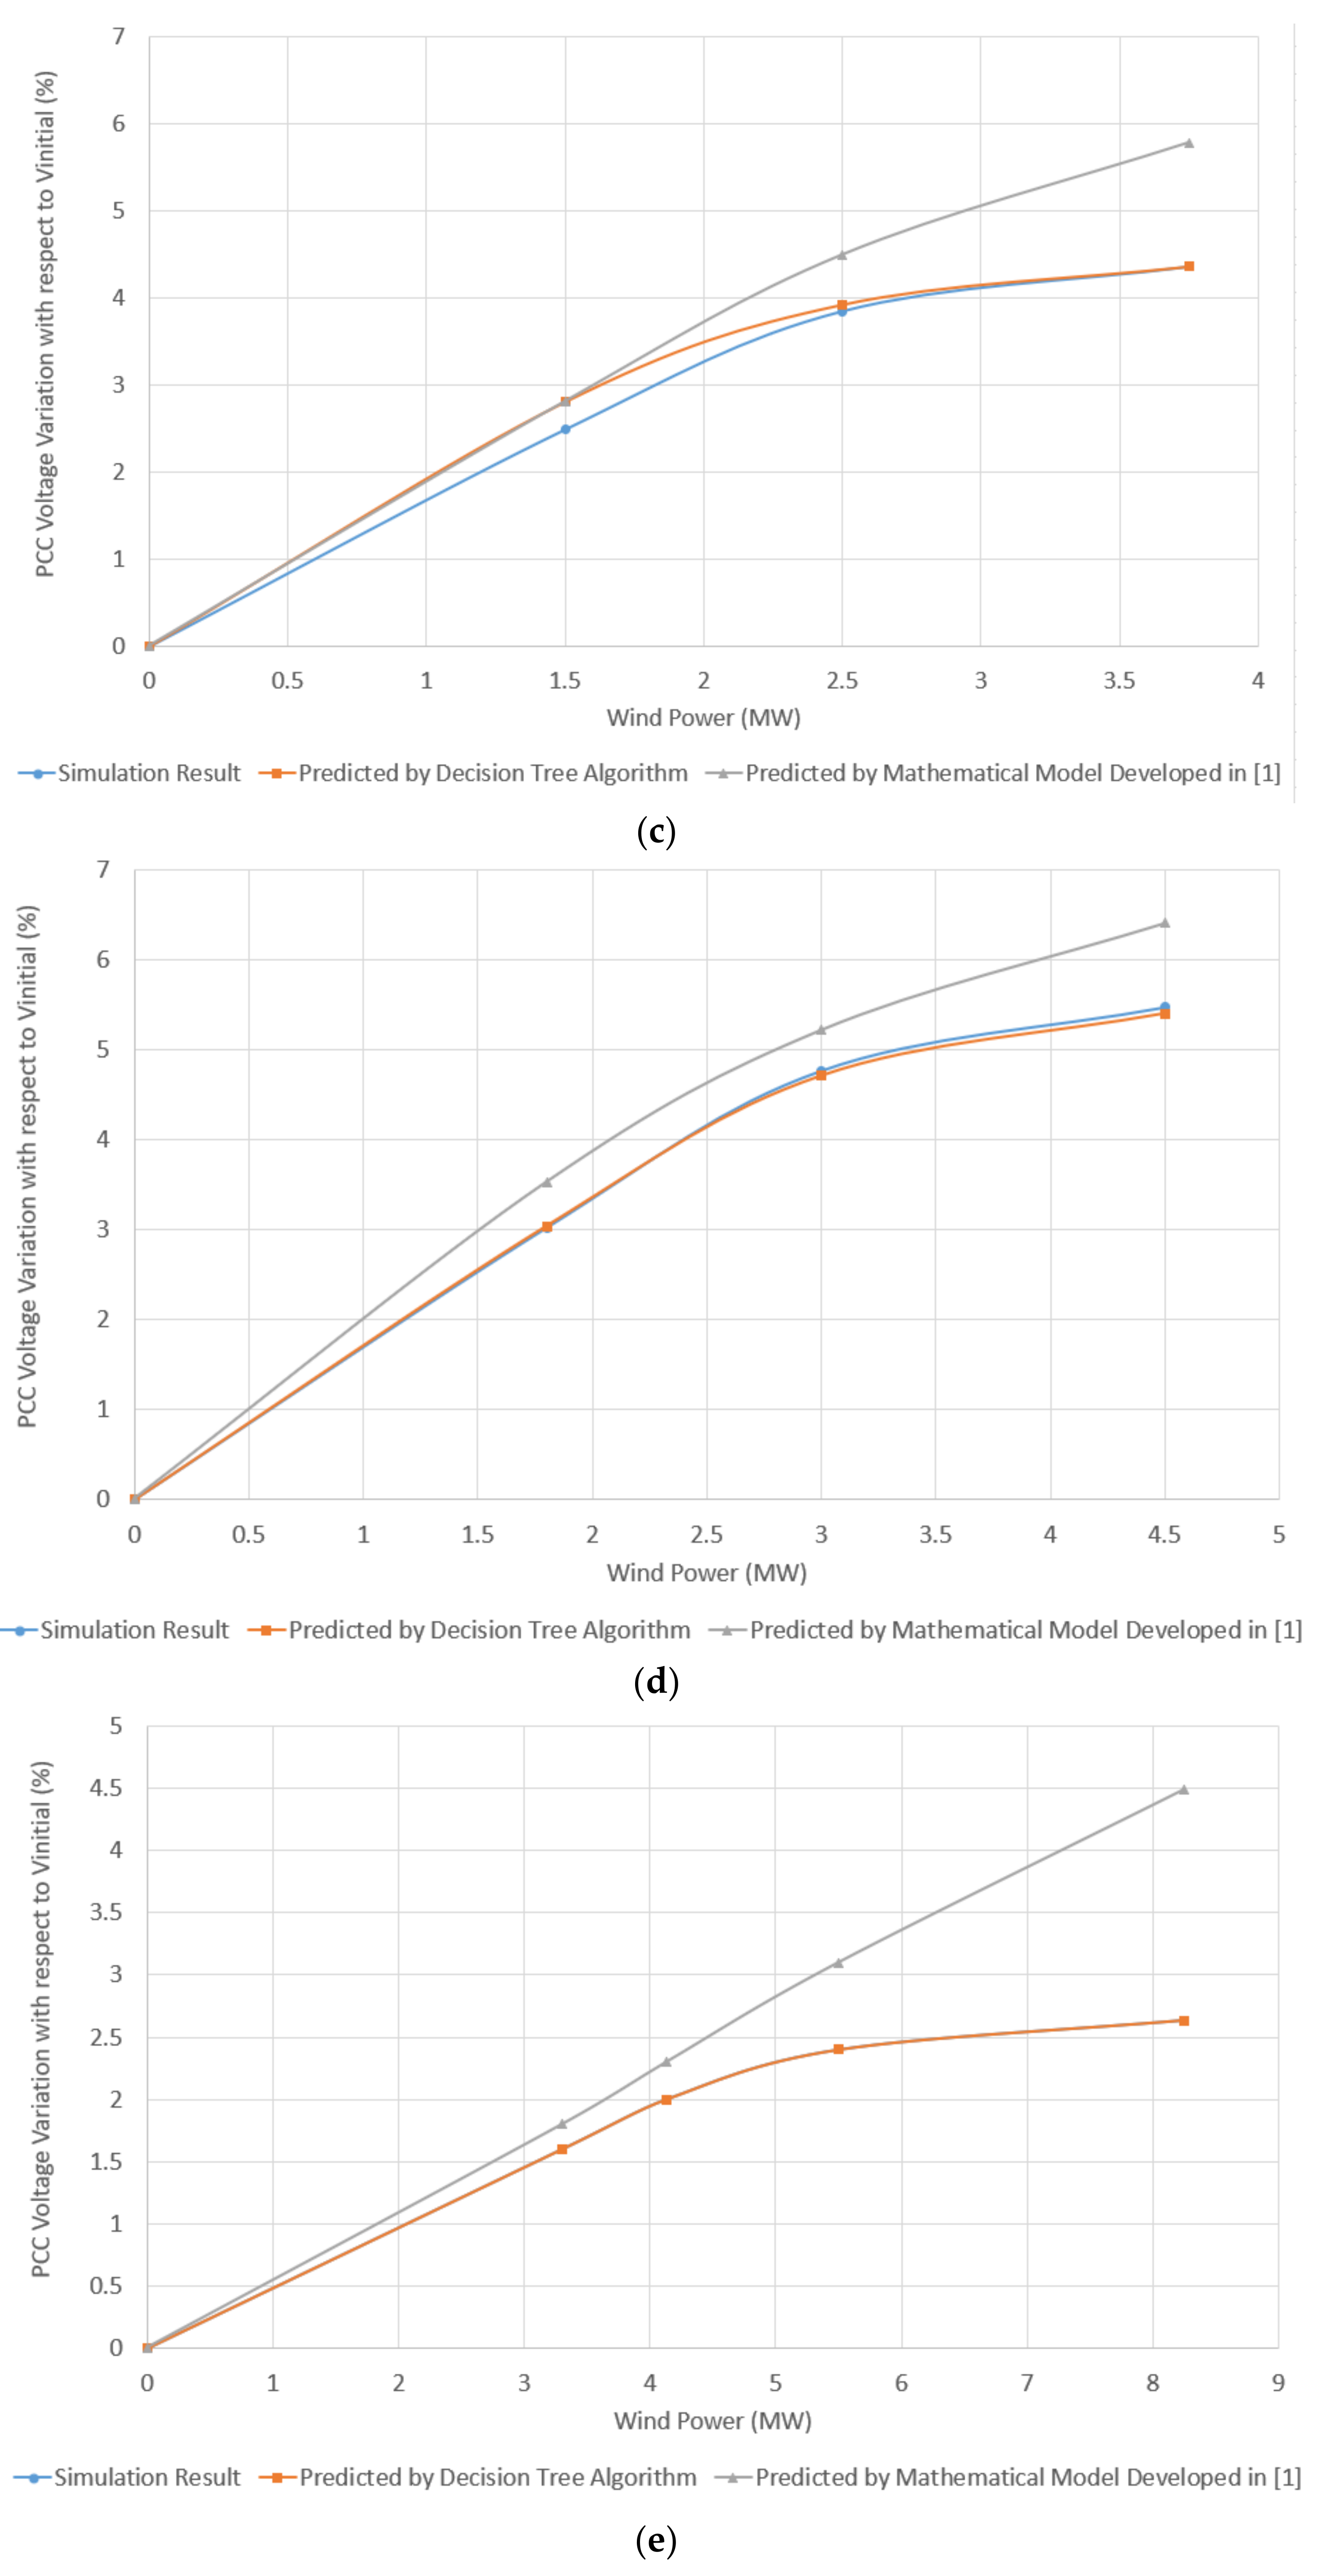
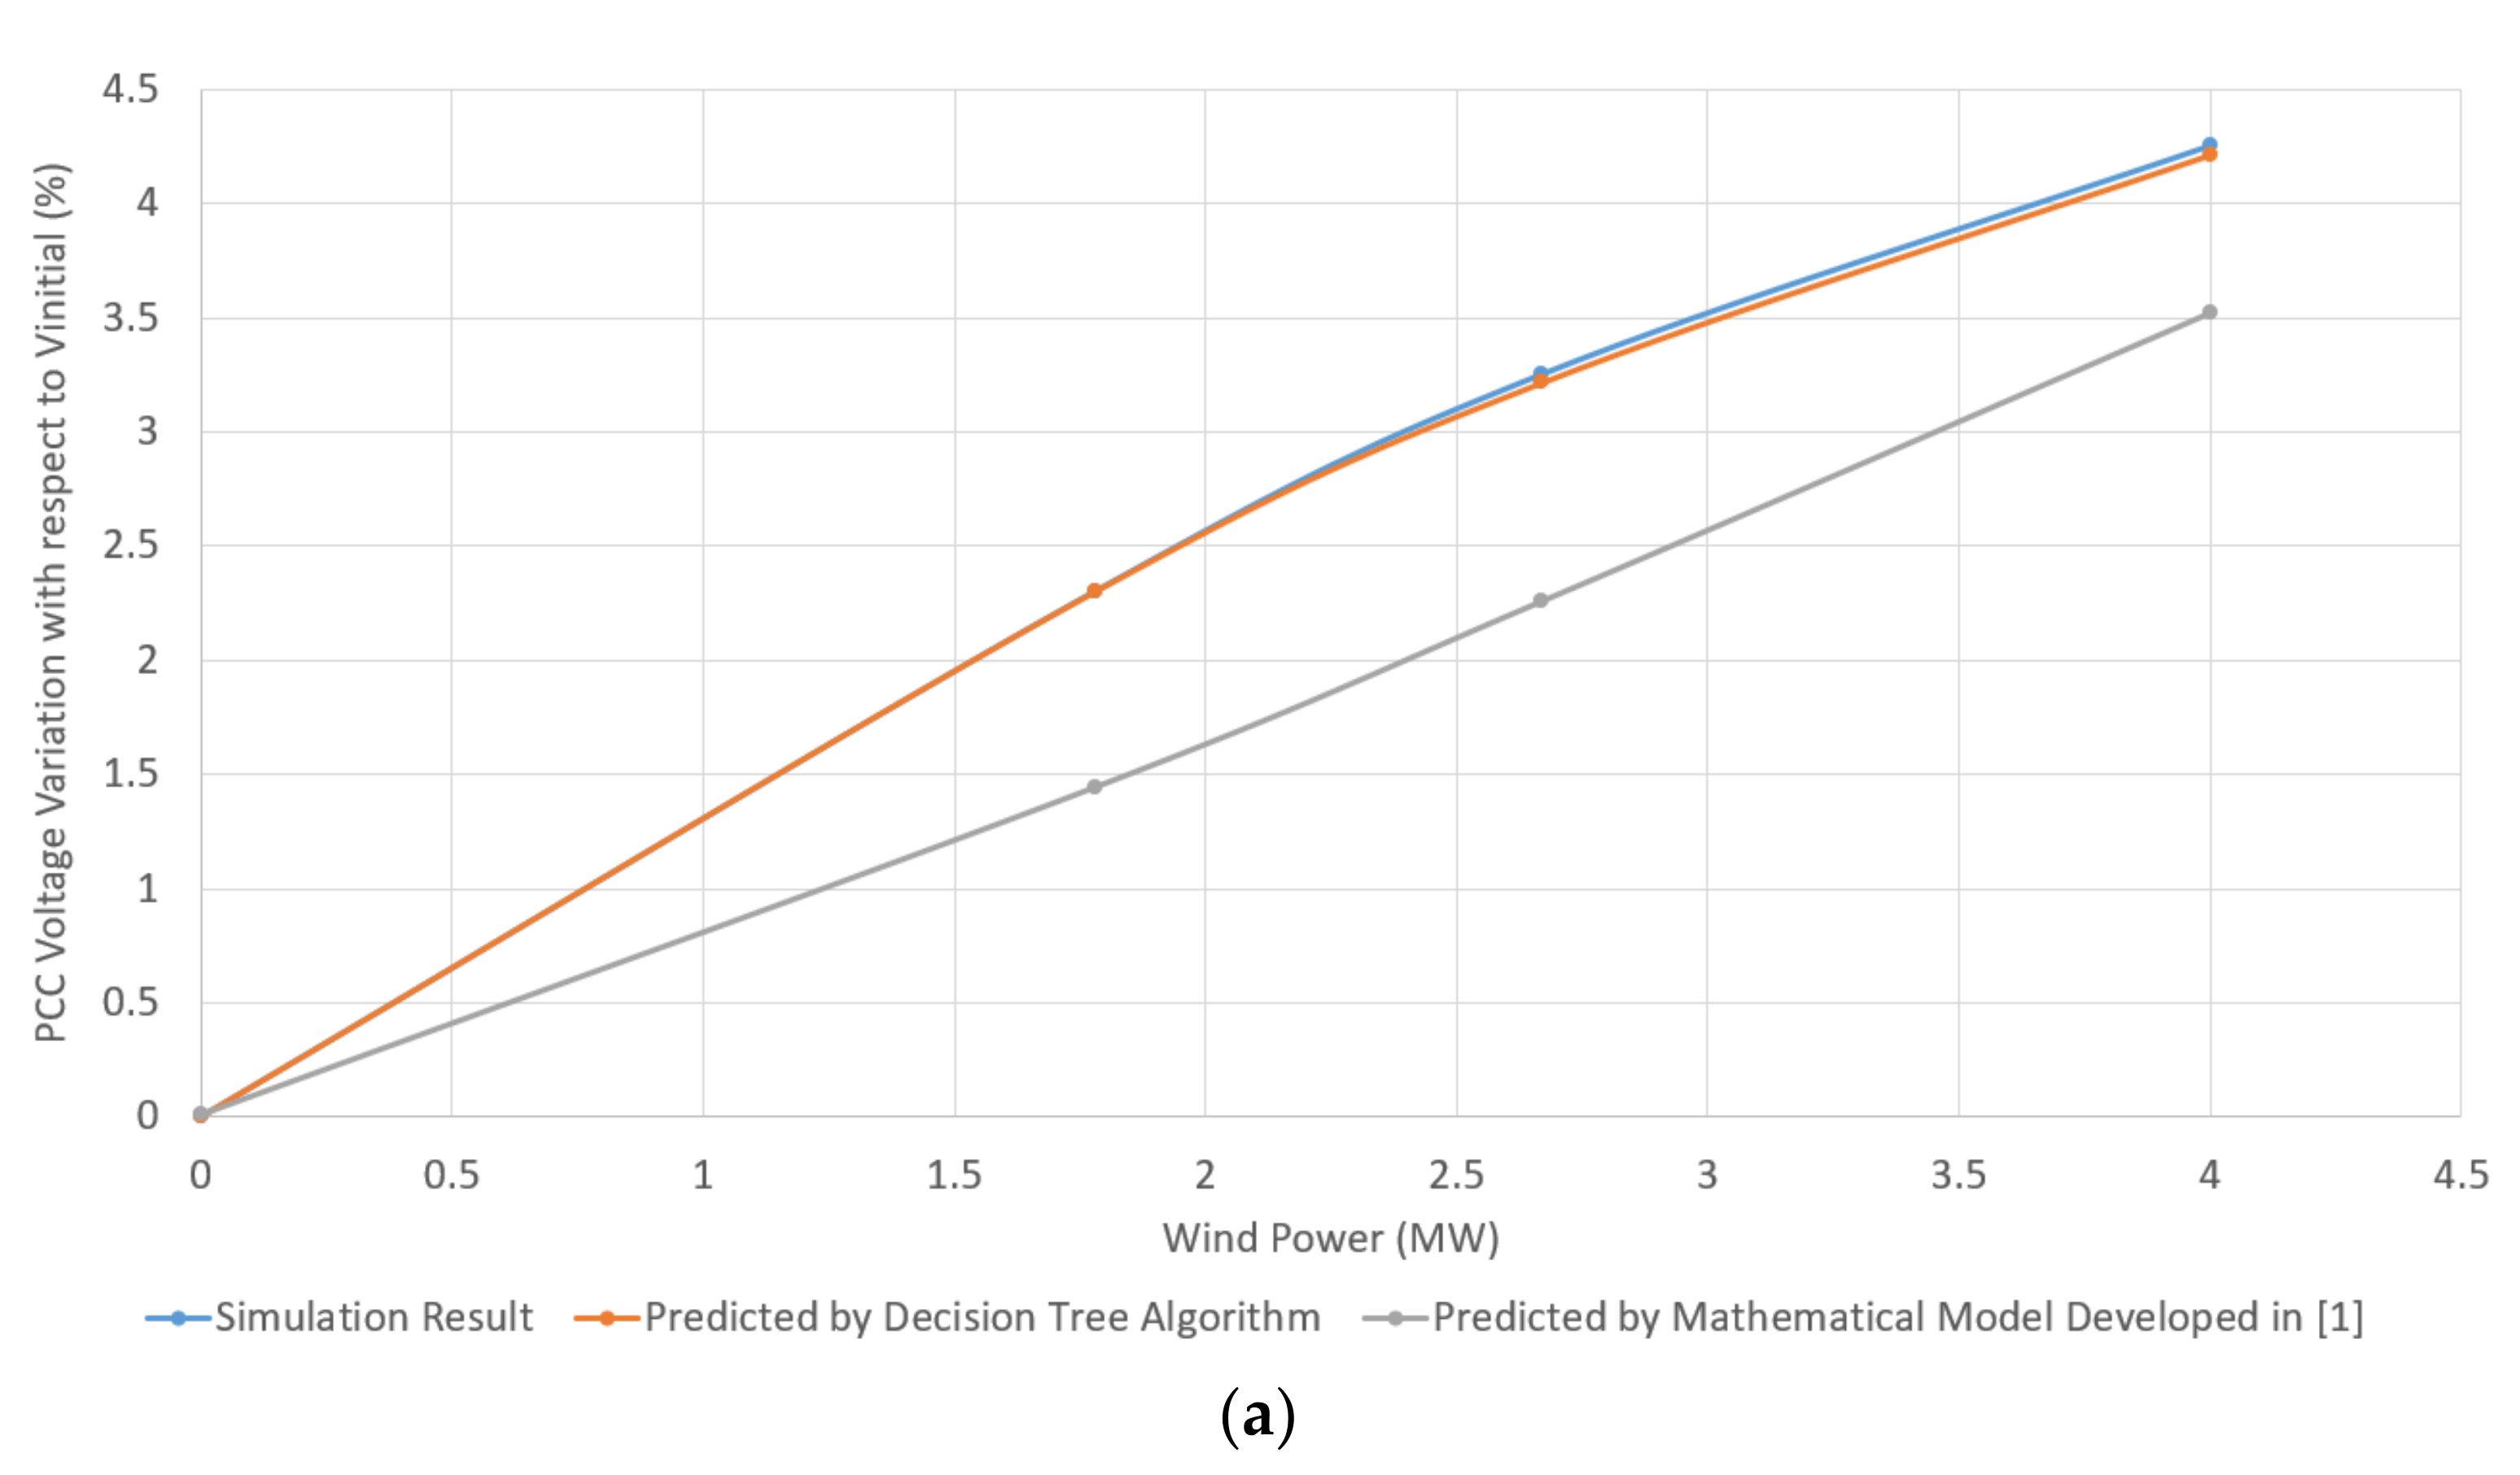
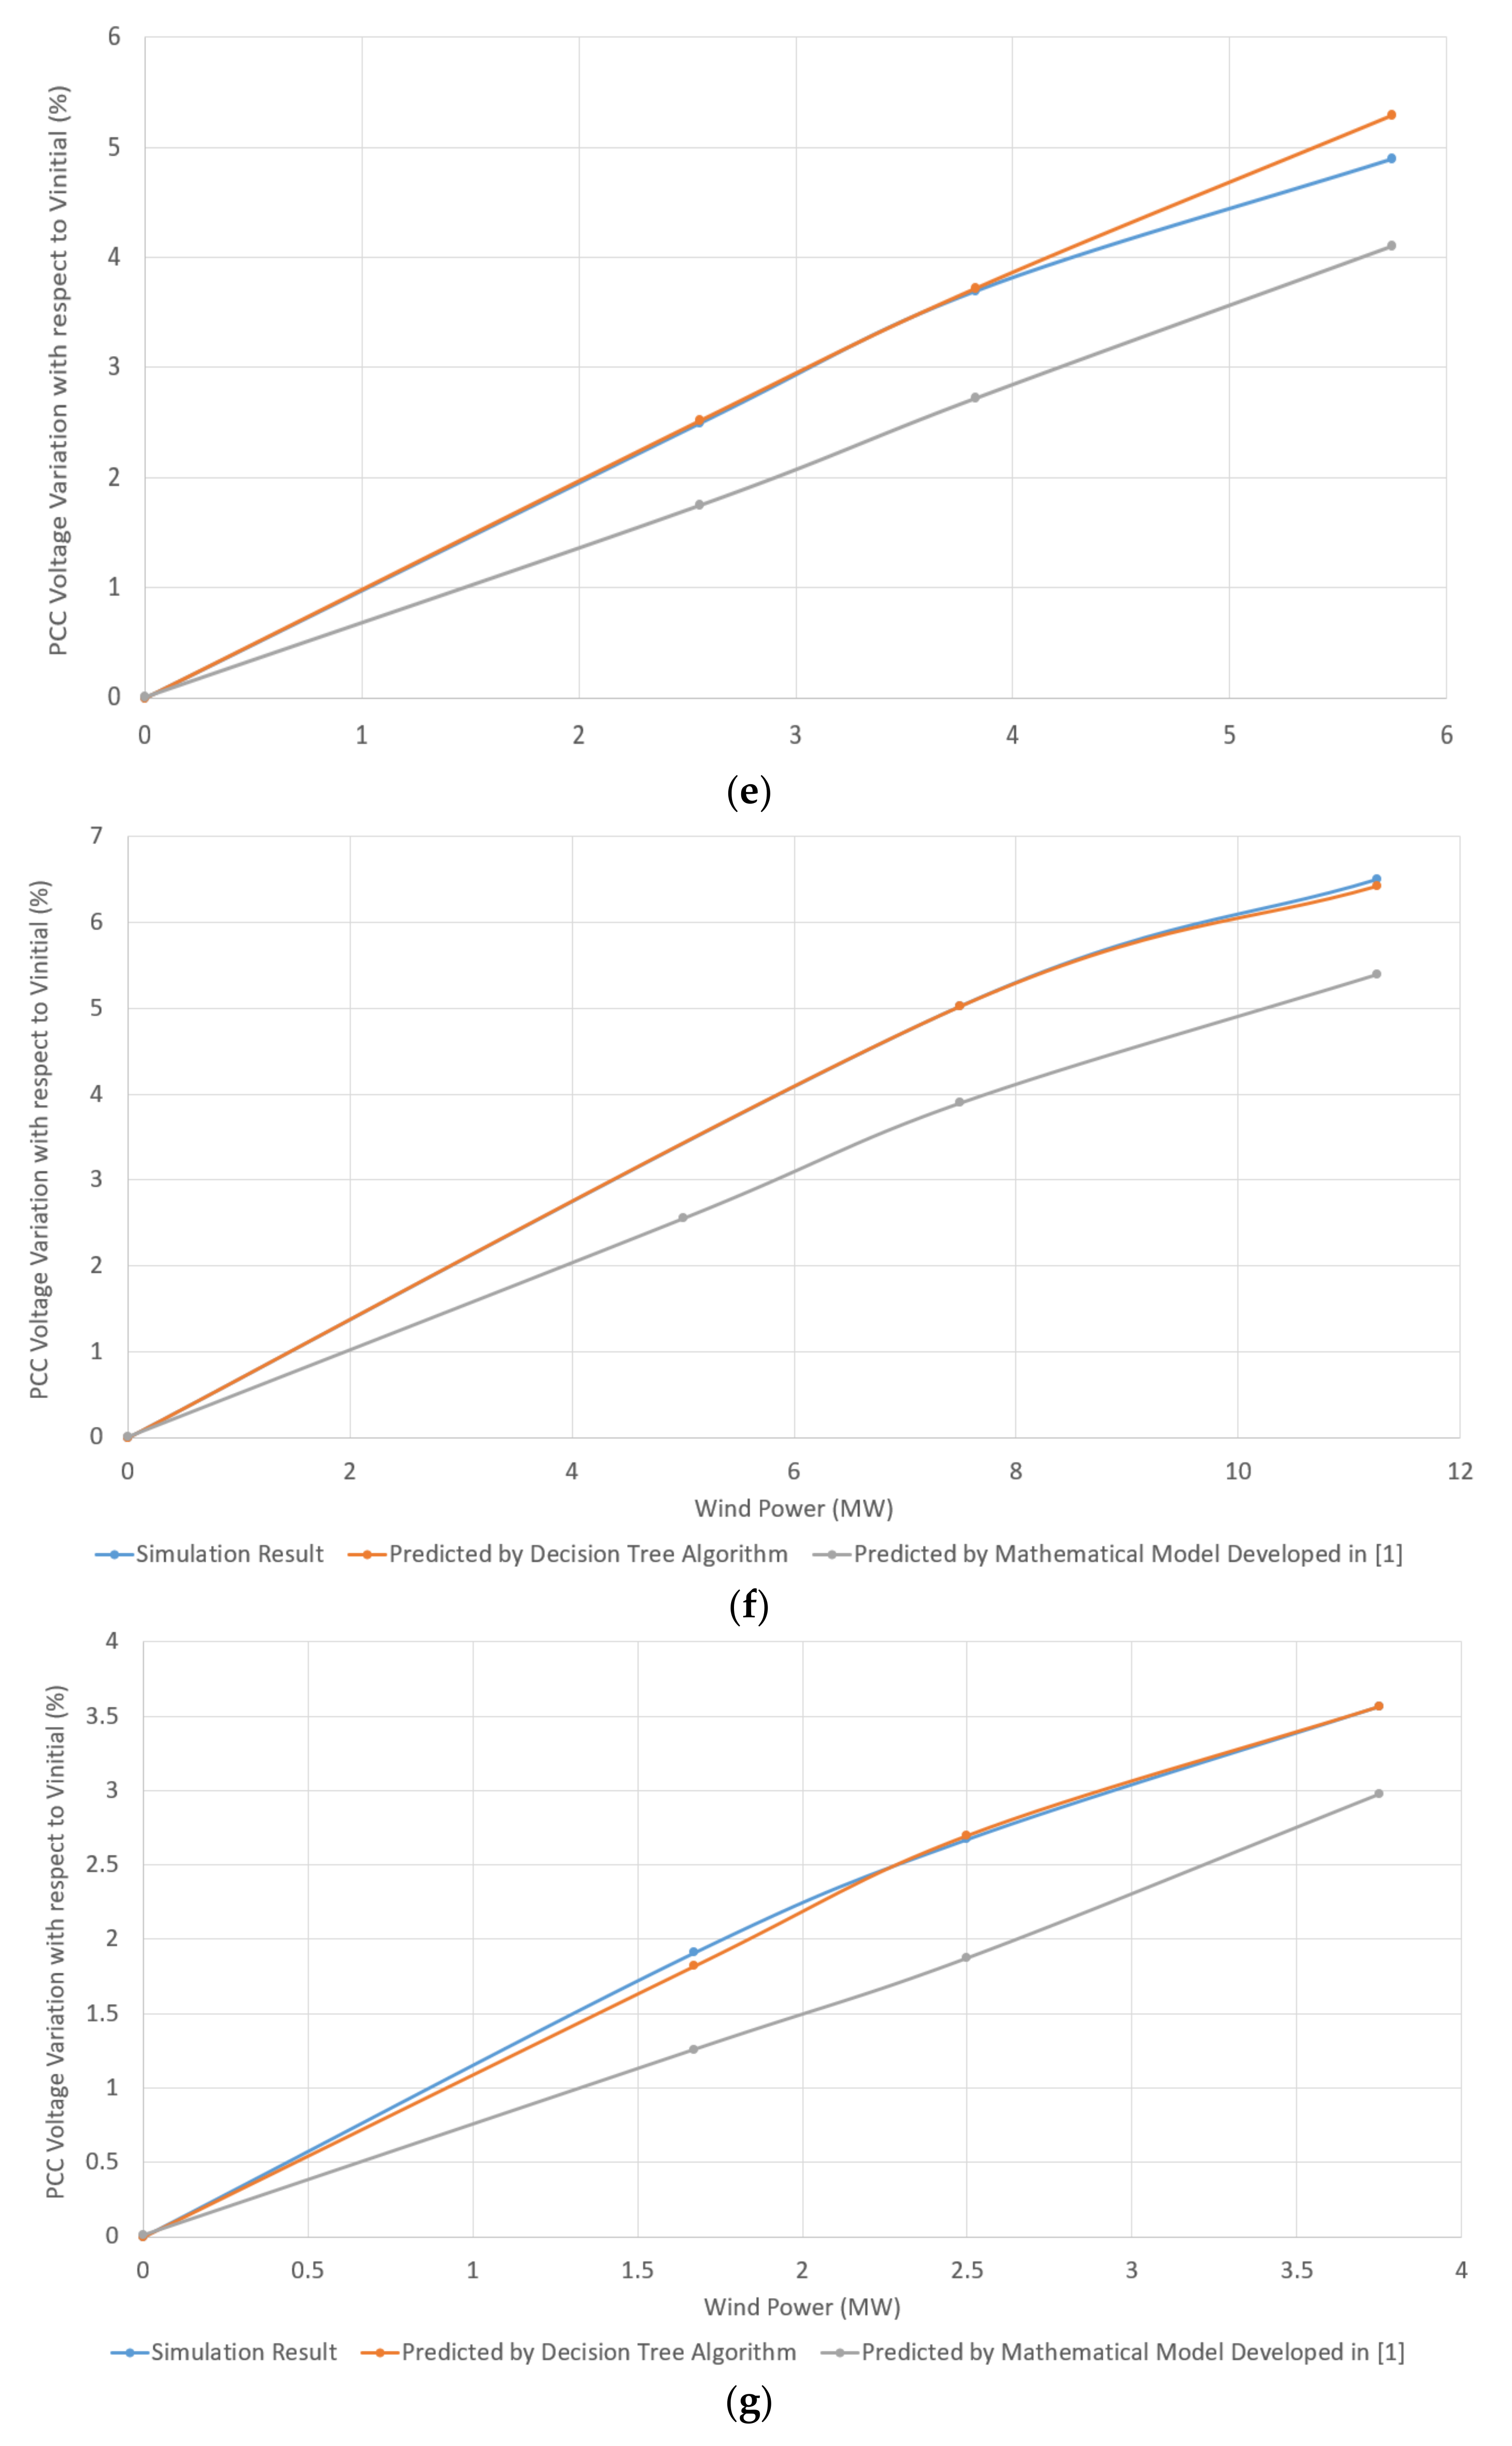
Figure 9a–i show the results gained for the test systems stated in Table 4.
Referring to Figure 9a–i, the prediction of the Pwind-dVPCC characteristics using the proposed decision tree-based model has a minimal error, while the error between the reference and predicted results are noticeable in most cases when the graphs are plotted using the mathematical equation. The results shown in Figure 9b related to the scenario with the smallest X/R (Scenarios 2) confirms the discussion presented in [1] regarding the low prediction accuracy of the mathematical equation for weak PCC sites with a small X/RPCC ratio. From Figure 9b, the error between the reference results gained by the simulation models and the graphs predicted by the mathematical model is over 1% when the wind power penetration is large, whereas the graph plotted using the proposed decision tree algorithm precisely tracks the reference curve characteristic for any level of wind power penetration. From Figure 9e, it can be seen that the highest error of the proposed decision tree-based model in predicting the Pwind-dVPCC curve characteristic is less than 0.5% in Scenario 5, while the error is greater than 1% in this scenario when the characteristic is predicted using the mathematical relation.
The next section compares the model proposed in this work with the mathematical model developed in [1] by calculating the exact value of the prediction error (PE) for each IG and DFIG-based scenario presented in Table 3 and Table 4.

3.3. Comparison of Decision Tree Model and Mathematical Model for Different Ranges of X/RPCC

To compare the prediction accuracy of the decision tree-based model proposed in this paper and the mathematical method developed in [1], the error between the predicted and reference Pwind-dVPCC characteristics, so-called prediction error (PE), was evaluated for the scenarios considered in Table 3 and Table 4. For each scenario, the prediction error is given by (7) [24]:
P . E . = 1 N i = 1 N Δ V P Δ V r 2
where:
  • N is the number of the Pwind-dVPCC data points;
  • ∆Vp expresses the dVPCC value obtained by the predictive models, i.e., the decision tree-based model proposed in this paper and the mathematical model presented in [1], given the Pwind value;
  • ∆Vr expresses the reference dVPCC obtained using the test simulation systems for each level of wind power penetration.
As an example, the PE values of both the proposed decision tree algorithm and mathematical model developed in [1] were calculated for test system 2 in Table 3, as shown in (8) and (9). The curve characteristics shown in Figure 8b were used to find the ∆Vp and ∆Vr values, as shown in Table 5.
Prediction error for the proposed decision tree-based model:
P . E . = 1 3 2.030 2.031 2 + 3.158 3.158 2 + 3.538 3.532 2 = 1.07085 E 5
Prediction error for the mathematical model presented in [1]:
P . E . = 1 3 2.270 2.031 2 + 3.880 3.158 2 + 5.217 3.532 2 = 1.138728
To address the randomness of the prediction by decision tree algorithm, 3 tries were performed for each test system mentioned in Table 3 and Table 4, and the PE value was considered to be the mean value of the tries.
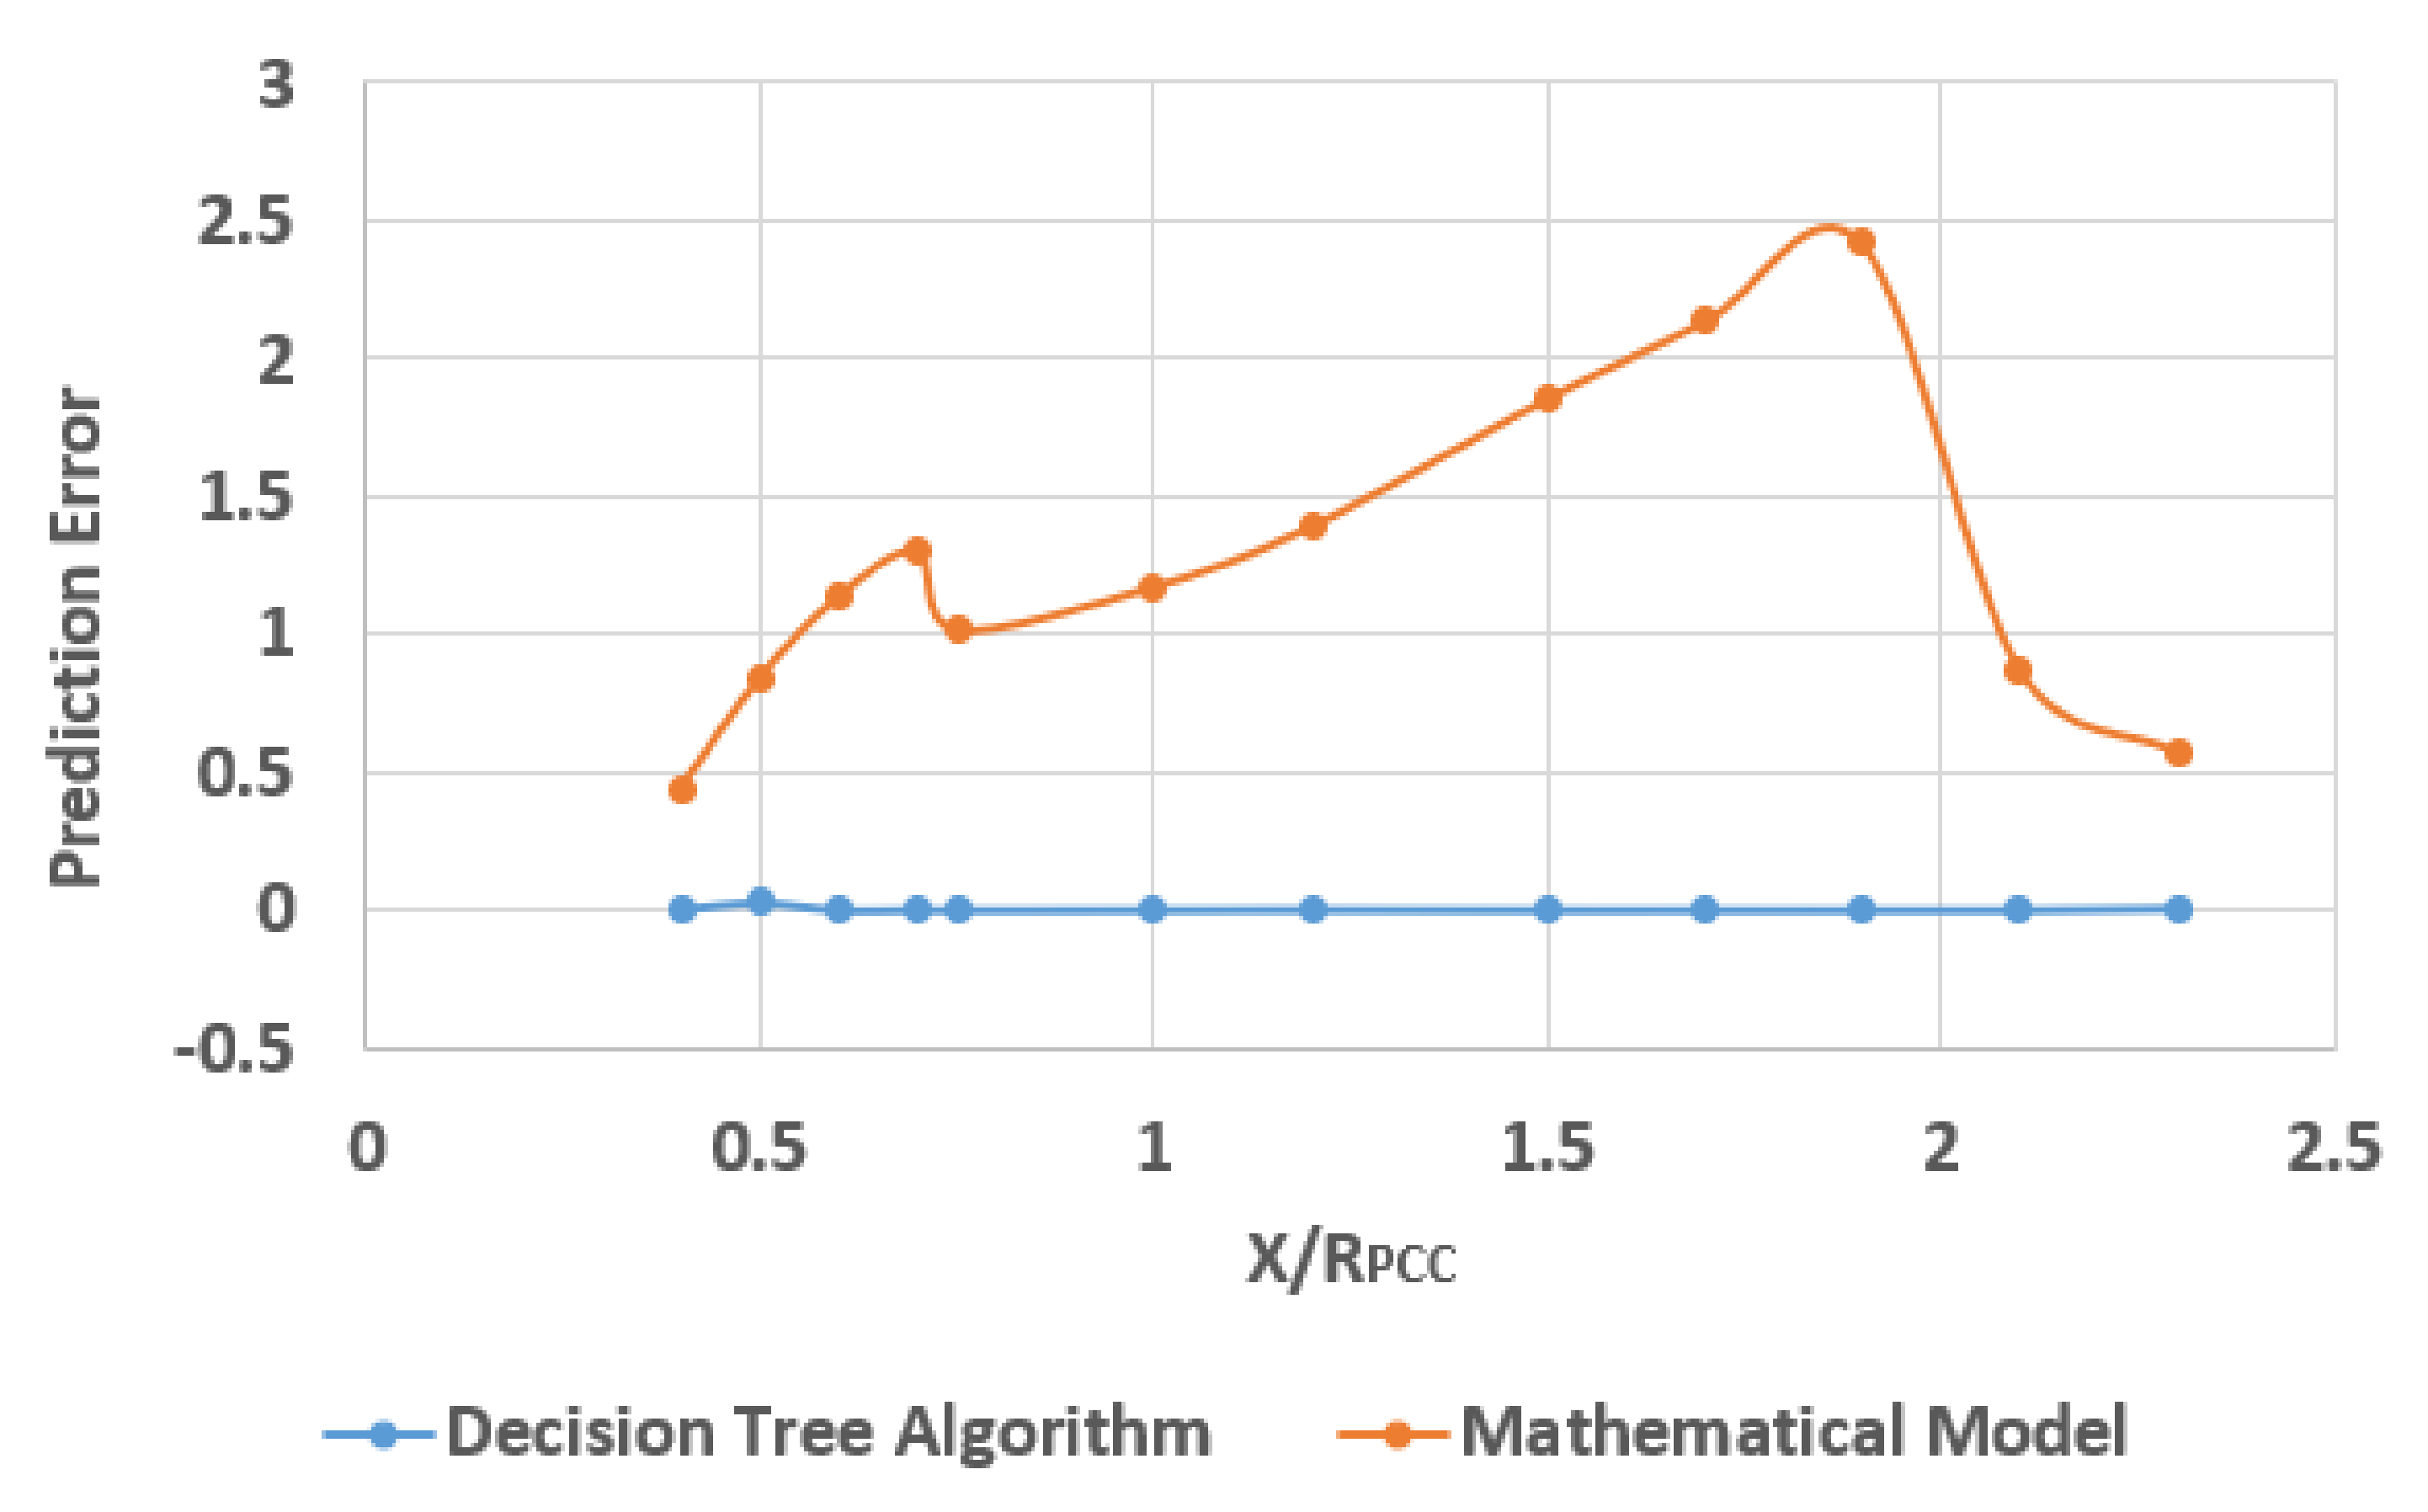
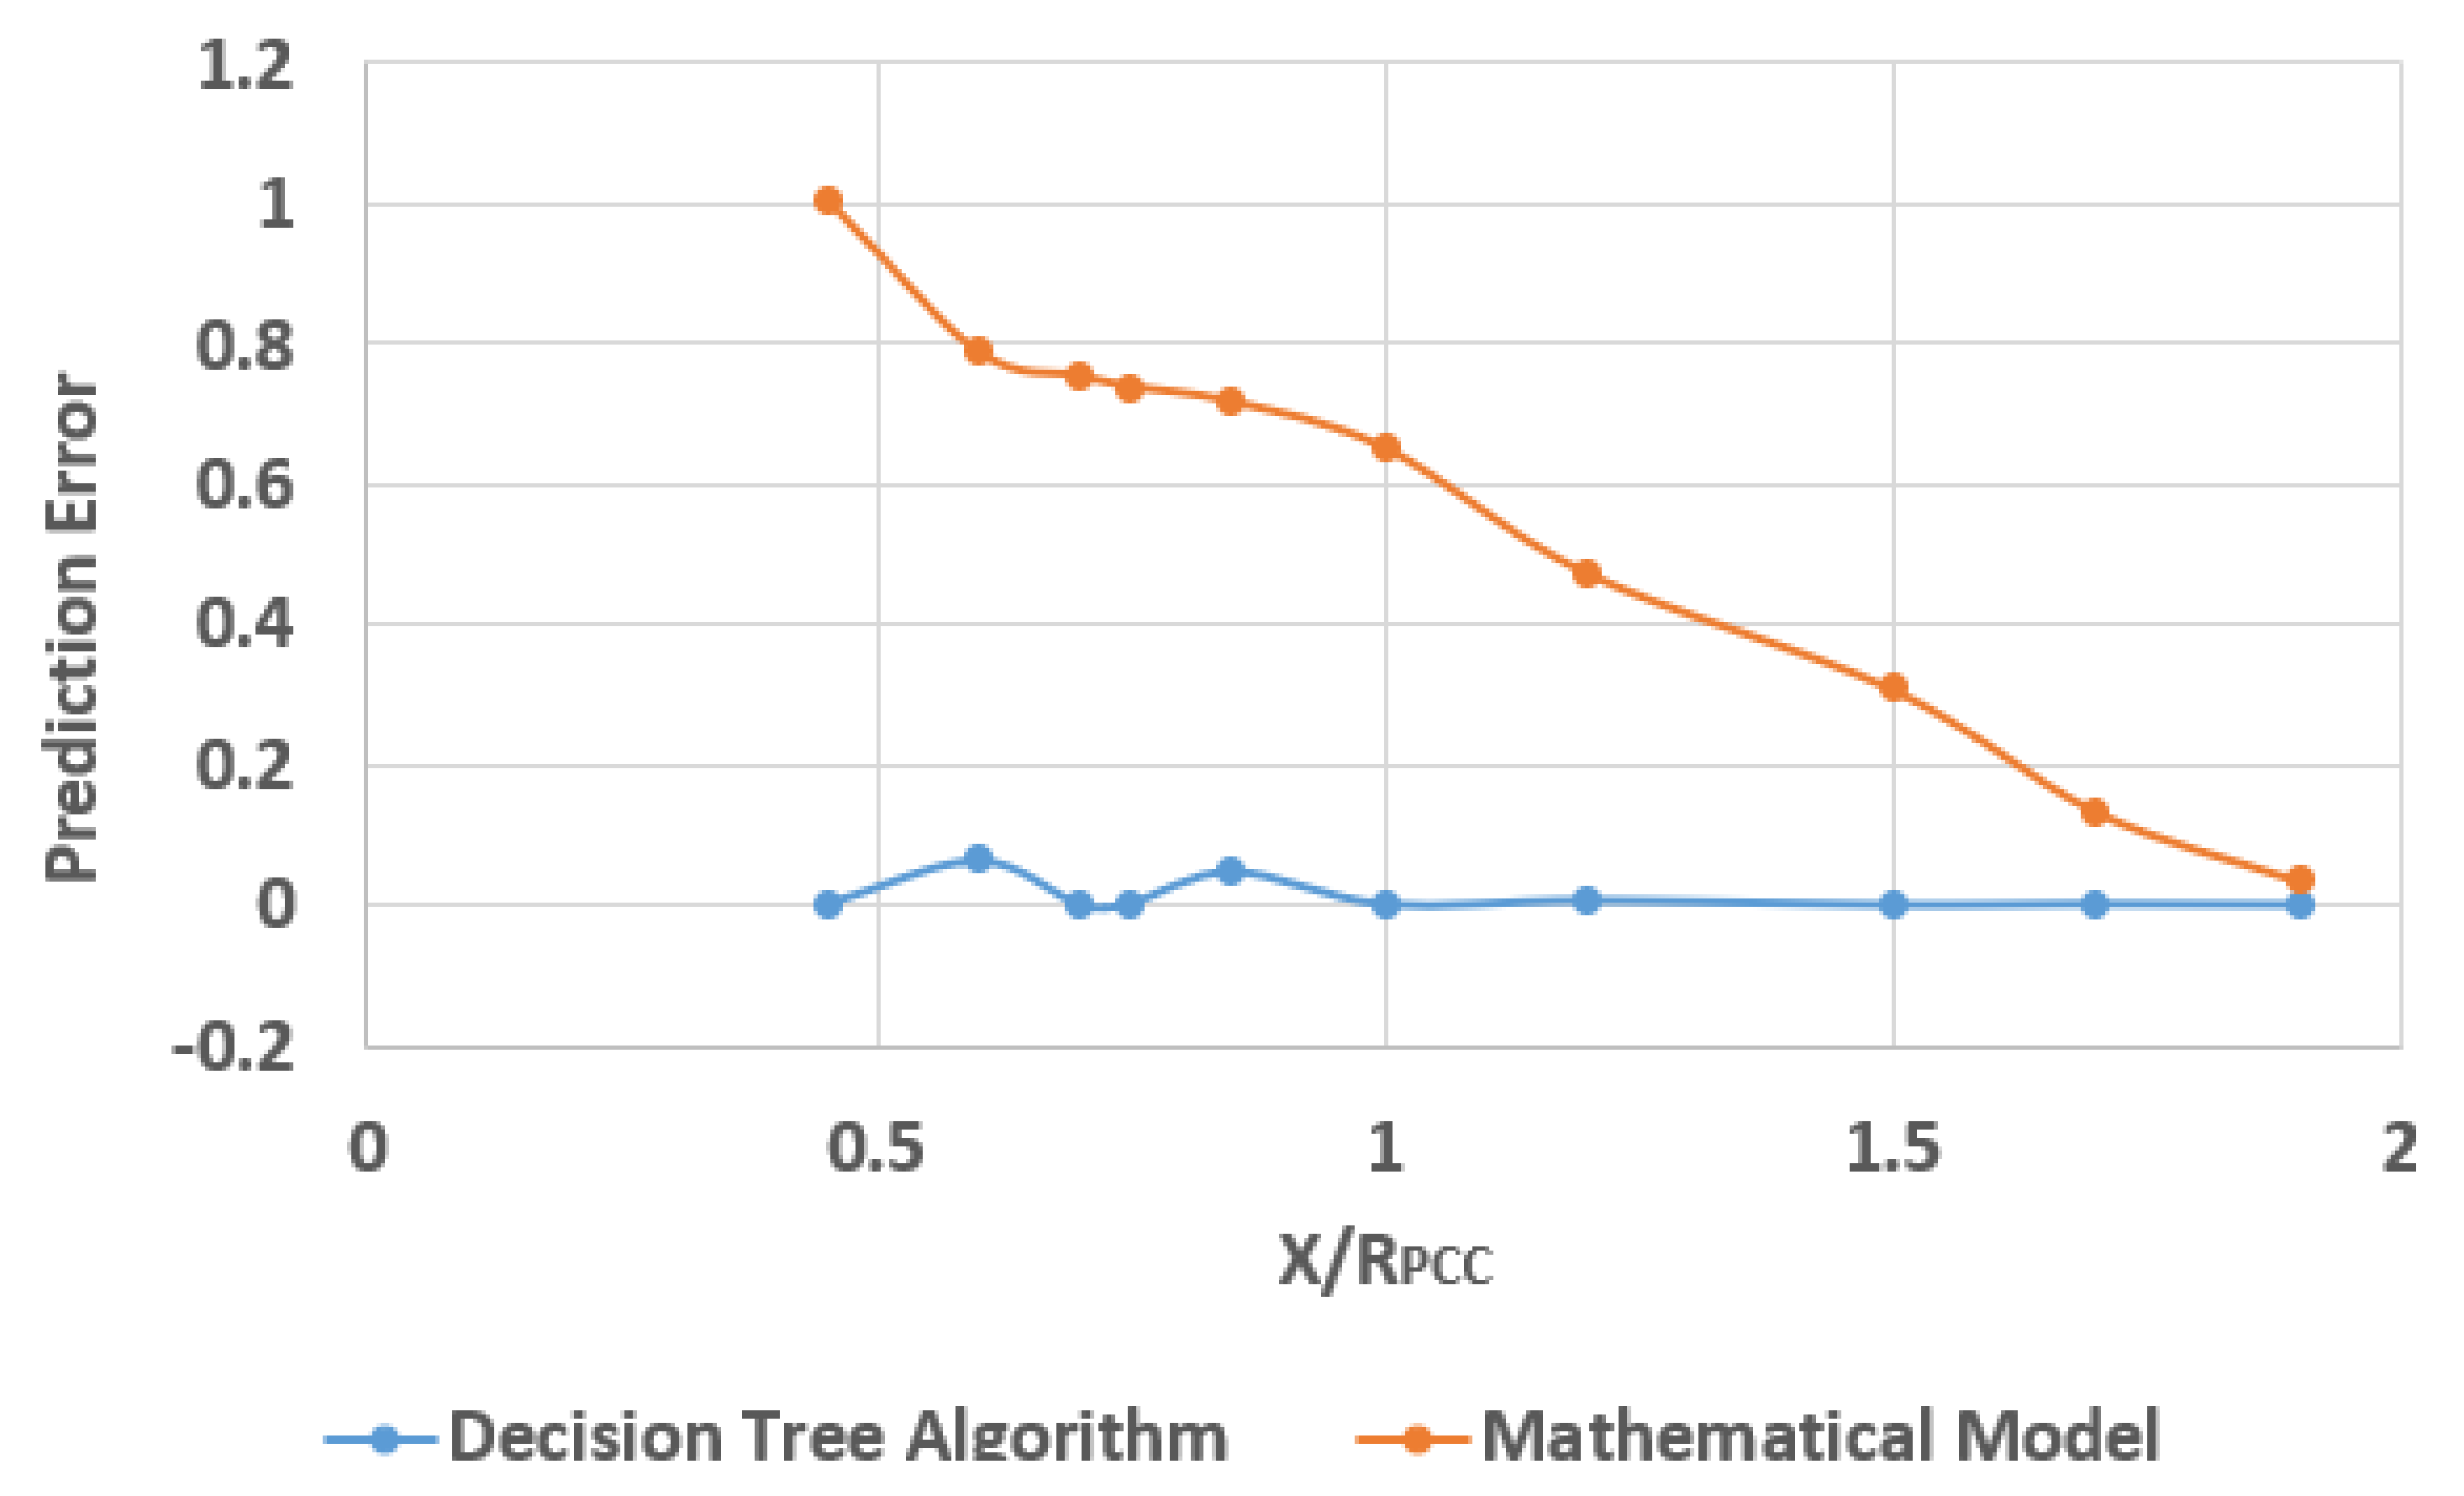
Figure 10 and Figure 11 show the PE values calculated for the IG and DFIG-based test systems, respectively.
For the IG-based scenarios, the PE values resulted from the proposed decision tree algorithm are negligible for any X/RPCC ratios, whereas the maximum prediction error of the mathematical model is 2.5% when the X/RPCC ratio is around 2. This confirms the findings discussed in Section 3.1 that the accuracy of the mathematical model is adversely impacted when the X/RPCC ratio tends to 2.
For the DFIG-based scenarios, the maximum PE of the proposed decision tree algorithm is less than 0.1% in the scenarios with a small X/RPCC ratio. However, the maximum P.E value of the mathematical method is 1%, which occurred in the scenario with the smallest X/RPCC ratio. Therefore, as mentioned in the previous section, the accuracy of the mathematical model in predicting the Pwind-dVPCC characteristics is low at the interconnection sites with a small X/RPCC ratio, while the proposed decision tree algorithm overcomes this issue.

4. Significance of the Proposed Decision Tree-Based Model

The decision tree-based model proposed in this study encompasses the advantages of the similar methods proposed for simplifying the WPP sizing and siting, while it significantly provides higher accuracy. Referring to the results shown in the previous section, the proposed model enables to accurately predict the Pwind-dVPCC characteristic for any X/RPCC ratio and SCC and SCR values. Consequently, for a potential WPP interconnection site, design engineers can calculate the VPCC profile given the Vinitial value using (3) and plot the Pwind versus VPCC profile characteristic.
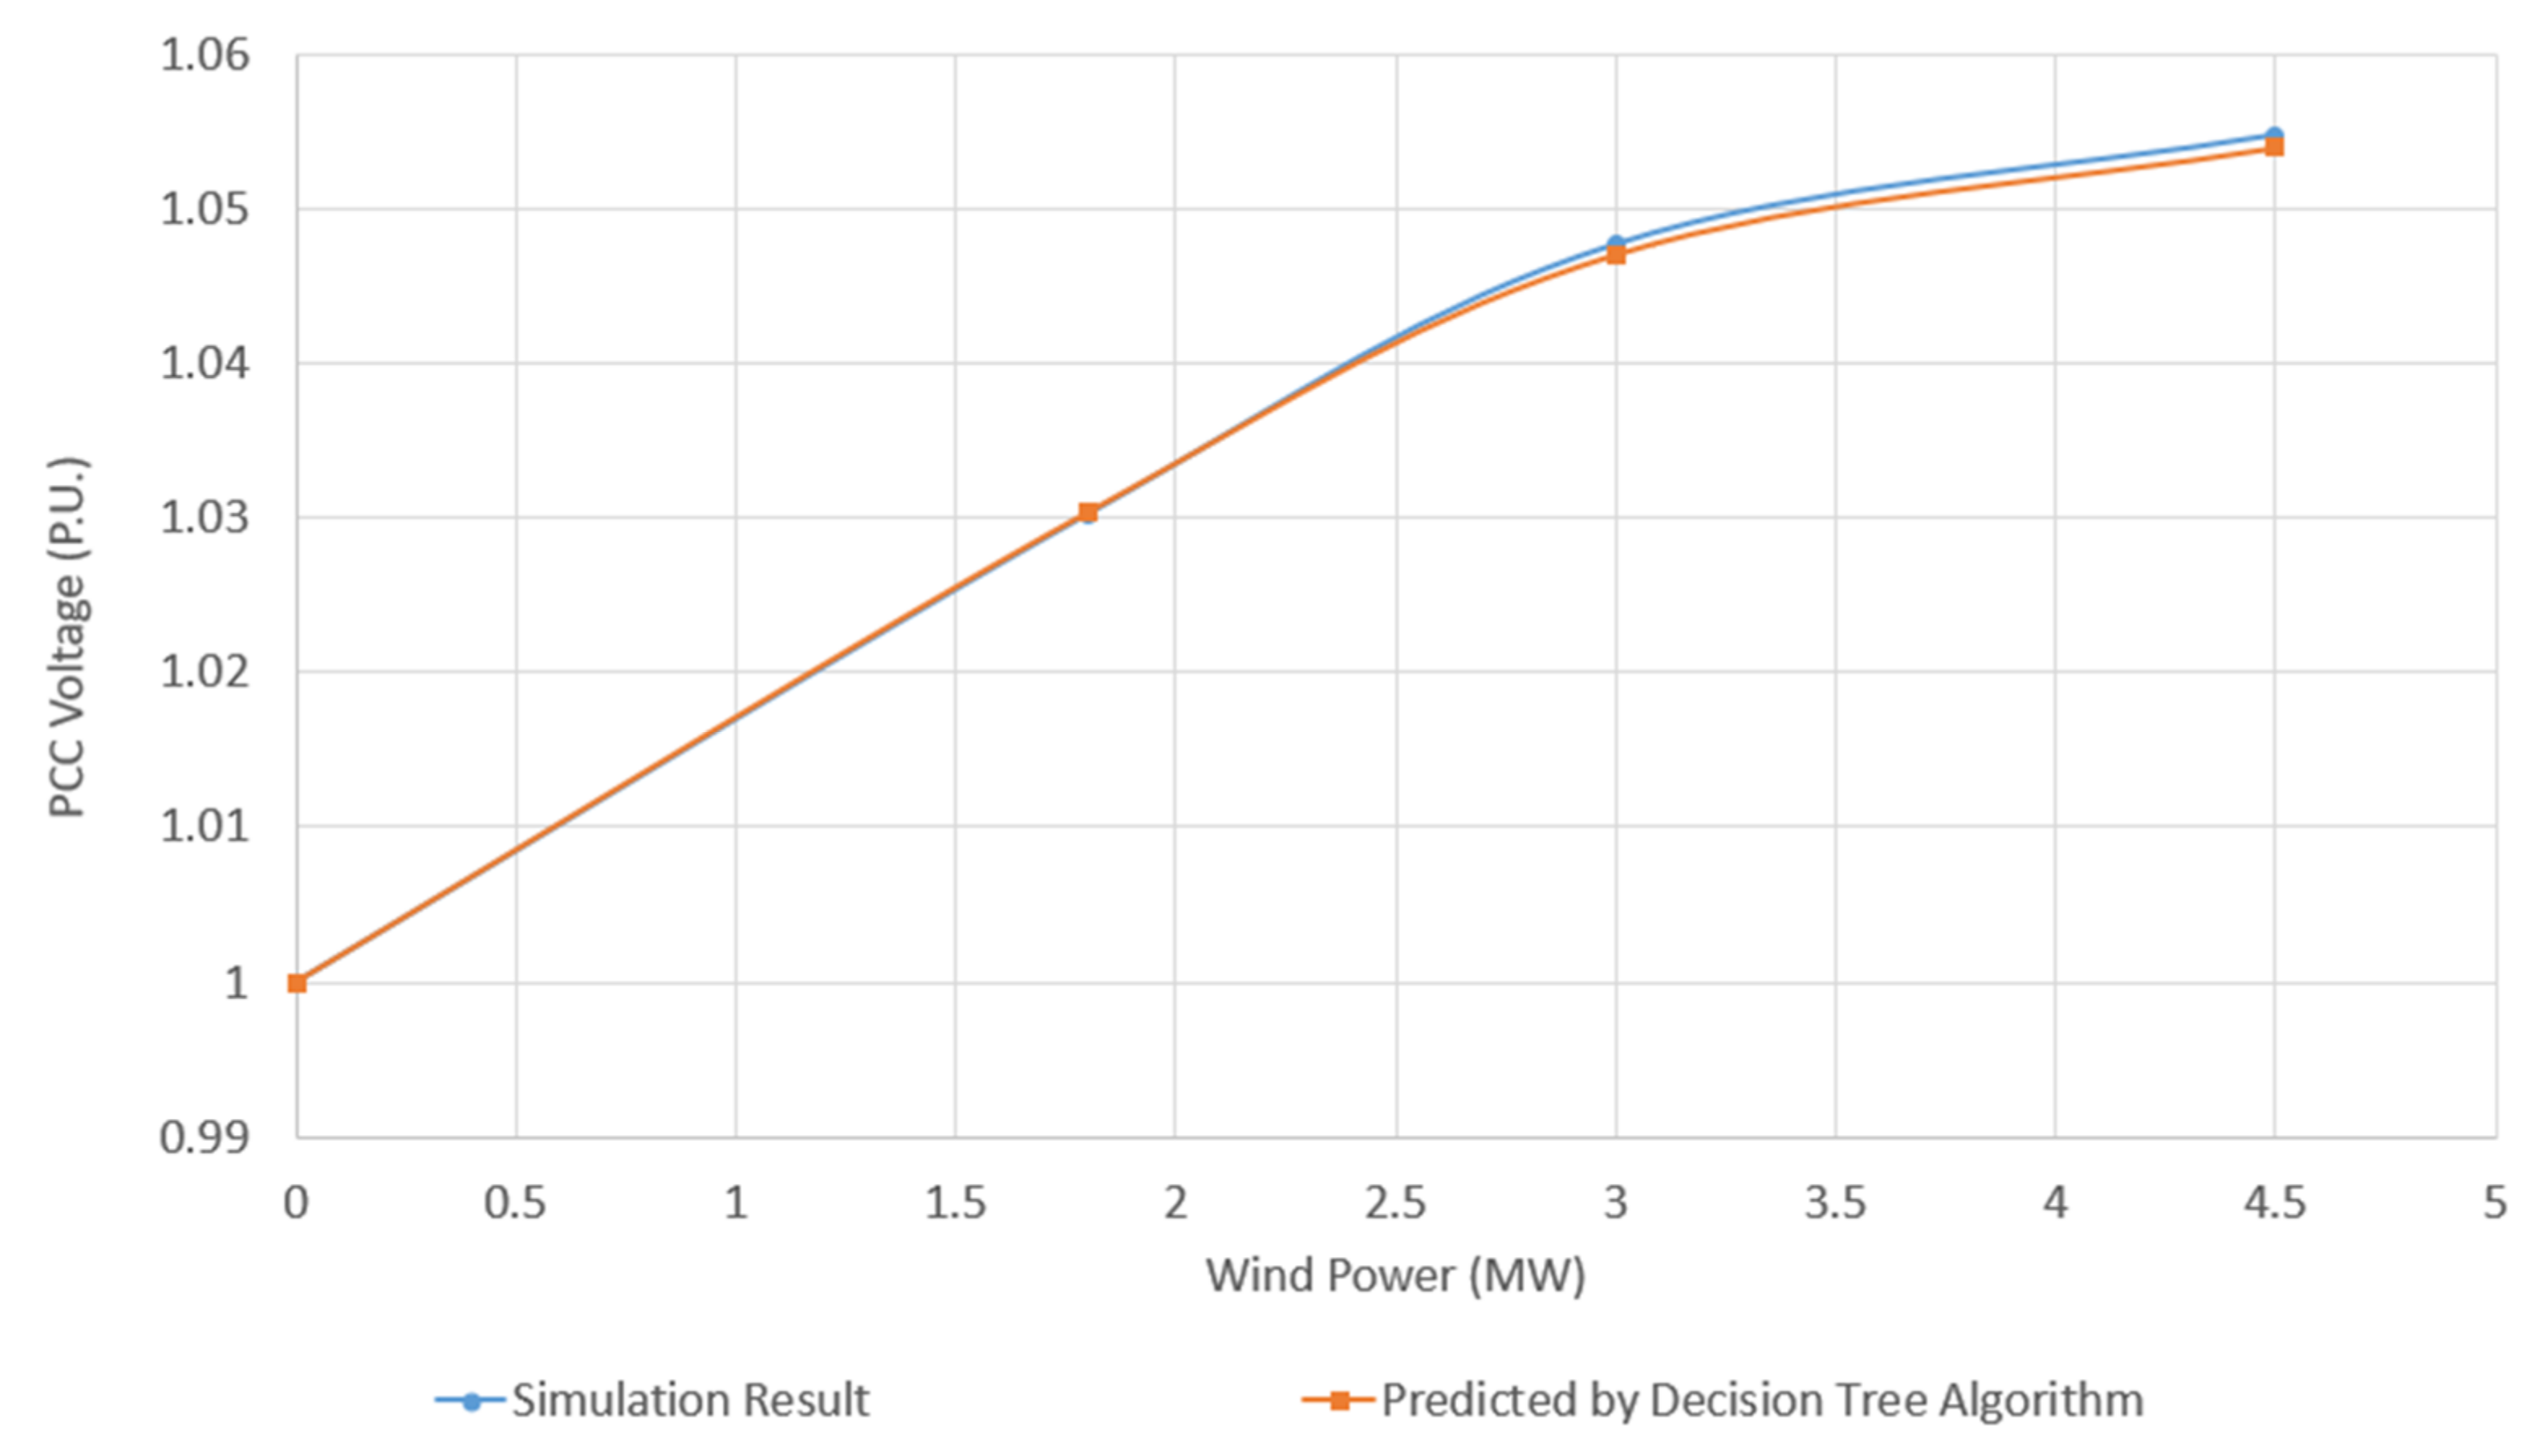
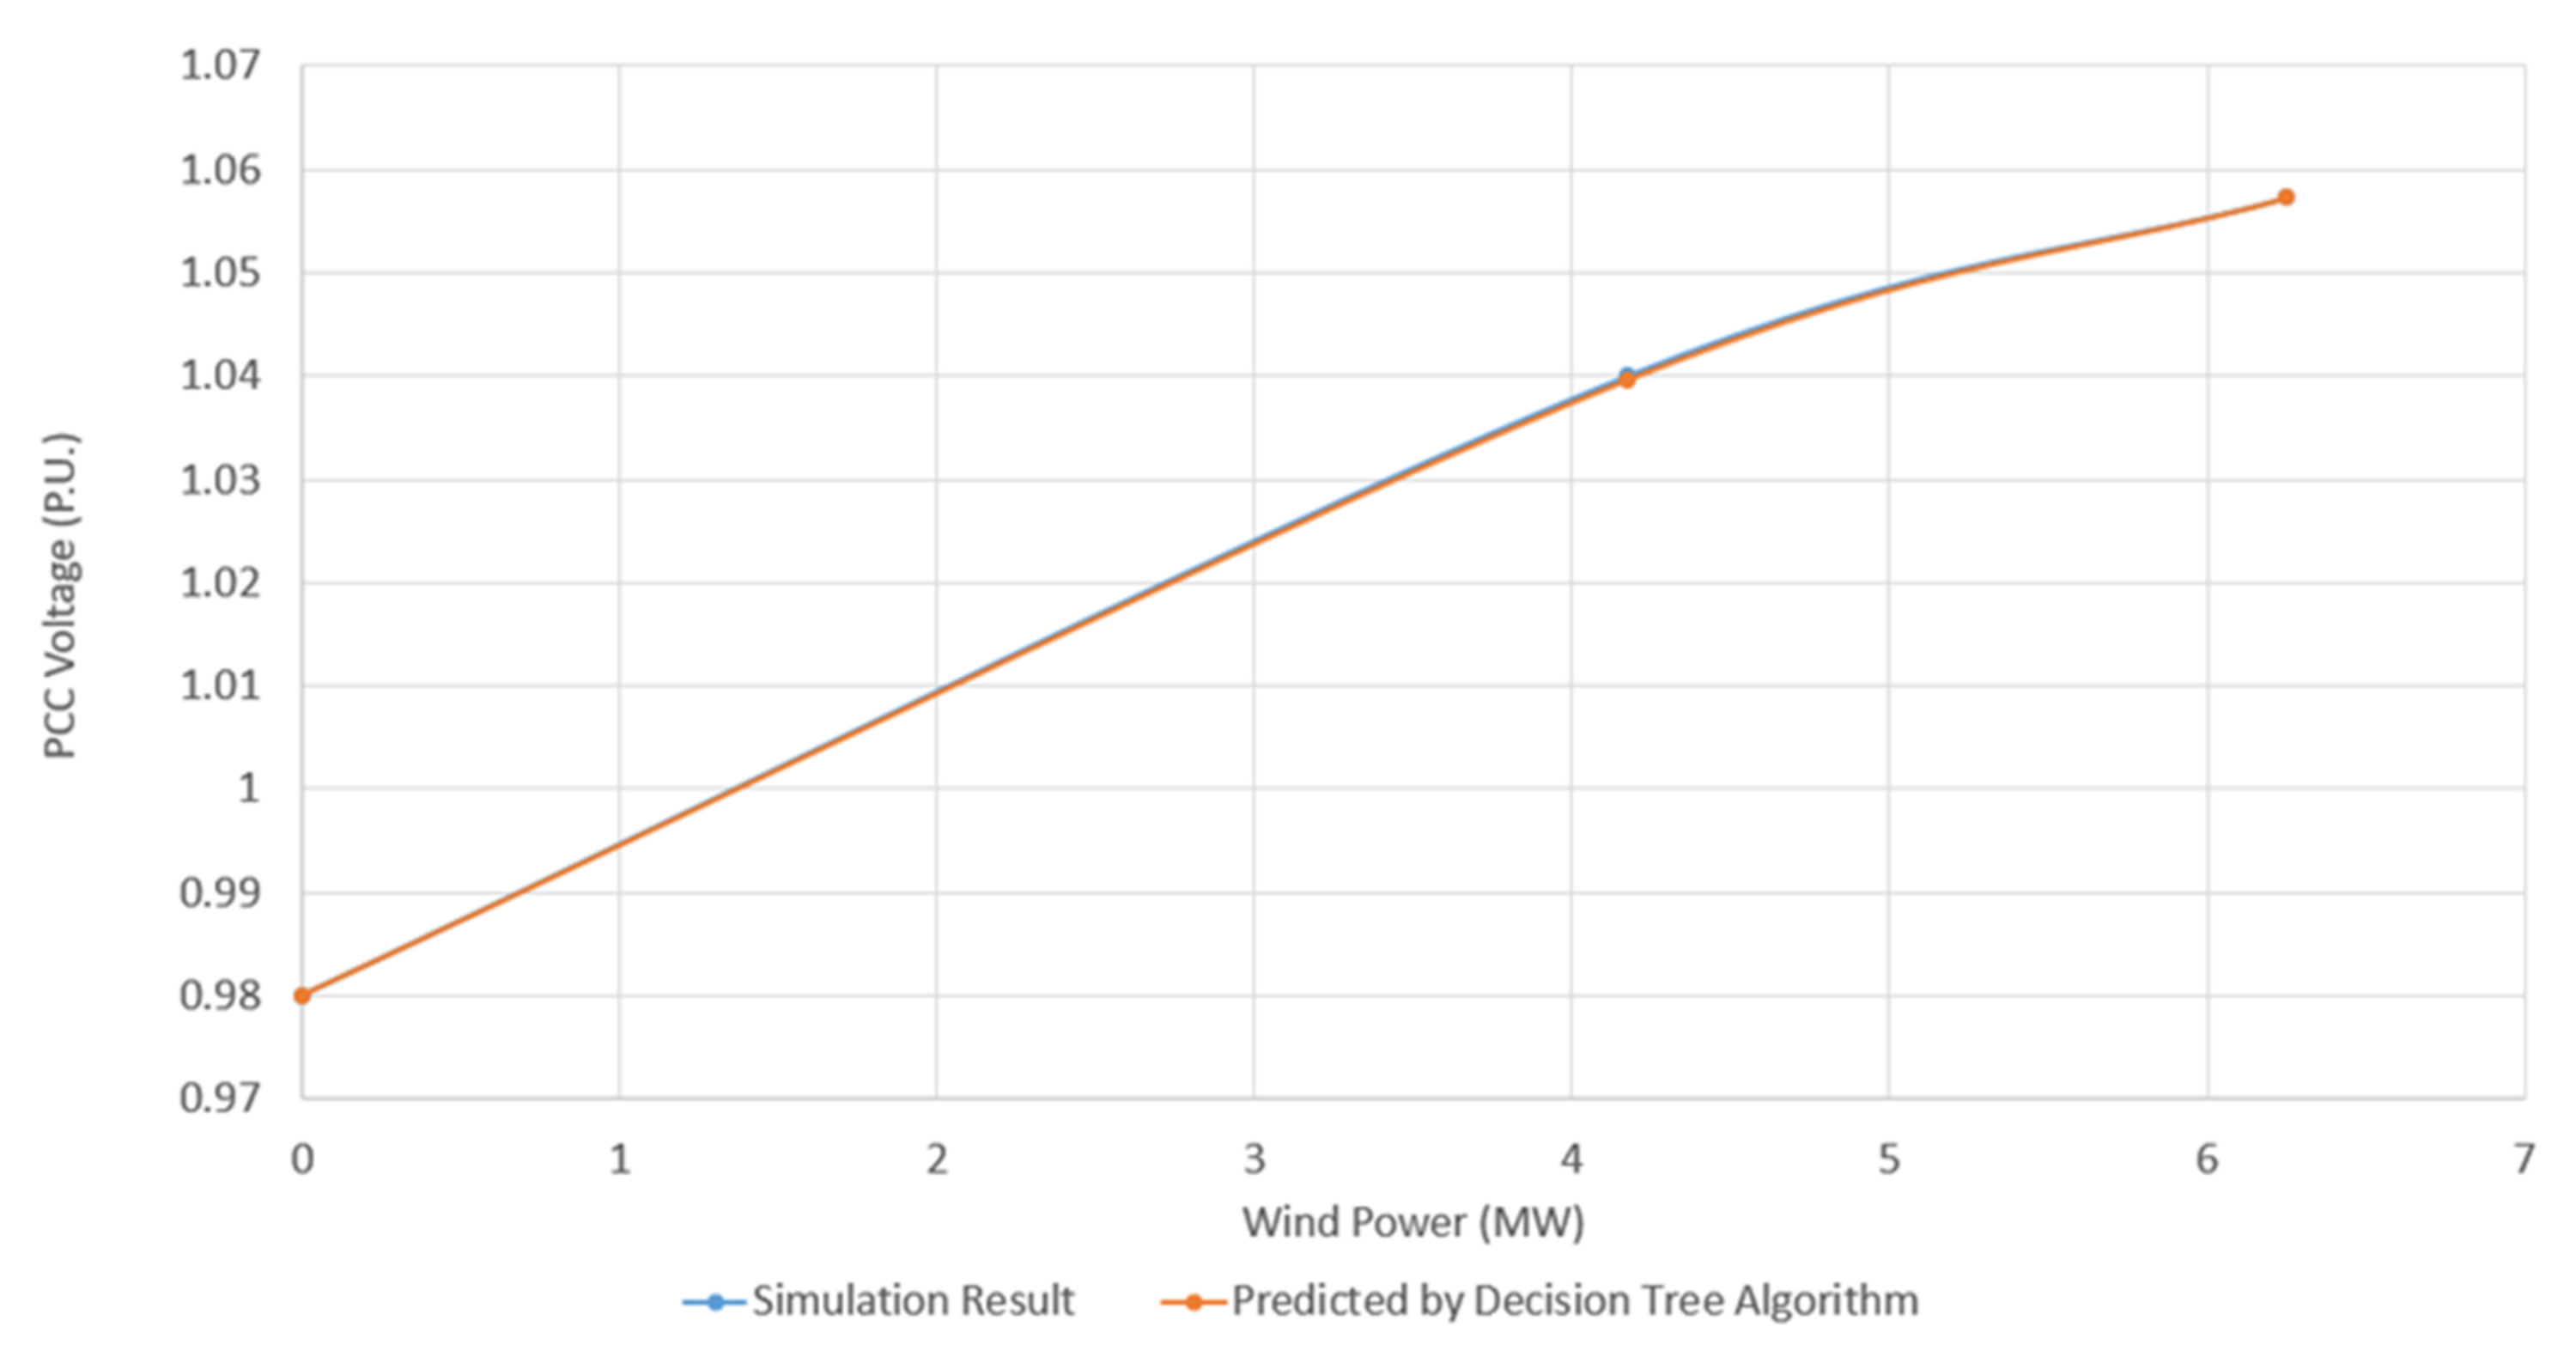
For example, Figure 12 and Figure 13 show the Pwind-VPCC characteristic for one of the IG-based scenarios (Scenario 4 in Table 3) and one of the DFIG-based scenarios (Scenario 2 in Table 4), respectively. The Vinitial value at the PCC of test systems used for the scenarios considered in Figure 12 and Figure 13 is 1 pu and 0.98 pu, respectively.
As mentioned in Section 1, the VPCC profile must be maintained between 95% and 105% of the network nominal voltage to satisfy the steady-state voltage stability requirements defined by the grid codes [3]. Therefore, after plotting the VPCC-Pwind characteristics for the potential WPP interconnection sites, designers and planners can determine the best PCC site, where the X/RPCC and SCC values ensure that the grid code requirements are concerned with the magnitude of steady-state VPCC are met.
In addition, the prediction of the Pwind-dVPCC characteristic using the proposed model enables to estimate the maximum permissible size of WPP, called Pwind_max, ensuring that the steady-state VPCC requirements defined by the grid codes would be satisfied. For example, from Figure 12 and Figure 13, the Pwind_max values at the PCC of the test system considered are 3.6 MW and 5.2 MW, respectively. The results presented in Figure 12 and Figure 13 confirm that the predicted Pwind_max gained by the proposed decision tree algorithm literally tracks the reference Pwind_max values obtained by the simulation models.
Referring to Section 1, most works published in the literature regarding DG siting and sizing rely on the simulation of whole distribution networks with complicated structures and/or carrying out complex and time-consuming computational tasks. The authors’ previous work proposed an efficient mathematical method for simplifying WPP siting and sizing by removing the need to simulate the whole test system and conduct complex calculations [1]. However, the accuracy of the proposed mathematical method was limited. For the IG-based WPPs, the accuracy of the mathematical model in predicting the Pwind-VPCC curve characteristic is reduced as the SCR is decreased or the value of the X/RPCC moves toward 2. In addition, for the DFIG-based WPPs, the accuracy of the mathematical model in predicting Pwind-VPCC characteristics is low if the PCC site has a small X/R ratio. The proposed decision tree-based model addressed the aforementioned issues by simplifying the WPP sizing and siting through predicting Pwind-VPCC characteristics with noticeably high accuracy. Similar to the mathematical model developed in [1], the model proposed in this paper requires only two PCC parameters, i.e., X/RPCC and SCC, to predict the Pwind-VPCC characteristics. The predicted Pwind-VPCC characteristic can be used for optimal WPP sizing and siting. Given that the X/RPCC and SCC are the baseline characteristics of a distribution feeder, their values are generally available or can easily be calculated using fundamental power system analysis methods. More importantly, the verification results shown in Section 3 demonstrated that the proposed decision tree-based model eliminates the issues concerned with the limited accuracy of the mathematical model presented in [1] by providing a negligible prediction error for any SCR and X/RPCC ratios.

5. Conclusions

In this study, a novel decision tree algorithm-based model was developed to predict the voltage behavior in response to the wind power injection at a potential feeder for connecting IG and DFIG-based WPPs in a distribution network. For this purpose, the proposed model enables to plot wind power versus PCC voltage (Pwind-VPCC) characteristic at a given potential interconnection point using the distribution system baseline parameters seen at that point, including SCC and X/RPCC. Taking advantage of the plotted Pwind-VPCC characteristic, design engineers can carry out an initial predictive assessment on the critical voltage stability criteria, including VPCC value and Pwind_max, to determine the optimal WPP connection site and its maximum permissible size ensuring the grid code requirements. The proposed model simplifies the siting and sizing of WPPs by removing the need to simulate the whole distribution system and performing computational calculations, which is one of the main advantages of the proposed model over the majority of existing approaches. In addition, the proposed model was benchmarked against one of the latest mathematical methods developed for simplifying WPP sizing and siting to affirm its accuracy in predicting the Pwind-VPCC characteristic and voltage stability criteria.
For the IG-based WPPs, the verification results gained using the mathematical method demonstrated that the error between the predicted and reference results was large when SCR is small (SCR ≤ 4). However, the largest error between the reference characteristics and the corresponding curves plotted by the proposed decision tree algorithm was ignorable even when the PCC site was weak, and its SCR was smaller than 4. In addition, for the IG-based WPPs, the prediction accuracy of the mathematical model in predicting Pwind-dVPCC curve characteristics is around 2.5% when the X/RPCC ratio tends to 2, whereas the curves predicted by the proposed decision tree algorithm precisely track the reference characteristics when the X/RPCC ratio is around 2.
For the DFIG-based WPPs, the proposed model sorted out the issue of the mathematical model regarding low prediction accuracy when the X/R ratio is small. In this respect, the highest prediction error between the reference results and the data predicted by the mathematical model was around 1% when the X/RPCC ratio is around 0.5, while the proposed model provided an accuracy of almost 100% over the whole range of the X/RPCC ratio.
Generally, the verification studies demonstrated the proposed decision tree-based model is superior to the previous similar methods. In this study, the test systems used for the verification analysis were based on IEEE standard distribution network models, which other researchers widely use for conducting power system analysis. The proposed model was developed considering a number of practical factors to increase the accuracy of the proposed model for actual applications. This includes developing the proposed model using the real-world range of the X/RPCC and reducing the uncertainty due to the load deviations by considering the Vinitial parameter. In addition, the validation of the presented model using actual systems is important and will be addressed in future studies to further complement this research. The practical verification of the proposed model requires the values of VPCC, X/RPCC and SCC obtained from an actual distribution network. However, the authors did not have access to such values. In addition, simulation and modeling the real-world distribution systems require using professional engineering software, such as PSS/e, which is not currently available to the authors. Therefore, as one of the extensions to this research, the authors intend to validate the proposed model using an actual case where a wind power plant is being proposed for further integration.

Author Contributions

Conceptualization, S.G. and S.M.A.; methodology, S.G. and S.M.A.; software, S.G. and S.M.A.; validation, S.G. and S.M.A.; formal analysis, S.G. and S.M.A.; investigation, S.G. and S.M.A.; resources, S.G. and S.M.A.; data curation, S.G. and S.M.A.; writing—original draft preparation, S.G. and S.M.A.; writing—review and editing, S.G. and S.M.A.; visualization, S.G. and S.M.A.; supervision, S.M.A.; project administration, S.G. and S.M.A. Both authors have read and agreed to the published version of the manuscript.

Funding

This research received no external funding.

Institutional Review Board Statement

Not applicable.

Informed Consent Statement

Not applicable.

Data Availability Statement

Publicly available datasets were analyzed in this study. This data can be found here: https://www.mdpi.com/1996-1073/13/13/3485 (accessed on 18 April 2021).

Conflicts of Interest

The authors declare no conflict of interest.

Nomenclature

IGInduction generator
IscShort-circuit current
DFIGDouble-fed induction generator
dVPCCVoltage variation concerning the voltage value before wind power plant connection at the point of common coupling
PEPrediction error
PCCPoint of common coupling
PwindPower generated by wind power plant
SCCShort-circuit capacity
SCRShort-circuit ratio
VinitialVoltage at distribution feeder before the connection of wind power plant
WPPWind power plant
X/RPCCShort-circuit impedance angle ratio seen at the point of common coupling
ZscShort-circuit impedance

References

  1. Alizadeh, S.M.; Sadeghipour, S.; Ozansoy, C.; Kalam, A. Developing a Mathematical Model for Wind Power Plant Siting and Sizing in Distribution Networks. Energies 2020, 13, 3485. [Google Scholar] [CrossRef]
  2. Ahmed, S.D.; Al-Ismali, F.S.M.; Shafiullah, M.; Al-Sulaiman, F.A.; El-Amin, I.M. Grid Integration Challenges of Wind Energy: A Review. IEEE Access 2020, 8, 10857–10878. [Google Scholar] [CrossRef]
  3. Machado, I.; Arias, I. Grid Codes Comparison. Master’s Thesis, Chalmers University of Technology, Göteborg, Sweden, 2006. [Google Scholar]
  4. Alizadeh, S.M. An Analytical Voltage Stability Model for Wind Power Plant Sizing and Siting in Distribution Networks. Ph.D. Thesis, Victoria University, Footscray, Australia, 2017. [Google Scholar]
  5. Golieva, A. Low Short-Circuit Ratio Connection of Wind Power Plants. Master’s Thesis, Norwegian University of Science and Technology, Trondheim, Norway, 2015. [Google Scholar]
  6. Alizadeh, S.M.; Ozansoy, C.; Alpcan, T. In The Impact of X/R Ratio on Voltage Stability in a Distribution Network Penetrated by Wind Farms. In Proceedings of the 2016 Australasian Universities Power Engineering Conference (AUPEC), Brisbane, Australia, 25–28 September 2016; pp. 1–6. [Google Scholar]
  7. Naik, S.G.; Khatod, D.; Sharma, M. In Sizing and Siting of Distributed Generation in Distribution Networks for Real Power Loss Minimization Using Analytical Approach. In Proceedings of the International Conference on Power, Energy and Control (ICPEC), Sri Rangalatchum Dindigul, India, 6–8 February 2013; pp. 740–745. [Google Scholar]
  8. Keane, A.; O’Malley, M. Optimal Utilization of Distribution Networks for Energy Harvesting. IEEE Trans. Power Syst. 2007, 22, 467–475. [Google Scholar] [CrossRef]
  9. Atwa, Y.M.; El-Saadany, E.F.; Salama, M.M.A.; Seethapathy, R. Optimal Renewable Resources Mix for Distribution System Energy Loss Minimization. IEEE Trans. Power Syst. 2010, 25, 360–370. [Google Scholar] [CrossRef]
  10. Khalesi, N.; Rezaei, N.; Haghifam, M.R. DG Allocation with Application of Dynamic Programming for Loss Reduction and Reliability Improvement. Int. J. Electr. Power Energy Syst. 2011, 33, 288–295. [Google Scholar] [CrossRef]
  11. Georgilakis, P.S.; Hatziargyriou, N.D. Optimal Distributed Generation Placement in Power Distribution Networks: Models, Methods, and Future Research. IEEE Trans. Power Syst. 2013, 28, 3420–3428. [Google Scholar] [CrossRef]
  12. Farhat, I.A. Ant Colony Optimization for Optimal Distributed Generation in Distribution Systems. Int. J. Comput. Inf. Eng. 2013, 7, 1094–1098. [Google Scholar]
  13. Ali, A.; Padmanaban, S.; Twala, B.; Marwala, T. Electric Power Grids Distribution Generation System for Optimal Location and Sizing–A Case Study Investigation by Various Optimization Algorithms. Energies 2017, 10, 960. [Google Scholar]
  14. Mohammadi, M.; Naseb, M.A. PSO Based Multiobjective Approach for Optimal Sizing and Placement of Distributed Generation. Res. J. Appl. Sci. Eng. Technol. 2011, 2, 832–837. [Google Scholar]
  15. Seker, A.A.; Hocaoglu, M.H. In Artificial Bee Colony Algorithm for Optimal Placement and Sizing of Distributed Generation. In Proceedings of the 8th International Conference on Electrical and Electronics Engineering, Bursa, Turkey, 28–30 November 2013; pp. 127–131. [Google Scholar]
  16. Australian Energy Market Operator. Modelling Requirements. Available online: https://www.aemo.com.au/Electricity/National-Electricity-Market-NEM/Network-connections/Modelling-requirements (accessed on 8 October 2018).
  17. Chauhan, N.S. Decision Tree Algorithm—Explained. Available online: https://www.kdnuggets.com/2020/01/decision-tree-algorithm-explained.html (accessed on 14 January 2020).
  18. Poojari, D. Machine Learning Basics: Decision Tree from Scratch. Towards Data Science. Available online: https://towardsdatascience.com/machine-learning-basics-descision-tree-from-scratch-part-ii-dee664d46831 (accessed on 2 August 2019).
  19. Reginato, R.; Zanchettin, M.G.; Tragueta, M. Analysis of Safe Integration Criteria for Wind Power with Induction Generators Based Wind Turbines. In Proceedings of the 2009 IEEE Power & Energy Society General Meeting, Calgary, Canada, 26–30 July 2009; pp. 1–8. [Google Scholar]
  20. Bluttman, K. Excel Formulas and Functions for Dummies, 5th ed.; John Wiley & Sons: Hoboken, NJ, USA; pp. 1–400.
  21. Sayad, D.S. Decision Tree–Regression. Available online: https://www.saedsayad.com/decision_tree_reg.htm (accessed on 1 January 2010).
  22. Rokach, L.; Maimon, O. Decision Trees. In Data Mining and Knowledge Discovery Handbook; Springer: Boston, MA, USA, 2005; pp. 165–192. [Google Scholar]
  23. Rocca, J. Ensemble Methods: Bagging, Boosting and Stacking. Towards Data Science. Available online: https://towardsdatascience.com/ensemble-methods-bagging-boosting-and-stacking-c9214a10a205 (accessed on 23 April 2019).
  24. Glen, S. Prediction Error: Definition. Statistics How To. Available online: https://www.statisticshowto.com/prediction-error-definition (accessed on 2 October 2019).
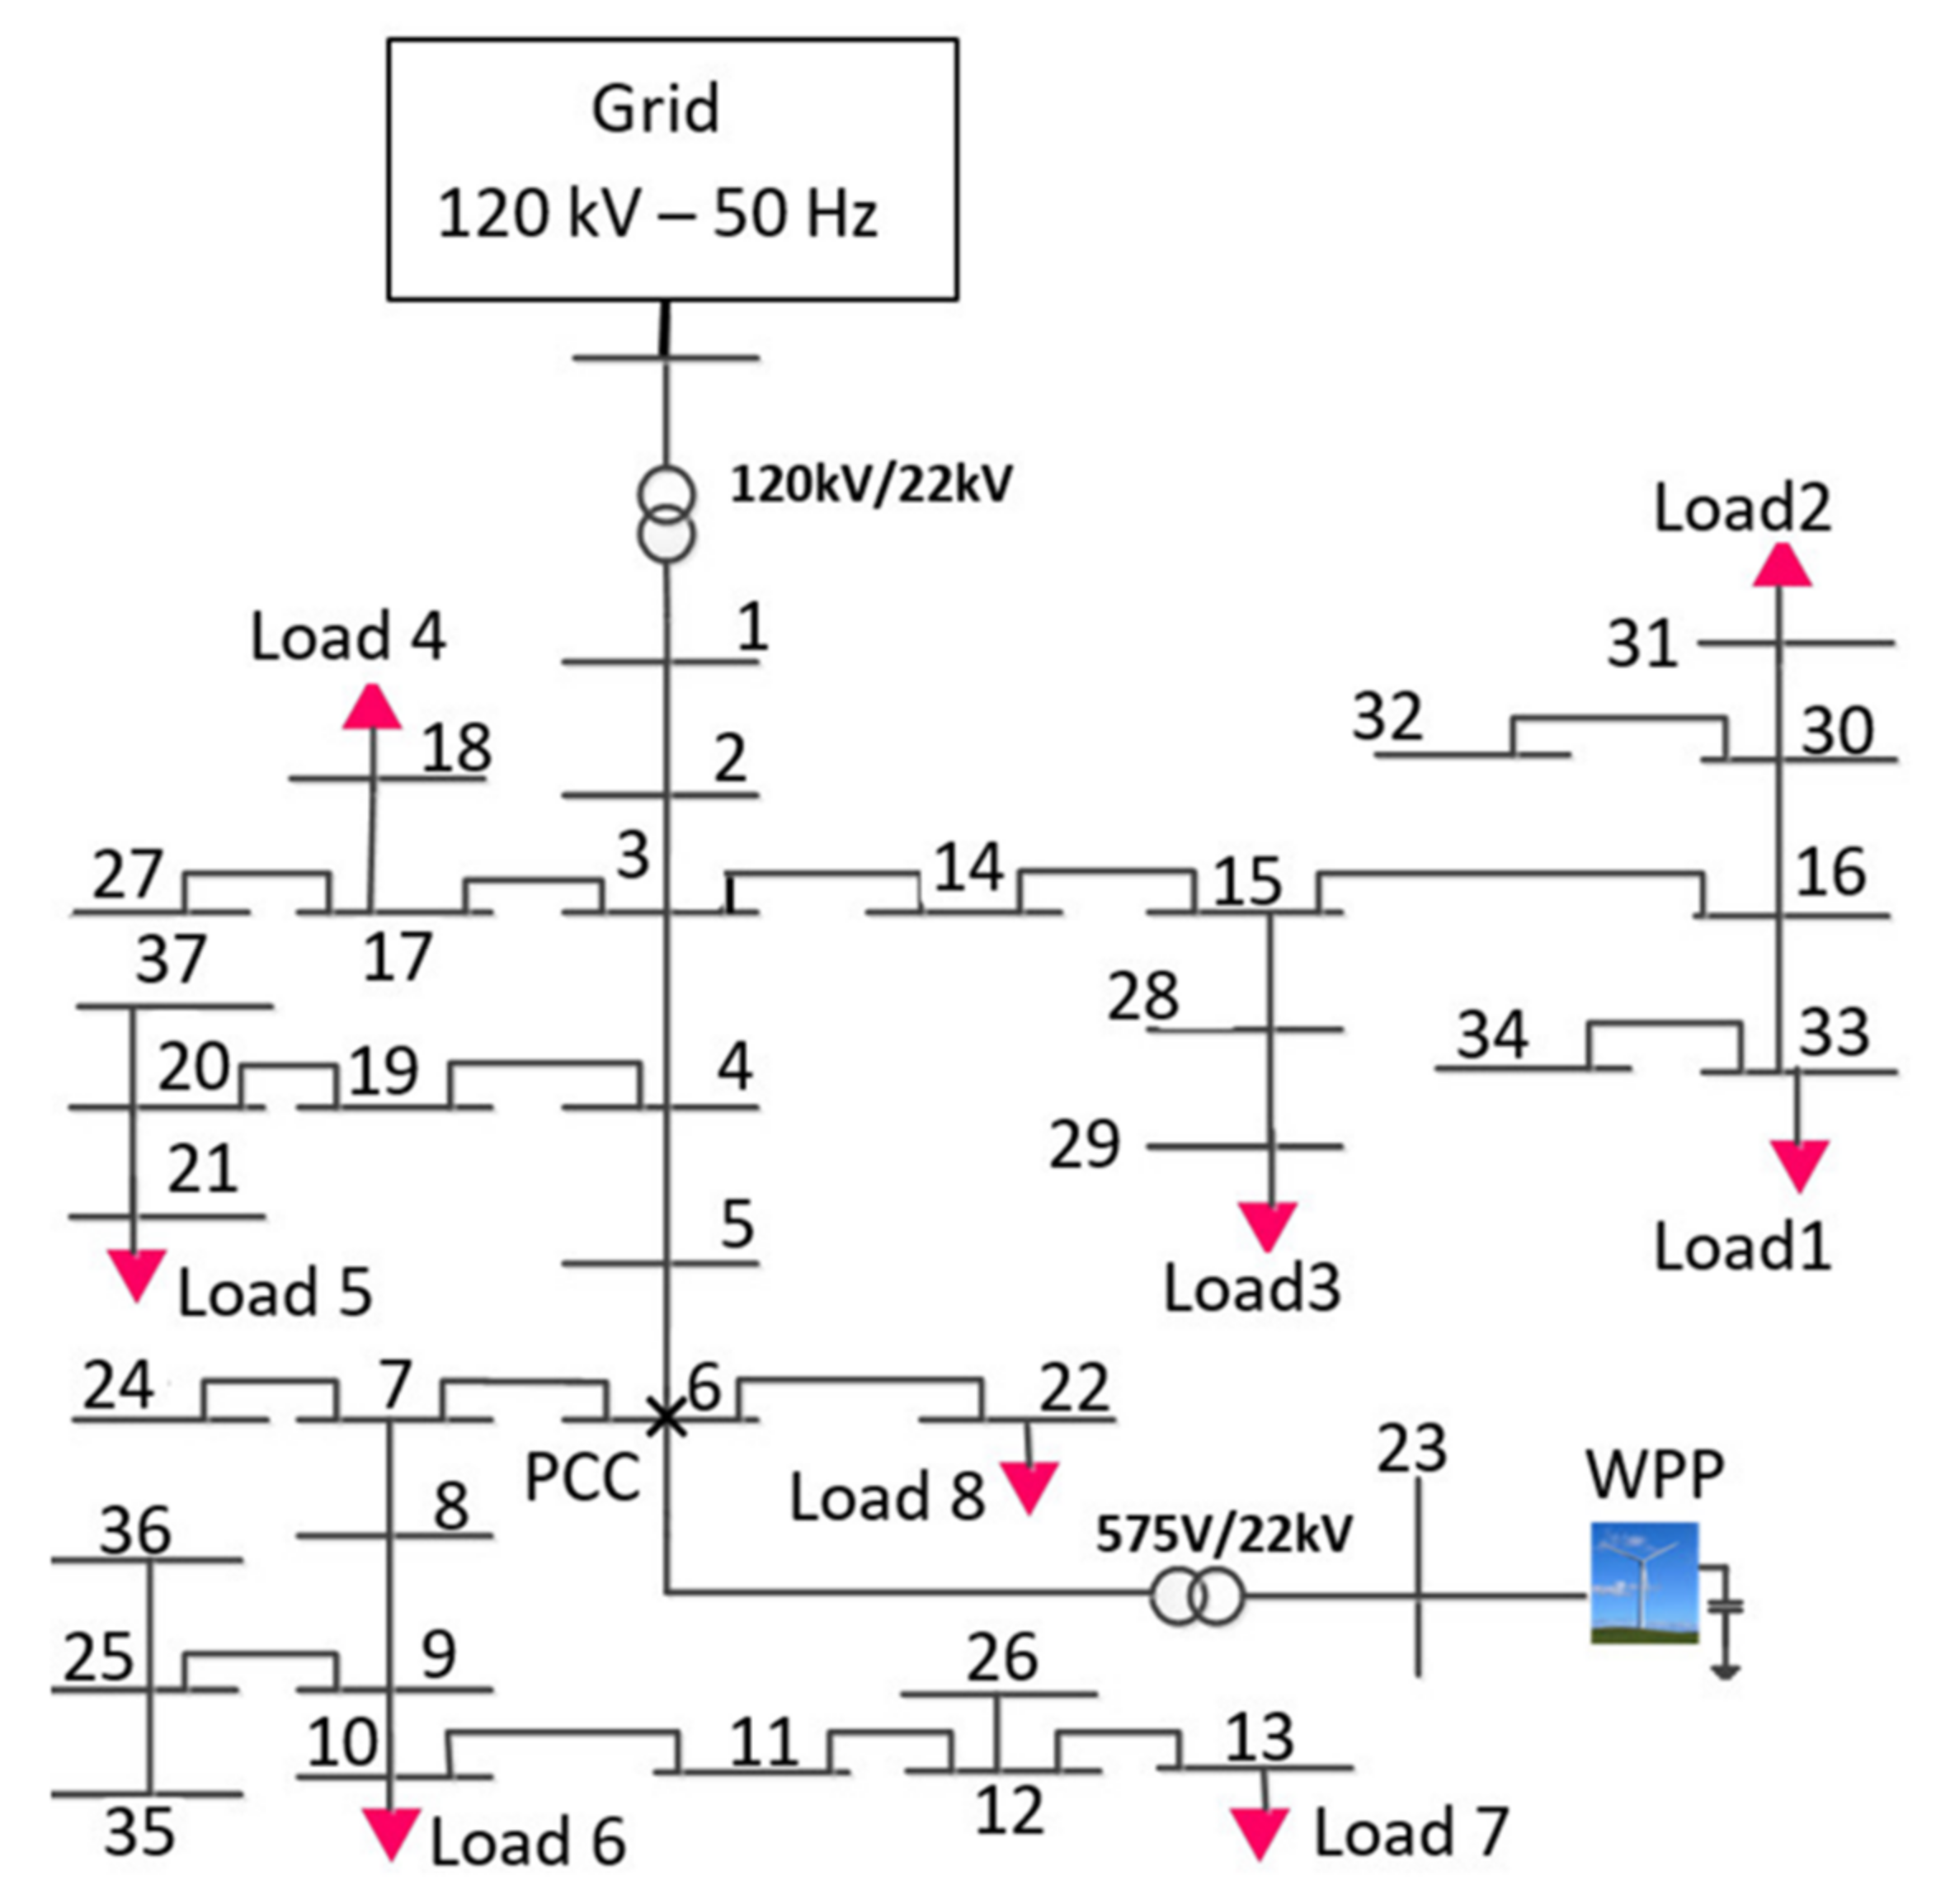
Figure 1. 37-bus test distribution system, Reprinted from ref. [1].
Energies 14 02293 g001
Figure 2. Nine-bus test distribution system, Reprinted from ref. [1].
Energies 14 02293 g002
Figure 3. X/RPCC–dVPCC characteristics curves of IG-based WPPs [1].
Energies 14 02293 g003
Figure 4. X/RPCC–dVPCC characteristics curves of DFIG-based WPPs [1].
Energies 14 02293 g004
Figure 5. Extended X/RPCC–dVPCC data for IG-based WPPs.
Energies 14 02293 g005
Figure 6. Extended X/RPCC–dVPCC data for DFIG-based WPPs.
Energies 14 02293 g006
Figure 7. Proposed decision tree algorithm.
Energies 14 02293 g007
Figure 8. (a–i): Pwind–dVPCC for IG-based test systems.
Energies 14 02293 g008aEnergies 14 02293 g008bEnergies 14 02293 g008cEnergies 14 02293 g008d
Figure 9. (a–i) Pwind–dVPCC for DFIG-based test systems.
Energies 14 02293 g009aEnergies 14 02293 g009bEnergies 14 02293 g009cEnergies 14 02293 g009d
Figure 10. Comparison of the prediction error of the decision tree algorithm and mathematical model for IG–based WPPs.
Energies 14 02293 g010
Figure 11. Comparison of the prediction error of the decision tree algorithm and mathematical model for DFIG–based WPPs.
Energies 14 02293 g011
Figure 12. Voltage profile for IG-based WPPs for Scenario 4 in Table 3.
Energies 14 02293 g012
Figure 13. Voltage profile for DFIG-based WPPs for Scenario 2 in Table 4.
Energies 14 02293 g013
Table 1. Test distribution system model parameters.
Case StudyTopologyIsc (kA)SCC (MVA)Pwind (MW)SCR
Test 1IEEE 37-bus system0.953694
Test 2IEEE 37-bus system1.425496
Test 3IEEE 37-bus system1.897298
Test 4IEEE 9-bus system0.712739
Table 2. Pseudo-code for developing the prediction of voltage profile using decision tree.
StepPseudo CodeDescription
1.Load IG_data/DFIG_data (extended)The table that contains extended data (SCR, X/RPCC, dVPCC) is loaded as training data set.
2.Feature variable (input) ← SCR,X/RPCCAssign feature and response variable
response variable (output) ← dVPCC
3.T ← template tree (min leaf size = 5)Create a template tree having a minimum number of data points in a leaf = 5
4.model ← fit regression tree (SCC, X/RPCC, dVPCC)
Method ← least square boosting
number of learning cycles ← 100
The ensemble tree is created from training data set using the least square boosting method and with 100 learning cycles
5.Prompt SCC, X/RPCCRequest input from the user
6.Pwind ← [SCC/SCR]
Input = (SCR, X/RPCC)
Find power points for respective SCR values
7.[dVPCC] = predict (Igmodel, Input)Predict the response variable (dVPCC) from features (SCR, X/RPCC)
8.Plot (Pwind, dVPCC)Plot variation in voltage profile with the amount of penetrated power
Table 3. Test distribution parameters for IG-based test systems.
Test No.SCCX/RPCC
1350.7
2700.6
3150.5
4180.4
5330.75
6201.2
7301.5
8171.9
9272.1
Table 4. Test distribution parameters for DFIG-based test systems.
Test No.SCCX/RPCC
1161
2250.45
3450.75
4350.7
5230.85
6450.6
7151.2
8271.7
9341.9
Table 5. The Pwind-dVPCC data points for test system 2 in Table 3.
NPwind∆Vp
(%)
∆Vr Related to the Proposed Decision Tree-Based Model
(%)
∆Vr Predicted by the Mathematical Model Proposed [1]
(%)
1.72.03122.03022.2707
2.11.673.1583.15833.88
3.17.53.53253.53815.217
Publisher’s Note: MDPI stays neutral with regard to jurisdictional claims in published maps and institutional affiliations.