Article

Evaluating the Economic Viability of Agricultural Pellets to Supplement the Current Global Wood Pellets Supply for Bioenergy Production

1
Department of Chemical & Biological Engineering, University of British Columbia, 2360 East Mall, Vancouver, BC V6T 1Z3, Canada
2
Agriculture and Agri-Food Canada, 2010 12th Avenue, Regina, SK S4P 0M3, Canada
*
Author to whom correspondence should be addressed.
Energies 2021, 14(8), 2263; https://doi.org/10.3390/en14082263
Submission received: 30 March 2021 / Revised: 13 April 2021 / Accepted: 14 April 2021 / Published: 17 April 2021
(This article belongs to the Special Issue Modeling and Analysis of Biomass-to-Energy Supply Chains)

Abstract

:
In this study, an inter-continental agricultural pellet supply chain is modeled, and the production cost and price of agricultural pellets are estimated and compared against the recent cost and price of wood pellets in the global marketplace. The inter-continental supply chain is verified and validated using an integration of an interactive mapping application and a simulation platform. The integrated model is applied to a case study in which agricultural pellets are produced in six locations in Canada and shipped and discharged at the three major ports in Western Europe. The cost of agricultural pellets in the six locations is estimated to be in the range of EUR 92–95/tonne (CAD 138–142/tonne), which is comparable with the recent cost of wood pellets produced in small-scale pellet plants (EUR 99–109/tonne). The average agricultural pellet price shipped from the six plants to the three ports in Western Europe is estimated to be in a range of EUR 183–204 (CAD 274–305/tonne), 29–42% more expensive that the average recent price of wood pellets (EUR 143/tonne) at the same ports. There are several potential areas in the agricultural pellet supply chains that can reduce the pellet production and distribution costs in the mid and long terms, making them affordable supplement to the existing wood pellet markets. Potential economic activities generated by the production of pellets in farm communities can be significant. The generated annual revenue in the biomass logistics system in all six locations is estimated to be about CAD 21.80 million. In addition, the logistics equipment fleet needs 176 local operators with a potential annual income of CAD 2.18 million.

1. Introduction

Coal remains a major fossil fuel in global energy systems, accounting for almost 40% of electricity generation and more than 40% of energy-related CO2 emissions [1]. Cofiring biomass with coal or completely replacing coal with biomass has been used as a proven and cost-effective strategy to reduce the carbon intensity of electricity. Over 150 power plants globally have either been tested for cofiring or have permanently transformed their operations to cofiring [2,3]. Various types of biomass, including woody biomass, agricultural biomass and municipal wastes, have been used to cofire with coal. Among these feedstock sources, woody biomass, in particular wood pellet, has been used in large scale power plants due to its similar physical and chemical properties with coal [4]. Grinding, drying and densifying woody biomass in the form of pellets provide more consistent size and shape particles with higher calorific value compared to unprocessed biomass such as wood chips. Wood pellets can be pulverized to form particles of a suitable size for combustion at the existing pulverized coal-fired power plants [5].
Depending on the feedstocks used in the production of wood pellets, their supply chain structures and the displaced fossil fuels (e.g., coal, natural gas and heating oil), the greenhouse gas (GHG) emission reduction could be significant. Buchholz et al. [6] showed a net GHG emission reduction of 64.4%, 62.2%, and 49% when wood pellets substituted coal, heating oil, and natural gas, respectively, for residential heating in the US Northern Forest region. Zhang et al. [7] investigated 100% wood pellet firing and cofiring with coal in two coal generating stations in Ontario, Canada and concluded that 100% pellet utilization provides GHG emission reduction by 91% relative to coal. Compared to coal, they also estimated that using 100% pellets reduces NOx emissions by 40–47% and SOx emissions by 76–81%.
Global wood pellet markets have experienced significant growth in the past decade. Between 2012 and 2018, the global wood pellet market has experienced growth rates averaging 11.6% annually, from about 19.5 million metric tons (Mt) in 2012, to about 35.4 Mt in 2018. North America currently dominates the global supply of industrial wood pellets [8]. Intercontinental flows are dominated by the trade relation between the USA and the United Kingdom (UK). The Asian markets also demonstrate strong growth, with Japan and South Korea as the main consumers to replace coal in large power plants [9]. New large-scale utility cofiring and conversion projects in Japan, the European Union (EU), the UK, and South Korea, and many smaller independent power plant projects in Japan, are forecast to add about 24 Mt per year to the current demand for wood pellet and other biomass feedstocks by 2025 [8]. The non-industrial use (heating markets) is still mainly an intra-European business. Russia and the Baltic states are becoming increasingly important for these markets as exporters [9]. In intercontinental flows, wood pellets are transported using ocean vessels such as Handysize, Handymax and Supramax ships [10].
The growing global demand for wood pellets and the limited availability of sustainable forest biomass resources in these regions will likely increase the demand and global trade of other biomass resources, such as agricultural residues [11]. The current agricultural biomass supply chains have been developed to meet the demand of local markets, such as animal bedding and feed, mainly in the form of bales [12]. Bales have low bulk density and are inefficient for large-scale storage and long-distance transportation [13,14,15]. In addition to animal bedding and feed, agricultural residues such as wheat straw have been a major feedstock for the local production of heat and power in countries such as Denmark and Sweden in the last two decades [16]. The production capacity of agricultural pellets has been reported in small quantities in countries such as Denmark, Germany, Finland, Spain and Italy [17]. The production of dense, uniform size and shape and cost-competitive pellets from agricultural biomass can be a potential pathway to supplement the existing wood pellets supply to meet the growing global biomass demand to decarbonize heat and power generation.
Wood pellet supply chains and the cost of wood pellets at different stages of the supply chain have been studied in the literature. Some studies used techno-economic analysis to estimate the production cost of wood pellets [18,19,20,21,22,23,24]. In addition to the production cost, the cost of downstream operations, including rail transportation, port terminal and ocean shipping have been investigated [25,26,27,28,29,30]. Ehrig et al. [31] investigated critical economic aspects and price risks along international pellet supply chains in three different countries, and their impacts on total supply chain prices. In a recent study, Visser et al. [10] reviewed existing literature on pellet costs and evaluated the cost structure of inter-continental wood pellet supply chains and assessed potential cost savings of individual components, as well as the entire chain. In other studies, wood pellet prices and their trade between major producers and users of wood pellets, in particular within Europe, have been investigated [9,32,33,34,35,36].
Despite the extensive research on wood pellet supply chains, production and logistics costs, and their global trade flows, there is limited literature on the evaluation of agricultural pellet production and supply chains. The main focus of the current literature on the pelletization of agricultural biomass has been on the techno-economic analysis to estimate the production cost of agricultural pellets [15,17,37,38,39,40]. Although the economics of pellets production from agricultural biomass (shortly called ag-pellet) have been studied in the literature, an inter-continental ag-pellet supply chain has not been modeled and investigated. An inter-continental ag-pellet supply chain includes all operations from crop fields where agricultural biomass is produced to a port of destination where ag-pellets are discharged from ocean-going vessels and then distributed to the end users. To supplement the current global supply of wood pellets, the logistics of ag-pellets and their prices must be competitive with the current wood pellets supply chains and prices as wood pellets will likely be a benchmark for the price of other biomass resources that will be traded globally for bioenergy generation.
In this study, an inter-continental ag-pellet supply chain is simulated and the ag-pellet production cost and potential price are estimated and compared against the recent cost and price of wood pellets in the global marketplace. The inter-continental ag-pellet supply chain is verified and validated using the integration of an interactive mapping application and a simulation platform well-developed for evaluating biomass supply chains. The integrated model is applied to a case study in which ag-pellets are produced in six locations in Canada with high potential of agricultural biomass production and shipped and discharged at the three major ports in Western Europe, where the majority of wood pellets are currently received from North America.
The investigation of an inter-continental ag-pellet supply chain in this study provides a good starting point for further research into the optimization of emerging ag-pellet supply chains and provides insight into the potential cost and price of ag-pellets in the global trade of pellets for heat and power generation and other emerging markets such as transportation biofuels. The methodology and input data for ag-pellet production and distribution in this study can be used by the research community in future work. Furthermore, the results of this study can be beneficial for the development of supporting policies and programs that encourage the production and use of ag-pellets, while their local, regional and global supply chains are maturing. The quantification of the total costs of producing and transporting ag-pellets can be used to determine the financial programs required to support the replacement of fossil fuels by the increasing use of sustainable and underutilized biomass resources.

2. Materials and Methods

A schematic of the ag-pellet supply chain that is modeled and evaluated in this study is shown in Figure 1. The ag-pellet supply chain is comprised of three segments: (1) upstream logistics where the sourcing or procurement of crop residues from farmers and crop growers to a pellet plant occurs; (2) pellet production where manufacturing of ag-pellets takes place at the pellet plant; and (3) downstream logistics, where the distribution and delivery of ag-pellets from the pellet plant to end users take place. The focus of this study is on the export of ag-pellets to overseas market where there is a growing demand for the use of biomass to displace fossil fuels, in particular coal to produce low-carbon intensive electricity [41]. Thus, the downstream segment includes rail transportation, port terminals and ocean transportation. The end point of the ag-pellet supply chain is the port of destination, where ag-pellets are discharged and distributed to a single or multiple end users. In the current wood pellet markets, most wood pellets are traded under long-term contract with cost, insurance, freight (CIF) price terms, meaning that the ag-pellet seller has to bring the ship cargo to the terminal agreed by the contract partners where the seller’s obligations are fulfilled and the discharging cost bears the buyer at the port of discharge ([10,42]).

2.1. Upstream Logistics of the Ag-Pellet Supply Chain

The ag-pellet supply chain starts from crop fields where agricultural residues such as wheat straw are left behind the grain combine harvester in the field. Biomass straw can be left on the ground in windrows by the combine and ready to be baled. Biomass straw are then baled, collected, moved and stacked on the roadside of the field. In this study, it is assumed that large square bales are produced, collected and stacked by local custom harvest groups. The logistics equipment data used in this study to estimate the operating costs and the number of required logistics equipment are provided in Table A1 in Appendix A.
The stacked bales on the roadside of fields are loaded on trucks with flatbed trailers. Once fully loaded, trucks travel either directly to the pellet plant or the intermediate storage sites. The direct delivery to the pellet plant depends on the daily demand of the pellet plant and its bale storage capacity. Once the on-site storage capacity is full, bales at the field roadside are transported to the intermediate storage sites. Crop residues must be harvested and removed from fields in a short period of time, as crop growers tend to prepare the fields for the next cropping season after the grain harvest season and fields are not usually accessible in winter and early spring [43]. Thus, intermediate storage sites are essential to meet the annual biomass demand of the pellet plant in the post-harvest season. Stored bales at the intermediate storage are usually used after harvest season to meet the daily demand of the ag-pellet plant. The sequence of upstream biomass logistics operations is shown in Figure 2.

2.2. Pellet Production Segment of the Ag-Pellet Supply Chain

The sequence of operations at the pellet plant is shown in Figure 3. Shredding straw bales using a tub grinder or shredder to reduce straw length is the first step. The length of the straw is reduced to 2.5–10 cm [39]. Prior to feeding shredded biomass into pelletizers, its moisture content and particle size should fall within appropriate ranges. The average received moisture content of straw before the drying process is 15% wet basis (wb) and is usually reduced to 8–10% (wb). If straw is delivered to the pellet plant with moisture content lower than 12%, drying may be bypassed [37]. In this study, it is assumed that delivered straw bales to the pellet plant have an average moisture content of 15% and need to be dried before pelletization.
Dried material is further ground in a hammer mill to a small uniform size of 3.2 mm or less to produce uniform-sized pellets [18]. Pellet presses operate at a temperature of 90–100 °C [46]. Pellets are hot and soft upon exit from the pellet press. Therefore, cooling is needed for hardening it. Pellets are then screened and stored in silos or warehouses.
The size of wood pellet plants assumed in literature studies varies between 24 k and 200 k tonnes/year [10]. Due to the wide distribution of agricultural biomass in the supply area compared to forest biomass, a small size ag-pellet plant with the production capacity of 5 tonnes/h is assumed in this study. This size of pellet production capacity is considered a small-scale pellet facility [10]. Table A2 in the Appendix A shows the breakdown of the capital cost of an ag-pellet plant with the production capacity of 5 tonnes/h. The total capital cost is estimated to be CAD 5,749,000. The capital cost of the ag-pellet plant was estimated in consultation with the pellet equipment vendors and experts and is comparable with the estimated capital cost per tonne and tonne per hour in the literature ([26,37,47]). Table A3 in the Appendix A lists the assumptions used in this study to estimate the ag-pellet production cost per tonne.

2.3. Distribution and Delivery Segment of the Ag-Pellet Supply Chain

The produced ag-pellets at the pellet plant are loaded directly into railcars for delivery to port terminals with on-site pellet storage silos. Once a sufficient amount of ag-pellets is built up at the port terminal, they are loaded onto an ocean-going vessel upon its arrival. The ag-pellets are then shipped and discharged and stored at the port of destination, as shown in Figure 4.
Pellet plants typically lease private covered hopper railcars with trough hatches. The typical pellets payload loaded in these cars is 90 tonnes [10,25]. Rail transportation rates vary based on origin and destination, their rail traffic, and the demand for railcars. The selection of the size of the ocean vessel mainly depends on the size of storage silos at the port terminal, the pellet inventory and the availability of the vessels.
The primary difference between a wood pellet supply chain and the considered ag-pellet supply chain is the upstream biomass logistics system. Some wood pellet plants are located in close proximity to sawmills, allowing them to receive sawmill residues using tucks or pipelines used to convey sawmill residues on pellet plants, and hence raw material transportation is eliminated [25,26]. In some wood pellet plants, forest biomass is transported from logging operations in a forest site to the pellet plant and then chipped on-site [10]. In contrast, the agricultural biomass is usually procured from a widely distributed supply area and several pieces of logistics equipment are involved to harvest and collect in a short harvest window and then store and transport bales to the gate of the pellet plant, as shown in Figure 2. In addition, agricultural biomass is delivered in bales which have proven to be a challenging task to unload, store, and process in commercial quantities [14,48].
Two analytical models are used in this study to model and evaluate the ag-pellet supply chain. The Biomass Inventory Mapping and Analysis Tool (BIMAT) is used to estimate the availability of agricultural biomass within a user defined supply area. BIMAT is a publicly available interactive mapping application that provides an Internet-based geographic information system (GIS) functionality to query and visualize biomass inventory data across Canada [49]. The second model is Integrated Biomass Supply Analysis and Logistics (IBSAL), developed using the ExtendSim simulation platform available from Imaginethat Inc. It is a dynamic simulation tool that incorporates the interactions among the operations in biomass logistics and supply chains, as well as the variability and uncertainty in the input parameters, such as biomass yield, harvest window, harvest moisture content, bale bulk density, farm participation rate, dry matter loss, equipment capacity and efficiency, machine breakdown and repair times, winding factor and road transportation speed. IBSAL has been used to model and analyze logistics systems for various biomass types, such as cereal straw [50] and corn stover [45].
To meet the annual biomass demand of an ag-pellet plant with the capacity of 5 tonnes/h (43,800 tonnes/year), BIMAT estimates the size of the supply area and the net availability of agricultural biomass. IBSAL uses the outputs of BIMAT, including the map of the supply area, the availability of biomass in 10 km × 10 km grids and the transportation distances to estimate the cost of biomass delivered to the ag-pellet plant. In addition to the upstream biomass logistics system, new simulation modules were developed in IBSAL for the ag-pellet production and downstream distribution operations to accommodate all three segments of the ag-pellet supply chain. The new additions to the IBSAL model include the ag-pellet production module which contains all the operations shown in Figure 3. The second addition to the IBSAL model is the ag-pellet distribution and delivery segment, which include the operations shown in Figure 4. The new IBSAL model is called IBSAL-AgPellet.

3. Case Study

The large size of agricultural lands in Canada have led to the production of abundant amounts of agricultural residues, such as cereal straw and corn stover that can be used as feedstock for bioenergy and biofuels production [51,52]. The regional availability of agricultural biomass is shown in Figure 5. The average annual production of agricultural biomass in Canada is estimated to be about 31 million tonnes, based on crop yield and crop area data for the years 1985–2016, after the consideration of local competing uses such as cattle feed and bedding and the amount of residue left in the field to discourage erosion and to maintain the soil organic matter [52].
As shown in Figure 5, a majority of agricultural residues are produced in the provinces of Saskatchewan (SK) and Alberta (AB) in Western Canada. In this study, three locations in these two provinces are selected as the potential sites for the production of ag-pellets. Table 1 summarizes the list of six selected locations, the net biomass availability and the size of the supply area in these locations, to meet the annual demand of an ag-pellet plant with a capacity of 5 tonnes/h. The data in Table 1 were generated by BIMAT. It is assumed that in each region, only 50% of farmers and crop growers supply their biomass to the ag-pellet plant. Farm participation rate impacts the size of the supply area and the biomass delivered costs. The location of six ag-pellet production sites and their biomass supply area in Canada are shown in Figure 6.
These locations are selected based on the availability of commercial quantities of agricultural residues and access to the major grain terminals and rail mainlines. Road, rail, handling and storage infrastructure are already established at the major grain elevators in Canada, in order to aggregate, store, handle and transport commercial quantities of grain from these locations to the Port of Vancouver for export to regional and international markets. It is assumed that ag-pellet plants will leverage the existing road and rail infrastructure to receive agricultural biomass from local farmers and crop growers and transport the produced ag-pellets to the Port of Vancouver. Table 2 shows the rail transportation distance between the ag-pellet plants and the Port of Vancouver, where the pellets are stored and then transported by ocean vessels.
The Port of Vancouver accommodates a port terminal with the capability to receive, store and load wood chips and wood pellets into ocean-going vessels. This terminal is one of the largest export wood pellet handling facilities in the world [53]. Due to the large size of wood pellet markets in Europe, the majority of wood pellets are transshipped through the Port of Rotterdam, the Netherlands, which competes with nearby Amsterdam and Antwerp for wood pellet handling. The three ports are often collectively referred to as ARA [54]. Due to the well-established wood pellet supply and demand markets in Western Europe, there are public data available on the cost and price of wood pellets, which are used as benchmarks in this study to evaluate the potential affordability of ag-pellets for bioenergy generation. These ports are selected as ports of destination for ag-pellets produced in the six case studies.

4. Results and Discussion

As discussed in Section 2, several input parameters are considered to be variable in IBSAL-AgPellet. Thus, multiple simulation runs were carried out in order to capture the impact of the variable input parameters on the IBSAL-AgPellet outputs, in particular the biomass delivered costs. To this end, IBSAL-AgPellet was run for 500 replications and the average values of the biomass logistics costs are discussed below. All monetary values are in Canadian dollars unless stated otherwise.

4.1. Biomass Delivered Cost to the Pellet Plant

The average biomass delivered cost to the pellet plant for the six locations is shown in Figure 7. To meet the annual demand of the ag-pellet plant (438,000 tonnes), about 50,000 dry tonnes (dt) of straw needs to be harvested, since about approximately 10% of biomass is lost during harvesting, collection, storage and handling. Since 50,000 tonnes of agricultural residues are available within similar supply radii for all case studies, there is an insignificant difference between the biomass delivered costs, assuming that the same logistics equipment are used to harvest, collect, handle and transport biomass in all six regions. As shown in Figure 7, the average biomass delivered cost varies in a range of CAD 73–77/dt. The primary contributors to the biomass delivered cost are baling (~32%) and nutrient replacement (~30%), followed by transportation (~18%) and bale collection (~10%). Nutrient replacement is the cost paid to the farmers and crop growers to compensate for the nutrients and minerals lost due to the removal of straw from the fields. Depending on the straw type (e.g., wheat, barley and oats), the nutrient values vary in a range of CAD 22–29/tonne [55].

4.2. Economic Activities and Employment Opportunities in FARM communities

Mobilization of agricultural residues in farm communities as a feedstock to produce pellets will generate economic activities, mainly in the upstream ag-pellet logistics systems, including equipment manufacturing and dealership, field operations, storage and handling and transportation. These economic activities will create revenues for crop growers, custom harvest groups, transportation companies and equipment manufacturers and dealers.
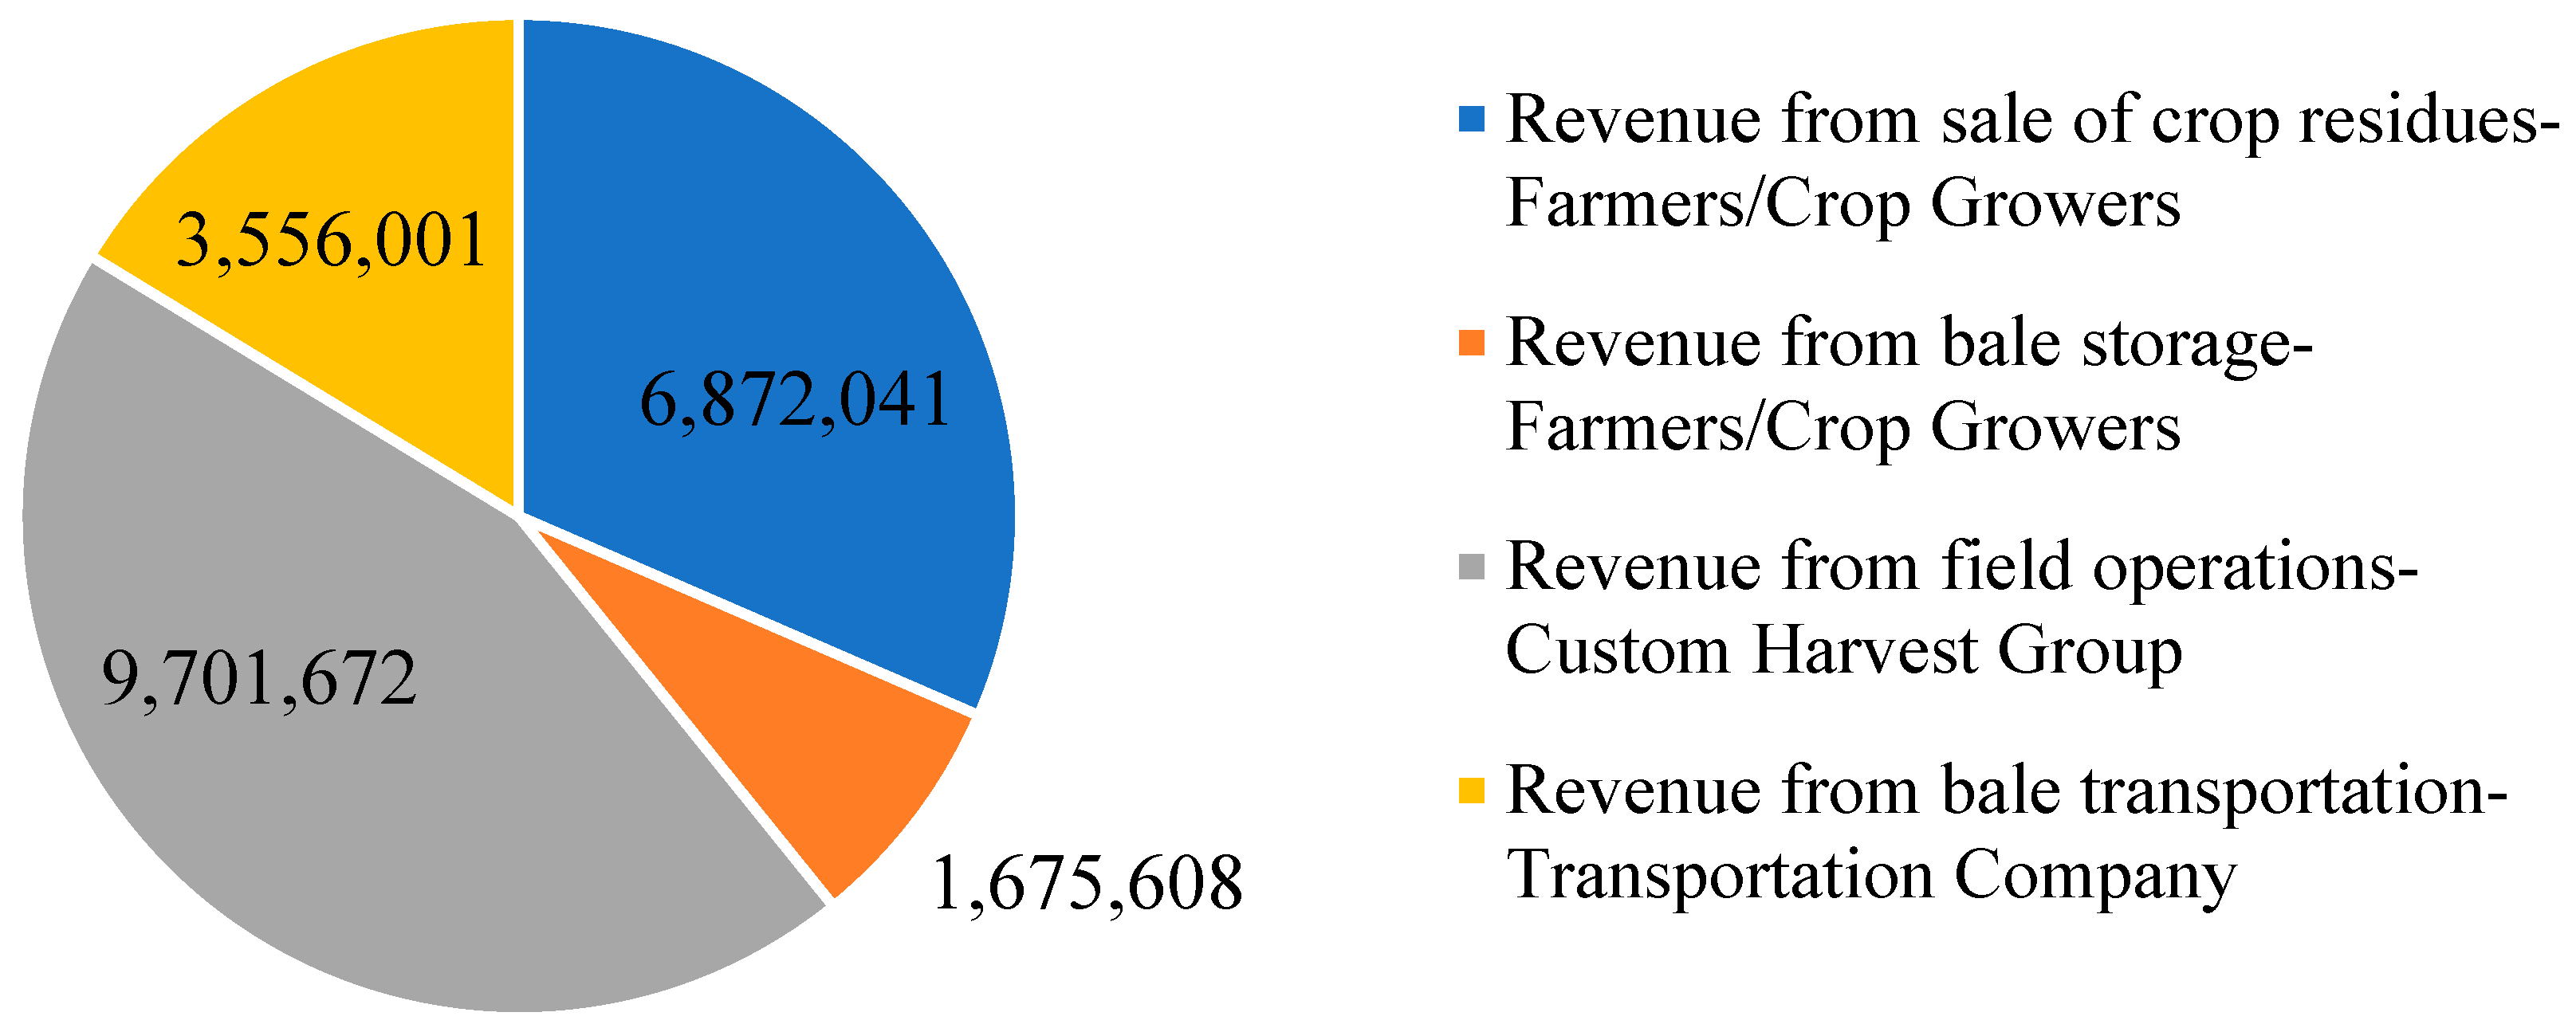
The average annual revenues that can be potentially generated for three main players in the biomass logistics system, including crop growers, custom harvest groups and the transportation companies, are shown in Figure 8. New incomes for crop growers include the sale of crop residues and the bale storage. Crop growers can use a portion of their farmlands to store bales for pellet plants, as there is limited land for pellet plants to store enough bales on-site for 1–2 weeks of operations. As shown in Figure 8, on average, crop growers have the potential to generate about CAD 1.15 and CAD 0.28 million from annual sale of crop residues and bale storage in each region, respectively.
The average annual income from field operations including baling and bale collection and stacking for each region is estimated to be about CAD 1.62 million per year. This income can be earned either by local crop growers or custom harvest companies. Local growers can use the harvest equipment that they already own for harvesting and collecting hay or other biomass types if there is no conflict in the harvest seasons of their crops. Another player that can generate incomes is transportation companies, by providing bale handling and transportation services. The estimated annual income by transportation companies is about CAD 0.59 million in each region.
As shown in Figure 9, total generated revenues in the biomass logistics system in all six case studies are estimated to be about CAD 21.80 million annually. Crop growers, custom harvest groups and transportation companies can potentially gain a share of 40%, 44% and 16% of the total annual generated revenues, respectively.
In addition to the potential new incomes for the logistics players, increasing demand for biomass will likely result in rising demands for logistics equipment. In each region under study, about 47 pieces of equipment will be needed including 12 square balers, 10 bale collectors, 17 tractors, 3 loaders and 5 trucks with flatbed trailers. The total economic value of these pieces of equipment, if assumed brand-new, is about CAD 9.30 million. Regardless of what portion of equipment demand is met through the existing fleet and/or the brand-new fleet, the utilization of this large number of logistics equipment will create jobs and wealth in the equipment manufacturing and dealership networks. In addition, this number of equipment fleet needs 30 operators to run them. These operators can make an income of over CAD 0.36 million by running the logistics equipment to harvest, collect, handle and transport crop residues to the pellet plant.
Overall, in all six case studies, it is estimated that 278 pieces of logistics equipment with a total economic value of CAD 55.81 million will be needed to meet the annual biomass demand of the six pellet plants. The logistics equipment fleet needs 176 local operators with a potential total annual income of about CAD 2.18 million.

4.3. Pellet Production Cost

As shown in Figure 3, the delivered bales to the pellet plant need to go through several operations to produce ag-pellets, including unloading and storing straw bales, de-baling and chopping, drying, fine grinding, pelletization, cooling and screening, and pellet storage. There are capital and operating costs associated with each operation. As discussed in Section 2, the total capital cost of the pellet plant with a capacity of 5 tonnes/h is estimated to be about CAD 5.75 million.
Figure 10 shows the pellet production cost for the case studies. There is an insignificant difference between the costs of ag-pellet in all six locations, mainly because the biomass delivered costs are estimated to be similar in all locations. The ag-pellet cost varies in the range of CAD 138–142/tonne. Biomass cost is the main contributor to the ag-pellet production cost (54%), followed by straw bale receiving and processing (bale unloading, storage and chopping) (14%) and labor (12%). The estimated ag-pellet production costs are comparable with wood pellets produced at small-scale pellet plants. A review of literature on the wood pellet production cost in various world regions shows that the wood pellet cost at small-scale pellet plants are estimated to be in a range of EUR 99–109/tonne (CAD 148–163/toe) (EUR/CAD exchange rate of 1.4936), with an average cost of EUR102/tonne (CAD 152/tonne) [10].

4.4. Pellet Price at the Port of Delivery

The ag-pellet production costs in Figure 10 do not include the profit margin for the pellet producers. The minimum selling price (MESP) (CAD/tonne) is used in this study to estimate the ag-pellet price, including the profit margin. MESP of ag-pellet at the gate of the pellet plant was calculated for each region in order to obtain a net present value (NPV) of zero for a 15% internal rate of return (IRR) (before tax) on the full capital cost of CAD 5.75 million. As shown in Table 3, the average MESP of ag-pellets is estimated to be CAD 150/tonne, assuming the average annual inflation rate of 1.57% and pellet price annual escalator of 2.5%, as shown in Table A3 in the Appendix A.
Table 4 shows the estimated rail transportation costs between the location of ag-pellet plants and the port terminal at the Port of Vancouver, given the transportation distances given in Table 2. In addition to the transportation distance, type of railcar, demands for railcar in origin and destination points, the rail traffic on the rail routes between the origin and destination points and fuel cost impact the rail transportation cost. The estimated transportation costs in Table 4 include all related fees, such as railcar rentals and insurance, railcar pull charge, fuel surcharge, and carbon tax charged on the use of fossil fuel to run the locomotives. The rail transport costs do not include additional capital investments in rail infrastructure that might be needed at the ag-pellet plants to connect to the rail mainlines.
Ag-pellets are stored in the port terminal until the arrival of an ocean vessel. Similar to wood pellets, ag-pellets are loaded directly from storage silos into the vessel cargo. The ocean vessel then ships and delivers the ag-pellets to one of the three major ports in the Netherlands (Rotterdam, Amsterdam and Antwerp, known as ARA). Table 5 shows the breakdown of average ag-pellet price from the six locations in Alberta and Saskatchewan to ARA. The CIF ag-pellet price from the six ag-pellet plants to ARA is estimated to be in a range of CAD 260–290/tonne. There is a cost associated with currency risk that adds to the price of ag-pellets at the port of delivery to hedge this risk. Given the fluctuation in EUR/CAD in 2020 [56], the estimated CIF ag-pellet price range could increase from CAD 260–290/tonne to CAD 274–305/tonne.
Most of the industrial pellets exchanged between North America and Western Europe are traded under long-term price contracts. The contract prices have varied between EUR 131–182/tonne (CAD 196–272/tonne), with an average price of EUR 143/tonne (CAD 214/tonne) over the period of 2012–2017 [10]. The consideration of external shocks such as fluctuation in the exchange rate makes produced ag-pellets from the six locations more expensive than the historical price of wood pellets at the port of discharge over the period of 2012–2017, as shown in Table 5. In case of the wood pellet price at EUR 131/tonne (lower bound of price range), the price of ag-pellets at the six locations are estimated to be 40–55% more expensive. Assuming the wood pellet price at EUR 182/tonne (upper bound of price range), the price of ag-pellets at the six locations is estimated to be 1–12% more expensive. Comparing with the average price of wood pellet at EUR 143/tonne, the price of ag-pellets at the six locations is estimated to be 29–42% more expensive.
Given the historical contract price of wood pellets in Western Canada, the supply chain costs of agricultural pellets need to be reduced to be able to supplement wood pellets in the growing global biomass demand for bioenergy production. There are several potential areas where the cost of ag-pellets can be reduced across its supply chain.
On the biomass supply side, more farmers involved as suppliers of agricultural residues to the pellet plant result in a smaller biomass supply area. Smaller biomass supply areas with high biomass availability can lead to the reduction in the operating costs of field operations and transportation. The distance and travel time of the field equipment including balers, bale collectors and loaders moving between crop fields during the harvest season would be reduced in a smaller supply area. This would improve their operational efficiency and lower their operating costs. In addition, smaller supply areas decrease the transportation distances between crop fields and the pellet plant. The ag-pellet plant should develop a biomass supply contract that encourages as many crop growers as possible to supply their crop residues to the pellet plant. As shown in Figure 9, crop growers have the potential to generate an annual income of over CAD 8.5 million in the upstream biomass logistics system of ag-pellet production in the six locations under study.
On the ag-pellet production side, the optimal size of ag-pellet production capacity can contribute to the reduction of the costs associated with ag-pellet production and downstream operations. Large pellet plants can exploit the economics of scale and reduce the capital cost of ag-pellet production per tonne. In addition, larger pellet plants can transport larger quantities of ag-pellets using more railcars per trip to the port terminals. The faster the storage silos build up the ag-pellet inventories, the faster the ag-pellet plant can ship its product to global traders and buyers. This enables the ag-pellet plant to move toward a just-in time supply chain that can potentially reduce the inventory, handling, and rail and ocean transportation costs. However, the cost reduction in the production and distribution of ag-pellets should offset the potential increase in biomass delivered costs, as larger pellet plants need to secure their biomass from larger supply areas.
The optimal location of the ag-pellet plant with short transportation distance from port terminals can also contribute to the reduction of ag-pellet supply chain costs. As shown in Table 5, about 18–26% of the price of the ag-pellets were estimated to be rail transportation costs from the pellet plant to the port terminals. In addition, the distance of the pellet plant from the market can also contribute to the reduction of ag-pellet delivery cost to end users. In this study, Western Europe was selected as the potential market, while the ag-pellets can be considered for the emerging markets such as Japan and South Korea, with shorter distances from the six pellet plants compared to Western Europe. Over 15% of the price of the ag-pellets was estimated to be shipping cost.
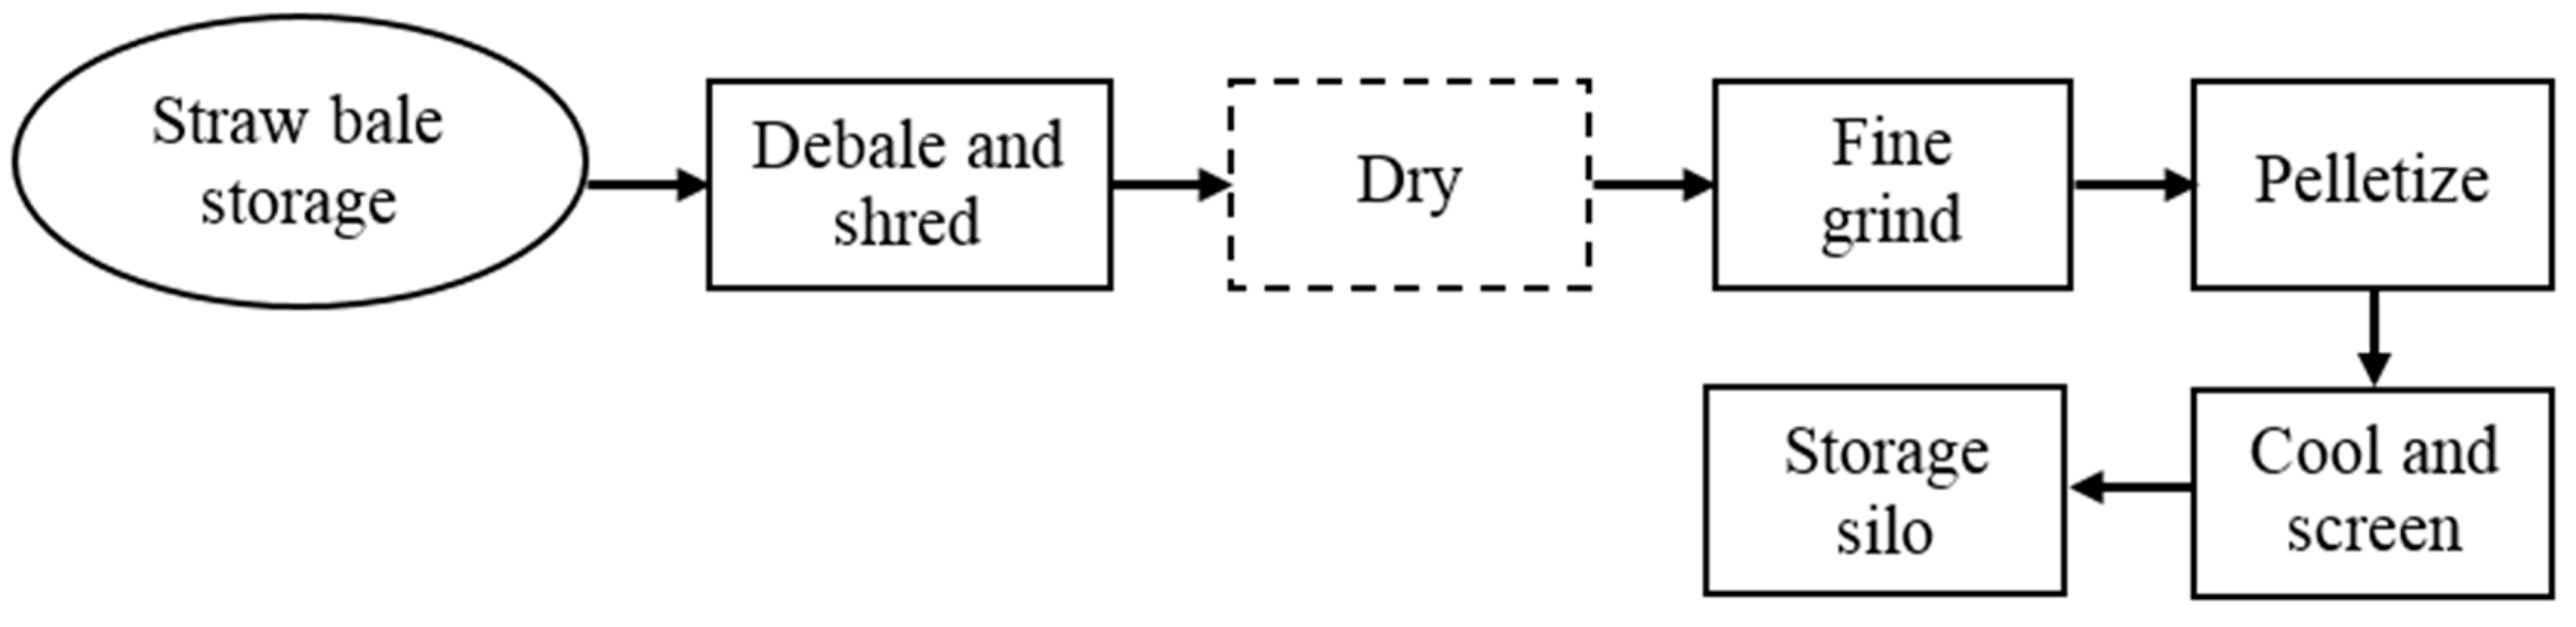
Another cost reduction potential is the drying operation at the pellet plant. Drying is usually a capital-intensive operation with a high operating cost. This operation requires the purchase and installation of several pieces of equipment and usually consumes a large amount of energy. As shown in Figure 10, drying contributes about CAD 7/tonne to the pellet production cost. Depending on the type of agricultural biomass, the timing of the harvest and weather conditions as well as the biomass storage practices, the moisture content of delivered bales to the pellet plant can fall within an acceptable range that does not need drying or needs a low intensive drying operation. Field drying and various storage regimes (e.g., outdoors, outdoors and under tarp, under roof, and in airtight wrapping) have been studies in the literature to investigate their impacts on moisture content, dry matter loss and the self-heating of agricultural biomass [58,59,60,61]. A cost–benefit analysis can be considered in future studies to identify the least-cost scenario for drying agricultural biomass for a pellet plant, considering the initial moisture content of agricultural biomass in the field, weather conditions during the harvest season, the cost of the storage regime, and the drying cost of agricultural biomass at the pellet plant.
The supporting policies by local, provincial and federal governments can also contribute to the reduction of ag-pellet production costs, by providing financial programs such as tax relief/breaks, grants and loan guarantees to buy down the capital costs, compensation for depreciation of production and supply chain assets. Such financial programs can encourage investment in the establishment of pioneering ag-pellet plants. These financial programs can be justified by the significant potential of economic activities and employment generated in farm communities. As discussed in Section 4.2, the establishment of six ag-pellet plants with a combined capacity of 30 tonnes/hr and a total estimated capital cost of CAD 34.5 million can lead to the generation of an annual income of CAD 21.7 million in farm communities and the employment of 176 operators who run the biomass logistics operations. It is noteworthy that such supporting programs and financial incentives must be in line with the terms of international agreements, such as the Comprehensive Economic and Trade Agreement (CETA), a free-trade agreement between Canada and the European Union.
However, it is noteworthy that the lower quality of agricultural biomass (high level of ash, nitrogen, sulfur, potassium and chlorine [15,17]) compared to woody biomass may require extra pre-processing operations, such as leaching, blending and binding agents at the pellet plant, to meet the national and international quality standards and requirements to be able to access the existing bioenergy markets. The possible additional steps at the pellet plant likely result in higher ag-pellet production cost. The need for pre-processing operations at the ag-pellet plants depend on the physical and chemical properties of agricultural biomass used in the production of ag-pellets and the quality specifications of the end users. The need for extra pre-processing operations and their impact on the ag-pellet cost and price can be investigated in future studies.

5. Conclusions

The growing global demand for wood pellets and the limited availability of sustainable forest biomass resources at competitive prices will likely increase the global trade of other biomass resources such as agricultural residues. Agricultural residues have mainly been used for local markets such as animal bedding, feed and bioenergy production, due to the expensive transportation of straw bales and in-efficient storage and handling operations. Due to the limited experience in the production and distribution of ag-pellets in commercial quantities, they are unlikely to be price competitive with the established global wood pellet markets in the short term. However, despite the relative complexity of the upstream of ag-pellet supply chains compared to that of the wood pellets supply chains (i.e., harvesting, collection, storage and transportation), there are several potential areas where the supply chain costs of ag-pellets can be reduced, including agricultural biomass logistics, pellet production processes, downstream ag-pellets distribution and economies of scale. Depending on the potential cost reduction level, ag-pellets may become an affordable supplement to the existing wood pellet markets for bioenergy production in the mid and long terms. The potential cost reduction can be investigated in the future studies given the regional characteristics of agricultural biomass logistics systems and the considered supply chain configurations. Improving the quality of agricultural pellets in a cost-efficient manner is also critical to accelerate the development of international markets for agricultural pellets.
The establishment of ag-pellet plants in farm communities can generate significant economic activities and employment opportunities, mainly on the upstream biomass logistics system. The economic diversification in farm communities and the growing global demand for sustainable and low-carbon biomass resources provide the justification for local, provincial and federal governments to encourage the production of ag-pellets in local communities, by developing financial programs that can help ag-pellet producers de-risk their ag-pellet supply chains and reduce their production and distribution costs, until the ag-pellets become a mature product and markets in the global trade of biomass for bioenergy production.

Author Contributions

Conceptualization, M.E.; Formal analysis, M.E.; Investigation, S.S., D.L., A.K. and L.T.-S.; Methodology, M.E., S.S.; Resources, D.L., A.K. and L.T.-S.; Software, D.L., A.K., L.T-S.; Supervision, S.S.; Validation, M.E., D.L., A.K. and L.T.-S.; Writing—original draft, M.E.; Writing—review—editing, M.E., S.S., D.L., A.K. and L.T.-S. All authors have read and agreed to the published version of the manuscript.

Funding

Support for this paper was provided through the Biomass Canada Cluster (BMC), which is funded through Agriculture and Agri-Food Canada’s AgriScience program and industry partners.

Acknowledgments

Support for this paper was provided through the Biomass Canada Cluster (BMC), which is funded through Agriculture and Agri-Food Canada’s AgriScience program and industry partners.

Conflicts of Interest

The authors declare no conflict of interest

Appendix A. Biomass Logistics and Ag-Pellet Production and Distribution Data (Monetary Values Are in Canadian Dollars Unless Stated Otherwise)

Table A1. Biomass logistics equipment data used in IBSAL-AgPellet.
Large Square BalerTractor to Pull the BalerSelf-Propelled Bale CollectorBale Loader- TelehandlerFlatbed Trailer (53″)Tractor Truck to Pull the Flatbed Trailer
Operational width (ft)7.41Power (hp)225Number of bales per load12Number of bales per load3Number of bales per load39Power (hp)450
Field speed (km/hr)(15,20)Purchase price (CAD)365,000Travel speed (km/hr)24Loading time per load (min)1Load time (min/bale)0.2Labour cost (CAD/h)26.40
Purchase price (CAD)196,000Labor cost (CAD/hr)26.40Load time (min/bale)(0.25–0.75)Unloading time per load (min)0.5Travel speed full (kph)70Purchase price (CAD)455,000
Bale dimensions (W × H × L) (ft)4 × 3 × 8Fuel Consumption (liter/hr)2.60Unloading time (min/bale)0.20Horsepower (hp)120Unloading (min/bale)0.1Fuel Consumption (liter/h)5.21
Bale density (lb/ft3)(10,12) Power (hp)320Purchase price (CAD)78,000Purchase price (CAD)51,000
Cost of twine (CAD/bale)0.78 Labor cost (CAD/hr)26.40Fuel Consumption (liter/hr)1.39Winding factor(1,1.5)
Machine Efficiency(0.7,0.9) Purchase price (CAD)350,000Machine Efficiency(0.6,0.8)Machine Efficiency(0.8,0.9)
Winding factor(1,1.5)
Fuel Consumption (liter/hr)3.70
Machine Efficiency(0.8,0.9)
Table A2. Capital cost of the ag-pellet plant with a capacity of 5 tonne/h (43,800 tonne/year).
Straw bale de-baling and chopping221,240
Drying1,159,650
Grinding391,980
Pelletization981,120
Cooling & Screening61,700
Storage silo145,800
Land, site preparation, buildings construction, engineering, etc.2,230,008
Contingency for construction period and startup557,502
Total capital cost5,749,000
The capital cost of each operation include the primary equipment and the auxiliary equipment (e.g., conveyors, tanks and other fixed equipment).
Table A3. The assumptions used to estimate the production cost of ag-pellets.
Debt (% of capital investment) [20]75
Equity (% of capital investment) [20]25
Cost of borrowing- Interest rate (%) [62]5
Term of debt (years) [20]10
Average annual inflation rate (%) [63]1.57
Pellet price annual escalator (%) [20]2.50

References

  1. International Energy Agency (IEA). Coal 2019—Analysis and Forecasts to 2024. 2019. Available online: https://webstore.iea.org/market-report-series-coal-2019 (accessed on 5 October 2020).
  2. Knapp, S.; Güldemund, A.; Weyand, S.; Schebek, L. Evaluation of co-firing as a cost-effective short-term sustainable CO2 mitigation strategy in Germany. Energy Sustain. Soc. 2019, 9, 32. [Google Scholar] [CrossRef] [Green Version]
  3. Roni, M.S.; Chowdhury, S.; Mamun, S.; Marufuzzaman, M.; Lein, W.; Johnson, S. Biomass co-firing technology with policies, challenges, and opportunities: A global review. Renew. Sustain. Energy Rev. 2017, 78, 1089–1101. [Google Scholar] [CrossRef]
  4. International Energy Agency (IEA). Energy and Air Pollution: World Energy Outlook Special Report. IEA Publications. 2016. Available online: https://www.iea.org/reports/energy-and-air-pollution (accessed on 11 October 2020).
  5. Sakuragi, K.; Otaka, M. Grinding Characteristics of Wood Pellet and Coal Mixtures in a Roller Mill. Energy Fuels 2021, 35, 419–424. [Google Scholar] [CrossRef]
  6. Buchholz, T.; Gunn, J.S.; Saah, D.S. Greenhouse gas emissions of local wood pellet heat from northeastern US forests. Energy 2017, 141, 483–491. [Google Scholar] [CrossRef]
  7. Zhang, Y.; Mc Kechnie, J.; Cormier, D.; Lyng, R.; Mabee, W.; Ogino, A.; MacLean, H.L. Life Cycle Emissions and Cost of Producing Electricity from Coal, Natural Gas, and Wood Pellets in Ontario, Canada. Environ. Sci. Technol. 2010, 44, 538–544. [Google Scholar] [CrossRef] [PubMed]
  8. William, S.; Walker, S. Global Pellet Market Outlook in 2018. Canadian Biomass. 1 February 2018. Available online: https://www.canadianbiomassmagazine.ca/increasing-demand-6705/ (accessed on 4 November 2020).
  9. Thrän, D.; Peetz, D.; Schaubach, K.; Trømborg, E.; Pellini, A.; Lamers, P.; Hess, J.R.; Schipfer, F.; Hektor, B.; Olsson, O.; et al. Global Wood Pellet Industry and Trade Study. In Proceedings of the European Biomass Conference and Exhibition Proceedings, Stockholm, Sweden, 12–15 June 2017. [Google Scholar]
  10. Visser, L.; Hoefnagels, R.; Junginger, M. Wood pellet supply chain costs—A review and cost optimization analysis. Renew. Sustain. Energy Rev. 2020, 118, 109506. [Google Scholar] [CrossRef]
  11. Matzenberger, J.; Kranzl, L.; Tromborg, E.; Junginger, M.; Daioglou, V.; Goh, C.S.; Keramidas, K. Future perspectives of international bioenergy trade. Renew. Sustain. Energy Rev. 2015, 43, 926–941. [Google Scholar] [CrossRef]
  12. International Energy Agency (IEA) Bioenergy. Mobilisation of Agricultural Residues for Bioenergy and Higher Value Bio-Products: Resources, Barriers and Sustainability. 2017. Available online: https://www.ieabioenergy.com/wp-content/uploads/2018/01/TR2017-01-F.pdf (accessed on 5 October 2020).
  13. Lamers, P.; Roni, M.S.; Tumuluru, J.S.; Jacobson, J.J.; Cafferty, K.G.; Hansen, J.K.; Kenney, K.; Teymouri, F.; Bals, B. Techno-economic analysis of decentralized biomass processing depots. Bioresour. Technol. 2015, 194, 205–213. [Google Scholar] [CrossRef] [Green Version]
  14. US Department of Energy (US DOE). Advanced Feedstock Supply System Validation Workshop Summary Report. 2015. Available online: https://bioenergy.inl.gov/Workshop Documents/Advanced Feedstock Supply System Validation Workshop Summary Report.pdf (accessed on 16 October 2020).
  15. Nilsson, D.; Bernesson, S.; Hansson, P.-A. Pellet production from agricultural raw materials—A systems study. Biomass Bioenergy 2011, 35, 679–689. [Google Scholar] [CrossRef]
  16. Bentsen, N.S.; Nilsson, D.; Larsen, S. Agricultural residues for energy—A case study on the influence of resource availability, economy and policy on the use of straw for energy in Denmark and Sweden. Biomass Bioenergy 2018, 108, 278–288. [Google Scholar] [CrossRef]
  17. Polle, A.; Zeng, T.; Lenz, V. MixBioPells—Market Implementation of Alternative and Mixed Biomass Pellets in Europe. 2012. Available online: https://ec.europa.eu/energy/intelligent/projects/sites/iee-projects/files/projects/documents/mixbiopells_final_report_en.pdf (accessed on 24 October 2020).
  18. Mani, S.; Sokhansanj, S.; Bi, X.; Turhollow, A. Economics of producing fuel pellets from biomass. Appl. Eng. Agric. 2006, 22, 421–426. [Google Scholar] [CrossRef]
  19. Pirraglia, A.; Gonzalez, R.; Saloni, D. Techno-economical analysis of wood pellets production for U.S. manufacturers. BioResources 2010, 5, 2374–2390. [Google Scholar] [CrossRef]
  20. Hunsberger, R.; Mosey, G. Pre-Feasibility Analysis of Pellet Manufacturing on the Former Loring Air Force Base Site; Technical Report; NREL: Golden, CO, USA, 2014.
  21. Pantaleo, A.; Villarini, M.; Colantoni, A.; Carlini, M.; Santoro, F.; Hamedani, S.R. Techno-Economic Modeling of Biomass Pellet Routes: Feasibility in Italy. Energies 2020, 13, 1636. [Google Scholar] [CrossRef] [Green Version]
  22. Hoefnagels, R.; Junginger, M.; Faaij, A. The economic potential of wood pellet production from alternative, low-value wood sources in the southeast of the U.S. Biomass Bioenergy 2014, 71, 443–454. [Google Scholar] [CrossRef]
  23. Uasuf, A.; Becker, G. Wood pellets production costs and energy consumption under different framework conditions in Northeast Argentina. Biomass Bioenergy 2011, 35, 1357–1366. [Google Scholar] [CrossRef]
  24. Thek, G.; Obernberger, I. Wood pellet production costs under Austrian and in comparison to Swedish framework conditions. Biomass Bioenergy 2004, 27, 671–693. [Google Scholar] [CrossRef]
  25. Mobini, M. On the Design and Analysis of Forest Biomass to Biofuel and Bioenergy Supply Chains. Ph.D. Thesis, The University of British Columbia, Vancouver, BC, Canada, 2015. [Google Scholar]
  26. Mobini, M.; Sowlati, T.; Sokhansanj, S. A simulation model for the design and analysis of wood pellet supply chains. Appl. Energy 2013, 111, 1239–1249. [Google Scholar] [CrossRef]
  27. Boukherroub, T.; Lebel, L.; Lemieux, S. An integrated wood pellet supply chain development: Selecting among feedstock sources and a range of operating scales. Appl. Energy 2017, 198, 385–400. [Google Scholar] [CrossRef]
  28. Qian, Y.; McDow, W. The Wood Pellet Value Chain—An Economic Analysis of the Wood Pellet Supply Chain from the Southeast United States to European Consumers. 2013. Available online: https://citeseerx.ist.psu.edu/viewdoc/download?doi=10.1.1.401.4285&rep=rep1&type=pdf (accessed on 5 December 2020).
  29. Trømborg, E.; Ranta, T.; Schweinle, J.; Solberg, B.; Skjevrak, G.; Tiffany, D.G. Economic sustainability for wood pellets production—A comparative study between Finland, Germany, Norway, Sweden and the US. Biomass Bioenergy 2013, 57, 68–77. [Google Scholar] [CrossRef]
  30. Sikkema, R.; Junginger, M.; Pichler, W.; Hayes, S.; Faaij, A.P. The international logistics of wood pellets for heating and power production in Europe: Costs, energy-input and greenhouse gas balances of pellet consumption in Italy, Sweden and the Netherlands. Biofuels Bioprod. Biorefining 2010, 4, 132–153. [Google Scholar] [CrossRef]
  31. Ehrig, R.; Behrendt, F.; Wörgetter, M.; Strasser, C. Economics and Price Risks in International Pellet Supply Chains; SpringerBriefs in Applied Sciences Series; Springer: Cham, Switzerland, 2014. [Google Scholar] [CrossRef]
  32. Schipfer, F.; Kranzl, L.; Olsson, O.; Lamers, P. The European wood pellets for heating market—Price developments, trade and market efficiency. Energy 2020, 212, 118636. [Google Scholar] [CrossRef]
  33. Schipfer, F.; Kranzl, L.; Olsson, O.; Lamers, P. European residential wood pellet trade and prices dataset. Data Brief 2020, 32, 106254. [Google Scholar] [CrossRef]
  34. European Biomass Industry Association, Logistic Management of Wood Pellets: Data Collection on Transportation, Storage and Delivery Management. 2009. Available online: https://ec.europa.eu/energy/intelligent/projects/sites/iee-projects/files/projects/documents/pelletslas_pellet_logistics_data.pdf (accessed on 5 December 2020).
  35. Lamers, P.; Junginger, M.; Hamelinck, C.; Faaij, A. Developments in international solid biofuel trade—An analysis of volumes, policies, and market factors. Renew. Sustain. Energy Rev. 2012, 16, 3176–3199. [Google Scholar] [CrossRef]
  36. Thrän, D.; Schaubach, K.; Peetz, D.; Junginger, M.; Mai-Moulin, T.; Schipfer, F.; Olsson, O.; Lamers, P. The dynamics of the global wood pellet markets and trade—Key regions, developments and impact factors. Biofuels Bioprod. Biorefining 2018, 13, 267–280. [Google Scholar] [CrossRef]
  37. Campbell, K. A Feasibility Study Guide for an Agricultural Biomass Pellet Company. 2007. Available online: https://www.auri.org/wp-content/uploads/2007/11/FINAL-FEASIBILITY-STUDY-GUIDE-11-26-07.pdf (accessed on 5 November 2020).
  38. Sultana, A.; Kumar, A.; Harfield, D. Development of agri-pellet production cost and optimum size. Bioresour. Technol. 2010, 101, 5609–5621. [Google Scholar] [CrossRef] [PubMed]
  39. Haase, S. Assessment of Biomass Pelletization Options for Greensburg, Kansas; Technical Report NREL/TP-7A2-48073; NREL: Golden, CO, USA, 2010.
  40. Karkania, V.; Fanara, E.; Zabaniotou, A. Review of sustainable biomass pellets production—A study for agricultural residues pellets’ market in Greece. Renew. Sustain. Energy Rev. 2012, 16, 1426–1436. [Google Scholar] [CrossRef]
  41. Dafnomilis, I.; Lodewijks, G.; Junginger, M.; Schott, D. Evaluation of wood pellet handling in import terminals. Biomass Bioenergy 2018, 117, 10–23. [Google Scholar] [CrossRef]
  42. Von Wuehlisch, C. Financial Analysis of the Transport of Wood Chips as an Option among Other Solid Fiberbased Combustibles from the USA to Germany, University of North Carolina Wilmington. 2011. Available online: https://csb.uncw.edu/imba/annals/vonwuehlischc.pdf (accessed on 18 November 2020).
  43. Shah, A. Techno-Economic Analysis and Life Cycle Assessment of the Corn Stover Biomass Feedstock Supply Chain System for a Midwest-Based first-Generation Cellulosic Biorefinery. Ph.D. Thesis, Iowa State University, Ames, IA, USA, 2013. Available online: https://lib.dr.iastate.edu/etd/13493/ (accessed on 16 October 2020).
  44. Ebadian, M.; Sokhansanj, S.; Webb, E. Estimating the required logistical resources to support the development of a sustainable corn stover bioeconomy in the USA. Biofuels Bioprod. Biorefining 2017, 11, 129–149. [Google Scholar] [CrossRef]
  45. Wang, Y.; Ebadian, M.; Sokhansanj, S.; Webb, E.; Lau, A. Impact of the biorefinery size on the logistics of corn stover supply—A scenario analysis. Appl. Energy 2017, 198, 360–376. [Google Scholar] [CrossRef]
  46. Di Giacomo, G.; Taglieri, L. Renewable energy benefits with conversion of woody residues to pellets. Energy 2009, 34, 724–731. [Google Scholar] [CrossRef]
  47. Deloitte. Wood Pellet Plant Cost Study for the Forests of North Eastern Ontario; Deloitte & Touche LLP and Affiliated Entities: Ottawa, ON, Canada, 2008. [Google Scholar]
  48. Searcy, E.; Richard, H. Uniform-Format Feedstock Supply System: A Commodity Scale Design to Produce an Infrastructure-Compatible Biocrude from Lignocellulosic Biomass. 2010. Available online: https://bioenergy.inl.gov/Reports/Uniform Format Bioenergy Feedstock.pdf (accessed on 16 October 2020).
  49. Agriculture and Agri-Food Canada (AAFC). Biomass Inventory Mapping and Analysis Tool (BIMAT); Government of Canada: Regina, SK, Canada, 2019. Available online: https://open.canada.ca/en/apps/biomass-inventory-mapping-and-analysis-tool (accessed on 16 October 2020).
  50. Ebadian, M.; Sowlati, T.; Sokhansanj, S.; Smith, L.T.; Stumborg, M. Development of an integrated tactical and operational planning model for supply of feedstock to a commercial-scale bioethanol plant. Biofuels Bioprod. Biorefining 2014, 8, 171–188. [Google Scholar] [CrossRef]
  51. Li, X.; Mupondwa, E.; Panigrahi, S.; Tabil, L.; Sokhansanj, S.; Stumborg, M. A review of agricultural crop residue supply in Canada for cellulosic ethanol production. Renew. Sustain. Energy Rev. 2012, 16, 2954–2965. [Google Scholar] [CrossRef]
  52. Agriculture and Agri-Food Canada (AAFC). Analysis of Canadian Biomass Inventory in Support of BioFuel Production; Government of Canada: Regina, SK, Canada, 2020.
  53. Port of Vancouver, Cargo and Terminals in Port of Vancouver. 2020. Available online: https://www.portvancouver.com/cargo-terminals/bulk/ (accessed on 4 January 2021).
  54. Wood Pellet Association of Canada. Pellet Hub. 2011. Available online: https://www.pellet.org/wpac-news/pellet-hub (accessed on 4 January 2021).
  55. Alberta Wheat Commission. Cereal Straw: A Hidden Value on Your Farm. 2019. Available online: https://albertawheat.com/media/the-growing-point/the-growing-point-september-2019/cereal-straw-a-hidden-value-on-your-farm (accessed on 6 January 2021).
  56. Bank of Canada. Currency Converter—European Euro to Canadian Dollar. 2021. Available online: https://www.bankofcanada.ca/rates/exchange/currency-converter/?rangeType=dates&rangeValue=&sF=Canadian+dollar&lP=lookup_currency_converter_2017.php&sR=2011-02-20&sTF=from&sT=FXEURCAD&co=1.00&dF=2020-02-20&dT=2021-02-20 (accessed on 19 February 2021).
  57. Strauss, W. The Industrial Pellet Export Sector: The Keys to Successful Projects. In Proceedings of the Wood Pellet Association Canada Annual Conference, Wood Pellet Association of Canada, Vancouver, BC, Canada 18–20 November 2013; p. 33. Available online: https://www.pellet.org/images/05_-_William_Strauss_-_Futuremetics.pdf (accessed on 6 December 2020).
  58. Darr, M.J.; Shah, A. Biomass storage: An update on industrial solutions for baled biomass feedstocks. Biofuels 2012, 3, 321–332. [Google Scholar] [CrossRef]
  59. Shah, A.; Darr, M.J.; Webster, K.; Hoffman, C. Outdoor Storage Characteristics of Single-Pass Large Square Corn Stover Bales in Iowa. Energies 2011, 4, 1687–1695. [Google Scholar] [CrossRef] [Green Version]
  60. Smith, W.A.; Bonner, I.J.; Kenney, K.L.; Wendt, L.M. Practical considerations of moisture in baled biomass feedstocks. Biofuels 2013, 4, 95–110. [Google Scholar] [CrossRef]
  61. Shinners, K.J.; Binversie, B.N.; Muck, R.E.; Weimer, P.J. Comparison of wet and dry corn stover harvest and storage. Biomass Bioenergy 2007, 31, 211–221. [Google Scholar] [CrossRef]
  62. Government of Saskatchewan. 2020–2021 Farm Machinery Custom and Rental Rate Guide. 2020. Available online: https://www.saskatchewan.ca/business/agriculture-natural-resources-and-industry/agribusiness-farmers-and-ranchers/livestock/farm-machinery-custom-and-rental-rate-guide (accessed on 22 October 2020).
  63. Bank of Canada. Inflation Calculator—Average of 2015–2020. 2020. Available online: https://www.bankofcanada.ca/rates/related/inflation-calculator/ (accessed on 5 November 2020).
Figure 1. Different segments of the ag-pellet supply chain modeled and evaluated in this study.
Energies 14 02263 g001
Figure 2. Sequence of operations in the upstream biomass logistics in the ag-pellet supply chain (adapted from [44,45]).
Energies 14 02263 g002
Figure 3. Sequence of operations at the pellet plant to produce ag-pellets.
Energies 14 02263 g003
Figure 4. Distribution and delivery of ag-pellets from the pellet plant to the port of destination.
Energies 14 02263 g004
Figure 5. Regional availability of agricultural biomass in Canada [52].
Energies 14 02263 g005
Figure 6. Locations of six potential ag-pellet production sites and their biomass supply area, shown in yellow.
Energies 14 02263 g006
Figure 7. Biomass logistics costs for the six case studies.
Energies 14 02263 g007
Figure 8. Annual revenue generated in the upstream biomass logistics system by supplying agricultural biomass for the pellet plant.
Energies 14 02263 g008
Figure 9. Contribution of different biomass logistics operations to the total annual generated incomes in all six case studies (in Canadian dollars).
Energies 14 02263 g009
Figure 10. Ag-pellet production cost at the six potential ag-pellet production regions.
Energies 14 02263 g010
Table 1. Biomass supply profile of the six selected locations as the potential sites for the production of ag-pellets.
Biomass Supply ProfileEquity, ABViking, ABEdmonton, ABSaskatoon, SKRegina, SKMelville, SK
Wheat straw (dt)49,82140,49031,39645,88545,31438,357
Barley straw (dt)827513012,60214081076922
Flax straw (dt)44117366124042343106
Oat straw (dt)18256306493167116759989
Total available biomass (dt)51,27151,42350,55750,20452,29952,374
Size of biomass supply area (km2)140023004000310021002400
Average transportation distance of crop fields from the pellet plant (km)111418161414
Table 2. Rail transportation distance between the ag-pellet plants and the Port of Vancouver, British Columbia (BC) (Personal communications with Canadian National Railway, December 2020).
Location of Ag-Pellet PlantsLocation of Port TerminalRail Transportation Distance (km)
Equity, ABPort of Vancouver, BC1470
Viking, ABPort of Vancouver, BC1355
Edmonton, ABPort of Vancouver, BC1225
Saskatoon, SKPort of Vancouver, BC1740
Regina, SKPort of Vancouver, BC2190
Melville, SKPort of Vancouver, BC2045
Table 3. IRR and NPV of the ag-pellet plants for different pellet prices.
Pellet Price at the Gate of the Pellet Plant (CAD/tonne)IRR for Total Capital Cost (%)NPV (@ 15% and 10 Years) (CAD)
130IRR < 0−3,943,327
1406.95−1,896,383
15015.60150,560
16023.492,197,504
17030.954,244,448
18038.166,291,392
Table 4. Rail transportation cost of ag-pellets from the pellet plants to the Port of Vancouver.
Location of Ag-Pellet PlantsLocation of Port Terminal Rail Transportation Cost (CAD/tonne)
Equity, ABPort of Vancouver, BC55.86
Viking, ABPort of Vancouver, BC54.20
Edmonton, ABPort of Vancouver, BC50.23
Saskatoon, SKPort of Vancouver, BC62.64
Regina, SKPort of Vancouver, BC81.03
Melville, SKPort of Vancouver, BC79.76
Table 5. Breakdown of average ag-pellet pellet price (CAD/tonne) from the six locations in Alberta and Saskatchewan to one of the three major ports in the Netherlands.
Ag-Pellet Price Component Equity, ABViking, ABEdmonton, ABSaskatoon, SKRegina, SKMelville, SK
Pellet price at ag-pellet plant148.20150.11151.14149.45149.35148.74
Rail transportation cost55.8654.2050.2362.6481.0379.76
Port terminal cost (storage and ship loading) [57]13.2413.2413.2413.2413.2413.24
Shipping cost [34,42]46.3446.3446.3446.3446.3446.34
CIF ag-pellet price263.64263.89260.95271.67289.96288.08
CIF ag-pellet price including currency risk cost277.00277.25274.16285.42304.64302.66
CIF ag-pellet price including currency risk cost (EUR/tonne)185.45185.63183.56191.10203.96202.64
Publisher’s Note: MDPI stays neutral with regard to jurisdictional claims in published maps and institutional affiliations.

