Article

A System Dynamics Approach to Comparative Analysis of Biomass Supply Chain Coordination Strategies

Concordia Institute for Information Systems Engineering (CIISE), Concordia University, Montreal, QC H3G 1M8, Canada
*
Author to whom correspondence should be addressed.
Energies 2021, 14(10), 2808; https://doi.org/10.3390/en14102808
Submission received: 18 March 2021 / Revised: 4 May 2021 / Accepted: 6 May 2021 / Published: 13 May 2021
(This article belongs to the Special Issue Modeling and Analysis of Biomass-to-Energy Supply Chains)

Abstract

:
Biomass is an abundant energy source, particularly in Canada, as an alternative or primary source for electricity generation. However, low economy of scale could cause a loss of efficiency for bioenergy adoption in small remote communities. In this sense, coordination among the players could promote the efficiency and profitability of bioenergy supply chains for these communities. There are different coordination strategies with varying impacts on supply chain players’ profit or cost. Therefore, analyzing and comparing them could provide insights on how to decide about the choice of coordination strategy. In doing so, this study considers the coordination strategies of quantity discounts and cost-sharing. The study adopts a system dynamics approach for simulating these coordination scenarios, obtaining their corresponding optimal supply chain decisions, followed by a comparative analysis. For a case study, the study considers multiple suppliers providing biomass for electricity generation in three communities in northern Quebec.

1. Introduction

Renewable energy production has been rapidly attracting attention in recent years to reduce fossil energy dependency and address environmental issues. One of the abundant renewable energy sources is biomass, which could be converted to different forms of energy, including electricity, bio-fuel, and heating for homes and industrial facilities. Biomass sources include plant, animal manure, and forestry and wood processing residues [1,2,3,4,5,6]. Biomass conversion technologies are established with a lower levelized capital and operational cost compared to other renewable energy sources [7]. The Levelized Cost of Electricity (LCOE) is a useful economic scale to compare the various electricity generation technologies with different capital costs, operation costs, maintenance costs, useful life, etc. LCOE is “an average electricity price that must be earned by a specific generation source to break even” [8]. Additionally, biomass-based energy production efficiency is higher than that of wind and solar energy technologies [7]. The availability of different biomass types across Canada makes it an efficient source of energy to generate electricity, and a means of energy security for off-grid remote communities, which mostly rely on fossil fuels as the main source of energy [7]. Remote communities’ dependency on fossil fuels restricts their potentials to promote economic, environmental, and social conditions. Canadian federal government funding has supported wood-based bioenergy projects for heat and power generation in remote communities to reduce the fossil fuel dependency in these areas as well as the development of clean energy systems, economic growth, and job creation [9,10].
Despite all these benefits above, supply of biomass comes with several challenges such as seasonality, constraints on steady biomass supply, and diversity and dispersion of suppliers [4,11]. Besides, there are further challenges for supplying biomass to the remote communities as a main or back-up source of electricity generation. The challenges include remoteness and spatial dispersion of communities as well as small economies of scale. In addition, in case of northern communities, there is the necessity of continuous (sometimes year around) energy supply because of the tough weather conditions [7]. These peculiar attributes require an efficient biomass supply chain management. In this sense, one of the main objectives in managing biomass supply chains is cost minimization while ensuring continuous biomass supply [11]. Moreover, providing sufficient biomass quantities at a reasonable final price would be essential to biomass logistics [12]. The efficiency of biomass supply chains and logistic networks depend on various decisions in various stages of this chain and involve complex trade-offs [11]. In this sense, coordination could improve biomass supply chain efficiency. Supply chain coordination aims at developing a strategy to encourage involved parties to align the order quantities from suppliers of biomass with demand at the end users to ensure maximization of profit or minimization of total cost [13].
Several studies have focused on investigating various coordination incentive mechanisms among biomass supply chain members. Juanjuan et al. [14] studied the formation of alliance between a farmer, a broker, and a biomass power plant, in order to distribute the profit and adjust government incentives for increasing the feedstock supply quantity and biomass power plant’s operation. By designing an appropriate incentive mechanism under risk perception, Wang et al. [15] proposed a mechanism to provide a portion of local government’s incentives to farmers, distributors, and a biomass power plant to compensate on biomass collection, distribution, and conversion challenges, thus increasing the efficiency in each stage. To resolve the challenges in supplying biomass to remote communities in the north of Canada and encourage communities to establish larger biomass order quantities, Mafakheri et al. [7] proposed to integrate quantity discounts and cost-sharing mechanisms with the incorporation of biomass storage hubs. Li and Yang [16] designed over-production and under-production coordination contracts to ensure a sustainable level of biomass supply to biofuel producers by providing incentives or penalties for participating farmers. With an overproduction risk-sharing contract, the biofuel producers benefit from a discount price for buying extra quantities. In an under-production risk sharing contract, the farmers pay penalties for under delivery of biomass quantities. To ensure on-time orders, Chintapalli et al. [17] offered a minimum advance-order quantity promoted by a combination of advance order discounts. Frascatore and Mahmoodi [18] recommended a cost-sharing mechanism to prevent supply shortage and promote supply chain efficiency in a supply chain consisting of a buyer and a seller. In their model, the seller initiates the supply capacity subject to cost sharing among both players to ensure profit maximization. Another study proposed integrating revenue-sharing contracts with cost-sharing to improve coordination in the case of a supply chain of wind equipment manufacturers and customer enterprises to promote equipment availability [19]. The cost-sharing strategy is also proposed in case of fresh-product supply chains [20].
System dynamics models have been proposed for simulating the behavior of complex systems and their associated decision-making procedures. Forrester first developed system dynamics (SD) methodology [21] as a modeling approach to incorporating feedback structures and dealing with the non-linearity, time-delay, and multi-loop structures of the complex and dynamic systems. SD has become a foundation for computer models to analyze complex systems’ structure, interactions, and behavior [22]. A research review by Angerhofer and Angelides categorized the applications of system dynamics modeling in supply chain management for inventory management, demand amplification, supply chain reengineering, and supply chain design [23]. Another research review covers the application of system dynamics in simulating international supply chains [24]. SD has been applied for managing the supply chain of rice in a research by Bala et al. [25] to ensure the continuous supply of rice to the consumers efficiently and sustainably subject to supply uncertainty. They presented a system dynamics model to capture a non-linear dynamic and complex system with challenges such as seasonal production of rice, the impact of climate change, and lead-time and demand variability. SD was also used in reverse logistics to formulate the complexity of reverse logistic processes due to a high level of variability in quantity and quality of used products [26]. SD has also been increasingly used to address the complexity of decision-making in the energy sector [27]. An application of SD in simulating the decision-making in renewable energy supply chains, such as bioenergy (biofuels, solar, etc.) was established by Saavedra et al. [28]. Nasiri et al. proposed a simulation-based optimization of a biomass to electricity supply chain for non-residential buildings under a renewable heat incentive scheme in the United Kingdom [29]. They identified the schedule of decision variables over time by optimizing the total (life cycle) cost of (biomass conversion facility’s) ownership over subject to a number of technical, operational, and environmental constraints [29]. SD has also been employed in modeling of complex macro-economic problems in the energy sector capturing the long-term scenarios with feedback on capacities and operations [30]. Azade and Arani [30] presented a hybrid system dynamics-mathematical programming model to optimize biodiesel supply chain decisions.
In case of supply chain coordination, an SD approach could be used to investigate the long-term and dynamic complexity coordination mechanisms [26,31]. SD simulation modeling has also been established for improving information sharing as a means of improving coordination among supply chain members and enhancing a participatory decision-making process [32,33]. Rendón-Sagardi et al. [34] proposed a SD model to assist decision-makers in improving the coordination across an ethanol supply chain and logistic process. They used SD simulation modeling to observe and analyze the effects of coordination policies.
In the light of the above literature, this paper incorporates formulation of quantity discounts and cost-sharing coordination strategies in case of biomass supply chain for Canada’s remote northern communities. System dynamics modeling is adopted to simulate, analyze, and compare these coordination strategies and how they affect the biomass supply chain characteristics. This study attempts to conduct dynamic modeling and simulation of biomass supply chain coordination schemes with a particular application to remote communities.
Considering the literature, supplying biomass for power generation in Canada’s remote communities has been highly considered to develop clean energy systems and diminish fossil fuel dependency. Discussed challenges in supplying biomass to remote communities require an efficient biomass supply chain to ensure sufficient biomass supply at a reasonable price to improve the biomass-based electricity generation while minimizing the cost. Through the literature review, we can see that many scholars have established several coordination strategies to improve supply chain efficiency. However, comparing the coordination strategies to select the most efficient one could play a significant role in overcoming the mentioned challenges in supplying biomass for these communities. In this sense, we need to observe the impacts of coordination strategies on the biomass supply chain over time and compare them in various conditions to choose the most efficient one. In this regard, we are dealing with several decisions over time under each coordination scenario with complex trade-offs (and feedback) among them. There is currently no dynamic modeling to compare coordination strategies for the biomass supply chain of remote communities. Therefore, we adopt the SD approach to simulate the dynamic complexity of coordination scenarios in remote communities’ biomass supply chain. The impacts of coordination strategies and no coordination strategy on the optimal supply chain arrangements are then analyzed and compared to decide about coordination strategies or no coordination scenario. The remainder of the paper is organized as follows: Section 2 describes the problem and introduces the main assumptions and characteristics of the model. The system dynamics models, as well as the objective functions and constraints of the optimization problem, are explored in Section 3. Section 4 presents the case study and relevant simulation and optimization results. Section 5 concludes the study with proposing avenues for future research.

2. Problem Description

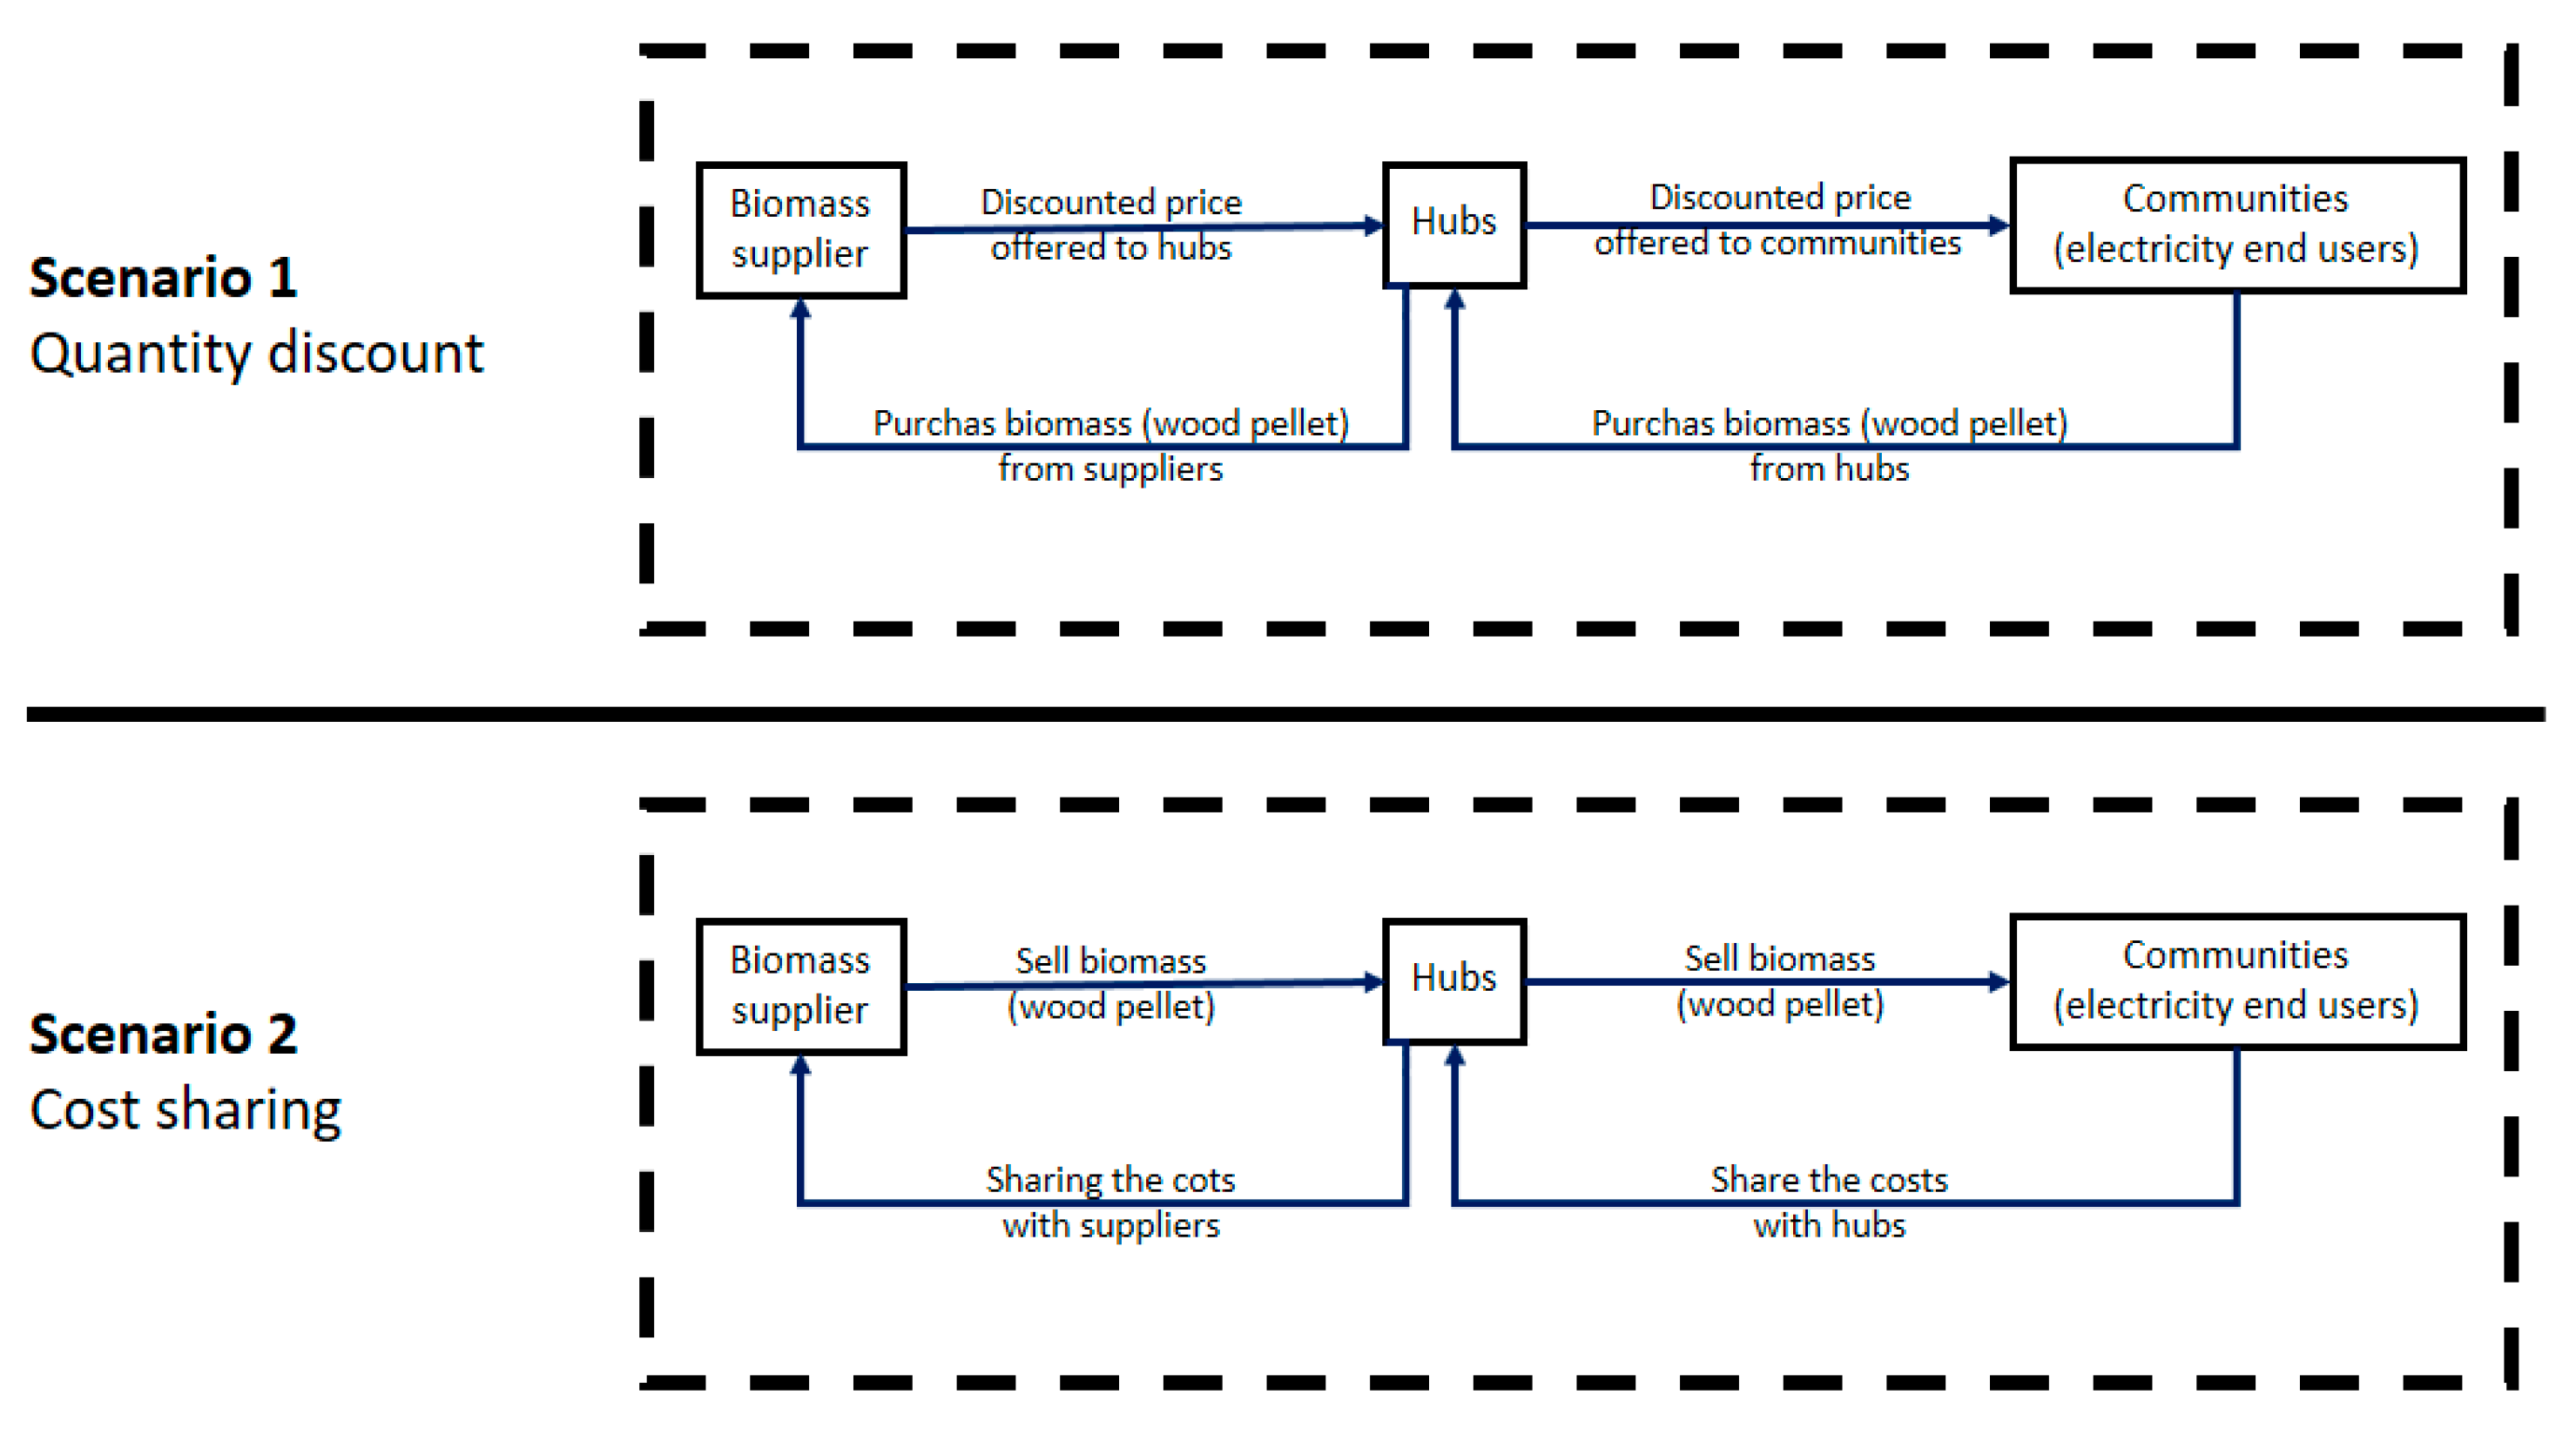
This study attempts to propose a simulation-based optimization model to analyze and compare coordination strategies in biomass supply chains. A biomass supply chain typically consists of suppliers, hubs (as purchase-distribution channels), and remote communities as the end-users of electricity [7]. The hubs purchase biomass according to the suppliers’ offered prices and distribute it to the communities by offering them a final price. Figure 1 illustrates the structure of such a biomass supply chain. The paper investigates quantity discounts and cost-sharing strategies to promote coordination in biomass supply chains, where a focus on biomass supply for electricity generation in off-grid remote areas is advocated as to investigate the impact of the above coordination schemes.
Wood-based bioenergy systems have been recently supported and developed for Canada’s remote communities, while the wood-based bioenergy supply chain is still complex and young in Canada [9,10]. This category of biomass originates mostly from forestry sector in form of wood chips and wood pellets [4]. Wood pellet is one of the wood-based types of residue obtained from the pelletization process. The uniform shape and size of wood pellet and other properties such as low moisture content and high-energy content make the logistics processes easier than other biomass types [35,36,37]. Accordingly, wood pellet is selected as the biomass type for the case of this study.
Establishing a large delivery quantity of biomass from suppliers to communities could promote the economies of scale in biomass supply chains [7]. A quantity discount strategy could encourage large quantities of biomass being delivered to hubs and subsequently to communities. In this sense, the suppliers and hubs will decide about optimal biomass prices across their corresponding supply chain channels according to demand from the communities. Moreover, the optimal quantities and schedule of the orders at the hub and communities have to be aligned, accordingly to these prices. Alternatively, the coordination could be promoted through a cost-sharing among players to increase the delivery quantities and improve the economies of scale. In this scenario, the selling entity earns an income out of large quantities of sales and compensates a portion of the purchasing and storage entity’s cost to stimulate large order quantities. Although the selling agent increases its cost in this situation, it could increase its revenue simultaneously. Based on this scenario, communities, and hubs, as well as hubs and suppliers, share costs to promote collective (larger) quantities through compensation of costs. In doing so, the ratio of cost to be shared with other parties across the supply chain will be a decision variable. Both coordination scenarios are depicted in Figure 2.
In the light of the above coordination mechanisms, we propose a biomass supply chain simulation-optimization model (over a time horizon of t) to determine the optimal schedule of the above mentioned decision variables as well as other variables such as inventory levels at hubs and communities while minimizing the total cost of the supply chain. Various technical constraints, including biomass supply capacities, storage capacities, energy demand, and electricity generation capacities, are also incorporated into the model. Using the proposed model, various scenarios on quantity discounts and cost-sharing coordination strategies will be simulated, and their impacts on the optimal supply chain arrangements are then analyzed and compared. As a reference for the methodology presented in Section 3, list of variables and parameters of the model presented in the Appendix A.

3. Methodology

As discussed in Section 2, the presented biomasses supply chain deals with a host of several decisions over time under each coordination scenario with complex trade-offs (and feedback) among them. This chain of decisions is also subject to delays resulting from transportation activities that are considerable in case of remote end-user communities. In this sense, we adopt the use of a system dynamics (SD) approach to simulate coordination scenarios over time as well as to incorporate the above mentioned feedback and delays. An SD model will enable us to identify the optimal schedule of decision variables while minimizing the supply chain’s total collective cost under each simulated coordination scenario.
In the sequel, the elements and rationale of a system dynamics approach is discussed [38]. Then, the model is presented with details of the specific supply chain problem as well as the variables. The interactions among the players are presented are explored through a causal loop diagram providing a deep understanding of the dynamism resulted from these interactions under each coordination scenario. Then, the model formulations and details of its building blocks including stocks and flows are presented paving the path to turn into structuring the optimization problem.

3.1. Causal Relationships

A causal loop diagram (CLD) is a representative tool for illustrating the feedback structures of a system. It is built upon presenting the relationships among the variables by causal links with arrows. If the relationship is balancing, with the related variables change in an opposite direction the arrow will be represented by a negative (−) sign while it they change in the same direction, the relationship is considered a reinforcing one represented by a positive (+) sign [39]. The causal relationship diagrams of coordination strategies in a biomass supply chain are presented as follows.
For quantity discount strategy, the causal loop diagram is shown in Figure 3. By offering a discount to hubs, suppliers encourage them to order large quantities and accordingly benefit from the discounted price. With respect to the ratio of order quantity to their capacity, the suppliers offer a discounted price to hubs. On the other hand, the orders are constrained by the supply capacity and hub’s storage capacity. In this sense, the suppliers’ biomass price offered to hubs is a decision variable for suppliers, while the hubs decide on the order quantity to acquire from suppliers. The hubs in turn offer a discounted price to encourage delivery of larger quantities to communities, which is subject to their storage capacity. In response, communities decide on how much biomass to order subject to their own storage capacity as well as the available biomass inventory levels at hubs.
For a cost-sharing strategy, the causal loop is represented by Figure 4. The communities are willing to order large quantities if they can share a portion of their costs with hubs. Hubs have the motivation for such a cost sharing if it encourages purchases by communities, resulting in higher revenues for hubs accordingly. Such a decision will be subject to the hubs’ storage capacity as well as communities’ needs and storage capacities. A similar motivation exists for cost sharing between suppliers and hubs.
Figure 3 and Figure 4 consist of the feedback loops with a loop identifier. There are two reinforcing loops (R1 and R2) in CLDs capturing the coordination strategies. The interaction between order quantity and price reflects the quantity discount strategy (Figure 3). The reinforcing relationship between the cost-sharing ratio and order quantity in Figure 4 represents the cost-sharing strategy. The storage capacities and stocks availability at suppliers, hubs, and communities constrains the order quantities and impose balancing loops of B1 to B3. In case of suppliers, the availability of biomass is subject to the yield levels and productivity at the corresponding forestry sites. Besides, B4 illustrates a balancing loop imposed by communities’ energy demand and electricity generation capacities.

3.2. Model

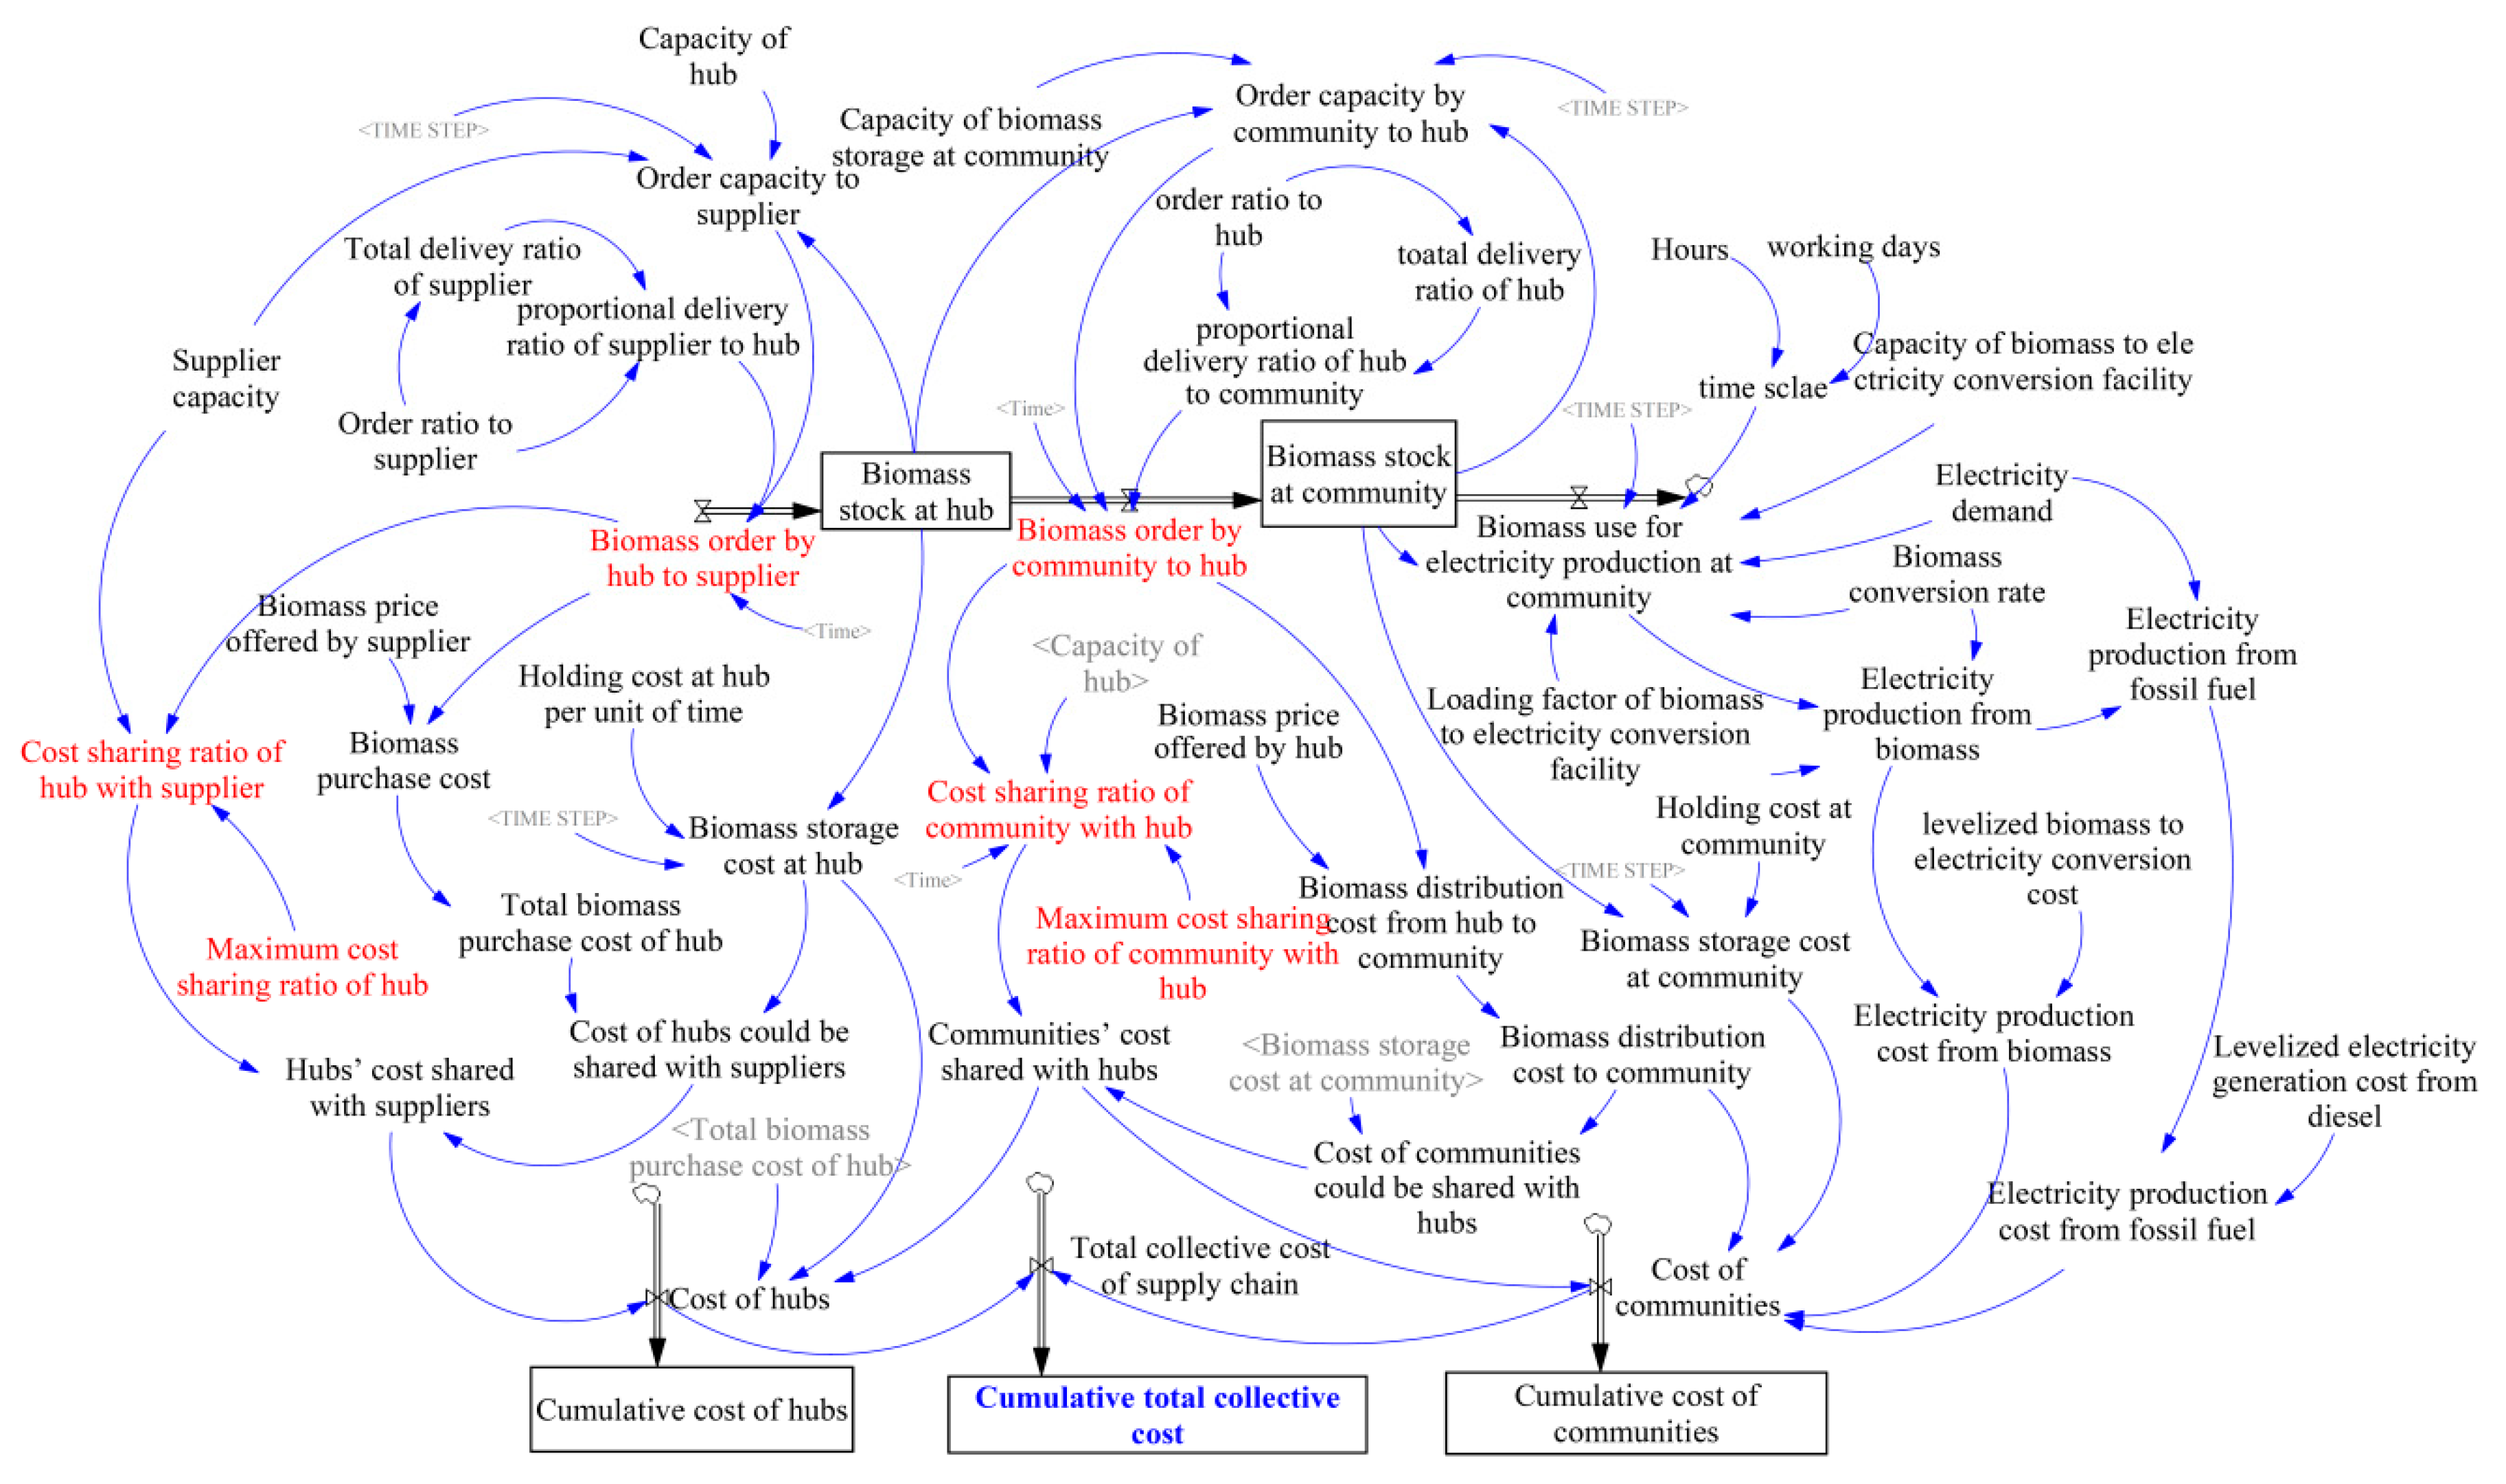
A simulation based-optimization model is constructed by developing a stock-flow diagram for each coordination scenarios with respect to the above discussed causal loop diagrams. The proposed SD models are implemented in the VENSIM Professional version 8.1.2 software (Ventana Systems, Inc., Harvard, MA, USA) [40]. The SD models are presented through stock-flow diagrams. A stock variable (represented by a box) could describe the state of the system at any time step. The double line arrows towards and outwards of the stocks describes the flow variables as inflows to and outflows from the stocks. In this sense, the net flow into a stock shows the rate of change in that stock. Constants (parameters) are the values not changing over time, and auxiliary variables are functions of stocks or constants in forms of objective functions, constraints, and formulated strategies [39]. The models corresponding to quantity discount and cost-sharing strategies are presented in Figure 5 and Figure 6, respectively. In these models, biomass stock levels at communities, cumulative energy conversion cost of communities, biomass stock levels at the hubs, cumulative cost of hubs, and the cumulative total cost of the biomass supply chain are considered as stock variables with their inflows and outflows as the flow variables. List of variables and parameters of the model with their descriptions, corresponding players, and units are presented in the Appendix A.
The models are simulated and optimized with respect to minimizing the total cost of supply chain, presented in blue in Figure 5 and Figure 6. As shown in Figure 5, this cost is comprised of purchase costs, holding costs at hubs and communities, delivery costs, and bioenergy conversion cost. Under both coordination scenarios, the aim is at identifying the schedule of decision variables (presented in red color in Figure 5 and Figure 6) subject to several discussed constraints. The details of the equations formulating the objective function and constraints of the model are provided in the following section.

3.3. Equations

3.3.1. Objective Function for Quantity Discount Scenario

The objective function is the total cumulative cost of biomass supply chain minimized over a time horizon T, as expressed in Equation (1).
Minimize
C ( T ) = t = 0 T c ( t ) d t
where c ( t ) is the total cost of biomass supply chain at time “t” calculated through Equation (2) under a quantity discount strategy as:
c ( t ) = B P C ( t ) + B S H ( t ) + B D C ( t ) + B S C ( t ) + B C C ( t ) + F E C ( t )
and B P C ( t ) : Biomass purchasing cost at time “t” (Equation (3))—(CAD/month), B S H ( t ) : Biomass storage cost at hubs at time “t” (Equation (5))—(CAD/month), B D C ( t ) : Biomass distribution cost to communities at time “t” (Equation (6))—(CAD/month), B S C ( t ) : Biomass storage cost at communities at time “t” (Equation (8))—(CAD/month), B C C ( t ) : Biomass to electricity conversion cost at time “t” (Equation (9))—(CAD/month), and F E C ( t ) : Fossil-based energy generation cost at time “t” (Equation (11))—(CAD/month). The details of equations are as follows:
B P C ( t ) = k i P i k ( t ) · x k i ( t )
where P i k ( t ) : Biomass price offered by supplier “i” to hub “k” including delivery at time “t”—(CAD/kg), x k i ( t ) : Biomass order by hub “k” to supplier “i” at time “t”—(kg/month).
Equation (3) captures the fact that purchasing cost of biomass at time “t” is a function of prices offered by suppliers and the corresponding quantities of biomass ordered to hubs.
With quantity discounts, a higher order quantity by a hub will result in a lower price by suppliers. Therefore, suppliers could present a range of biomass prices subject to order quantities. Accordingly, biomass price will be a function of purchase quantity and available supply of biomass. In this sense, Equation (4) represents a biomass pricing strategy based on the quantity discount strategy as:
P i k ( t ) = P i u ( P i u P i l ) x k i ( t ) S i
where P i u : Biomass price of supplier “i” with no discount—(CAD/kg),   P i l : Biomass price of supplier “i” with full discount—(CAD/kg) and S i : Biomass supply capacity of supplier “i”—(kg).
The biomass storage cost is a function of biomass stock level at the hub and holding cost in hub presented by Equation (5):
B S H ( t ) = k S H k ( T ) · L k
where S H k ( T ) : Biomass stock level at hub “k” at time “t”—(kg) and L k : Holding cost at hub “k” per unit of time—(CAD/kg).
The biomass distribution cost to communities is presented in Equation (6) as a function of the biomass delivery ratio to the communities and biomass price offered by hubs.
B D C ( t ) = k j R k j ( t ) · y j k ( t )
where R k j ( t ) : Biomass price offered by hub “k” to community “j” including delivery at time “t”—(CAD/kg) and y j k ( t ) : Biomass order by community “j” to hub “k” at time “t”—(kg/month).
The price offered by hubs to communities is calculated through Equation (7) under a quantity discount strategy.
R k j ( t ) = R k u ( R k u R k l ) · y j k ( t ) H k
where R k u : Biomass price of hub “k” (including delivery) without discount (CAD/kg), R k l : Biomass price of hub “k” (including delivery) with full discount (CAD/kg), and H k : Capacity of hub “k”—(kg).
As a result of pricing mechanisms presented in Equations (4) and (7), the functions presented by Equations (3) and (6) will be convex in x k i ( t ) and y j k ( t ) , respectively. Thus, the objective function of the optimization problem (Equation (1)) will be convex in x k i ( t ) and y j k ( t ) .
The storage cost of inventories at communities is a function of inventory level and unit holding cost as per Equation (8):
B S C ( t ) = j S I j ( t ) · G j
where S I j ( t ) : Biomass stock level at community “j” at time “t”—(kg) and G j : Holding cost at community “j” per unit of time—(CAD/kg).
Finally, Equations (9)–(13) represent the cost of energy conversion, which consists of biomass-to-electricity conversion cost (Equation (9)) and fossil-based energy generation cost (Equation (11)) as follows:
B C C ( t ) = j B j ( t ) · γ j
where
B j ( t ) = z j ( t ) · β j · ε j
and B j ( t ) : Electricity production from biomass at time “t”—(kWh/month), γ j : Levelized biomass to electricity conversion cost—(CAD/kWh), z j ( t ) : Biomass use for electricity production at community “j” at time “t”—(kg/month), β j : Biomass conversion ratio in community “j” (kWh/kg), and ε j : Loading factor of biomass electricity generation facility at community “j”—().
As in case of off-grid communities, the dominant fuel for electricity generation is diesel [41] the cost of generating fossil-based energy (as the alternative to biomass) is the function of the diesel facility’s energy output and the levelized cost of energy generation from diesel (Equation (12)). This diesel-based energy output complements biomass in meeting the energy demand of the communities (Equation (13)):
F E C ( t ) = j f j ( t ) .
where
f j ( t ) = F j ( t ) · δ j
and
F j ( t ) = D j ( t ) B j ( t )
where f j ( t ) : Electricity production cost from fossil fuel at time “t”—(CAD/month), F j ( t ) : Electricity production from fossil fuel at time “t—(kWh/month), δ j : Levelized electricity generation cost from diesel—(CAD/kWh), and D j ( t ) : Electricity demand in community “j” at time “t”—(kWh/month).
On that basis, the cumulative cost of hubs consists of biomass purchasing cost and biomass storage cost (Equations (14) and (15)):
V ( T ) = t = 0 T v ( t )
where
v ( t ) = B P C ( t ) + B S H ( t )
and V ( T ) : Cumulative cost of hubs at time “t”—(CAD) and v ( t ) : Cost of hubs at time “t”—(CAD/month).
The cumulative cost of communities consists of biomass distribution cost to communities and their storage cost as well as cost of energy generation from biomass and fossil fuels calculated through Equations (16) and (17):
W ( T ) = t = 0 T w ( t )
where
w ( t ) = B D C ( t ) + B S C ( t ) + B C C ( t ) + F E C ( t )
and W ( T ) : Cumulative cost of communities at time “t”—(CAD) and w ( t ) : Cost of communities at time “t”—(CAD/month).

3.3.2. Objective Function for Cost Sharing Scenario

Under cost-sharing coordination strategy, the objective function is calculated similar to that of the quantity discount scenario (Equation (1)). However, the amount of cost shared is incorporated into the corresponding players’ costs. In this sense, the total cost of biomass ( c ( t ) ) under cost sharing strategy is calculated as follows:
c ( t ) = v ( t ) + w ( t ) + H C S ( t )
where H C S ( t ) : Hubs’ cost shared with suppliers at time “t”—(CAD/month).
The cost amount shared with hubs is deducted from the communities’ overall cost and added to hubs’ overall cost. Similarly, the amount of shared cost with the suppliers is subtracted from the cost of hubs. Accordingly, the cost of hubs and communities are presented in Equations (19) and (20), respectively:
v ( t ) = B P C ( t ) + B S H ( t ) + C S H ( t ) H C S ( t )
and
w ( t ) = B D C ( t ) + B S C ( t ) + B C C ( t ) + F E C ( t ) C S H ( t )
where C S H ( t ) : Communities’ cost shared with hubs at time “t”—(CAD/month).
Under a cost-sharing strategy, large collective order quantities are encouraged by sharing a portion of increasing costs (relative to the extent of the order) between the supply chain players. In this sense, the entity that creates more capacities can gain incentive (as a saving) by sharing the portion of its costs with the rewarding player [18]. In this regard, the suppliers and hubs in this study offer to pay for the portion of the subsequent player’s cost to induce them to order larger biomass quantities. There will be an upper limit for cost-sharing that reflects the capacities of rewarding players in offering such an incentive formulated in form of a ratio ranging between zero and one. This ratio reflects the maximum fraction of cost that could be shared at each level of supply chain and is calculated endogenously as a variable of the model while minimizing the total collective cost of supply chain (Equation (1)).
According to the above discussion, the portion of communities (end-users) cost that could be shared with each hub (i.e., hubs reward the communities to generate larger amount of bioenergy and thus purchase more biomass) is represented through Equation (21):
C S H ( t ) = ( B D C ( t ) + B S C ( t ) + B C C ( t ) + F E C ( t ) ) · α j k ( t )
where
α j k ( t ) = ( y j k ( t ) H k ) · α j k m ( t )
and
0 α j k m ( t ) 1
where α j k ( t ) : Cost sharing ratio of Community “j” with hub “k” at time “t”—() and α j k m ( t ) : Maximum cost sharing ratio of community “j” with hub “k”—().
In the cost sharing coordination scenario, the hubs offer a fixed price to communities. Accordingly, biomass distribution cost to communities is calculated as follows:
B D C ( t ) = k j ( R k u · y j k ( t ) )
Now turning to hubs-suppliers cost sharing, Equation (25) calculates the amount of cost that hubs could share with suppliers, as an incentive from suppliers to hubs in order to encourage larger purchases:
H C S ( t ) = ( B P C ( t ) + B S H ( t ) ) · α k i ( t )
where
α k i ( t ) = ( x k i ( t ) S i ) · α k i m ( t )
and
0 α k i m ( t ) 1
where α k i ( t ) : Cost sharing ratio of hub “k” with supplier “i” at time “t”—() and α k i m ( t ) : Maximum cost sharing ratio of hub “k” with supplier “i”—().
Note that in the cost-sharing scenario, there is a fixed price for biomass. In this regard, the biomass purchase cost is presented by Equation (28):
B P C ( t ) = k i ( P i u · x k i ( t ) )

3.3.3. Model Constraints

In the sequel, the model constraints are presented.
Biomass supply constraint, Equation (29) dictates that the total biomass quantity purchase from each supply source at time “t” is bounded by the availability biomass at suppliers:
0 k = 1 K x k i ( t ) S i
Similarly, the biomass quantity that each hub could distribute is bounded by its available biomass stock (Equation (30)):
j = 1 J y j k ( t ) S H k ( t )
Additionally, as stated by (Equation (31)), for a particular hub (k), the biomass quantity transported from all supply sources to the hub at time “t“ plus the available biomass stock at the hub should not exceed the storage capacity of the hub. Equation (32) also expresses the balance between the storage at each hub and the deliveries from and to it:
0 i = 1 I x k i ( t ) + S H k ( t 1 ) H k
S H k ( t 1 ) + i = 1 I x k i ( t ) = S H k ( t ) + j = 1 J y j k ( t )
Similarly, community’s storage constraint (Equation (33)) represents the bound on the biomass quantity that can be delivered to a community in line with its available storage capacity. In this sense, biomass conversion for energy production will also be bounded by the availability of biomass at the community’s storage (Equation (34)):
0 j = 1 J y j k ( t ) I j + S I j ( t 1 )
0 z j ( t ) S I j ( t )
Equation (35) captures the relationship between energy conversion and demand at communities as the combined amount of generated bioenergy and fossil-based energy at a community shall meet the energy (electricity) demand:
D j ( t ) = F j ( t ) + B j ( t )
Biomass conversion facility capacity constraint reflects the fact that the actual production output of the facility is bounded by its maximum nominal capacity (Equation (36)):
0 B j ( t ) t s j · E j · ε j
where t s j :ratio of working hours (uptime) of the biomass conversion facility at any time—(h) and E j : Capacity of biomass-to-electricity conversion facility at community “j”—(kW).
In the solution approach, x k i ( t ) and y j k ( t ) are transformed as ratios to hub-supplier and community-hub channel capacities, respectively. This makes the corresponding decision variables values ranging between 0 and 1:
x k i ( t ) = δ k i ( t ) · X k i ( t )
y j k ( t ) = Φ k j ( t ) · Y j k ( t )
where X k i ( t ) : Order capacity to supplier “i” by hub “k” at time “t”—(kg/month), Y j k ( t ) : Order capacity to hub “k” by community “j” at time “t”—(kg/month), and decision variables of δ k i ( t ) : Order ratio to supplier “i” by hub “k” at time “t” and Φ k j ( t ) : Order ratio to hub “k” by community “j” at time “t”:
0     δ k i ( t )     1
0     Φ k j ( t )     1
In addition to the above-described formulas, a full list of these equations as implemented in Vensim model is presented in the Appendix A.

4. Case Study and Results

In this section, to show the applicability of the proposed models and the impact of coordination strategies, we consider a real case study. This will be followed by analysis of the results with respect to certain characteristics and assumptions in the proposed models. We then turn to interpretation of the impact of alternative coordination strategies of quantity discounts and cost sharing. Additionally, sensitivity analysis is conducted to investigate the parameters variations on the results of each scenario. On that basis, further insights will be provided by comparing the results obtained under these strategies with respect to cost efficiency gains and the level of biomass by the communities.

4.1. Case Study

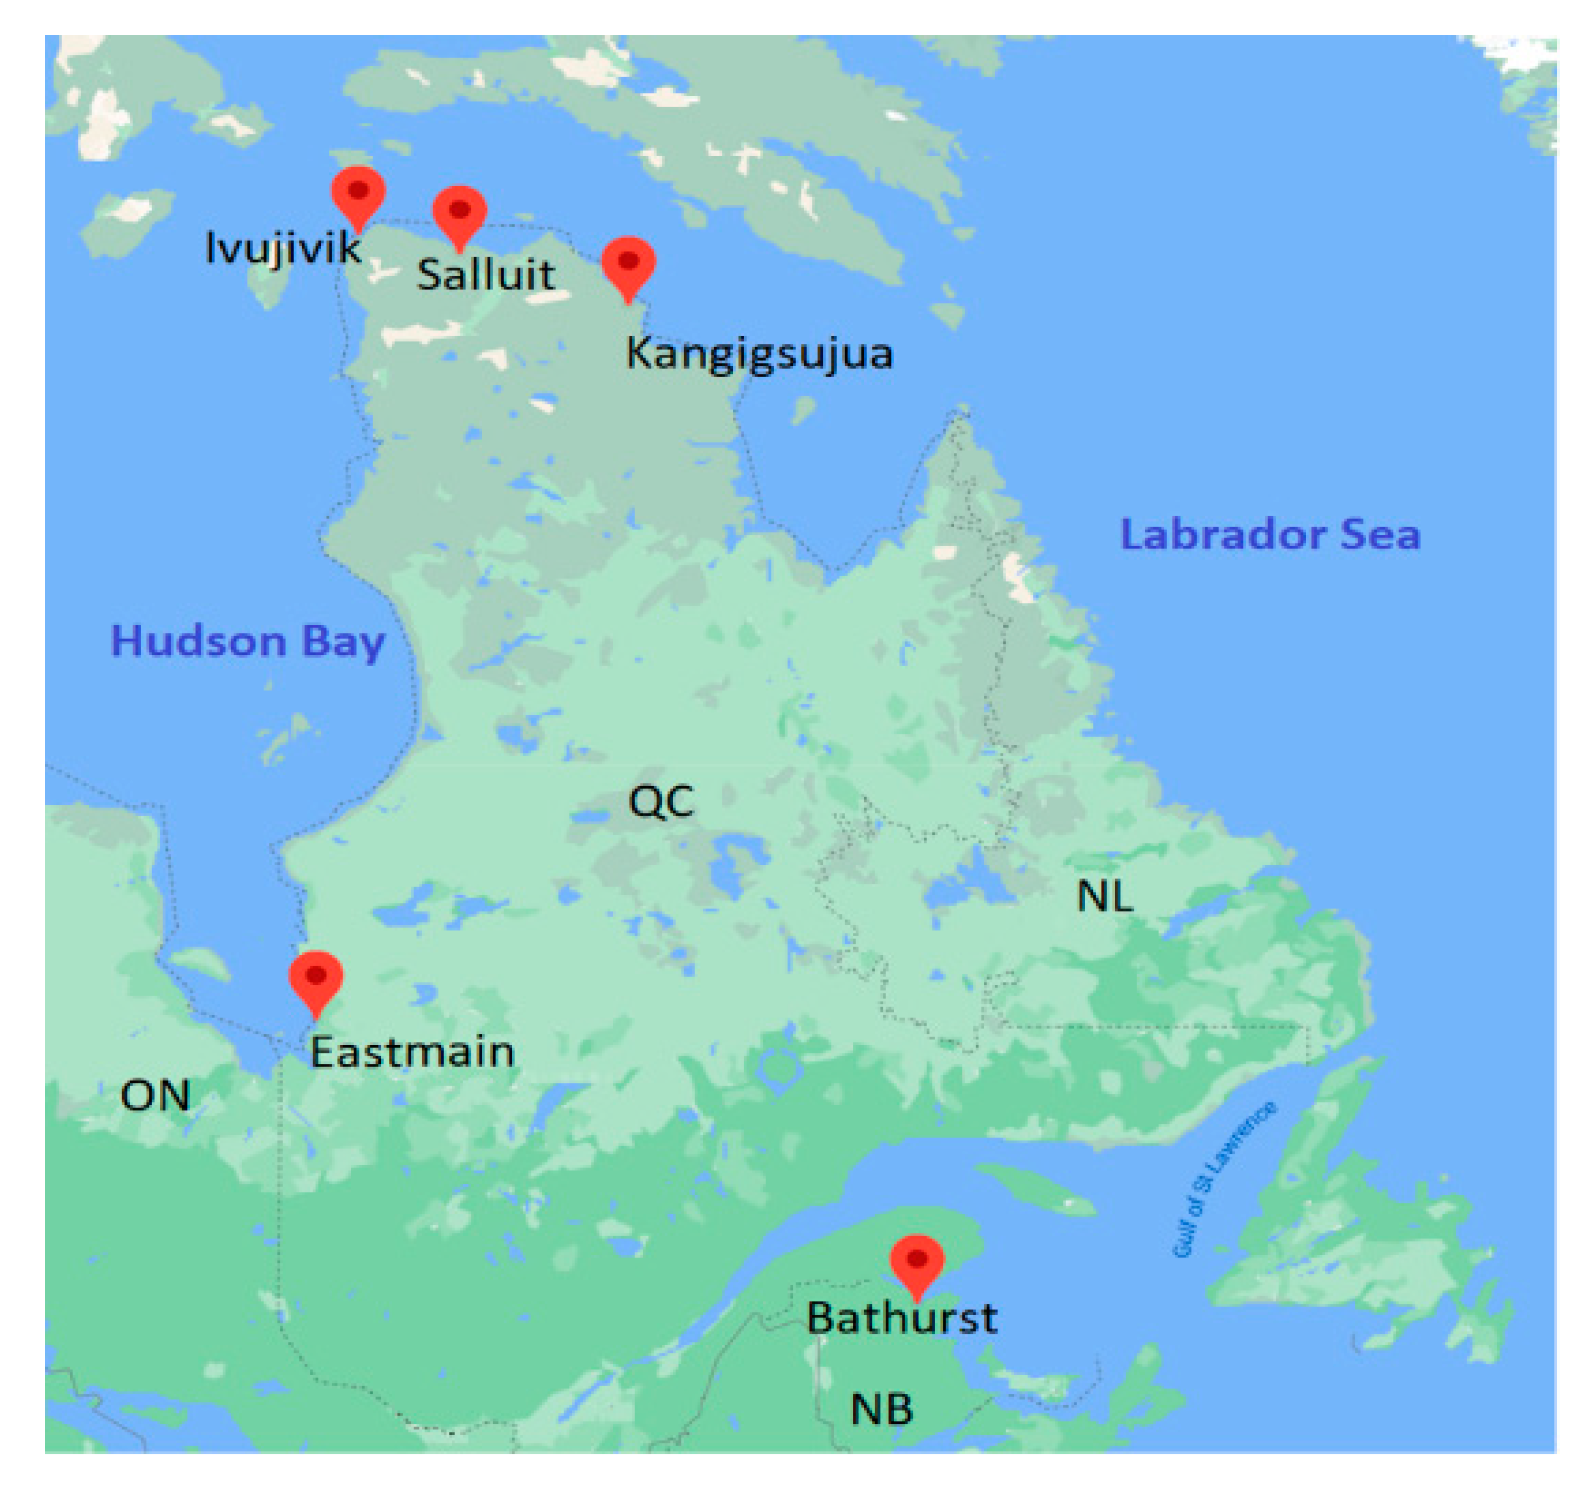
The case study contains three remote and off-grid communities in the north of Canada as electricity end-users, which are Kangigsujuaq (KA), Salluit (SA), and Ivujivik (IV) in the north of Quebec. Off-grid diesel facilities currently produce electricity. The biomass type is assumed as wood pellet, which can only be supplied to communities by waterways (Figure 7). The communities have small economies of scale because of their size and remoteness. The case study considers two hubs to supply wood pellet to communities and receiving biomass from six suppliers. The first hub is in Eastmain in the west of Quebec (QC), supplied by three suppliers in the provinces of QC, NB, and the state of Maine. The second hub is in Bathurst in the northeast of New Brunswick and could order biomass to three suppliers in QC (QC1, QC2, and QC3). Considering one month time step in the model, it is assumed that the hubs can receive the orders during the time between April (t = 3) and August (t = 7), and the delivery time to communities is from April (t = 3) until the end of September. The data used in this study are derived from [7] and provided in the Appendix A.

4.2. Results Analysis

Vensim optimization platform employs a Powell hill-climbing algorithm [42] to search for the optimal schedule of the variables. We consider a time horizon of 12 months to reflect on the seasonality effects with respect to biomass supply and local climate. Minimizing the total collective cost of biomass supply chain subject to constraints presented by Equations (31)–(38) will result in search for optimal decisions on the delivery schedule of biomass, offered prices, and cost-sharing ratios leading to biomass and diesel conversion facilities’ operational plans as well as inventory levels at hubs and communities. The simulation based-optimization cycle will be conducted over the time horizon. Figure 8, Figure 9, Figure 10, Figure 11, Figure 12, Figure 13, Figure 14, Figure 15 and Figure 16 show the results of the sequential optimization and simulation processes for a representative supplier, hub, and community.
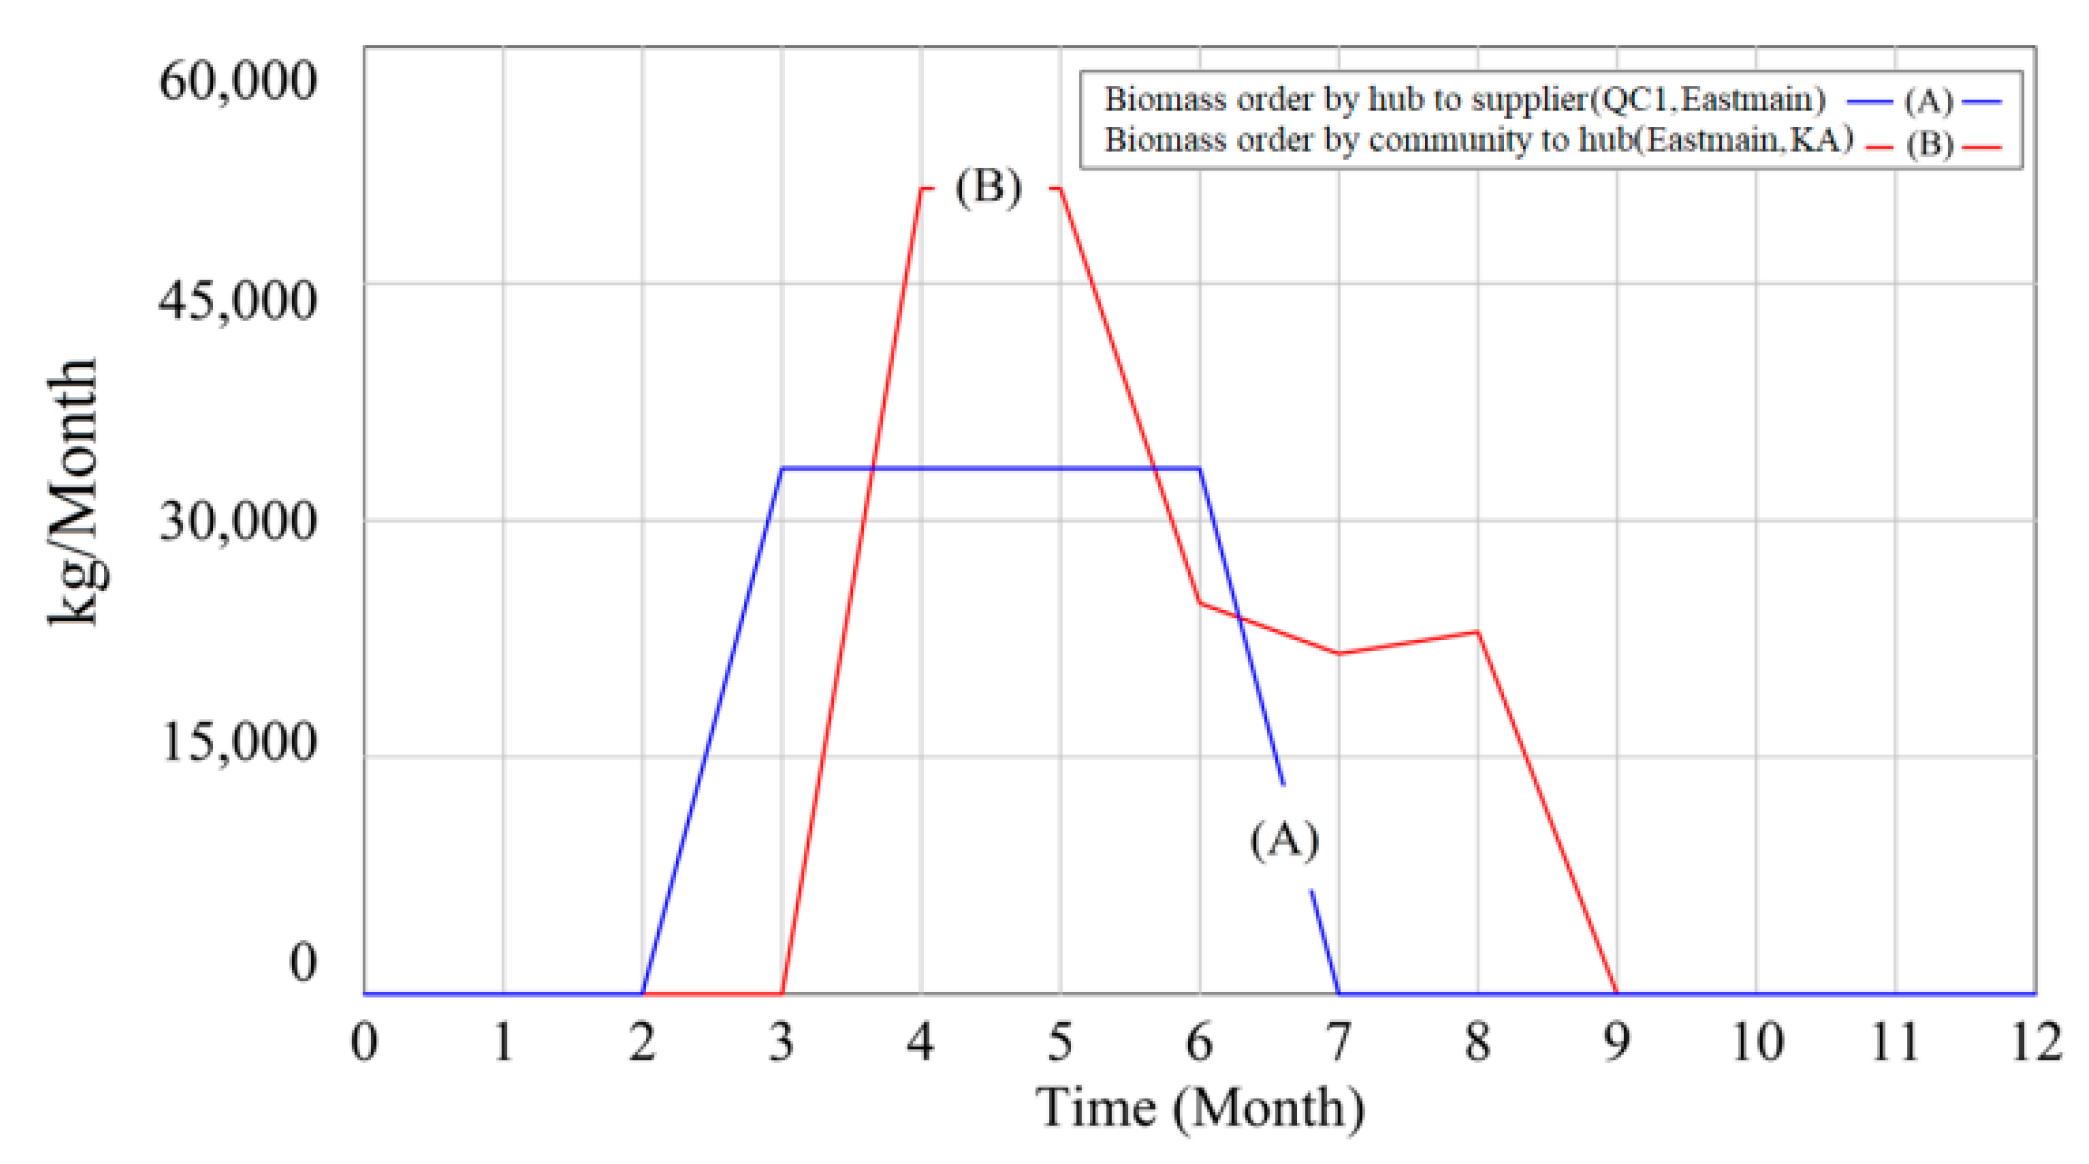
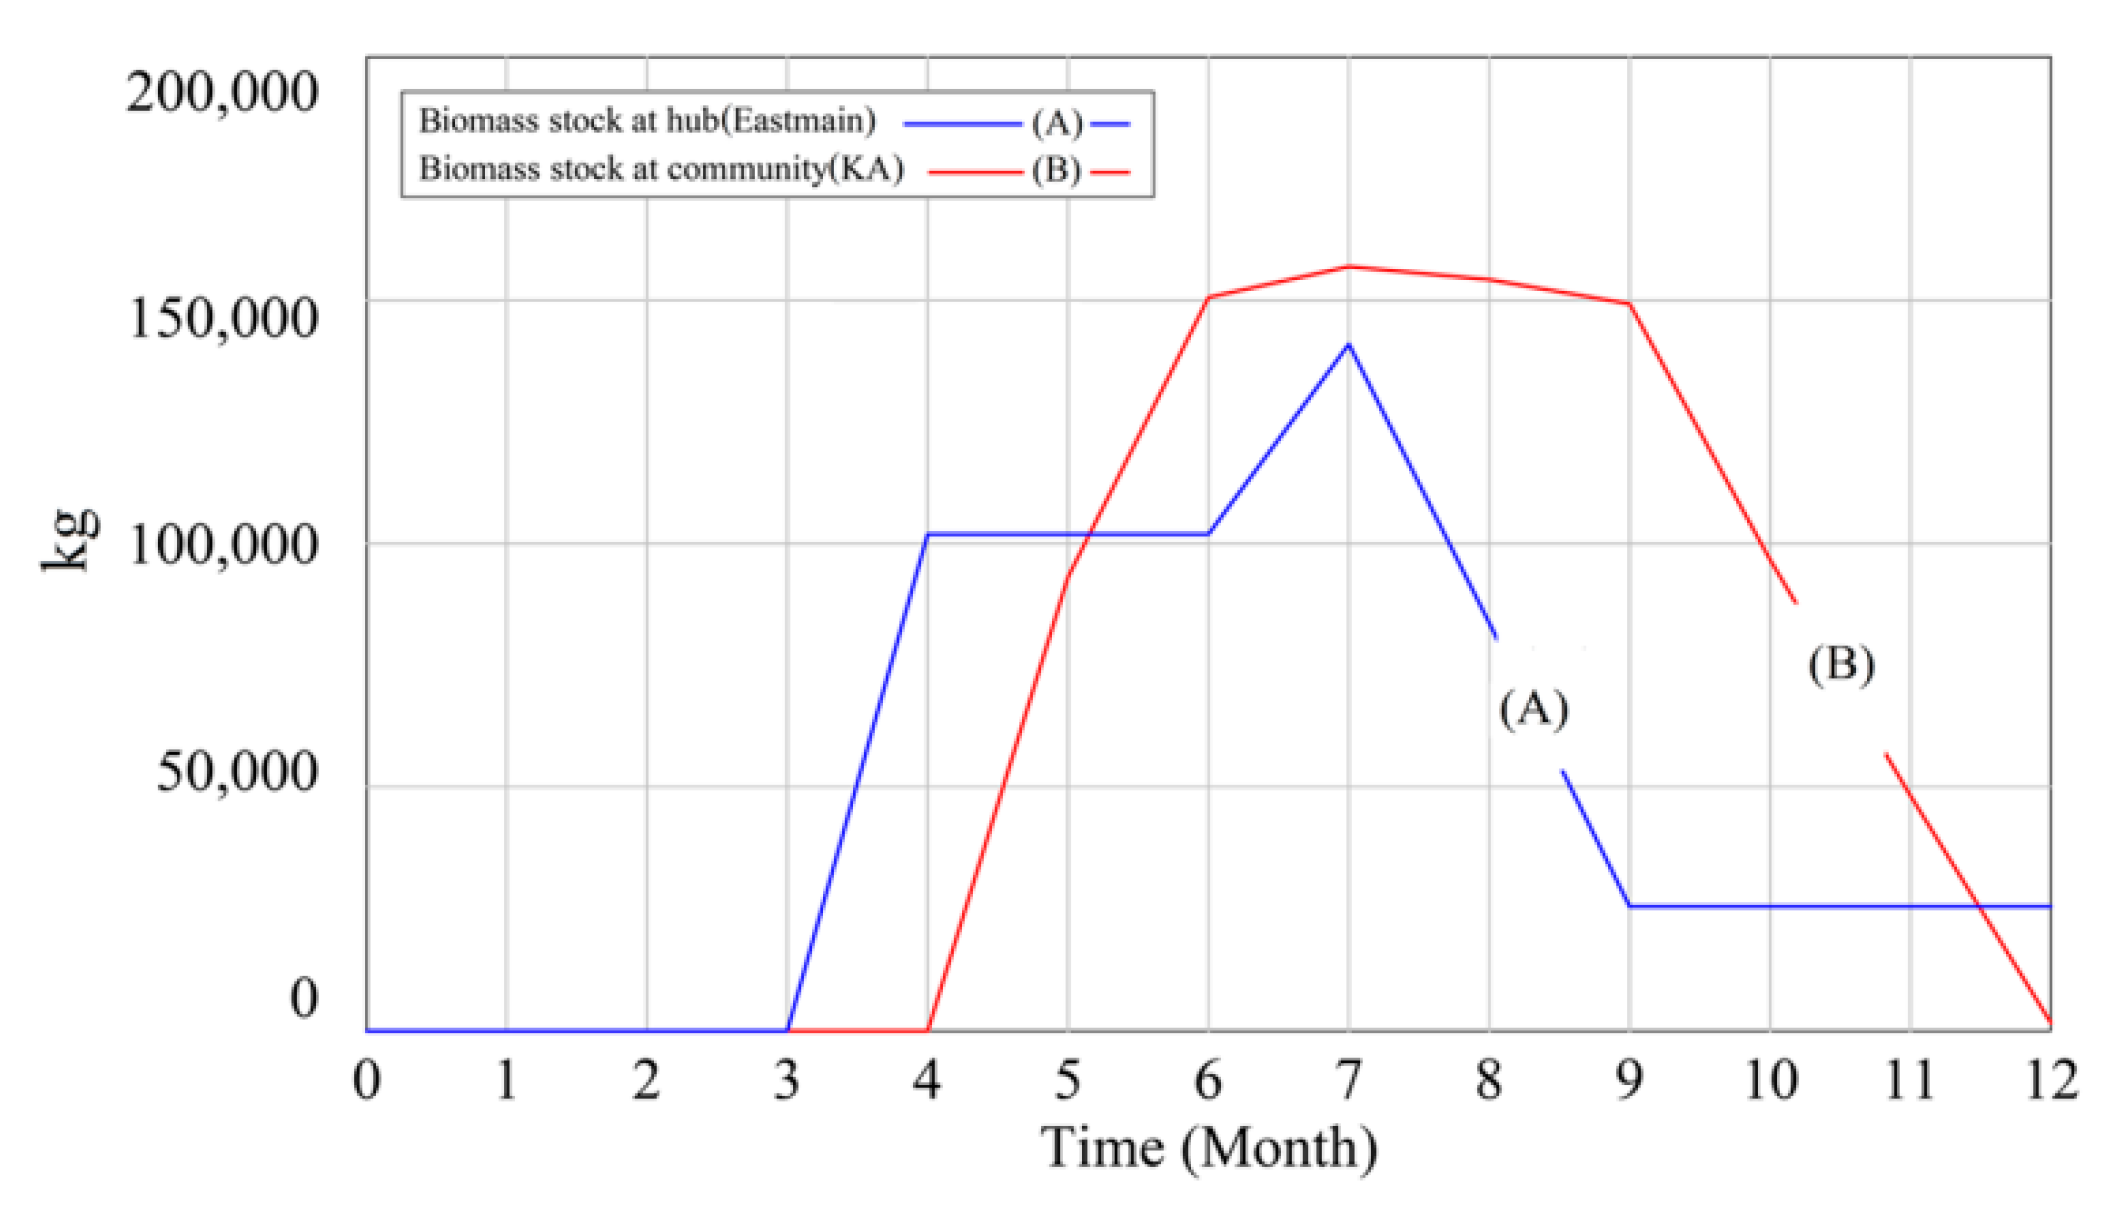
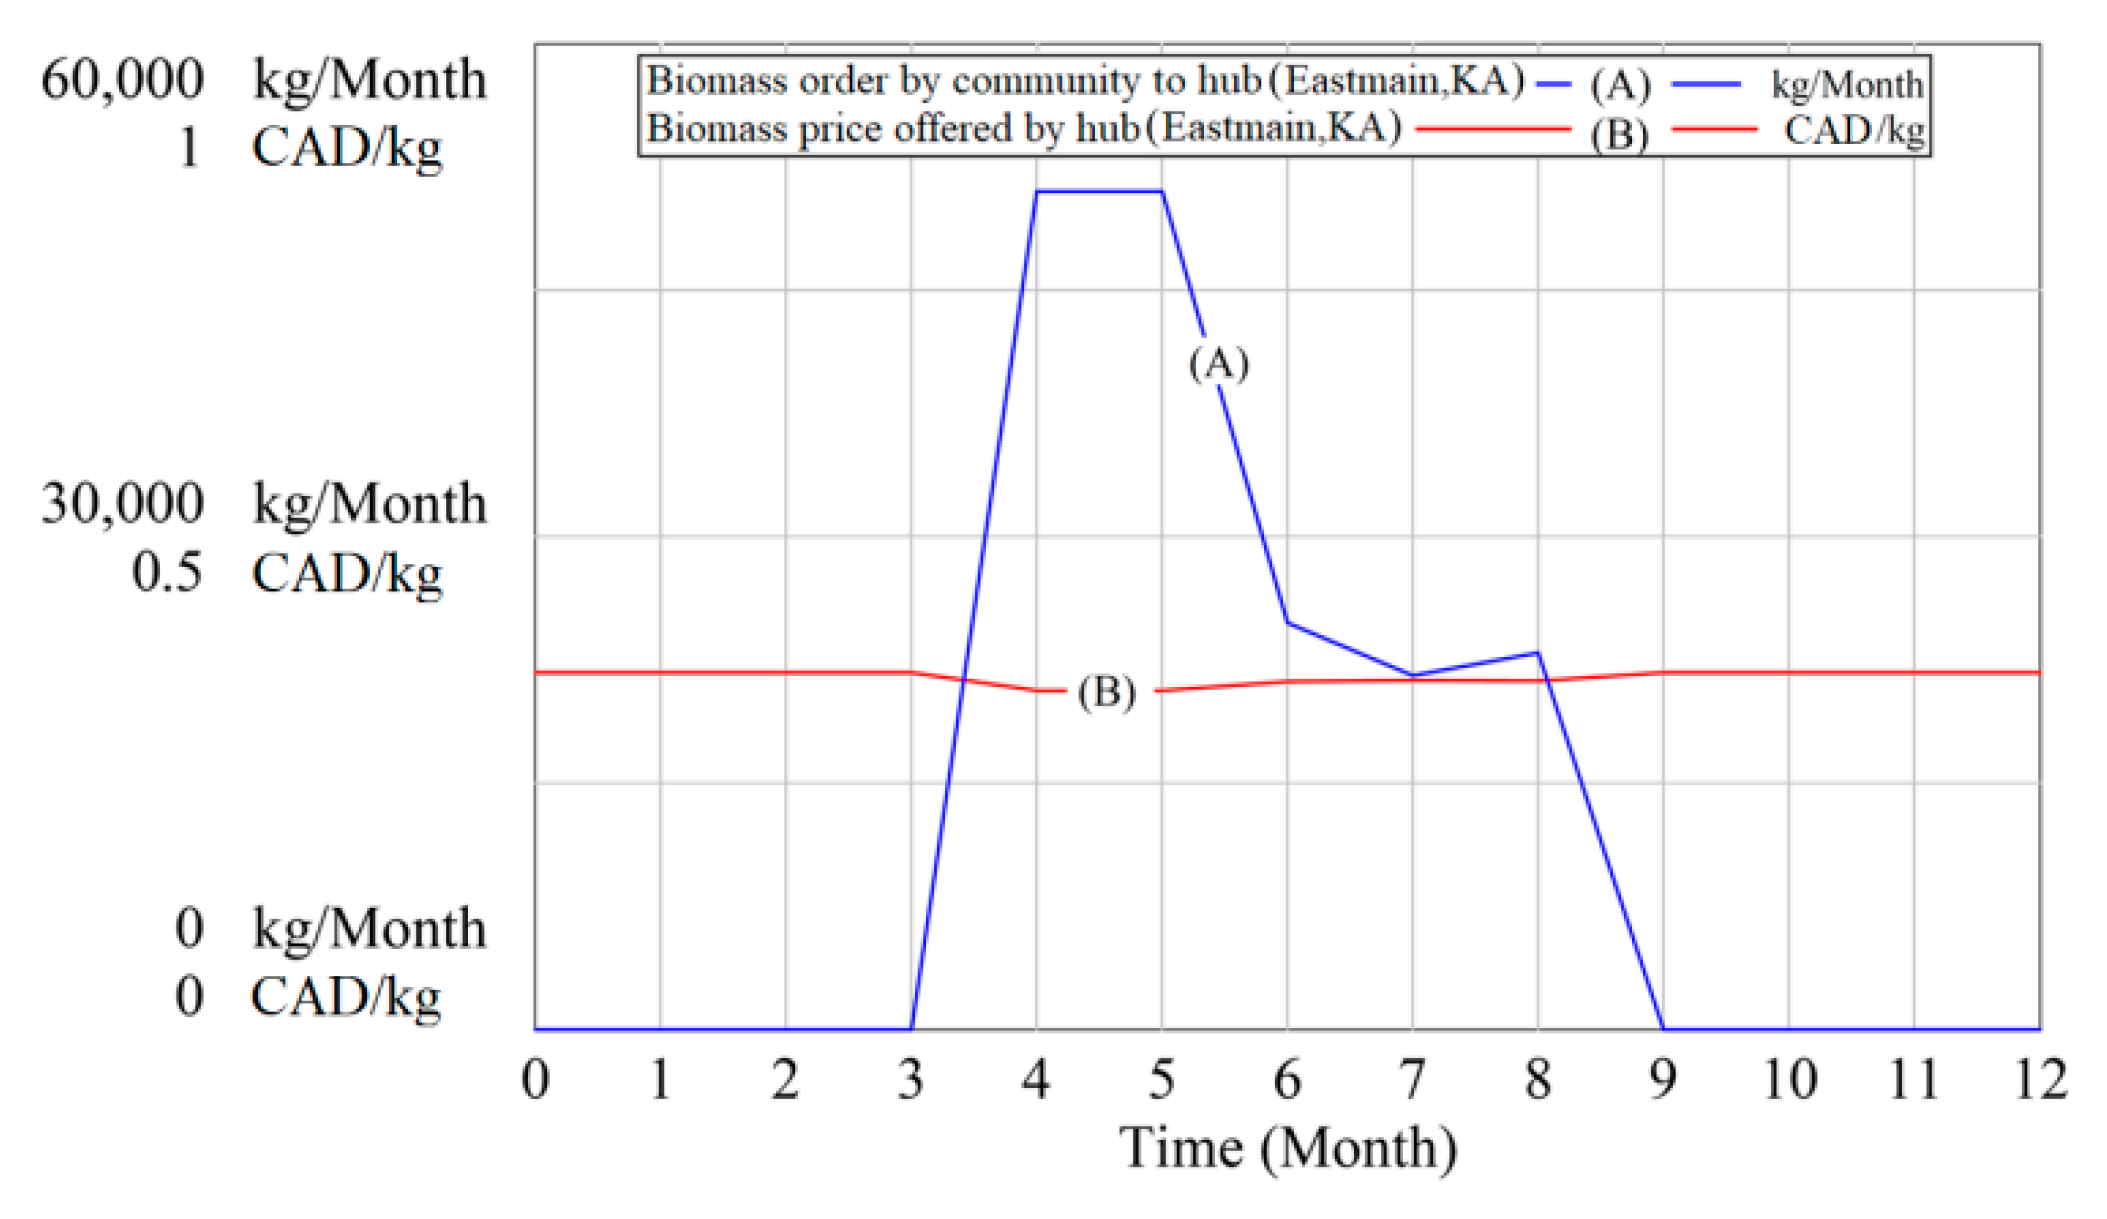
As shown in Figure 8 and Figure 9, biomass stock level starts to increase one month after ordering to suppliers and remain stable at 102,000 kg for two months in the hub, as there is no change in the purchasing and distributing of biomass during this time. The hub inventory level reaches a peak of 141,000 kg due to a reduction in biomass delivery to communities for certain periods of time. This reduction is the result of limitations caused by storage and energy conversion capacities. As depicted by Figure 8 and Figure 9, the delivery ratio to the community is affected by stock levels at hubs as well as community inventory. The community starts ordering from the hub once at t = 3 when there is biomass availability at the hub. This order increases to a maximum of 50,000 kg, at which we approach the capacity limitations. Consequently, the community inventory experiences a reduction with reduced deliveries to communities and hubs starting at t = 7.
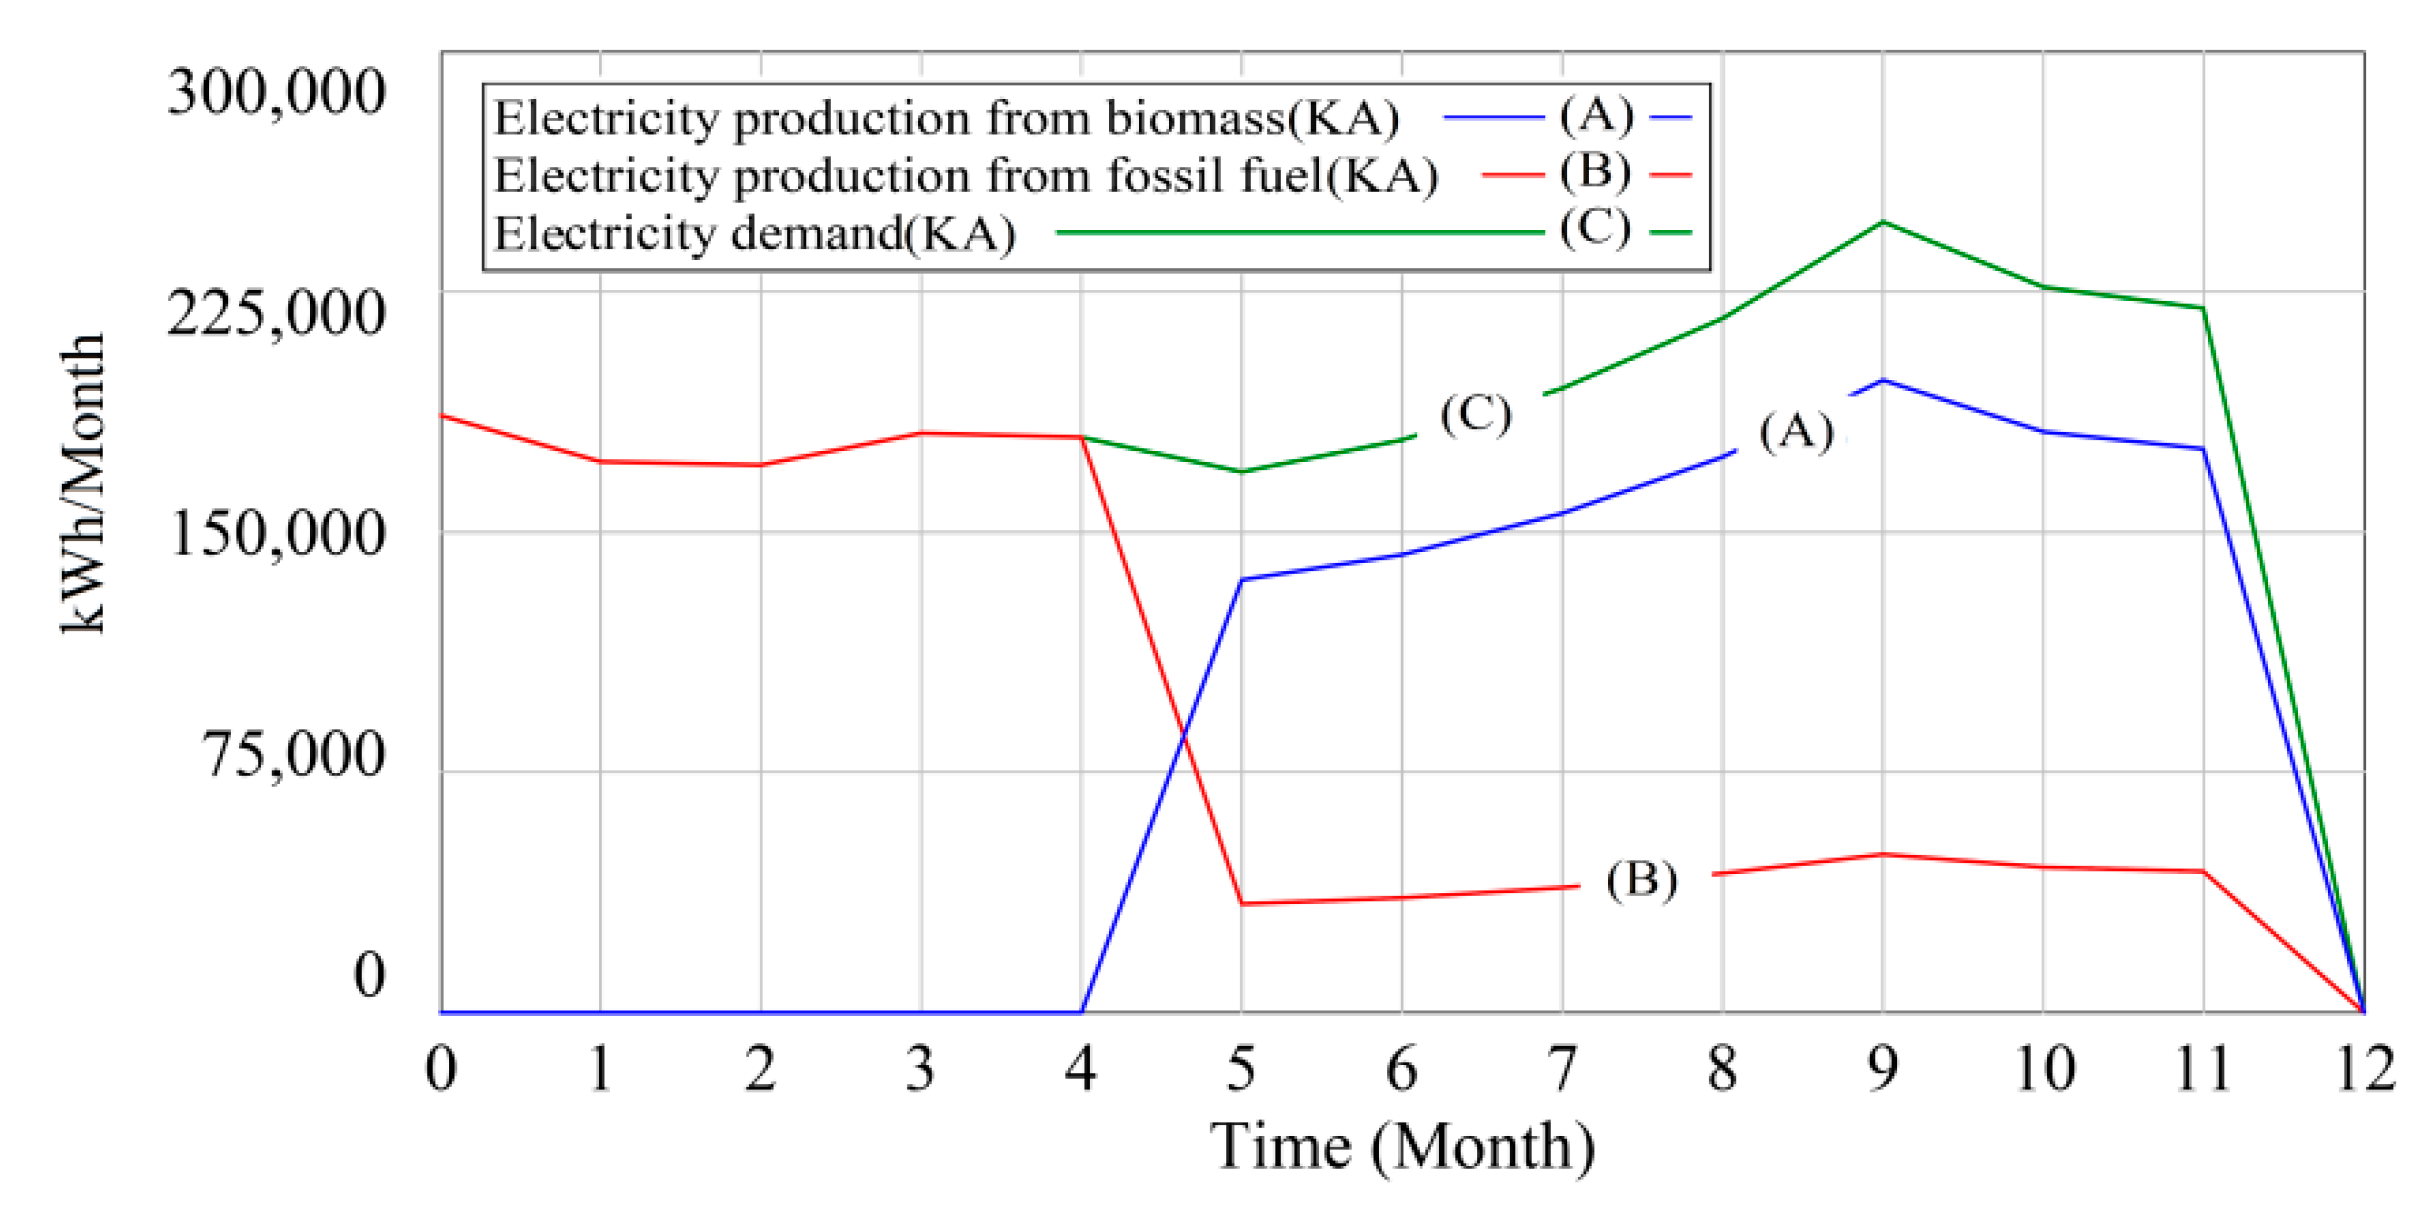
According to results presented in Figure 10 and Figure 11, as soon as the community establishes a biomass storage, the biomass utilization ratio at the community and electricity production by biomass conversion facility are increased peaking at 52,532 kg and 197,520 kwh at the peak demand time (t = 9), respectively. At this time, the community reaches a 4 to 1 ratio for biomass and fossil fuel conversion facilities’ utilization.
According to Figure 13, a hub benefits from a discounted price if it orders more from suppliers. Once a steady flow of order is established, the discounted price reaches an equilibrium level. Figure 14 reveals the optimal price and order quantity for communities. It is recognized that a community is also motivated to order larger quantities of biomass to benefit from a discounted price subject to constraints on storage and energy demand.
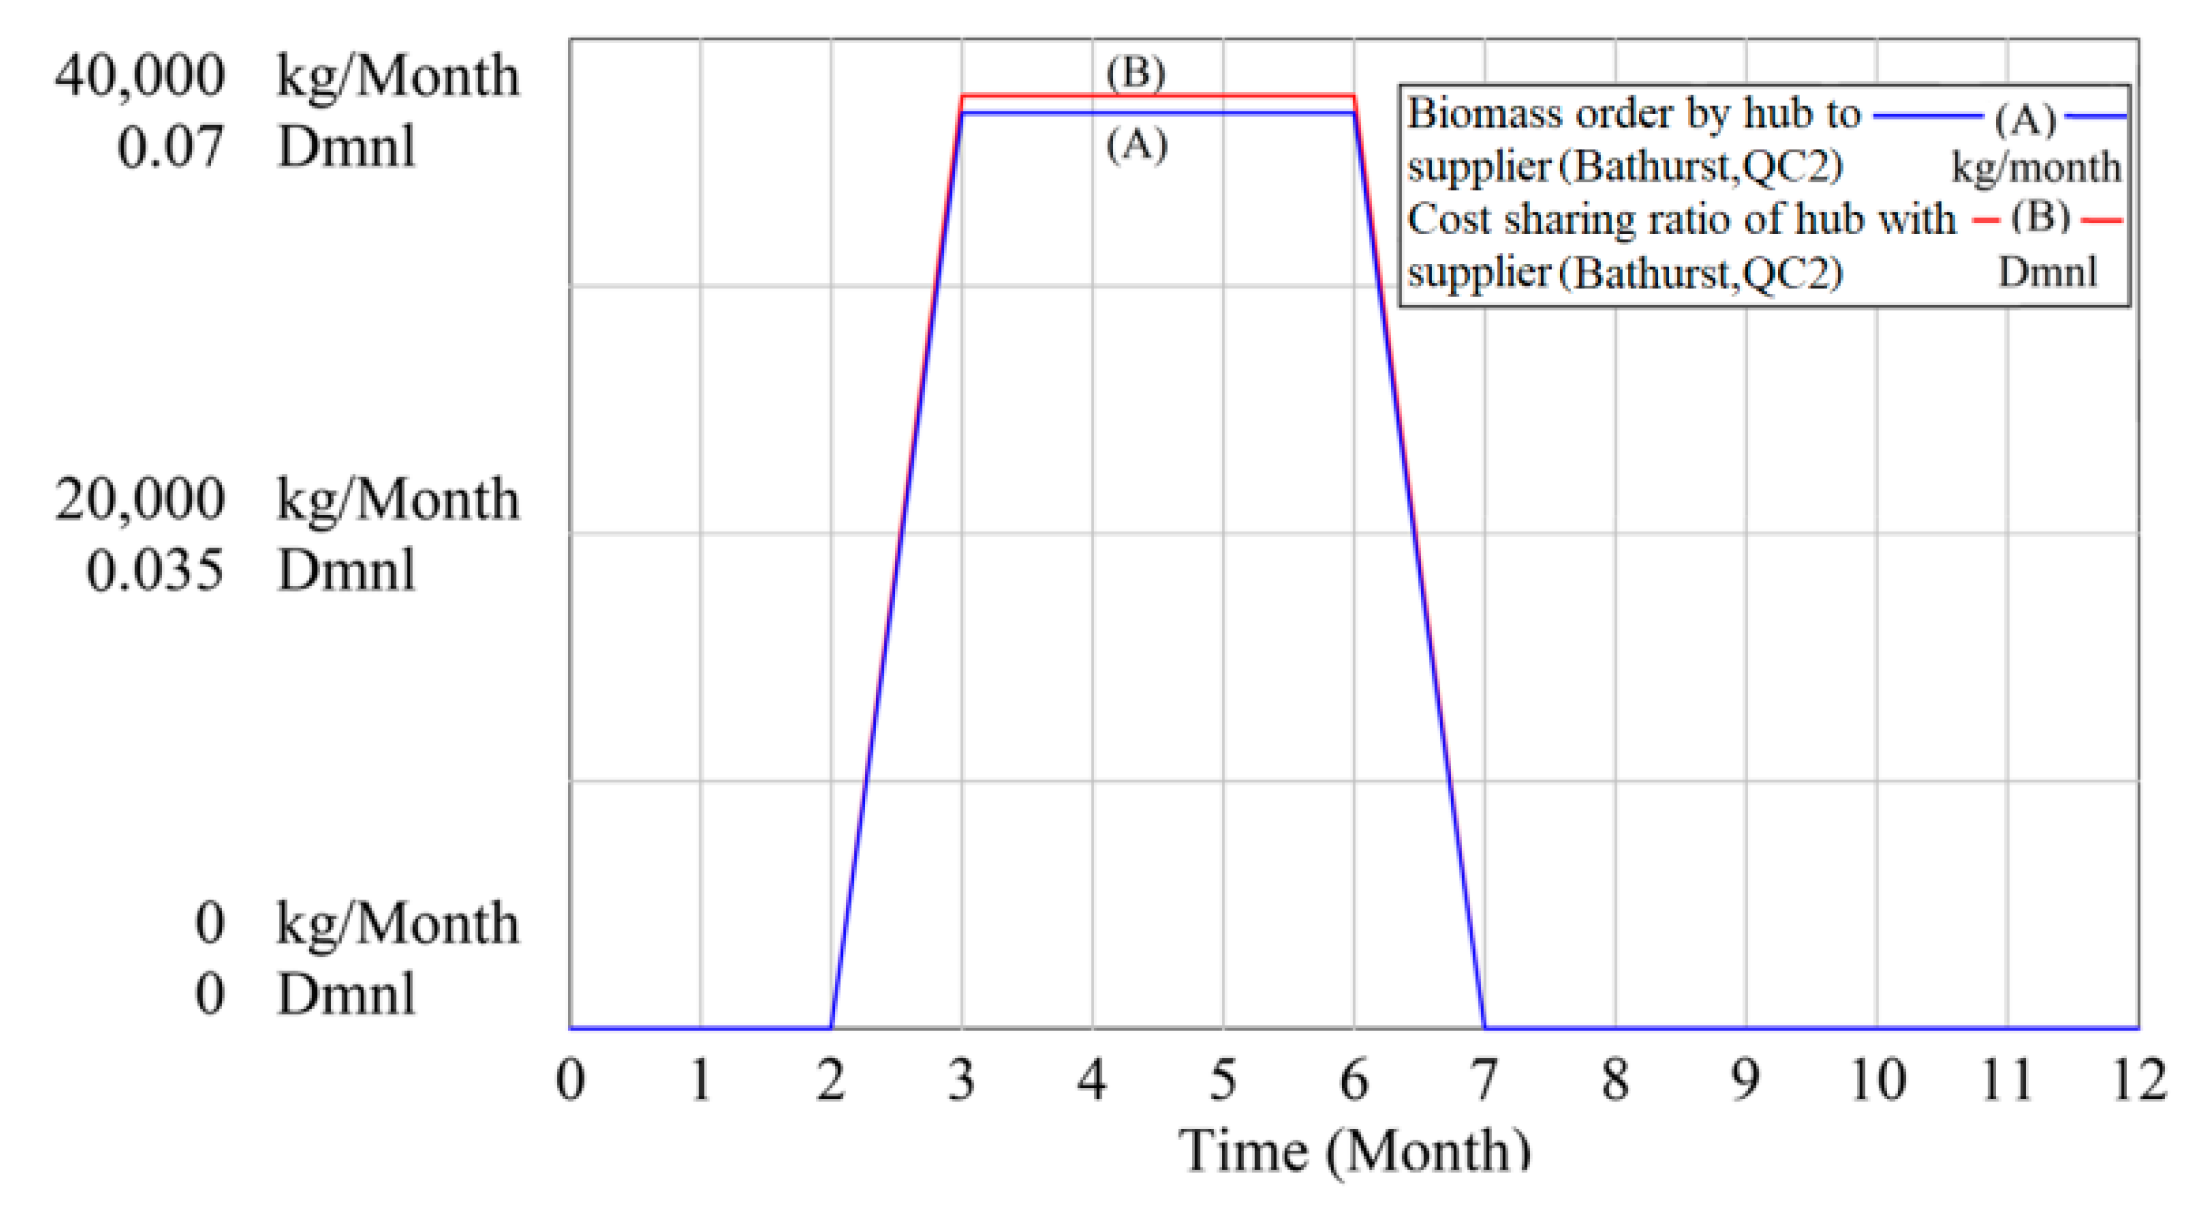
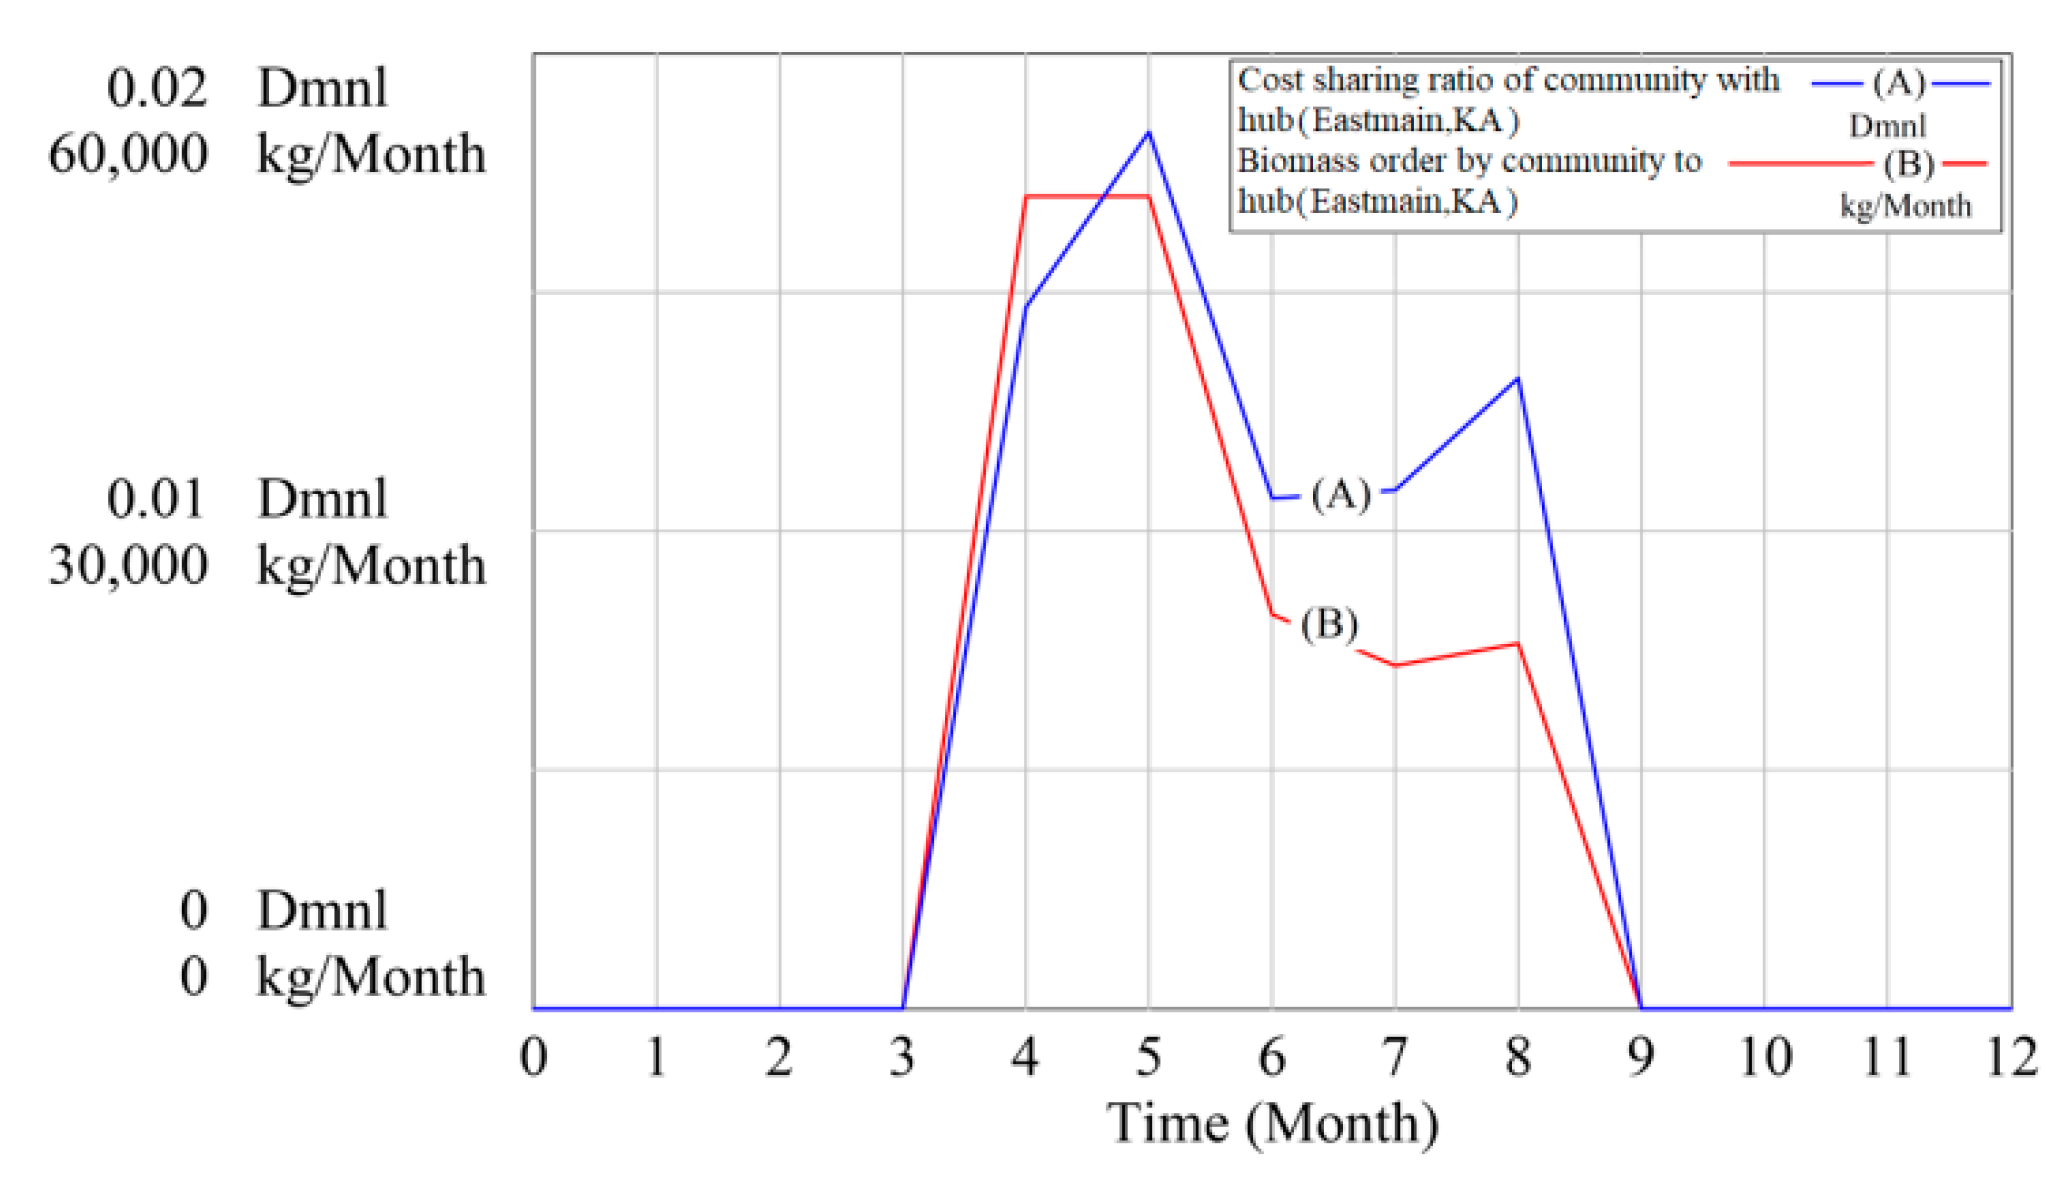
As depicted in Figure 15 and Figure 16, a supplier compensates a portion of a hub’s cost. Subsequently, a hub compensates a portion of a community’s cost. The results show that a cost-sharing strategy could encourage the players to order larger quantities subject to constraints on storage capacities. Figure 17 presents that the cumulative cost of hubs increases while the hubs continue to order and hold biomass inventories between t = 3 and t = 7. The cost of hubs reaches a maximum of CAD 178,204 when there is no coordination. It reaches to a maximum of CAD 151,705 in case of quantity discounts strategy and a maximum of CAD 165,092 in case of cost-sharing strategy, showing savings in both coordination cases in comparison with no coordination. In this regard, the quantity discount strategy will be the preferred coordination from hubs’ perspective.
Figure 18 presents that the cumulative cost of communities is not much impacted with or without coordination strategies. However, quantity discount strategy corresponds to the lowest level of cost for communities. The highest cost of communities for quantity discounts, cost-sharing, and no coordination scenario will be CAD 1,486,210, CAD 1,491,360, and CAD 1,496,660, respectively. As such, the communities might also prefer a quantity discount strategy.
As presented in Figure 19, the cumulative discount offered to hubs and the cumulative cost sharing with suppliers reach a maximum of CAD 26,498.4 and CAD 18,410.2, respectively. In this regard, the suppliers’ preference strategy would be cost sharing.

4.3. Sensitivity Analysis and Discussion

In this section, the impact of biomass price and storage capacities on the players’ costs under coordination scenarios are investigated using the Vensim sensitivity analysis platform [40]. This analysis is performed by varying the two mentioned parameters across a range represented by a uniform distribution while the other parameters are kept fixed. The lower and upper limits of variations are based on decreasing and increasing the initial values by 40%.
According to Figure 20, utilizing more expensive or cheaper biomass could impact the cost of hubs and communities positively under both coordination scenarios. The hubs’ cost variation will impact the amount of cost-sharing offered to suppliers as well. The offered discounts are reinforced by biomass price variations. Accordingly, biomass price could play a significant role in performance of coordination scenarios to an extent that changes the players’ preferred choice of coordination strategies. Figure 21 shows that the storage capacities do not have a significant impact on costs of hubs and communities due to biomass supply limitations. In this sense, the players’ costs are more sensitive to biomass price variations than variations in storage capacities.
With varied biomass prices and storage capacities, the players will have different preferences of coordination strategies. The size of communities and the number of players at each level could impact the extent of the competition and change the results. In this sense, the coordination strategies are compared under the following scenarios:
  • Opting for more expensive or cheaper biomass types: to investigate the impact of such scenarios, upper and lower bounds of biomass price (price with full discount and price without discount) are increased up to 40% and then decreased up to 60% while other parameters are kept fixed.
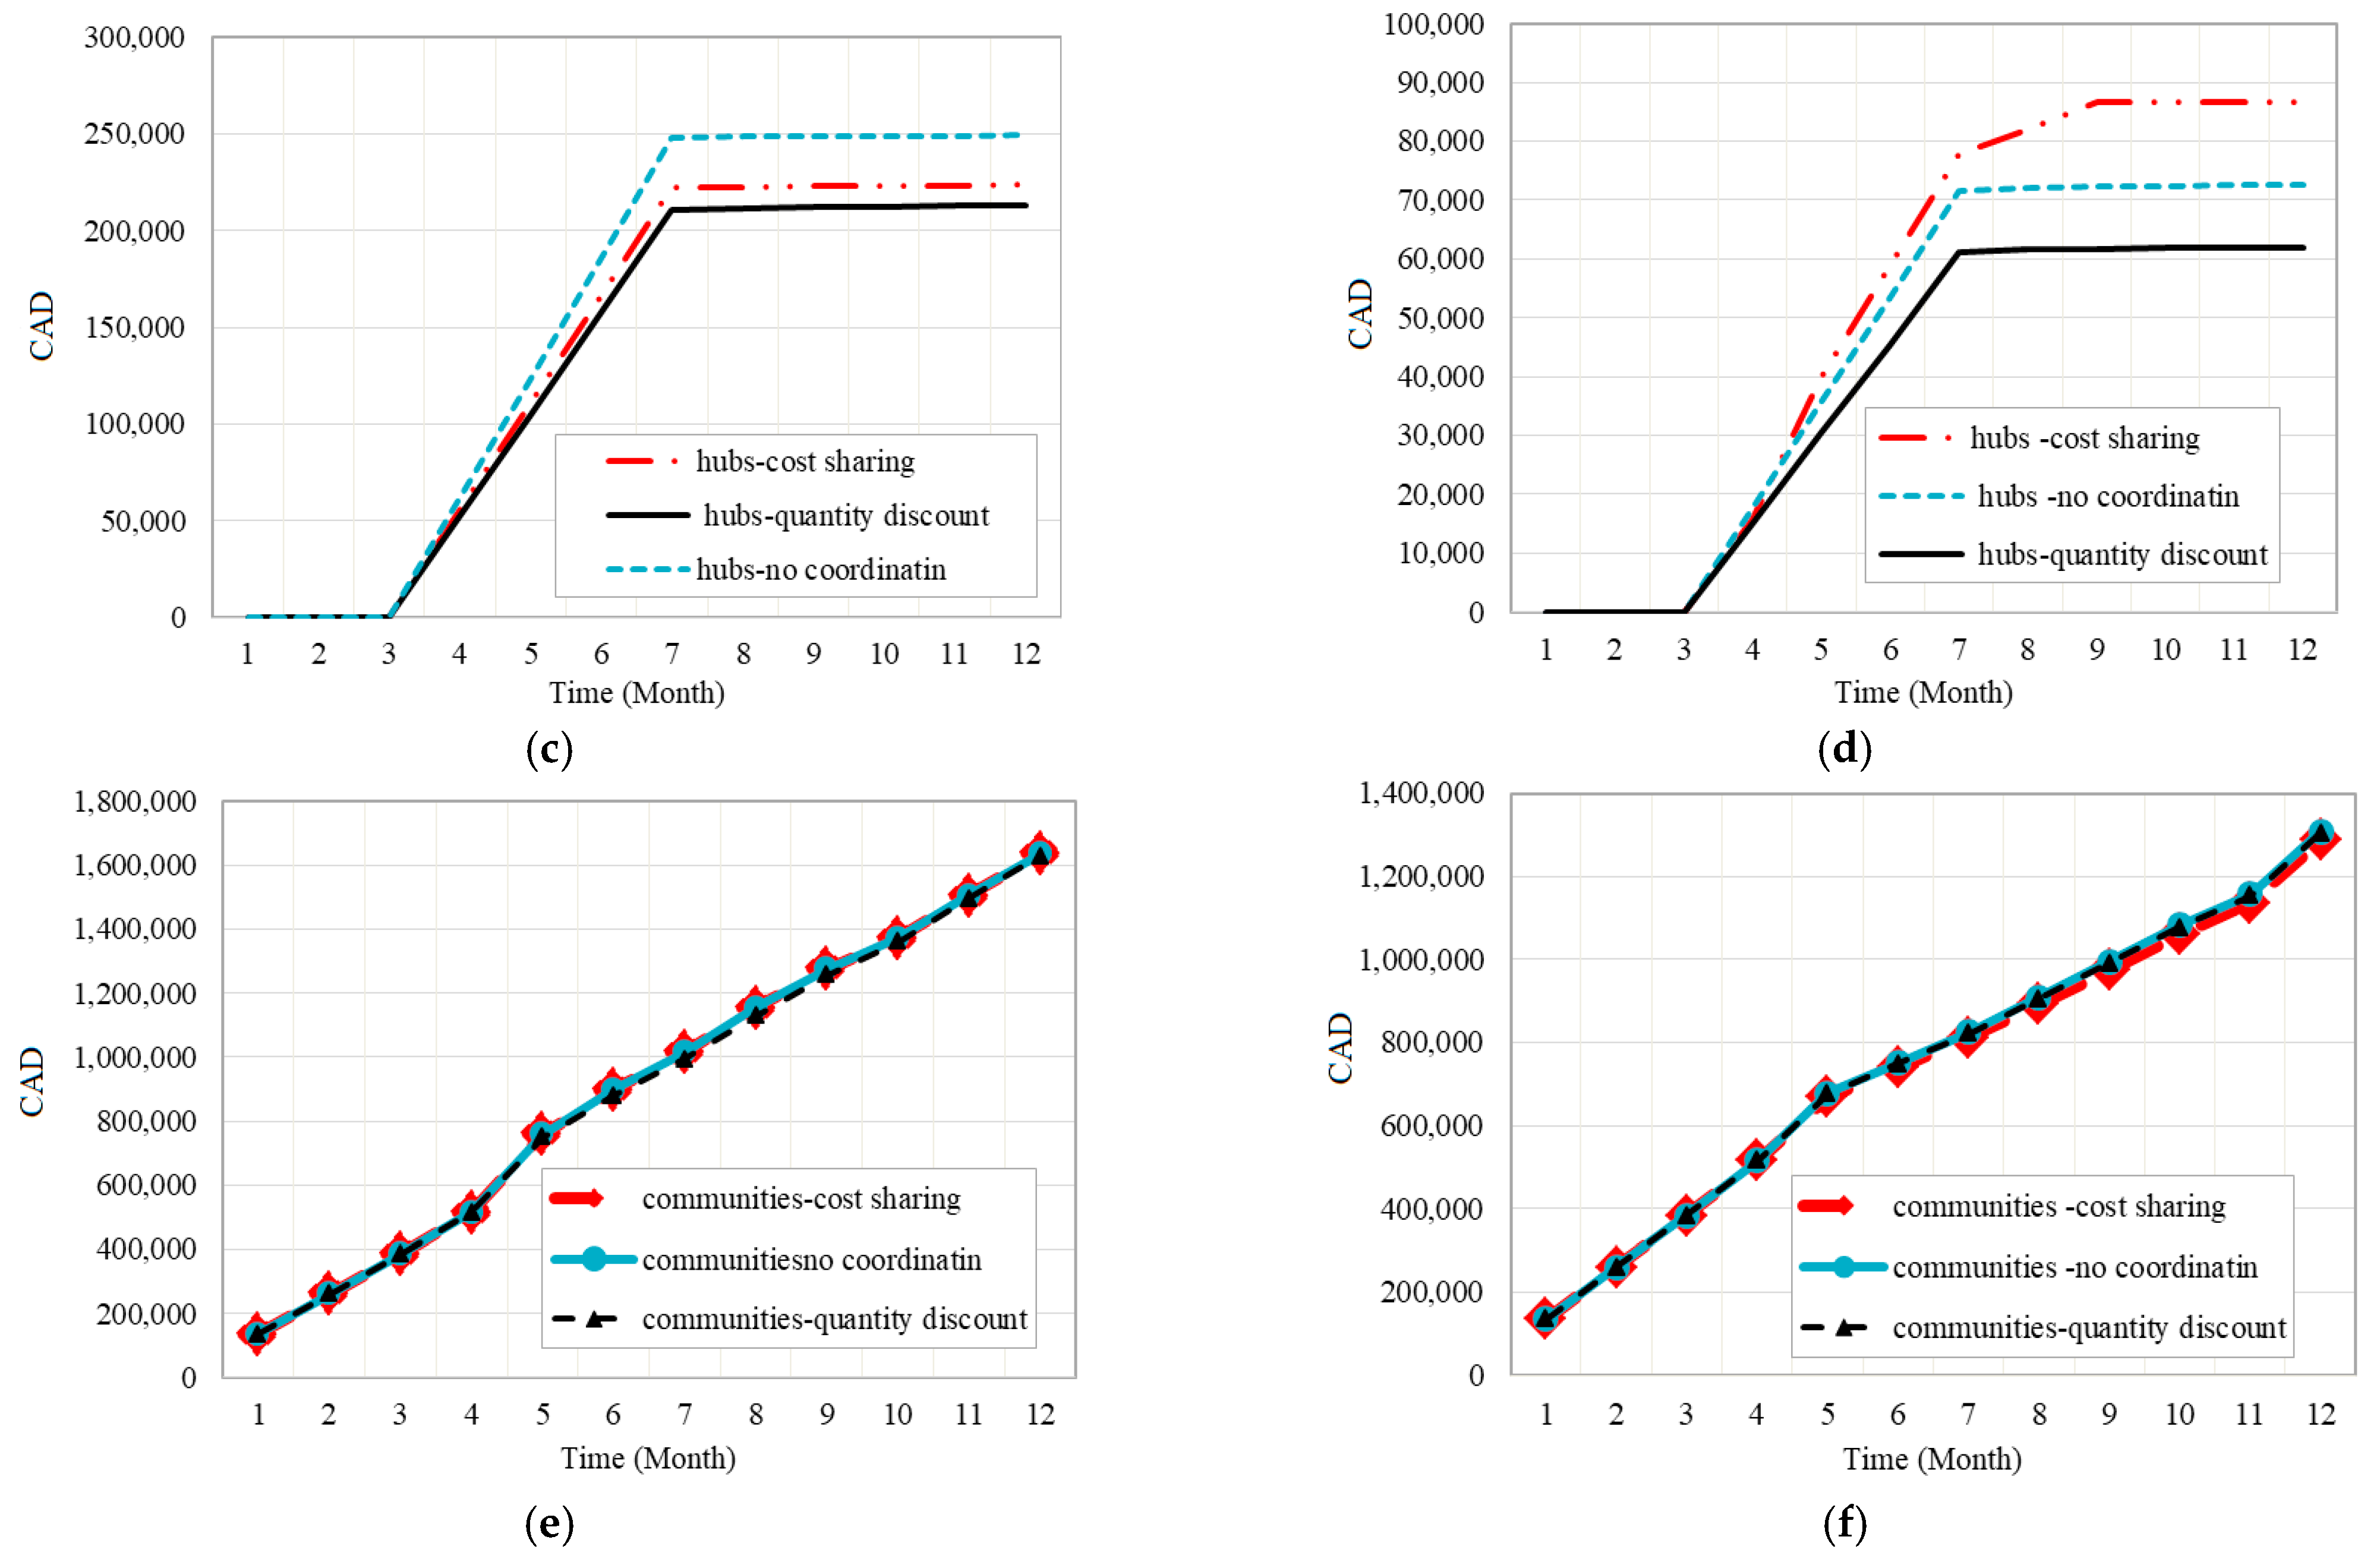
Figure 22a,b present the cumulative cost of suppliers under coordination scenarios when choosing more expensive or cheaper biomass types, respectively. As shown in Figure 22a,b, using more expensive or cheaper biomass types will not impact suppliers’ preferred coordination scenarios. According to Figure 22b, decreasing the biomass price by 60% leads to a discount amount of CAD 10,599.4 and cost sharing of CAD 7423.55 equivalent to 60% and 59% reductions in discount and cost sharing, respectively. In this regard, the discount amount is reduced slightly more than cost sharing in case of cheaper biomass types. Similarly, increasing biomass price by 40% increases suppliers’ cost, in case of quantity discount and cost-sharing scenarios by CAD 37,097.8 and CAD 25,740.1, respectively (Figure 22a). In this scenario, the suppliers’ cost is slightly more sensitive to price in quantity discount strategy in comparison with a cost-sharing strategy. The reason is that the suppliers should compensate the storage cost of hubs in a cost-sharing scenario no matter what biomass price is. In contrast, under a quantity discount strategy, discount rates will vary by biomass price variations. In this sense, suppliers prefer a cost-sharing strategy.
In the case of cheaper biomass type, hubs’ cost for the cost-sharing scenario is decreased by 50% and for quantity discount and no coordination scenarios it is decreased by 60%. As depicted in Figure 22d, hubs’ cumulative cost reaches to CAD 86,754.1 under the cost-sharing scenario, and to CAD 72,537.4 and CAD 61,938, in no coordination and quantity discount scenarios, respectively. Accordingly, hubs will prefer a quantity discount strategy when using a cheaper biomass type. As biomass price increases, both coordination scenarios have more savings compared with the no coordination scenario (Figure 22c). In case of more expensive biomass, the cost of hubs increases to a higher level under quantity discounts, CAD 223,467, in comparison with cost-sharing, that reaches to CAD 213,064. In this sense, cost sharing will be the preferred coordination scenario from hubs’ perspective in case of more expensive biomass.
For communities, a cost-sharing scenario creates more savings in comparison in the case of a cheaper biomass type. As depicted in Figure 22f, cumulative cost of communities under cost-sharing, quantity discount, and no coordination scenarios will reach a maximum of CAD 1,287,080, CAD 1,304,210, and CAD 1,308,720, respectively, with biomass price decreasing by 60%. In this regard, communities’ preferred scenario will be the cost-sharing in case of cheaper biomass types. As biomass price increases, communities’ cost in a cost-sharing scenario will increase with a higher rate in comparison with other scenarios. With price increases at a rate of 40%, communities’ cost for cost sharing, quantity discounts, and no coordination scenarios will reach to CAD 1,637,310, CAD 1,628,360, and CAD 1,637,310, respectively (Figure 22e). As such, in case of more expensive biomass types, communities will prefer the quantity discount strategy.
  • Having larger or smaller storage capacities at hubs and communities: Storage capacities are increased and decreased by the same rate of 40% while fixing all other parameters to investigate the sensitivity to the capacity assumptions.
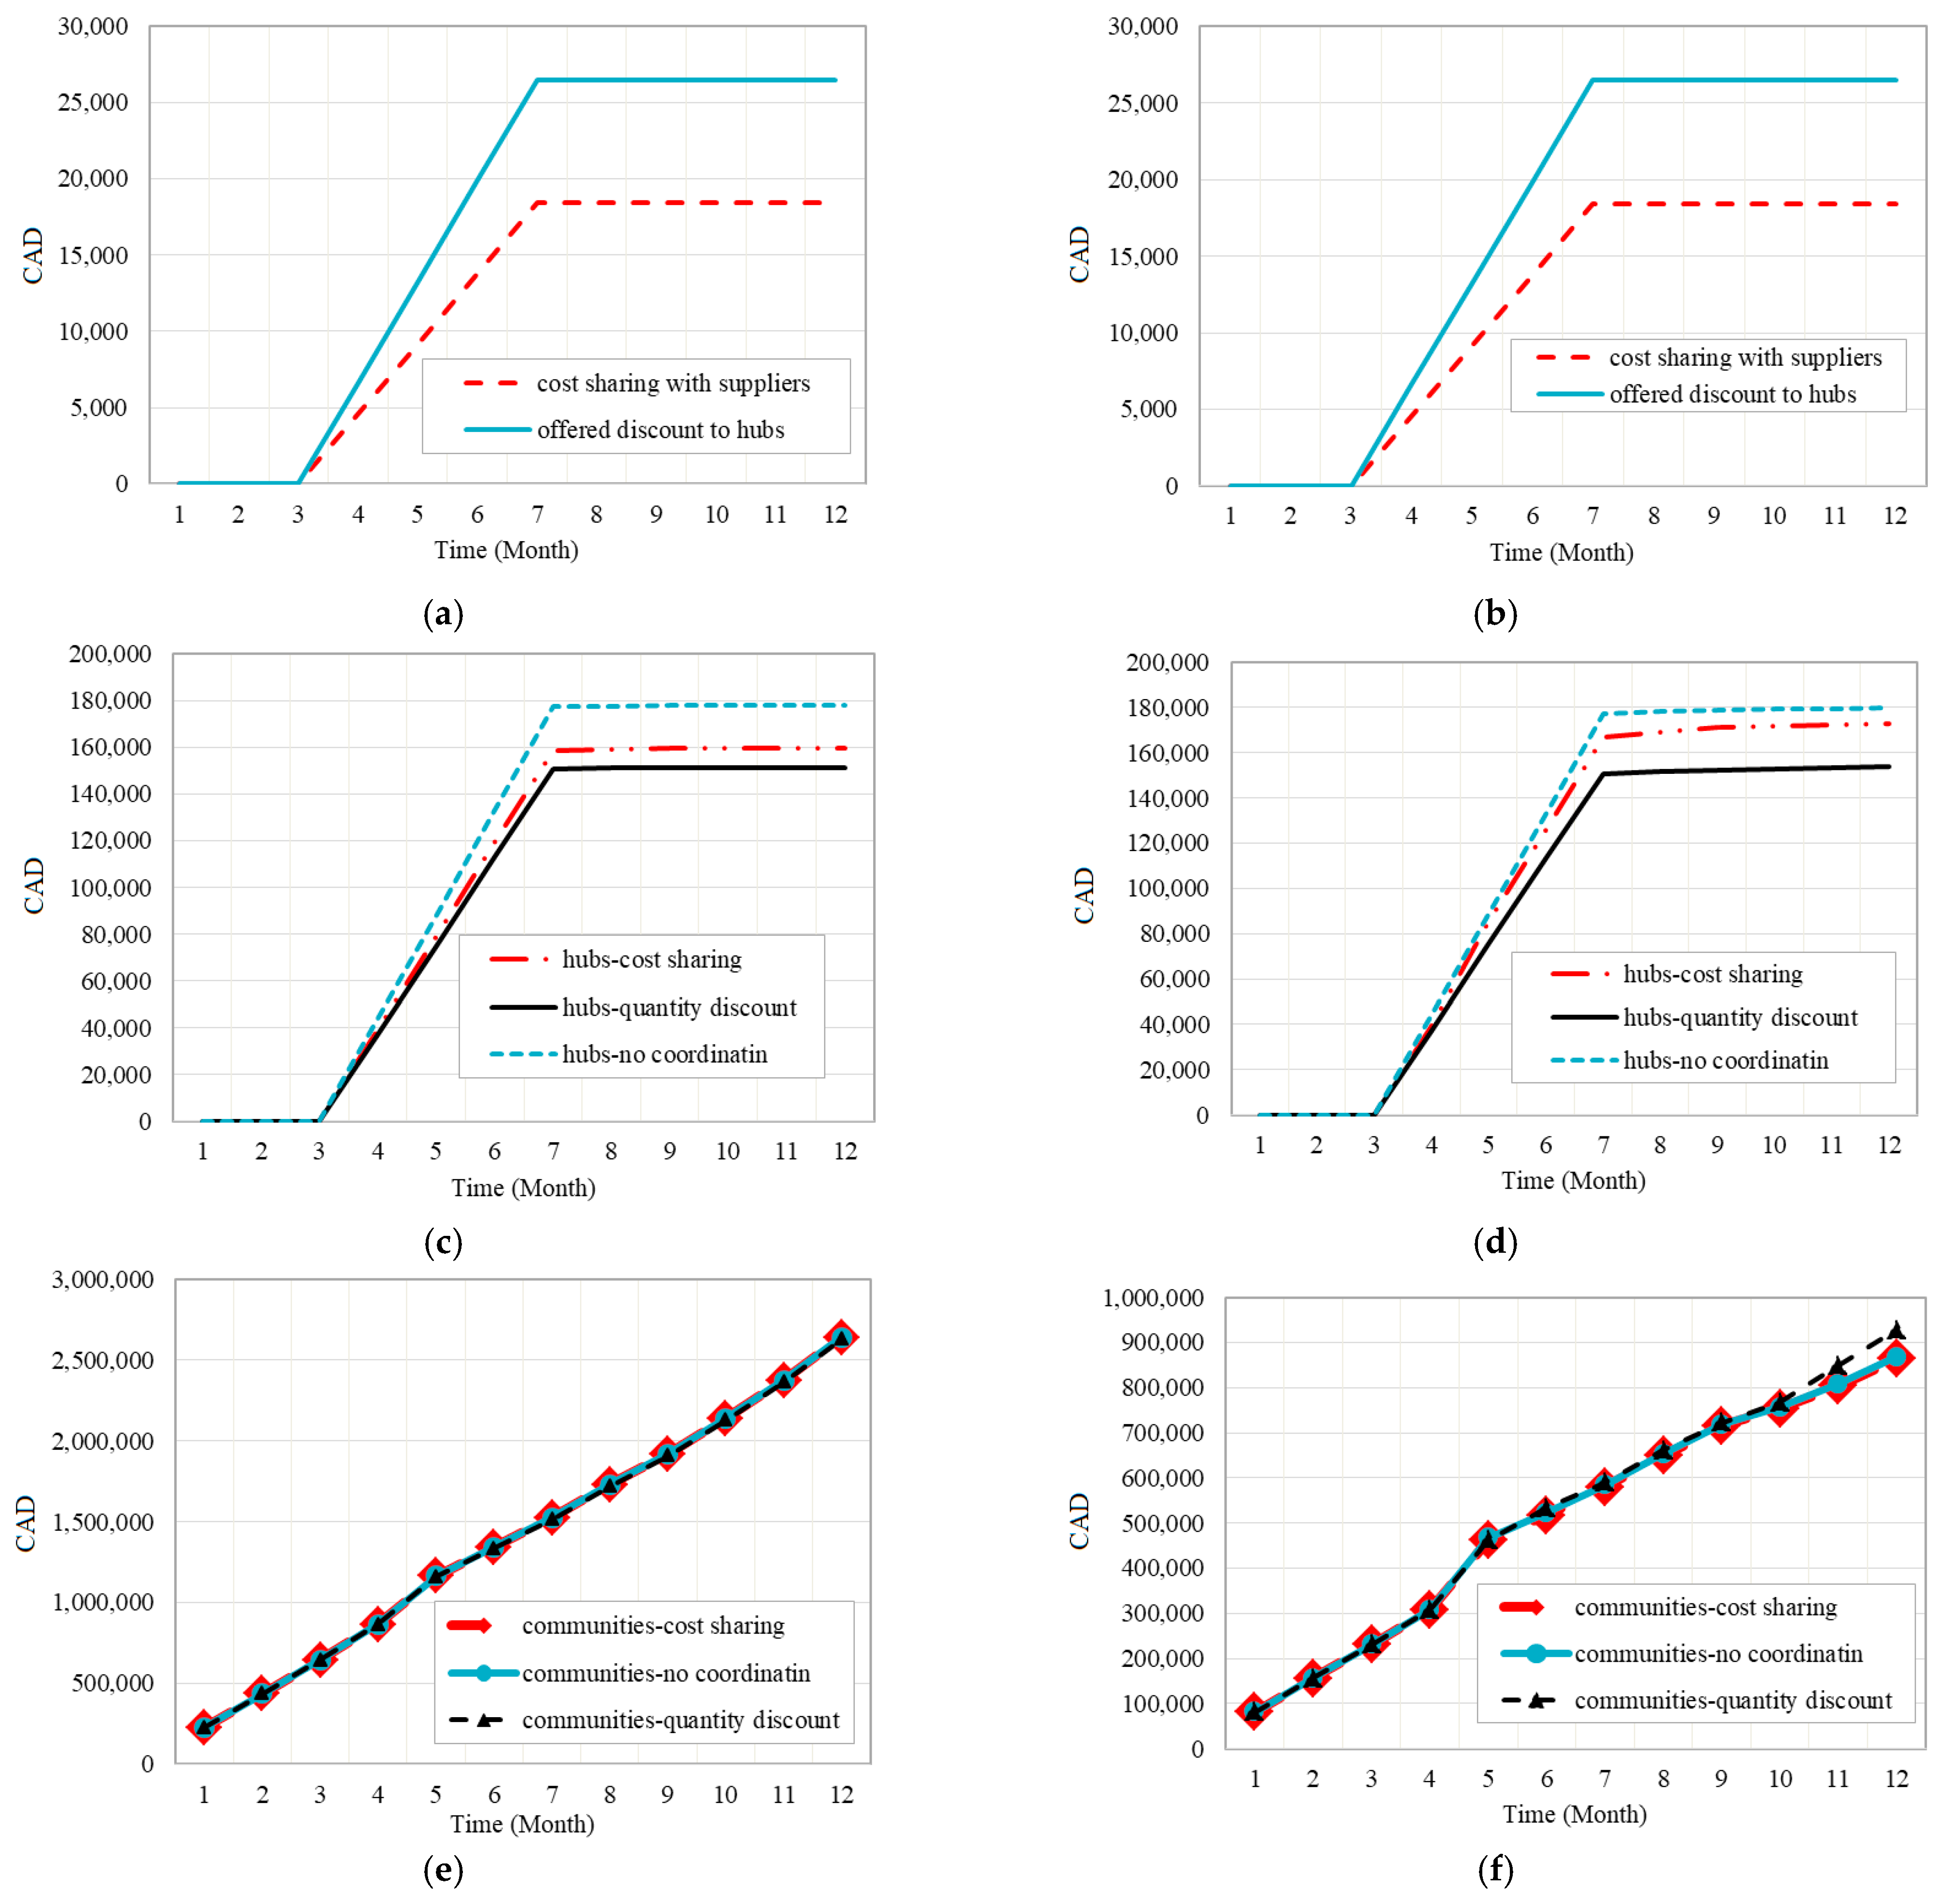
Figure 23a,b depict the variations in discount and cost-sharing amounts subject to increases and decreases of storage capacity (by a rate of 40%), respectively. As shown, storage capacity variations will not significantly impact the costs. This is due to the fact that biomass supply capacities limit the delivery amounts, and thus, having higher storage capacities could not necessarily lead to increase in delivery amounts. According to Figure 23a, suppliers will still prefer the cost-sharing strategy if storage capacities increase. Similarly, storage capacity reduction does not contribute to considerable decrease in cost-sharing amount (only a reduction rate of 1%). In contrary, reduction of storage capacities results in discount amount being reduced by 12% reaching a maximum of CAD 23,147.1. This is still higher than cost of suppliers under the cost-sharing scenario (CAD 18,426.3). It is thus expected that a quantity discount strategy is preferred by suppliers in cases of very small storage capacities (such that to limit the deliveries).
As depicted in Figure 23c,d, both coordination scenarios will contribute to hubs’ cost savings compared with a no coordination scenario in case of varied storage capacities. If storage capacities are decreased by 40%, hubs cost will be reduced by 13% and 8% reaching to CAD 143,514 and CAD 138,738 in cost-sharing and quantity discount scenarios, respectively (Figure 23d). The results show that hubs’ cost in cost-sharing scenario is very close to that of quantity discount scenario. This reflects the fact that smaller storage capacities lead to smaller order quantities resulting in lower discounts. As such, cost-sharing will be the preferred strategy in case of very small storage capacities. On the other hand, communities and hubs will be motivated to order larger quantities if they have larger storage capacities. In this sense, a quantity discount strategy will be preferred by them in case of larger storage capacities. As shown in Figure 23c, hubs’ cumulative cost under quantity discount, cost-sharing, and no coordination scenarios are CAD 151,215, CAD 159,303, and CAD 177,714, respectively, in case storage capacities increase by 40%.
Figure 23e,f show that storage capacity variations will not impact communities’ cost significantly. However, with larger storage capacities, a communities’ cumulative cost will decrease further under quantity discount and cost-sharing as well as no coordination scenarios reaching to CAD 1,474,320, CAD 1,483,390, and CAD 1,483,400 (Figure 23e). This reflects the fact that communities could order larger quantities when they have larger storage capacities to benefit from higher discounts and cost-sharing. Additionally, the share of electricity production from biomass will increase in both coordination scenarios with larger storage capacities. The results show that increasing storage capacities by 40% leads to improving the share of electricity production from biomass by 17% in both coordination scenarios. The share of biomass in electricity generation ranges from 34% to 40% in coordination scenarios when capacity storage increases by 40%. In this case, communities will prefer quantity discounts due to higher savings. Smaller choices for storage capacities do not have an impact on communities’ preference of coordination scenarios but increase communities’ cost under all scenarios, with quantity discounts scenario presenting the lowest cost at CAD 1,515,060 (Figure 23f).
  • Dealing with larger or smaller communities: Obviously, large communities are expected to demand more electricity compared with smaller communities. Accordingly, electricity demand is increased up to 70% to investigate the effect of larger communities. In addition, electricity demand is decreased by 40% to capture the effect of dealing with smaller communities. Note that all other parameters are kept fixed.
Figure 24a,b present suppliers’ cost for larger and smaller communities, respectively. The results show that communities’ size does not impact the amount of discount offered to hubs. Accordingly, suppliers’ cost will not be affected by communities’ size in a quantity discount scenario. Additionally, communities’ size does not contribute to considerable variations in cost-sharing. According to Figure 24b, cost sharing increases almost by 1% and reaches to a maximum of CAD 18,426.4 in case of dealing with smaller communities. This slight growth is due to reduction in biomass use, increasing the hubs’ storage cost, and thus, slightly increasing the cost sharing with suppliers. Overall, suppliers will prefer a cost-sharing scenario for any size of communities.
As depicted in Figure 24d, in case of dealing with smaller communities, hubs’ cost increases to CAD 172,959, CAD 153,807, and CAD 180,156 under cost-sharing, quantity discounts, and no coordination scenarios, respectively. In this case, the cost-sharing strategy results in the highest increase in hubs’ cost (by 4%). In this sense, the quantity discount strategy will be preferred by hubs in case of dealing with small communities as lower demand and lower delivery of biomass lead to increasing the storage cost of hubs. In addition, communities will share a larger portion of their cost with hubs in case of smaller communities. As depicted in Figure 24c, in case of dealing with larger communities, cost of hubs decreases at a higher rate in cost-sharing scenario compared with other scenarios. Hubs’ cost reaches to a maximum of CAD 159,494 with cost-sharing and CAD 151,404 with quantity discount scenario. In this regard, in case of dealing with large communities, cost sharing might be preferred by hubs.
Turning to communities’ cost, smaller communities will prefer a cost-sharing strategy, according to Figure 24f. The cost sharing will increase in case of smaller communities to motivate larger order deliveries. A larger biomass delivery quantity is expected for cost sharing compared with a quantity discount and no coordination scenarios. Accordingly, the highest share of biomass in electricity generation, 46%, corresponds to the cost-sharing scenario. As shown in Figure 24e, communities’ cost increased and reaches a maximum of CAD 2,642,870, CAD 2,631,370, and CAD 2,642,870 for cost-sharing, quantity discount, and no coordination scenarios, respectively. The share of biomass in generating electricity for larger communities is almost 24% under all scenarios. Considering the costs, a quantity discount might be a preferred scenario for large communities.
  • Increasing the Number of Parties at Each Level of Supply Chain: In case of having more suppliers, total biomass supply amount could increase. Similarly, having more hubs and communities leads to increasing the total storage capacities as well as higher electricity demand.
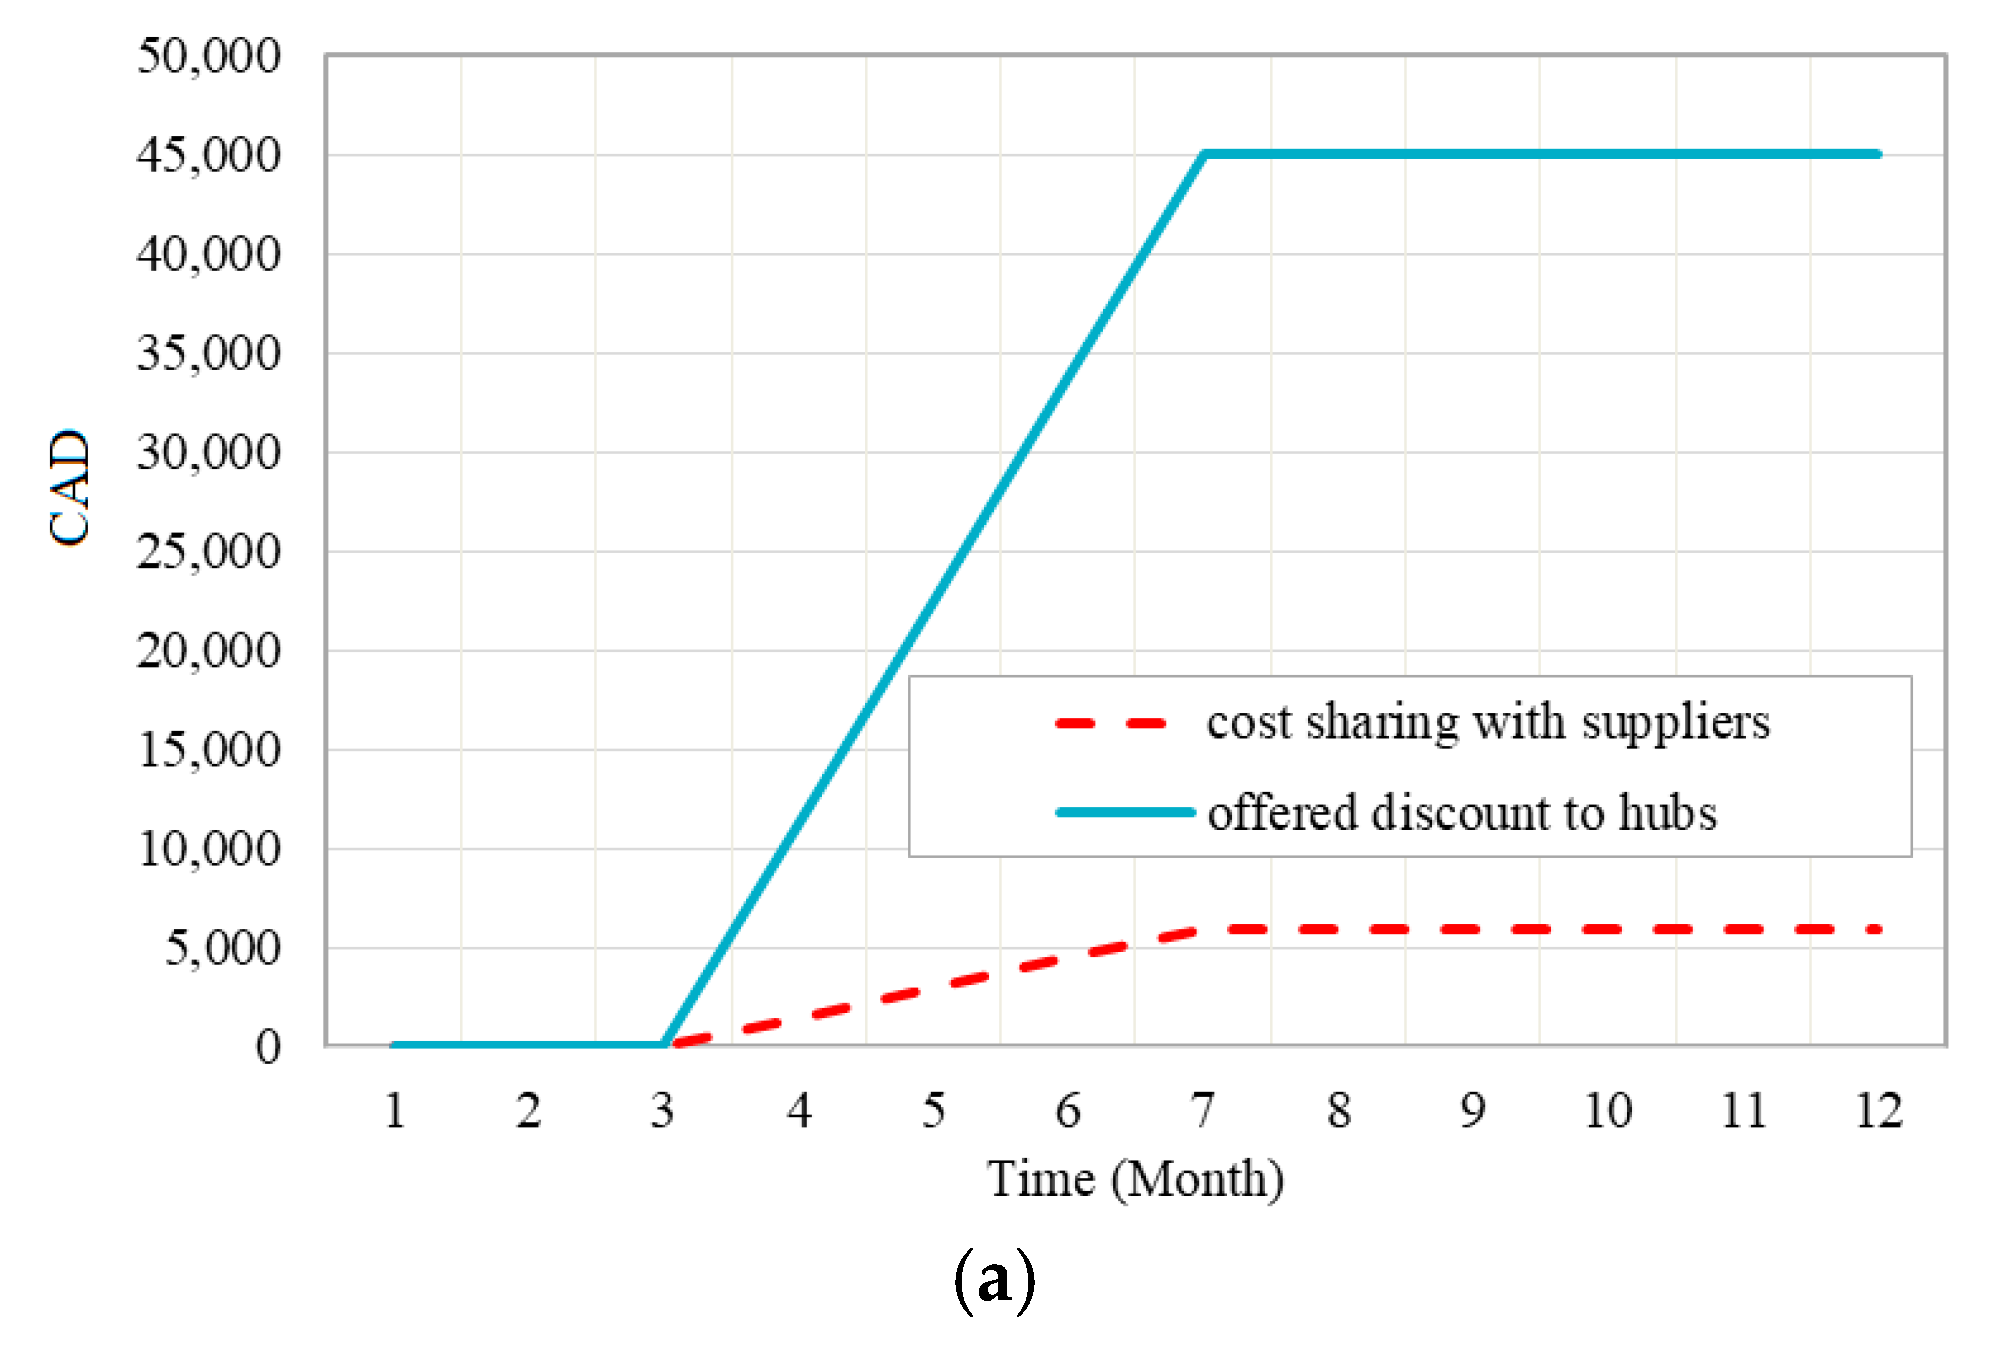
In the case of having more players, it is expected to have more biomass supply, more storage capacities, greater demand for electricity, and a higher capacity for electricity generation. As depicted in Figure 25a, this results in a cost-sharing decrease by 67% (reaching to CAD 5977), while increasing the offered discount to hubs by 70% (reaching to CAD 45,047). In this scenario, a cost-sharing strategy will be the preferred coordination strategy from suppliers’ perspective.
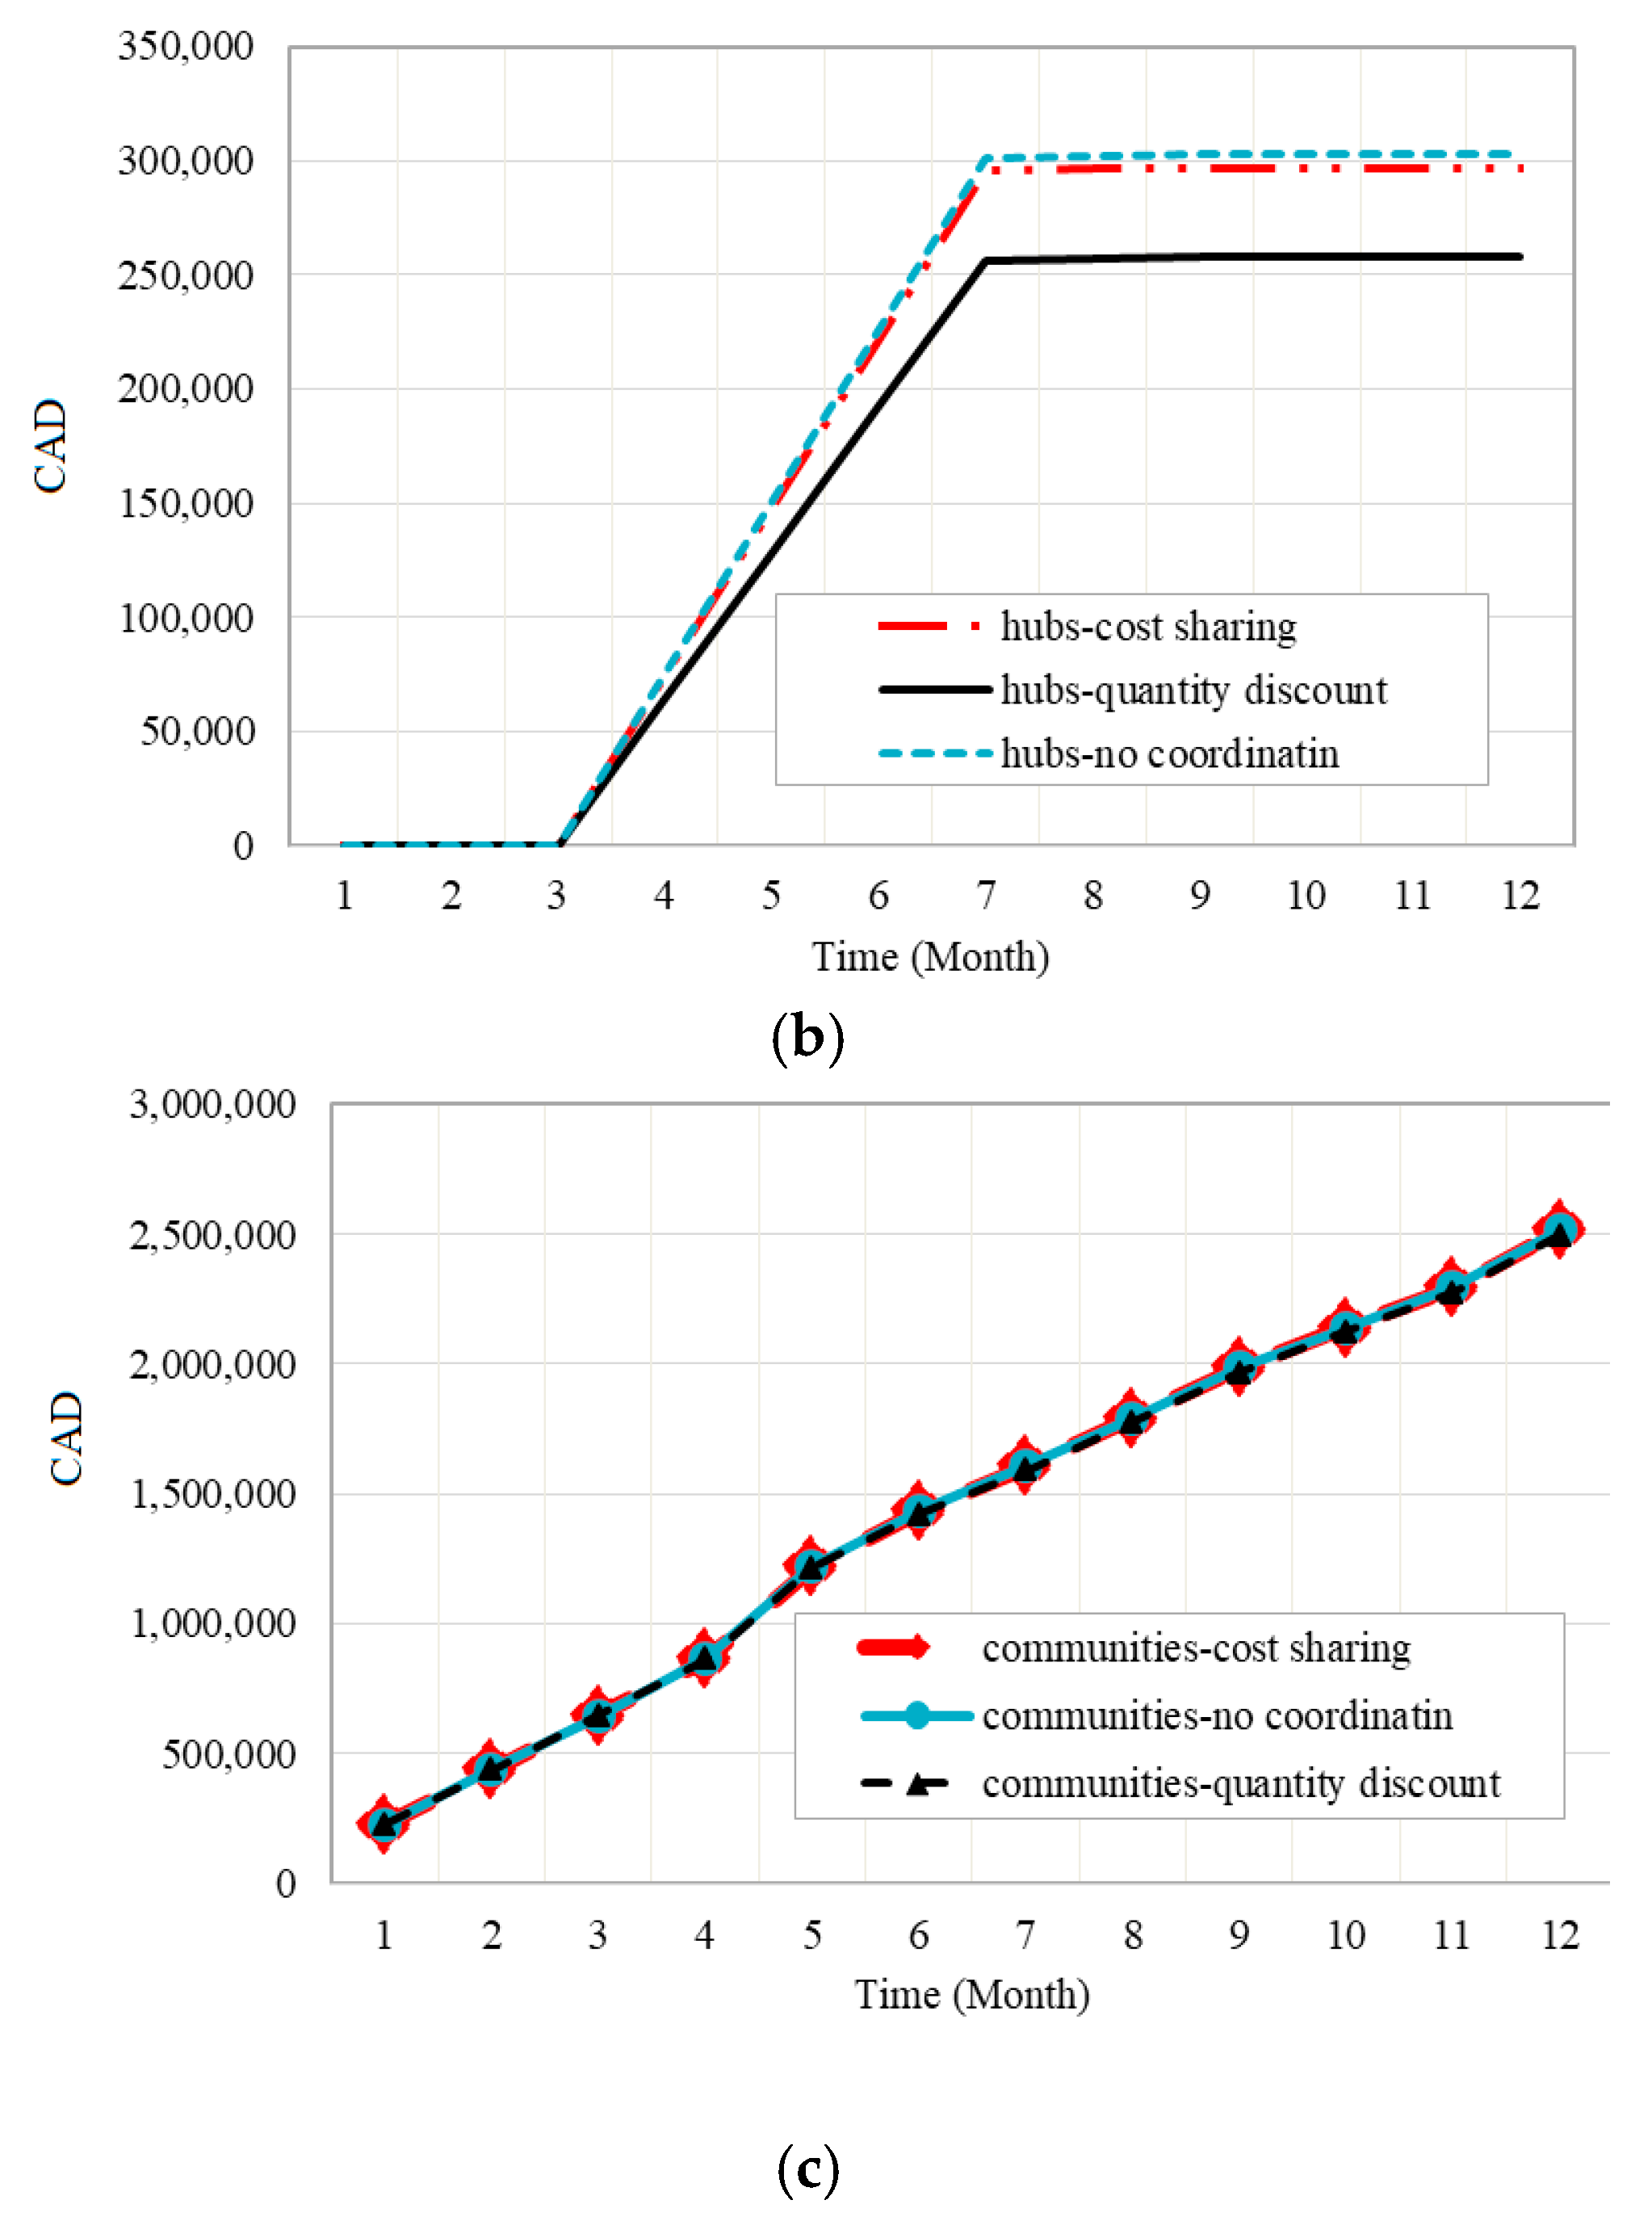
According to Figure 25b, cost of hubs increases and reaches to CAD 296,987, CAD 257,919, and CAD 302,964 in case of cost-sharing, quantity discounts, and no coordination in a supply chain with more players involved. In this situation, cost sharing results in the highest cost increase for hubs by 80%. As such, hubs will prefer quantity discounts in case of a biomass supply chain with more players at each level.
Turning to communities, Figure 25c shows that having more players at each level will not impact communities’ preference for coordination scenarios. In this sense, communities’ preference is still a quantity discount strategy.
In summary, suppliers would prefer a cost-sharing strategy. Variations in price, communities’ size and number of players at each level of supply chain would not impact their preference. However, size of storage capacities impact suppliers’ cost and could result in quantity discount strategy becoming their preferred coordination strategy. On the other hand, hubs would prefer a quantity discount strategy, and having more players at each level would not impact their preference. The hubs benefit more from this strategy than cost-sharing and no-coordination strategies in case of cheaper biomass types, larger biomass capacities, and dealing with small communities. However, in case of expensive biomass types, hubs’ preference strategy could be the cost sharing. Communities’ preferred strategy is quantity discounts, and having more players would not impact their preference. They also benefit more from this strategy in case of expensive biomass types. Similarly, larger communities are expected to have higher savings and a higher share of biomass in electricity generation under quantity discounts compared with other scenarios. Additionally, communities’ cost efficiency and biomass share in electricity generation would be improved by a quantity discount strategy under any storage capacity scenario. However, a cost-sharing strategy would be the preferred strategy of small communities in case of cheaper biomass types.

5. Conclusions

This study proposed a simulation-optimization model to analyze alternative biomass supply chain coordination strategies with a case study in Canada’s off-grid northern communities. The electricity generation from biomass was considered as an alternative for diesel. The quantity discounts and cost-sharing coordination scenarios were compared based on their impact on minimizing total cost of biomass supply chain. We created a model that incorporated the coordination strategies to biomass supply chain by considering the costs associated with the supply, storage, and use of biomass, as well as the costs of electricity generation from biomass and diesel throughout a time horizon of 12 months. In this regard, we were able to investigate the impact of coordination scenarios on the overall cost of players as well as the cost performance of the biomass supply chain. With a cost minimization objective, the optimal biomass ordering schedule, electricity production schedule (from biomass and diesel), biomass inventories at hubs and communities, as well as price discounts (under quantity discount strategy) and ratios of cost sharing (under cost-sharing scenario) were identified. The results indicated that the quantity discounts and cost-sharing strategies effectively improved the cost efficiency of hubs and communities by improving the economies of scale. In comparison, the case study results shows that hubs and communities preferred the adoption of quantity discounts coordination strategy due to incurring lower overall costs in this scenario compared to cost-sharing strategy. In contrast, suppliers benefit more from the cost-sharing scenario. The comparison of results under different circumstances pointed to the significant role of coordination strategies in improving the cost efficiency as well as the level of biomass-based electricity generation while the players have different preferences in choice of coordination strategies.
Since economic gains are not necessarily the only aim of bioenergy production, social and environmental issues could also be considered to provide a more comparative analysis of the coordination strategies for biomass supply chain of remote communities [43]. In this sense, the simulation-optimization model applied in this study to investigate the coordination strategies could be extended to a multi-objective model to capture the biomass supply chain’s environmental and social gains. The disposal or utilization of ash residues from biomass combustion is also a defining factor for adoption of biomass in communities as an alternative source for electricity generation. The ash can be used in cement and building materials production as an additive, added as an asphalt filler, or added to compost as a fertilizer [44]. It is also imperative to consider demand and supply uncertainties and analyze other forms of coordination strategies such as risk-sharing contracts.

Author Contributions

Conceptualization, S.K., F.M. and Y.Z.; methodology, S.K., F.M. and Y.Z.; software, S.K; validation, S.K., F.M. and Y.Z.; formal analysis, S.K., F.M. and Y.Z.; investigation, S.K., F.M. and Y.Z.; resources, S.K., F.M. and Y.Z.; data curation, S.K.; writing—original draft preparation, S.K.; writing—review and editing, S.K., F.M. and Y.Z.; visualization, S.K.; supervision, F.M. and Y.Z.; project administration, F.M. and Y.Z.; funding acquisition, F.M. and Y.Z. All authors have read and agreed to the published version of the manuscript.

Funding

This research was funded by the Natural Sciences and Engineering Research Council of Canada (NSERC), Grant RGPIN-2019-07086 (F. Mafakheri) and Fonds de recherche du Québec en Société et culture (FRQSC) (Y. Zeng).

Institutional Review Board Statement

Not applicable.

Informed Consent Statement

Not applicable.

Data Availability Statement

Not applicable.

Acknowledgments

The authors acknowledge the comments and suggestions received from three anonymous reviewers, which were helpful in improving the quality of the manuscript.

Conflicts of Interest

The authors declare no conflict of interest.

Appendix A

Table A1. List of variables and parameters.
Sets Definition
iSet of suppliers
jSet of communities (end users)
kSet of hubs
tTime (months)
Stock Variables (and units) with Corresponding Players
Community
S I j ( t ) : Biomass stock level at community “j” at time “t”—(kg)
W ( T ) : Cumulative cost of communities at time “t”—(CAD)
Hub
S H k ( t ) : Biomass stock level at hub “k” at time “t”—(kg)
V ( T ) : Cumulative cost of hubs at time “t”—(CAD)
C ( T ) : Cumulative total cost of supply chain at time “t”—(CAD)
Flow Variables (and units) with Corresponding Players
Community
w ( t ) : Cost of communities at time “t”—(CAD/month)
y j k ( t ) : Biomass order by community “j” to hub “k” at time “t”—(kg/month)—Decision variable
z j ( t ) : Biomass use for electricity production at community “j” at time “t”—(kg/month)
Hub
v ( t ) : Cost of hubs at time “t”—(CAD/month)
x k j ( t ) : Biomass order by hub “k” to supplier “i” at time “t” (kg/month)—Decision variable
c ( t ) : Total collective cost of supply chain at time “t”—(CAD/month)
Auxiliary Variables (and units) with Corresponding Players
Community
Y j k ( t ) : Order capacity to hub “k” by community “j” at time “t”—(kg/month)
Φ k j ( t ) : Order ratio to hub “k” by community “j” at time “t”—(Dimensionless)
F j ( t ) : Electricity production from fossil fuel at community “j” at time “t”—(kWh/month)
B j ( t ) : Electricity production from biomass at community “j” at time “t”—(kWh/month)
B D C ( t ) : Biomass distribution cost to communities at time “t”—(CAD/month)
B S C ( t ) : Biomass storage cost at communities at time “t”—(CAD/month)
f j ( t ) : Electricity production cost from fossil fuel at time “t”—(CAD/month)
F E C ( t ) : Fossil-based energy generation cost at time “t“—(CAD/month)
B C C ( t ) : Biomass-to-electricity conversion cost at time “t”—(CAD/month)
α j k m : Maximum cost sharing ratio of community “j” with hub “k”—(Dimensionless)—Decision variable
α j k ( t ) : Cost sharing ratio of community “j” with hub “k” at time “t”—(Dimensionless)—Decision variable
Hub
X k i ( t ) : Order capacity to supplier “i” by hub “k” at time “t”—(kg/month)
δ k i ( t ) : Order ratio to supplier “i” by hub “k” at time “t”—(Dimensionless)
R k j ( t ) : Biomass price offered by hub “k” to community “j” including delivery at time “t”—(CAD/kg)—Decision variable
B P C ( t ) : Biomass purchasing cost at time “t”—(CAD/month)
B S H ( t ) : Biomass storage cost at hubs at time “t”—(CAD/month)
α k i m : Maximum cost sharing ratio of hub “k” with supplier “i”—(Dimensionless)—Decision variable
α k i ( t ) : Cost sharing ratio of hub “k” with supplier “i” at time “t”—(Dimensionless)—Decision variable
C S H ( t ) : Communities’ cost shared with hubs at time “t”—(CAD/month)
Supplier
P i k ( t ) : Biomass price offered by supplier “i” to hub “k” including delivery at time “t”—(CAD/kg)—Decision variable
H C S ( t ) : Hubs’ cost shared with suppliers at time “t”—(CAD/month)
Constant Variables (and units) with Corresponding Players
Community
I j : Capacity of biomass storage at community “j”—(kg)
E j : Capacity of biomass-to-electricity conversion facility at community “j”—(kW)
D j ( t ) : Electricity demand in community “j” at time “t”—(kWh/month)
ε j : Loading factor of biomass-to-electricity conversion facility at community “j”—(Dimensionless)
G j : holding cost at community “j” per unit of time—(CAD/kg)
δ j ( t ) : Levelized electricity generation cost from diesel at community “j”—(CAD/kWh)
γ j : Levelized biomass-to-electricity conversion cost at community “j”—(CAD/kWh)
β j : Biomass conversion ratio in community “j”—(kWh/kg)
w h j : Working hours per day—(h)
w d j : Working days—(day)
t s j : Time scale—(h)
Hub
L k : Holding cost at hub “k” per unit of time—(CAD/kg)
H k : Capacity of hub “k”—(kg)
R k u : Biomass price of hub “k” (including delivery) without discount—(CAD/kg)
R k l : Biomass price of hub “k” (including delivery) with full discount—(CAD/kg)
Supplier
S i : Biomass supply capacity of supplier “i”—(kg)
P i l : Biomass price of supplier “i” with full discount—(CAD/kg)
P i u : Biomass price of supplier “i” with no discount—(CAD/kg)
A Description of the Equations and Variables of Quantity Discount Strategy Defined in Vensim Platform:
(1)
Biomass stock at hub [hub] = INTEG (SUM (Biomass order by hub to supplier [supplier!, hub]) − SUM(Biomass order by community to hub[hub, community!]))
(2)
Biomass stock at community [community] = INTEG (SUM (Biomass order by community to hub [hub!, Community]) − Biomass use for electricity production at community[community]
(3)
Biomass order by hub to supplier[supplier, hub] = IF THEN ELSE(Time = 3:OR:Time = 4:OR:Time = 5:OR:Time = 6, Proportional delivery ratio of supplier to Biomass order by hub to supplier[supplier, hub] = hub[supplier, hub]*Order capacity to supplier[supplier, hub], 0)
(4)
Biomass order by community to hub[hubs, communities] = IF THEN ELSE (Time = 3:OR:Time = 4:OR:Time = 5:OR:Time = 6:OR:Time = 7:OR:Time = 8, Order capacity by community to hub[hub, community]*Proportional delivery ratio of hub to community[hub, community], 0)
(5)
Biomass use for electricity production at community[community] = max(min((min((Time scale*Capacity of biomass to electricity conversion facility[community]*Loading factor of biomass to electricity conversion facility[community]), Electricity demand[community])/Biomass conversion ratio[community]), Biomass stock at community[community]/TIME STEP),0)
(6)
Proportional delivery ratio of supplier to hub [supplier, hub] = Order ratio to suppliers [supplier, hubs]/Total delivery ratio of suppliers [supplier]
(7)
Total delivery ratio of supplier [supplier] = SUM (Order ratio to supplier [supplier, hub!])
(8)
0< = Order ratio to supplier [supplier, hub] < = 1
(9)
Initial value of order ratio to supplier [supplier, hub] = 1
(10)
Order capacity to supplier [supplier, hub] = max (min ((Capacity of hub [hub] − Biomass stock at hub [hub])/TIME STEP, Supplier capacity [supplier]), 0)
(11)
Capacity of hub [hub] = 350,000, 400,000
(12)
Supplier capacity [supplier] = 33,300, 34,000, 34,700, 37,000, 35,000, 34,000
(13)
Total biomass purchase cost of hub [hub] = SUM (Biomass purchase cost [hub, supplier!])
(14)
Biomass purchase cost [hub, supplier] = Biomass price offered by supplier [supplier, hub]*Biomass order by hub to supplier [supplier, hub]
(15)
Biomass price offered by supplier [supplier, hub] = Biomass price of supplier with no discount [supplier] − (Biomass price of supplier with no discount [supplier]-Biomass price of supplier with full discount [Supplier])*((Biomass order by hub to supplier [supplier, hub])/Supplier capacity [supplier])
(16)
Biomass price of supplier with no discount [supplier] = 0.205, 0.21, 0.2, 0.215, 0.22, 0.22
(17)
Biomass storage cost at hub [hub] = (Biomass stock at hub [hub]*Holding cost at hub per unit of time [hub])/TIME STEP
(18)
Holding cost at hub per unit of time [hub] = 0.002, 0.0015
(19)
Proportional delivery ratio of hub to community [hub, community] = Order ratio to hub [hub, community]/Total delivery ratio of hub [hub]
(20)
Total delivery ratio of hub [hub] = SUM (Order ratio to hub [hub, community!])
(21)
0< = Order ratio to hub [hub, community] < = 1
(22)
Initial value of Order ratio to hub [hub, community = 1
(23)
Order capacity by community to hub [hub, community] = max (min ((Capacity of biomass storage at community [community] − Biomass stock at community [Community]), Biomass stock at hub [hub]), 0)/TIME STEP
(24)
Capacity of biomass storage at community [community] = 200,000, 200,000, 1.5 × 10⁶
(25)
Biomass distribution cost to community [community] = SUM (Biomass distribution cost from hub to community [hub!, community])
(26)
Biomass distribution cost from hub to community [hub, community] = (Biomass price offered by hub [hub, community]*Biomass order by community to hub [hub, community])
(27)
Biomass price offered by hub [hub, community] = Biomass price of hub with no discount [hub] − (Biomass price of hub with no discount [hub] − Biomass price of hub with full discount [hub])*(Biomass order by community to hub [hub, community]/(Capacity of hub [hub]/TIME STEP))
(28)
Biomass price of hub with full discount [hub] = 0.235, 0.266
(29)
Biomass price of hub with no discount [hub] = 0.362, 0.409
(30)
Biomass storage cost at community [community] = (Biomass stock at community [community]*Holding cost at community [community])/TIME STEP
(31)
Electricity production cost from biomass [community] = Electricity production from biomass [community]*Levelized biomass to electricity conversion cost [community]
(32)
Electricity production cost from fossil fuel [community] = Electricity production from fossil fuel [community]*Levelized electricity generation cost from diesel [community]
(33)
Electricity production from biomass [community] = Biomass conversion ratio [community]*Biomass use for electricity production at community [community]*Loading factor of biomass to electricity conversion facility [community]
(34)
Electricity production from fossil fuel [community] = Electricity demand [community]-Electricity production from biomass [community]
(35)
Cumulative cost of hubs = INTEG (SUM (Cost of hubs [hub!]))
(36)
Initial value = 0
(37)
Cumulative cost of communities = SUM (Cost of communities [community!])
(38)
Initial value = 0
(39)
Total collective cost of supply chain = SUM (Cost of communities [community!]) + SUM (Cost of hubs [hub!])
(40)
Cumulative total cost = INTEG (Total collective cost of supply chain)
(41)
Levelized biomass to electricity conversion cost [community] = 0.046, 0.044, 0.048
(42)
Levelized electricity generation cost from diesel [community] = 0.208, 0.215, 0.207
(43)
Biomass conversion ratio [community] = 4.7, 4.8, 4.6
(44)
Capacity of biomass to electricity conversion facility [community] = 500, 500, 500
(45)
Working days = 30
(46)
Hours = 24
(47)
TIME STEP = 1
A Description of the Equations and Variables of Cost Sharing Strategy Defined in Vensim Platform:
(1)
Biomass stock at hub [hub] = INTEG (SUM (Biomass order by hub to supplier [supplier!, hub]) − SUM(Biomass order by community to hub[hub, community!]))
(2)
Biomass stock at community [community] = INTEG (SUM (Biomass order by community to hub [hub!, Community])-Biomass use for electricity production at community[community]
(3)
Biomass order by hub to supplier[supplier, hub] = IF THEN ELSE (Time = 3:OR:Time = 4:OR:Time = 5:OR:Time = 6, proportional delivery ratio of supplier to hub[supplier, hub]*Order capacity to supplier[supplier, hub], 0)
(4)
Biomass order by community to hub[hub, community] = IF THEN ELSE (Time = 3:OR:Time = 4:OR:Time = 5:OR:Time = 6:OR:Time = 7:OR:Time = 8, Order capacity by community to hub[hub, community]*proportional delivery ratio of hub to community[hub, community] , 0)
(5)
Biomass use for electricity production at community [community] = SUM (Biomass order by community to hub [hub!, community]) − Biomass use for electricity production at community[community]
(6)
Proportional delivery ratio of supplier to hub [suppliers, hubs] = Order ratio to suppliers [supplier, hubs]/Total delivery ratio of suppliers [supplier]
(7)
Total delivery ratio of supplier [supplier] = SUM (Order ratio to supplier [supplier, hub!])
(8)
0< = Order ratio to supplier [supplier, hub] < = 1
(9)
Initial value of order ratio to supplier [supplier, hub] = 1
(10)
Order capacity to supplier [supplier, hub] = max (min ((Capacity of hub [hub]-Biomass stock at hub [hub])/TIME STEP, Supplier capacity [supplier]), 0)
(11)
Capacity of hub [hub] = 350,000, 400,000
(12)
Supplier capacity [supplier] = 33,300, 34,000, 34,700, 37,000, 35,000, 34,000
(13)
Total biomass purchase cost of hub [hub] = SUM (Biomass purchase cost [hub, supplier!])
(14)
Biomass purchase cost [hub, supplier] = Biomass price offered by supplier [supplier]*Biomass order by hub to supplier [supplier, hub]
(15)
Biomass price offered by supplier [supplier] = 0.205, 0.21, 0.2, 0.215, 0.22, 0.22
(16)
Biomass storage cost at hub [hub] = (Biomass stock at hub [hub]*Holding cost at hub per unit of time [hub])/TIME STEP
(17)
Holding cost at hub per unit of time [hub] = 0.002, 0.0015
(18)
Cost of hubs could be shared with suppliers [hub] = Biomass storage cost at hub [hub] + Total biomass purchase cost of hub [hub]
(19)
Hubs’ cost shared with suppliers [hub, supplier] = Cost of hubs could be shared with suppliers [hub]*Cost sharing ratio between Hub and supplier [hub, supplier]
(20)
Cost sharing ratio between Hub and supplier [hub, supplier] = Maximum cost sharing ratio between Hub [hub]*(Biomass order by hub to supplier [supplier, hub]/Supplier capacity [supplier])
(21)
0< = Maximum cost sharing ratio between Hub [hub] < = 1
(22)
Initial value in the model = 0
(23)
Proportional delivery ratio of hub to community [hub, community] = Order ratio to hub [hub, community]/Total delivery ratio of hub [hub]
(24)
Total delivery ratio of hub [hub] = SUM (Order ratio to hub [hub, community!])
(25)
0< = Order ratio to hub [hub, community] < = 1
(26)
Initial value of Order ratio to hub [hub, community = 1
(27)
Order capacity by community to hub [hub, community] = max (min ((Capacity of biomass storage at community [community] − Biomass stock at community [Community]), Biomass stock at hub [hub]), 0)/TIME STEP
(28)
Capacity of biomass storage at community [community] = 200,000, 200,000, 1.5 × 10⁶
(29)
Biomass distribution cost to community [community] = SUM (Biomass distribution cost from hub to community [hub!, community])
(30)
Biomass distribution cost from hub to community [hub, community] = (Biomass price offered by hub [hub, community]*Biomass order by community to hub [hub, community])
(31)
Biomass price offered by hub [hub] = 0.362, 0.409
(32)
Biomass storage cost at community [community] = (Biomass stock at community [community]*Holding cost at community [community])/TIME STEP
(33)
Electricity production cost from biomass [community] = Electricity production from biomass [community]*Levelized biomass to electricity conversion cost [community]
(34)
Electricity production cost from fossil fuel [community] = Electricity production from fossil fuel [community]*Levelized electricity generation cost from diesel [community]
(35)
Electricity production from biomass [community] = Biomass conversion ratio [community]*Biomass use for electricity production at community [community]*Loading factor of biomass to electricity conversion facility [community]
(36)
Electricity production from fossil fuel [community] = Electricity demand [community] − Electricity production from biomass [community]
(37)
Cost of communities could be shared with hubs[community] = Biomass distribution cost to community[community] + Biomass storage cost at community[community] + Electricity production cost from biomass[community] + Electricity production cost from fossil fuel[community]
(38)
Cost of communities could be shared with hubs[community] = Biomass distribution cost to community[community] + Biomass storage cost at community[community] + Electricity production cost from biomass[community] + Electricity production cost from fossil fuel[community]
(39)
Communities’ cost shared with hubs [community, hub] = Cost of communities could be shared with hubs [community]*Cost sharing ratio between community and hub [community, hub]
(40)
Cost sharing ratio between community and hub [community, hub] = (Biomass order by community to hub [hub, community]/Capacity of hub [hub])*Maximum cost sharing ratio between community and hub [community]*Time
(41)
0< = Maximum cost sharing ratio between community and hub [community] < = 1
(42)
Initial value of cost sharing ratio between community and hub [community] = 0
(43)
Cost of hubs[hub] = Total biomass purchase cost of hub[hub] + Biomass storage cost at hub[hub] + SUM(Communities’ cost shared with hubs[community!, hub])-SUM( Hubs’ cost shared with suppliers[hub, supplier!])
(44)
Cumulative cost of hubs = INTEG (SUM (Cost of hubs [hub!]))
(45)
Cost of communities [community] = Biomass distribution cost to community[community] + Electricity production cost from biomass[community] + Electricity production cost from fossil fuel[community] + Biomass storage cost at community[community] − SUM(Communities’ cost shared with hubs[community, hub!])
(46)
Cumulative cost of communities = INTEG [SUM (Cost of communities [community!])]
(47)
Total collective cost of supply chain = SUM (Cost of communities [community!]) + SUM (Cost of hubs [hub!])+SUM (Hubs’ cost shared with suppliers [hub!, supplier!])
(48)
Cumulative total collective cost = INTEG (Total collective cost of supply chain)
(49)
Initial value = 0
(50)
Levelized biomass to electricity conversion cost [community] = 0.046, 0.044, 0.048
(51)
Levelized electricity generation cost from diesel [community] = 0.208, 0.215, 0.207
(52)
Biomass conversion ratio [community] = 4.7, 4.8, 4.6
(53)
Capacity of biomass to electricity conversion facility [community] = 500, 500, 500
(54)
Working days = 30
(55)
Hours = 24
(56)
TIME STEP = 1

References

  1. Ghaderi, H.; Pishvaee, M.S.; Moini, A. Biomass supply chain network design: An optimization-oriented review and analysis. Ind. Crops Prod. 2016, 94, 972–1000. [Google Scholar] [CrossRef]
  2. Fan, K.; Li, X.; Wang, L.; Wang, M. Two-stage supply chain contract coordination of solid biomass fuel involving multiple suppliers. Comput. Ind. Eng. 2019, 135, 1167–1174. [Google Scholar] [CrossRef]
  3. Akhtari, S.; Sowlati, T.; Griess, V.C. Integrated strategic and tactical optimization of forest-based biomass supply chains to consider medium-term supply and demand variations. Appl. Energy 2018, 213, 626–638. [Google Scholar] [CrossRef]
  4. Mafakheri, F.; Nasiri, F. Modeling of biomass-to-energy supply chain operations: Applications, challenges and research directions. Energy Policy 2014, 67, 116–126. [Google Scholar] [CrossRef]
  5. Nasiri, F.; Zaccour, G. An exploratory game-theoretic analysis of biomass electricity generation supply chain. Energy Policy 2009, 37, 4514–4522. [Google Scholar] [CrossRef]
  6. Kaygusuz, K. Climate change and biomass energy for sustainability. Energy Sources Part B Econ. Plan. Policy 2010, 5, 133–146. [Google Scholar] [CrossRef]
  7. Mafakheri, F.; Adebanjo, D.; Genus, A. Coordinating Biomass Supply Chains for Remote Communities: A Comparative Analysis of Non-cooperative and Cooperative Scenarios. Int. J. Prod. Res. 2020, 1–37. [Google Scholar] [CrossRef]
  8. Santosh Raikar, S.A. (Ed.) 13-Renewable Energy Finance in the International Context; Renewable Energy Finance, Academic Press: Cambridge, MA, USA, 2020. [Google Scholar]
  9. Mansuy, N.; Staley, D.; Taheriazad, L. Woody Biomass Mobilization for Bioenergy in a Constrained Landscape: A Case Study from Cold Lake First Nations in Alberta, Canada. Energies 2020, 13, 6289. [Google Scholar] [CrossRef]
  10. Natural Resources Canada. Clean Energy for Rural and Remote Communities: BioHeat, Demonstration & Deployment Program Streams. 2018. Available online: https://www.nrcan.gc.ca/reducingdiesel (accessed on 12 May 2021).
  11. Balaman, Ş.Y. Biomass-Based Supply Chains and Logistics Networks. In Decision-Making for Biomass-Based Production Chains; Academic Press: Cambridge, MA, USA, 2019; pp. 55–75. [Google Scholar]
  12. Ba, B.H.; Prins, C.; Prodhon, C. Models for optimization and performance evaluation of biomass supply chains: An Operations Research perspective. Renew. Energy 2016, 87, 977–989. [Google Scholar] [CrossRef]
  13. Chan, H.K.; Chan, F.T.S. A review of coordination studies in the context of supply chain dynamics. Int. J. Prod. Res. 2010, 48, 2793–2819. [Google Scholar] [CrossRef] [Green Version]
  14. Wu, J.; Zhang, J.; Yi, W.; Cai, H.; Li, Y.; Su, Z. A Game-Theoretic Analysis of Incentive Effects for Agribiomass Power Generation Supply Chain in China. Energies 2021, 14, 546. [Google Scholar] [CrossRef]
  15. Wang, L.; Watanabe, T. A Stackelberg Game Theoretic Analysis of Incentive Effects under Perceived Risk for China’s Straw-Based Power Plant Supply Chain. Energies 2016, 9, 455. [Google Scholar] [CrossRef] [Green Version]
  16. Ye, F.; Li, Y.; Yang, Q. Designing coordination contract for biofuel supply chain in China. Resour. Conserv. Recycl. 2018, 128, 306–314. [Google Scholar] [CrossRef]
  17. Chintapalli, P.; Disney, S.M.; Tang, C.S. Coordinating Supply Chains via Advance-Order Discounts, Minimum Order Quantities, and Delegations. Prod. Oper. Manag. 2017, 26, 2175–2186. [Google Scholar] [CrossRef] [Green Version]
  18. Frascatore, M.R.; Mahmoodi, F. Cost-sharing contracts and efficiency in a two-stage supply chain. Int. J. Integr. Supply Manag. 2011, 6, 3–19. [Google Scholar] [CrossRef]
  19. Liu, R.; Dan, B.; Zhou, M.; Zhang, Y. Coordinating contracts for a wind-power equipment supply chain with joint efforts on quality improvement and maintenance services. J. Clean. Prod. 2020, 243, 118616. [Google Scholar] [CrossRef]
  20. Jiang, L.; Wang, Y.; Liu, D. Logistics cost sharing in supply chains involving a third-party logistics provider. Cent. Eur. J. Oper. Res. 2016, 24, 207–230. [Google Scholar] [CrossRef]
  21. Forrester, J.W. Industrial Dynamics. J. Oper. Res. Soc. 1997, 48, 1037–1041. [Google Scholar] [CrossRef]
  22. Bala, B.K.; Arshad, F.M.; Noh, K.M. System Dynamics. Modelling and Simulation; Springer: Singapore, 2017. [Google Scholar]
  23. Angerhofer, B.J.; Angelides, M.C. System Dynamics Modelling in Supply Chain Management: Research Review. In Proceedings of the 2000 Winter Simulation Conference Proceedings (Cat. No. 00CH37165), Orlando, FL, USA, 10–13 December 2000; IEEE: Piscataway, NJ, USA, 2000; pp. 342–351. [Google Scholar]
  24. Bhushi, U.M.; Javalagi, C.M. System Dynamics application to Supply Chain Management: A review. In Proceedings of the 2004 IEEE International Engineering Management Conference (IEEE Cat. No.04CH37574), Singapore, 18–21 October 2004; pp. 1244–1248. [Google Scholar]
  25. Bala, B.K.; Bhuiyan, M.G.K.; Alam, M.M.; Arshad, F.M.; Sidique, S.F.; Alias, E.F. Modelling of supply chain of rice in Bangladesh. Int. J. Syst. Sci. Oper. Logist. 2017, 4, 181–197. [Google Scholar] [CrossRef]
  26. Mafakheri, F.; Nasiri, F. Revenue sharing coordination in reverse logistics. J. Clean. Prod. 2013, 59, 185–196. [Google Scholar] [CrossRef]
  27. Ahmad, S.; Tahar, R.M.; Muhammad-Sukki, F.; Munir, A.B.; Abdul Rahim, R. Application of system dynamics approach in electricity sector modelling: A review. Renew. Sustain. Energy Rev. 2016, 56, 29–37. [Google Scholar] [CrossRef]
  28. Ricardo Saavedra, M.M.; Cristiano, C.H.; Francisco, F.G. Sustainable and renewable energy supply chain: A system dynamics overview. Renew. Sustain. Energy Rev. 2018, 82, 247–259. [Google Scholar] [CrossRef]
  29. Nasiri, F.; Mafakheri, F.; Adebanjo, D.; Haghighat, F. Modeling and analysis of renewable heat integration into non-domestic buildings—The case of biomass boilers: A whole life asset-supply chain management approach. Biomass Bioenergy 2016, 95, 244–256. [Google Scholar] [CrossRef]
  30. Azadeh, A.; Arani, H.V. Biodiesel supply chain optimization via a hybrid system dynamics-mathematical programming approach. Renew. Energy 2016, 93, 383–403. [Google Scholar] [CrossRef]
  31. Tama, I.P.; Akbar, Z.; Eunike, A. Implementation of system dynamic simulation method to optimize profit in supply chain network of vegetable product. IOP Conf. Ser. Mater. Sci. Eng. 2018, 337, 012014. [Google Scholar] [CrossRef]
  32. Feng, Y. System Dynamics Modeling for Supply Chain Information Sharing. Phys. Procedia 2012, 25, 1463–1469. [Google Scholar] [CrossRef]
  33. Khaji, M.R.; Shafaei, R. A system dynamics approach for strategic partnering in supply networks. Int. J. Comput. Integr. Manuf. 2011, 24, 106–125. [Google Scholar] [CrossRef]
  34. Rendón-Sagardi, M.A.; Sánchez-Ramirez, C.; Cortás-Robles, G.; Alor-Hernández, G.; Moncayo-Martínez, L.A. Dynamic Evaluation of Production Policies: Improving the Coordination of an Ethanol Supply Chain. J. Appl. Res. Technol. 2014, 12, 724–733. [Google Scholar] [CrossRef] [Green Version]
  35. Spelter, H.; Toth, D. North America’s Wood Pellet Sector; United States Department of Agriculture: Madison, WI, USA, 2009; Volume FPL-RP-656, p. 23. [Google Scholar]
  36. Mobini, M.; Meyer, J.C.; Trippe, F.; Sowlati, T.; Fröhling, M.; Schultmann, F. Assessing the integration of torrefaction into wood pellet production. J. Clean. Prod. 2014, 78, 216–225. [Google Scholar] [CrossRef]
  37. Mobini, M.; Sowlati, T.; Sokhansanj, S. A simulation model for the design and analysis of wood pellet supply chains. Appl. Energy 2013, 111, 1239–1249. [Google Scholar] [CrossRef]
  38. Forrester, J.W. System dynamics, systems thinking, and soft OR. Syst. Dyn. Rev. 1994, 10, 245–256. [Google Scholar] [CrossRef]
  39. Bayer, S. Systems Thinking and Modeling for a Complex World; McGraw-Hill Education: New York, NY, USA, 2004; Volume 34. [Google Scholar]
  40. VENSIM. The Ventana Simulation Environment (VENSIM)—Version 8.1.2; Ventana Syst. Inc.: Harvard, MA, USA, 2020. [Google Scholar]
  41. National Energy Board. Canada’s Energy Future 2016 Energy Supply and Demand Projections to 2040; National Energy Board: Calgary, AB, Canada, 2016; pp. 1–9. [Google Scholar]
  42. Besset, D.H. Object-Oriented Implementation of Numerical Methods: An Introduction with Java & Smalltalk; Square Bracket Associates: Kehrsatz, Switzerland, 2001. [Google Scholar]
  43. Vazifeh, Z.; Mafakheri, F.; An, C. Biomass supply chain coordination for remote communities: A game-theoretic modeling and analysis approach. Sustain. Cities Soc. 2021, 69, 102819. [Google Scholar] [CrossRef]
  44. International Energy Agency. Options for Increased Use of Ash from Biomass Combustion and Co-firing. 2018. Available online: https://www.ieabioenergy.com/wp-content/uploads/2019/02/IEA-Bioenergy-Ash-management-report-revision-5-november.pdf (accessed on 12 May 2021).
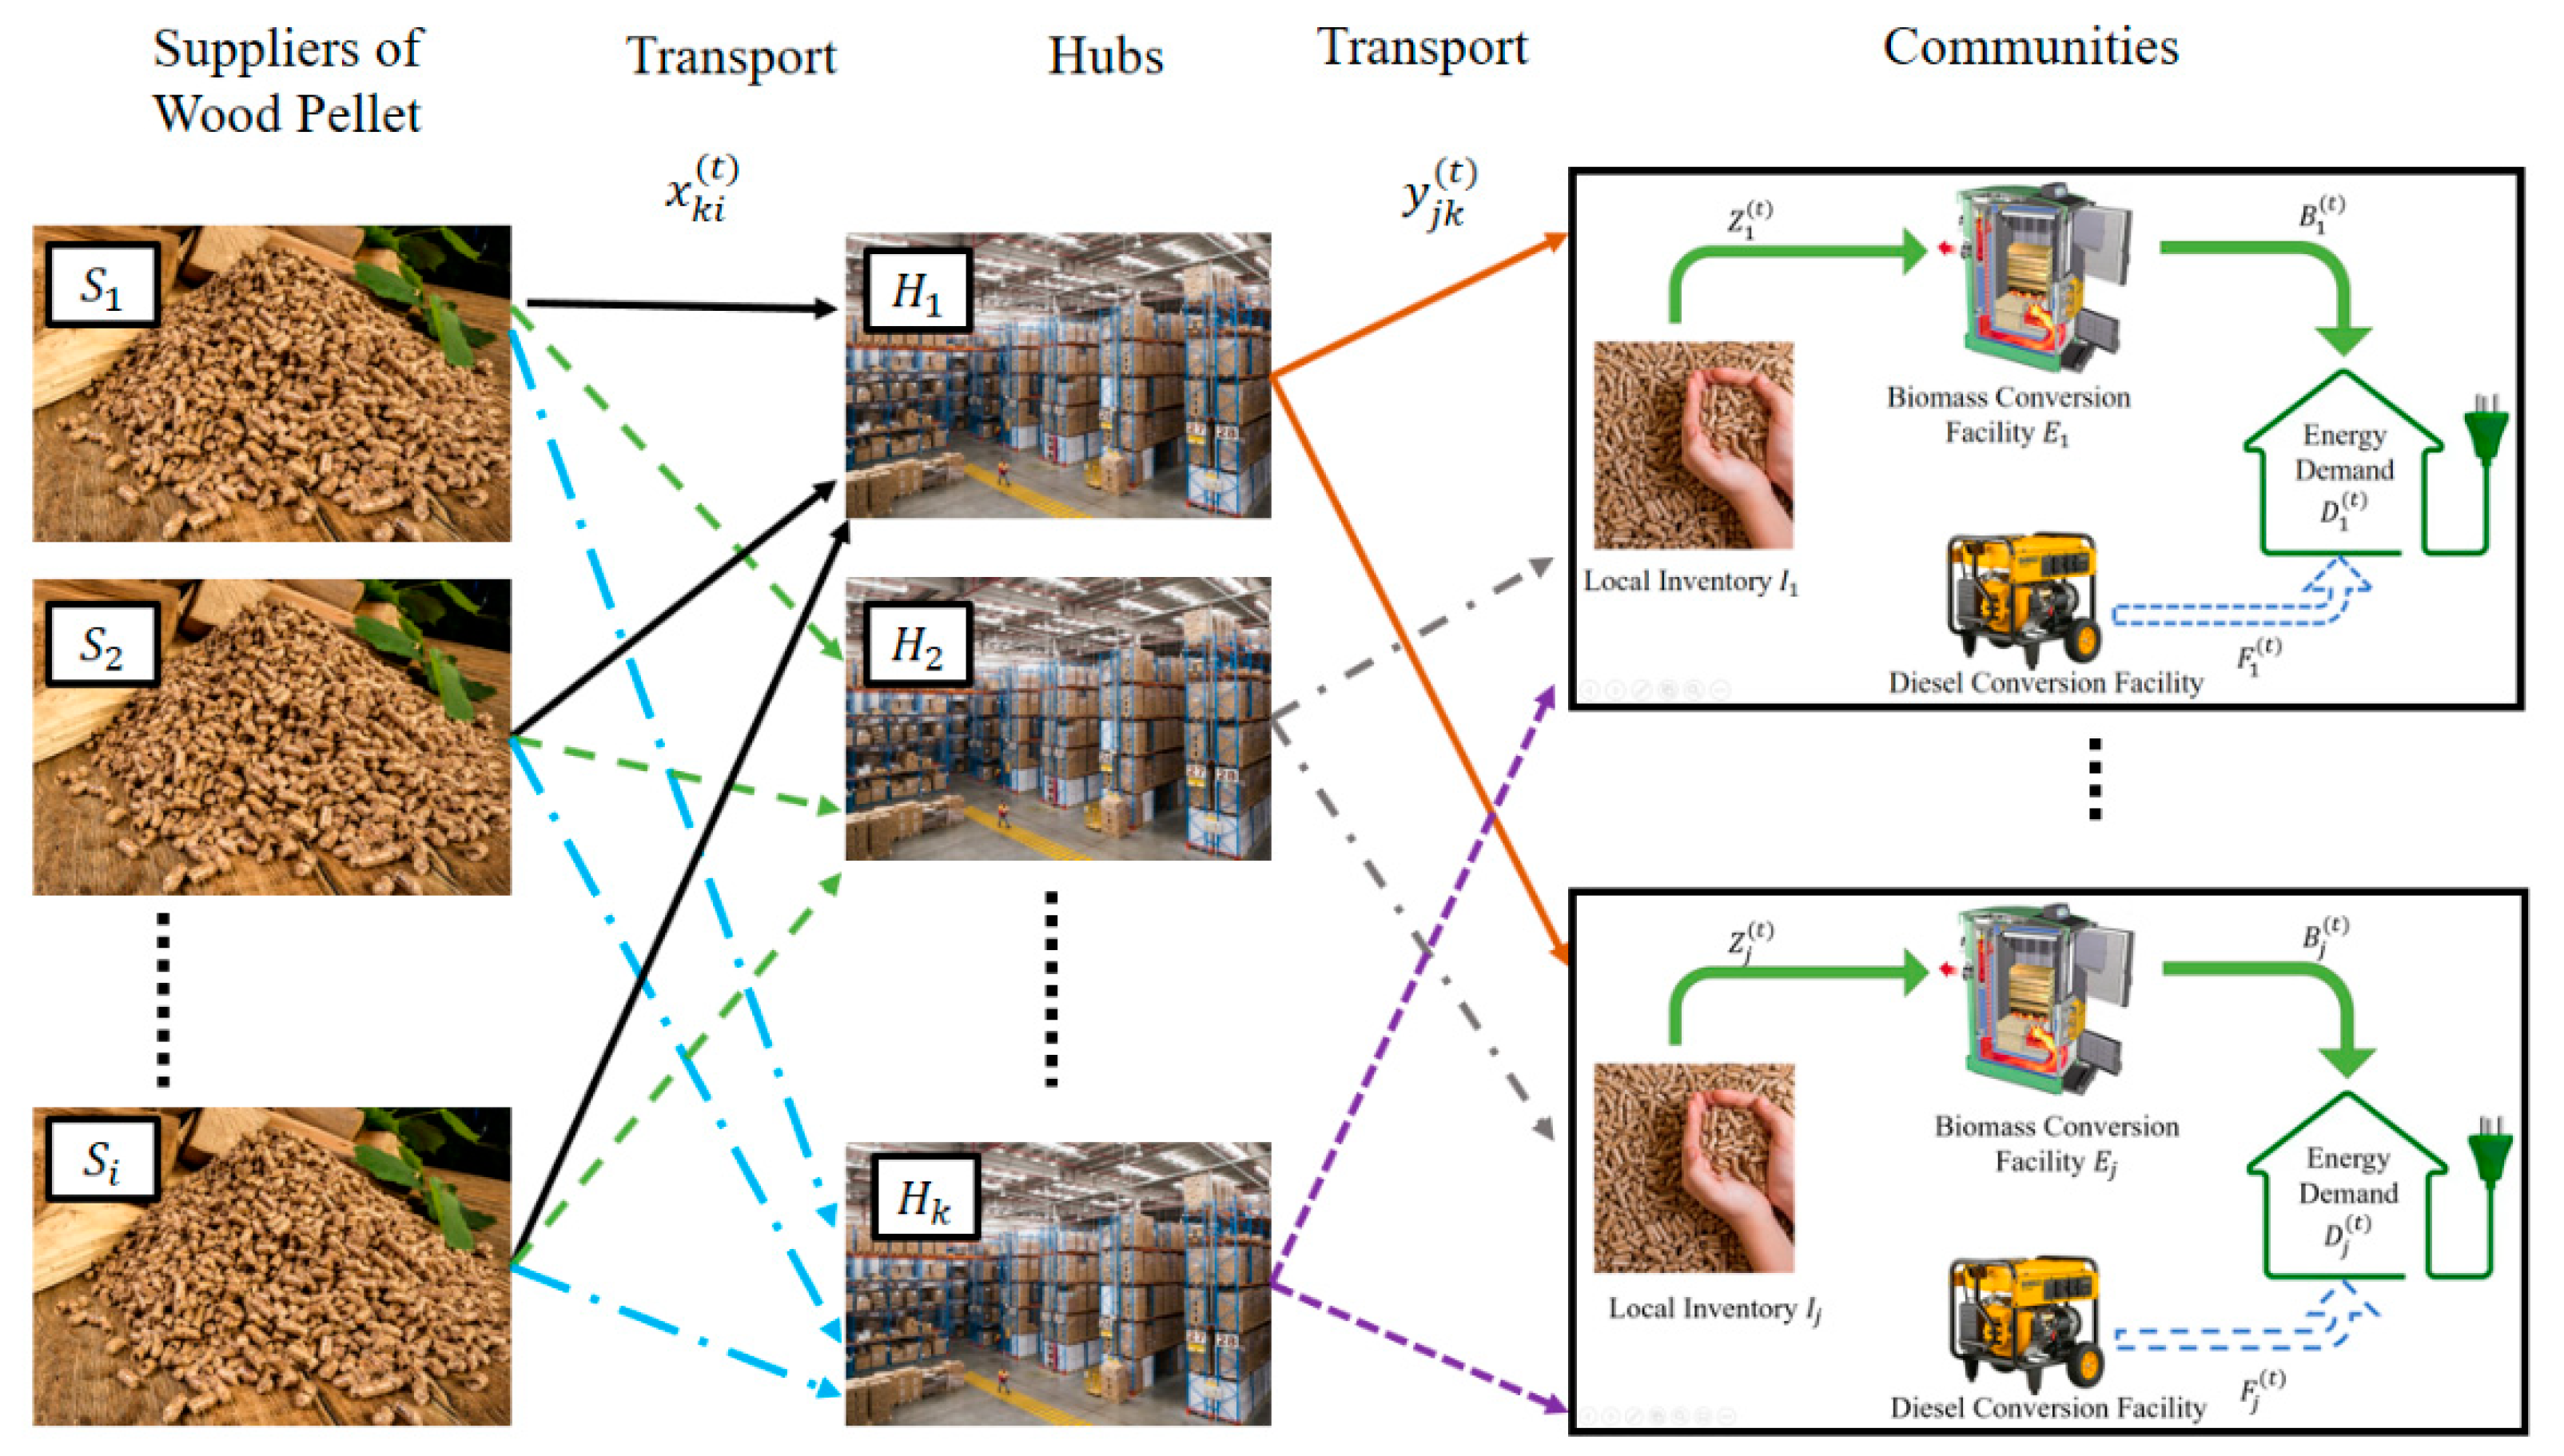
Figure 1. The structure of biomass supply chain for electricity generation.
Energies 14 02808 g001
Figure 2. Biomass coordination scenarios.
Energies 14 02808 g002
Figure 3. Causal loop diagram of quantity discounts strategy in biomass supply chain.
Energies 14 02808 g003
Figure 4. Causal loop diagram of cost sharing strategy in biomass supply chain.
Energies 14 02808 g004
Figure 5. System dynamics model of biomass supply chain coordination under quantity discounts strategy.
Energies 14 02808 g005
Figure 6. System dynamics model of biomass supply chain coordination under cost sharing strategy.
Energies 14 02808 g006
Figure 7. Locations of case study communities and hubs.
Energies 14 02808 g007
Figure 8. Optimal biomass orders to supplier and hub.
Energies 14 02808 g008
Figure 9. Hub and community inventory levels.
Energies 14 02808 g009
Figure 10. Biomass utilization and stock levels at community (KA).
Energies 14 02808 g010
Figure 11. Electricity production schedule from alternative sources.
Energies 14 02808 g011
Figure 12. Electricity production costs from alternative sources and in total.
Energies 14 02808 g012
Figure 13. Biomass order to supplier and the corresponding supplier’s price.
Energies 14 02808 g013
Figure 14. Biomass order to hub and the corresponding hub’s price.
Energies 14 02808 g014
Figure 15. Biomass order to a supplier and the corresponding cost sharing with a supplier.
Energies 14 02808 g015
Figure 16. Biomass order to a hub and the corresponding cost sharing with a hub.
Energies 14 02808 g016
Figure 17. Cumulative cost of hubs.
Energies 14 02808 g017
Figure 18. Cumulative cost of communities.
Energies 14 02808 g018
Figure 19. Cumulative cost of suppliers in coordination scenarios.
Energies 14 02808 g019
Figure 20. Sensitivity of cumulative cost of hubs and communities under quantity discount and cost sharing scenarios with variation in biomass price.
Energies 14 02808 g020
Figure 21. Sensitivity of cumulative cost of hubs and communities under quantity discount and cost sharing scenarios with variation in storage capacities.
Energies 14 02808 g021
Figure 22. Cumulative costs with variations in price for (a) suppliers in case of more expensive biomass type, (b) suppliers in case of cheaper biomass type, (c) hubs in case of more expensive biomass type, (d) hubs in case of cheaper biomass type, (e) communities in case of more expensive biomass type, (f) communities in case of cheaper biomass.
Energies 14 02808 g022aEnergies 14 02808 g022b
Figure 23. Cumulative costs with variations in storage capacities for (a) suppliers in case of larger storage capacities, (b) suppliers in case of smaller storage capacities, (c) hubs in case of larger storage capacities, (d) hubs in case of smaller storage capacities, (e) communities in case of larger storage capacities, and (f) communities in case of smaller storage capacities.
Energies 14 02808 g023
Figure 24. Cumulative costs with variations in communities’ size for (a) suppliers in case of larger communities, (b) suppliers in case of smaller communities, (c) hubs in case of larger communities, (d) hubs in case of smaller communities, (e) communities in case of larger communities, and (f) communities in case of smaller communities.
Energies 14 02808 g024
Figure 25. Cumulative costs with more players at each level for (a) suppliers, (b) hubs, and (c) communities.
Energies 14 02808 g025aEnergies 14 02808 g025b
Publisher’s Note: MDPI stays neutral with regard to jurisdictional claims in published maps and institutional affiliations.