
A Multi-Objective Approach toward Optimal Design of Sustainable Integrated Biodiesel/Diesel Supply Chain Based on First- and Second-Generation Feedstock with Solid Waste Use †

Abstract
1. Introduction
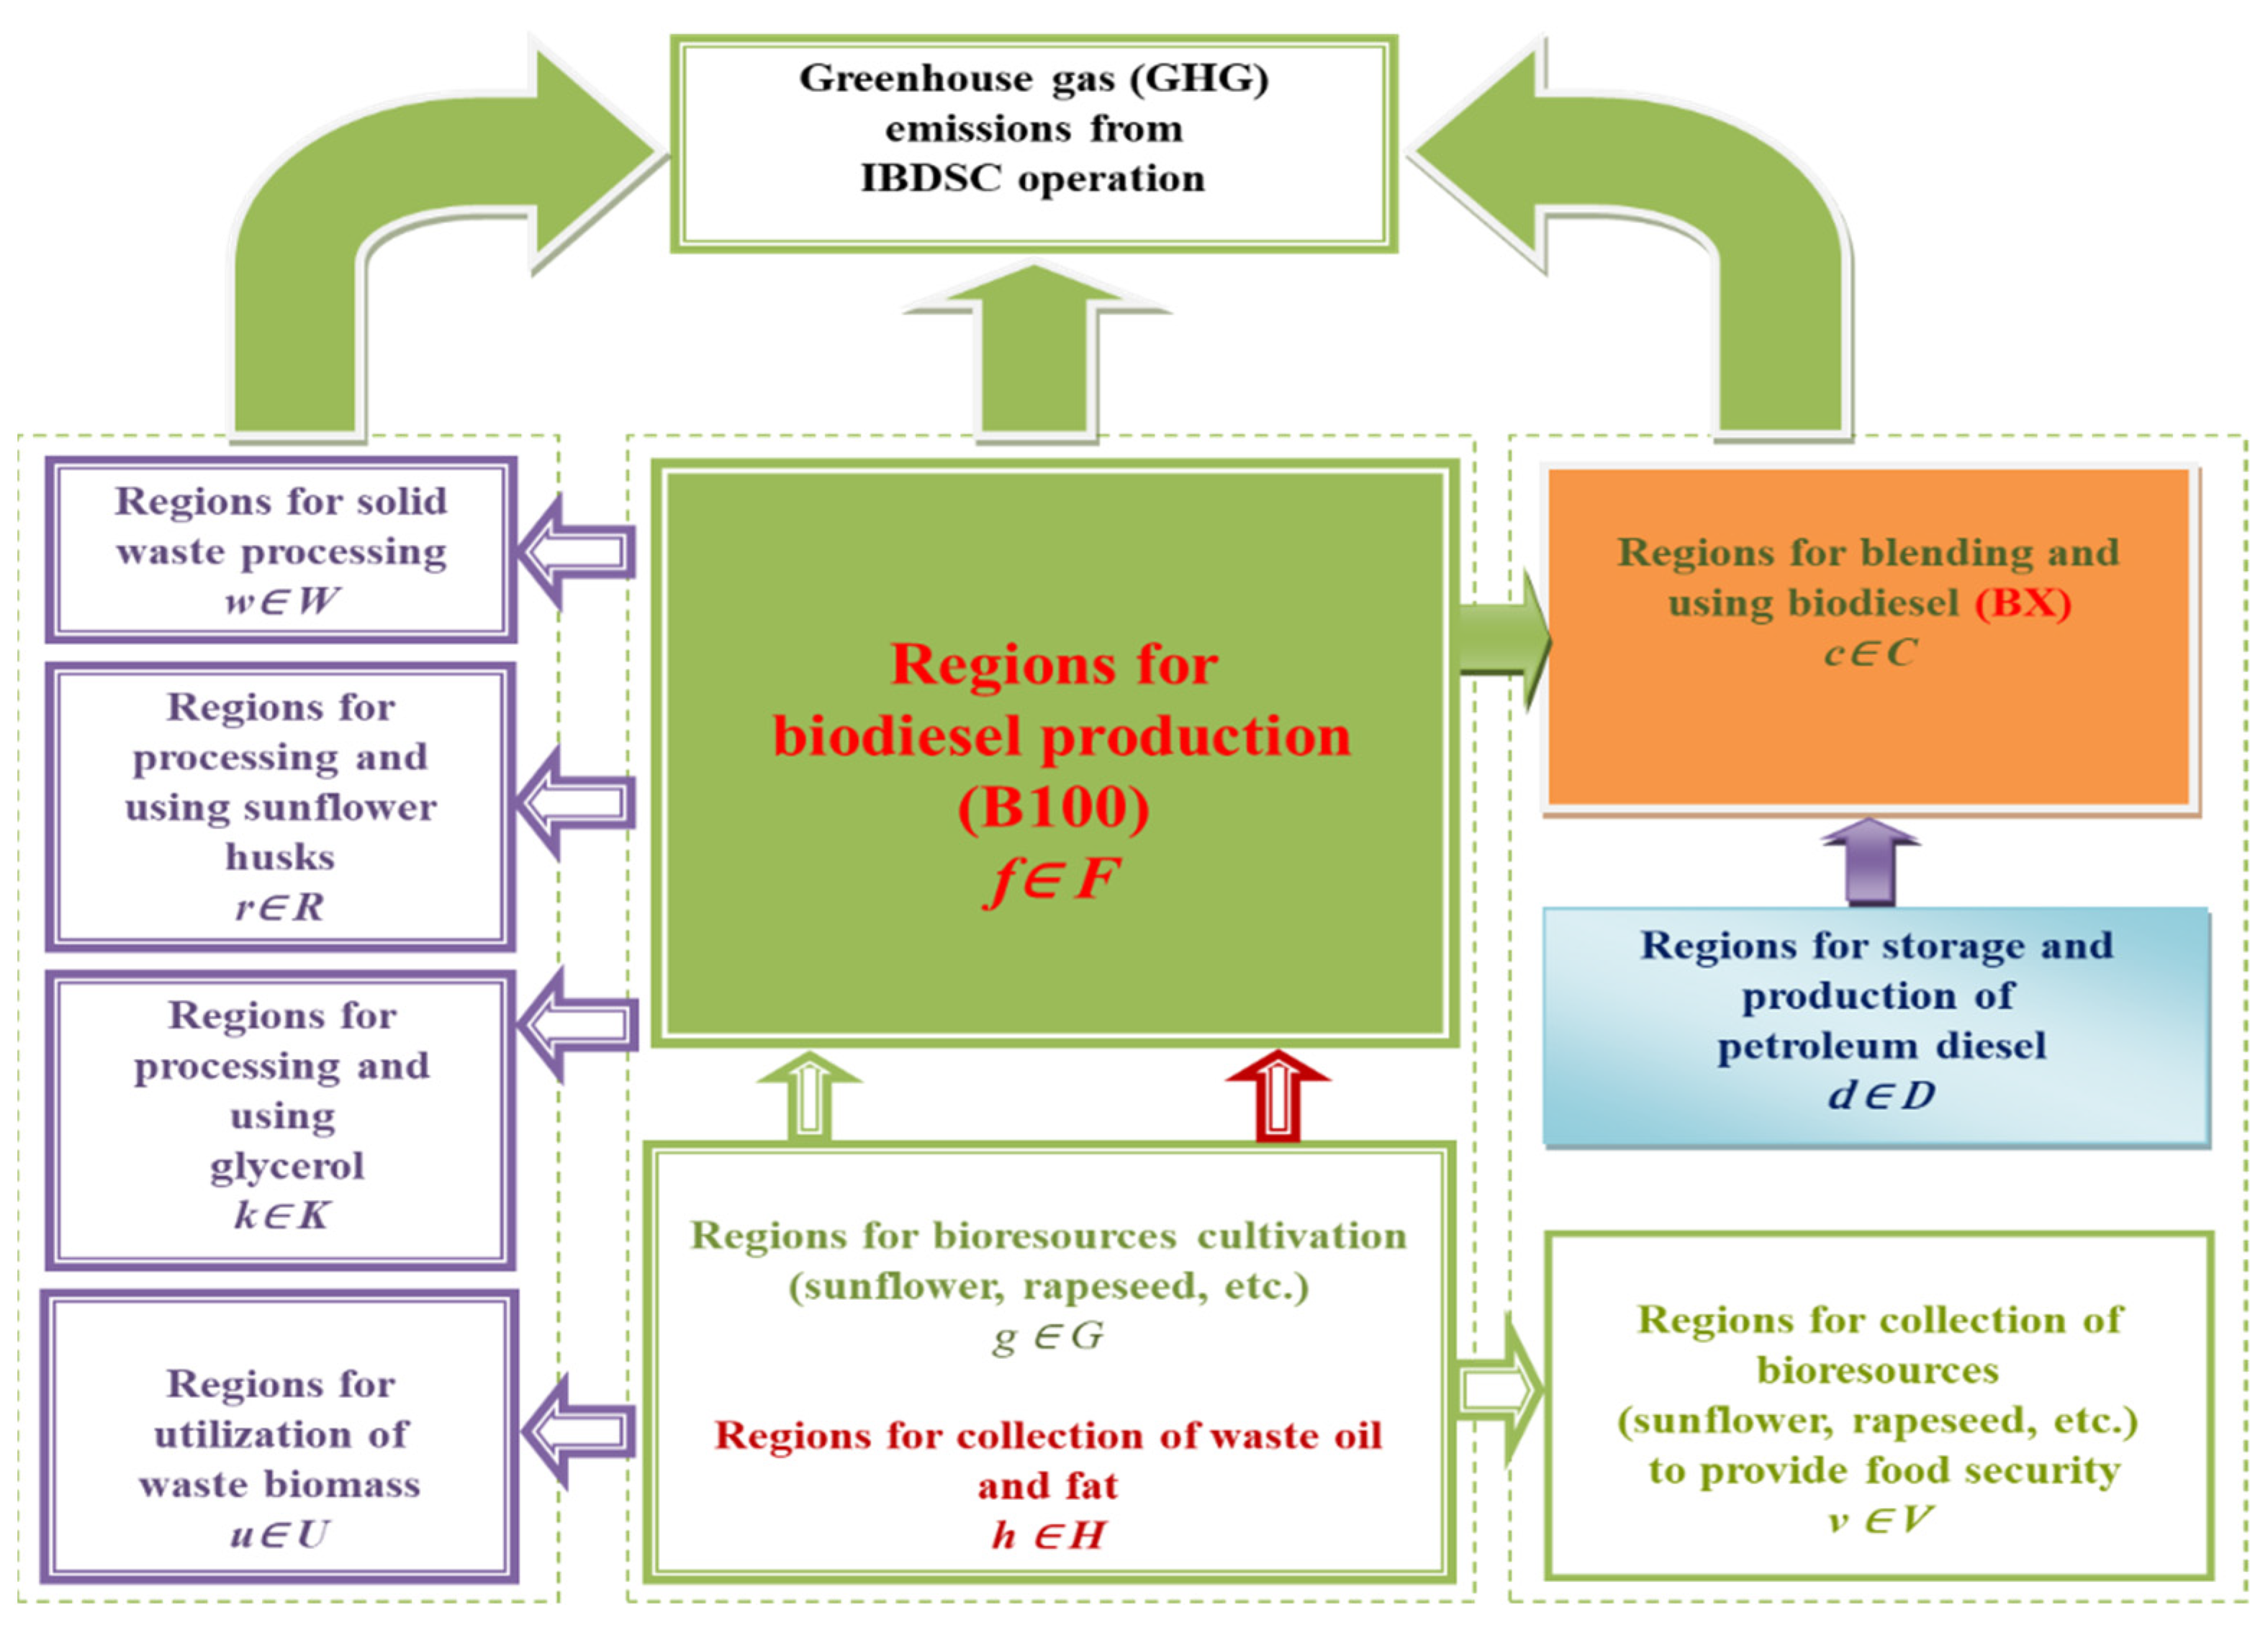
2. Problem Description
- A set of biomass production areas where different types of feedstocks are used for biorefineries.
- A set of adopted initiatives for the implementation of plants for the production of biodiesel with different capacities.
- A set of blending and sales areas where final products meeting certain requirements are sold.
- A set of existing refineries for petroleum diesel fuel.
- Potential locations of the centers for realization of biofuels;
- Diesel demand for each of the fuel search centers;
- Relevant requirements for the percentage of biodiesel as a constituent of diesel fuel during the considered period of time;
- Types of biomass and their geographical availability;
- Costs for the cultivation of a unit of biomass for each type of raw material;
- Unit cost of biodiesel according to the type of raw material;
- Characteristics of the transport logistics (costs, modes);
- Capital investment costs of biodiesel production facilities;
- Specific emission factors of greenhouse gases during the life cycle stages of biodiesel production;
- Carbon tax;
- Government incentives for the production and the use of biodiesel.
- Supply chain (SC) structure;
- Time for biomass cultivation for each type of biomass and biodiesel production;
- Locations of biodiesel production facilities and locations of biomass cultivation sites;
- Biomass and biodiesel flows of each type between regions;
- Type of transport for the supply of biomass, biodiesel and petroleum diesel;
- GHG emissions at each stage of the life cycle of the products;
- Amounts transported for each transport connection and transport mode;
- Strategy for biomass supply of the production facilities;
- Processes of distribution of biofuels and diesel fuel, delivered in the demand areas.
3. Formulation of the Optimization Problem
3.1. Mathematical Modeling of the Environmental Impact Performance of IBDSC
- Stage of biomass production. This consists of different sub-stages depending on the type of bioresource and subsequent use.
- Stage of biomass transportation. This refers to the delivery of biomass to the processing facility.
- Stage of biomass conversion into biodiesel.
- Stage of transportation of biodiesel (B100) and petroleum diesel fuel to blending areas for diesel fuel and customers.
- Stage of final biofuel consumption-a stage in which the biofuel is introduced into the engine of the vehicle and is burned to provide mechanical energy for mobility.
- Biomass cultivation ;
- Biodiesel production (B100) ;
- Petroleum diesel production ;
- Solid waste use ;
- Biomass transportation ;
- Biodiesel transportation (B100) ;
- Petroleum diesel transportation ;
- Solid waste transportation ;
- Straw transportation ;
- Transportation of sunflower/rapeseed for food security ;
- The use of biodiesel in vehicles (B100) and diesel ;
- Use of WCO, when not used for biodiesel (B100) .
- Environmental impact of biomass cultivation ,
- Environmental impact of biodiesel production ,
- Environmental impact of petroleum diesel production ,
- Environmental impact of transportation ,
- Environmental impact of waste solids use ,
- GHG emissions released if waste solids use realizes in biodiesel plant ,
- Environmental impact of straw use ,
- Environmental impact of the use of biodiesel (B100) and petroleum diesel during transportation ,
- Environmental impact of WCO use if not used for biodiesel (B100) production ,
3.2. Mathematical Modeling of Economic Performance of IBDSC
- Total costs of IBDSC per year, ;
- Total investment costs for IBDSC production capacity compared to the period of operation and the purchase of the plant for a year,
- Total investment costs for IBDSC solid waste treatment plants compared to the period of operation and the purchase of the plant per year, ];
- Production costs in biodiesel production (B100),
- Production costs for solid waste disposal, ;
- Total transportation costs of IBDSC, ;
- Carbon tax charged according to the total amount , generated during the operation of IBDSC, ;
- Government incentives for biodiesel production and consumption (B100), ;
- Total value of by-products (glycerol, cake), ;
- Price of the unused portion of WCO in the production of biodiesel (B100), which is considered to be a penalty function. (This unused portion of the WCO is considered to be a pollutant, the amount of which should be minimized).
- Investment costs for biorefineries ,
- Investment costs for solid waste use plants ,
- Total production costs of IBDSC ,
- Total costs of solid waste processing ,
- Total transportation costs ,
- Carbon tax ,
- is the IBDSC operating period for one year, .
- Government incentives costs for biodiesel (B100) production,
- Total costs of selling straw for other purposes,
- Total costs for by-products (glycerin and cake),
- Price, obtained from the sale of glycerol obtained from the i-th raw material (glycerol in the production of soap)
- Price, obtained from the sale of cake obtained from the i-th raw material (animal feed cake)
- Price of unused WCO for biodiesel (B100) production.
3.3. Mathematical Modeling of Social Performance of IBDSC, ,
- -the number of jobs created during the building biodiesel (B100) and solid waste plants;
- -the number of jobs created during the operation of the biodiesel (B100) and solid waste plants;
- -the number of jobs created during the bioresources cultivation for the biodiesel (B100) production. They determine as follows:
3.4. Constraints
3.4.1. Plants Capacity Constraints
3.4.2. Balance of Biodiesel (B100) to Be Produced from Biomass Available in the Regions
3.4.3. Admissibility of Flows during Operation of IBDSC
3.4.4. Constraints Providing the Supply of Straw to the Regions for Technical Needs
3.4.5. Constraints Providing the Supply of Grain to Regions to Provide Food Security
3.4.6. Constraints on the Facilities for Use of Solid Waste
3.4.7. Logical Constraints
- Constriants providing that in a given region a plant can be built for biodiesel (B100) production.
- Constraints providing that in a given region only one plant will be built with size for solid waste use:
- Constraints providing a possible connection between regions producing raw materials only in a certain region:
- Constraints providing that petroleum diesel produced in region is transported from region to using transport for the given interval when petroleum diesel is currently being produced in the region during the same time interval:
- Constraints providing that each region producing bioreasource will be connected to at least one biodiesel (B100) plant:
- Constraints providing that each plant for biodiesel (B100) production will be connected to at least one area for blending and consumption:
- Constraints providing that each plant for solid waste processing will be connected to at least one plant for biodiesel (B100) production:
- Constraints providing that solid waste produced from a given biorefinary will be processed in only one of the plants for use:
3.4.8. Constraints on Transportation
- The amount transported between different regions is limited by upper and lower boundaries, as follows:
- Constraints that provide flowrate eligibility for biomass and biofuel:
- -
- Constraint for biomass flowrate
- -
- Constraint for biomass flowrate
3.4.9. Constraints for Design of IBDSC
3.4.10. Constraints on the Overall Environmental Impact of All Regions
3.4.11. Constraints on Arable Land
- Constraints on cereal yields for food security
3.4.12. Constraints on Crop Rotation
3.4.13. Constraints on Energy Balances
- Constraints providing the overall energy balance in the region.
- Constraints providing the overall energy balance in each consumer area
- Constraints providing the required amount of fuel is provided for each region
3.4.14. Constraints on Total Costs of IBDSC
3.5. Optimization Criteria Formulation
3.5.1. Economic Objective Function
3.5.2. Environmental Objective Function
3.5.3. Social Objective Function
3.6. Formulation of the Optimization Problem
- Structure of the SC network, which includes number, size and location of the biorefineries;
- Localization of the areas for biomass cultivation and biodiesel (B100) production;
- Mass flows of biomass and biodiesel between different areas;
- Type of transport for delivery of biomass and biodiesel;
- Amounts of GHG emissions generated at each stage of the life cycle of the biodiesel production;
- Amounts of transport for each transport connection and mode of transportation;
- Distribution of the biodiesel in blending areas.
- Economic sustainability ( or ) (70, 71): Minimization of the total logistics costs of the supply chain, taking into account fixed and variable costs .
- Environmental sustainability ( or ) (72, 73): Minimization of the total amount of GHG emissions, calculated in units [ or $] of equivalent carbon dioxide emissions [].
- Social sustainability (74): Determining the required number of jobs to ensure sustainable implementation of the activities of the IBDSC ].
- Minimization of GHG emissions, []
- Minimization of total annual costs, []
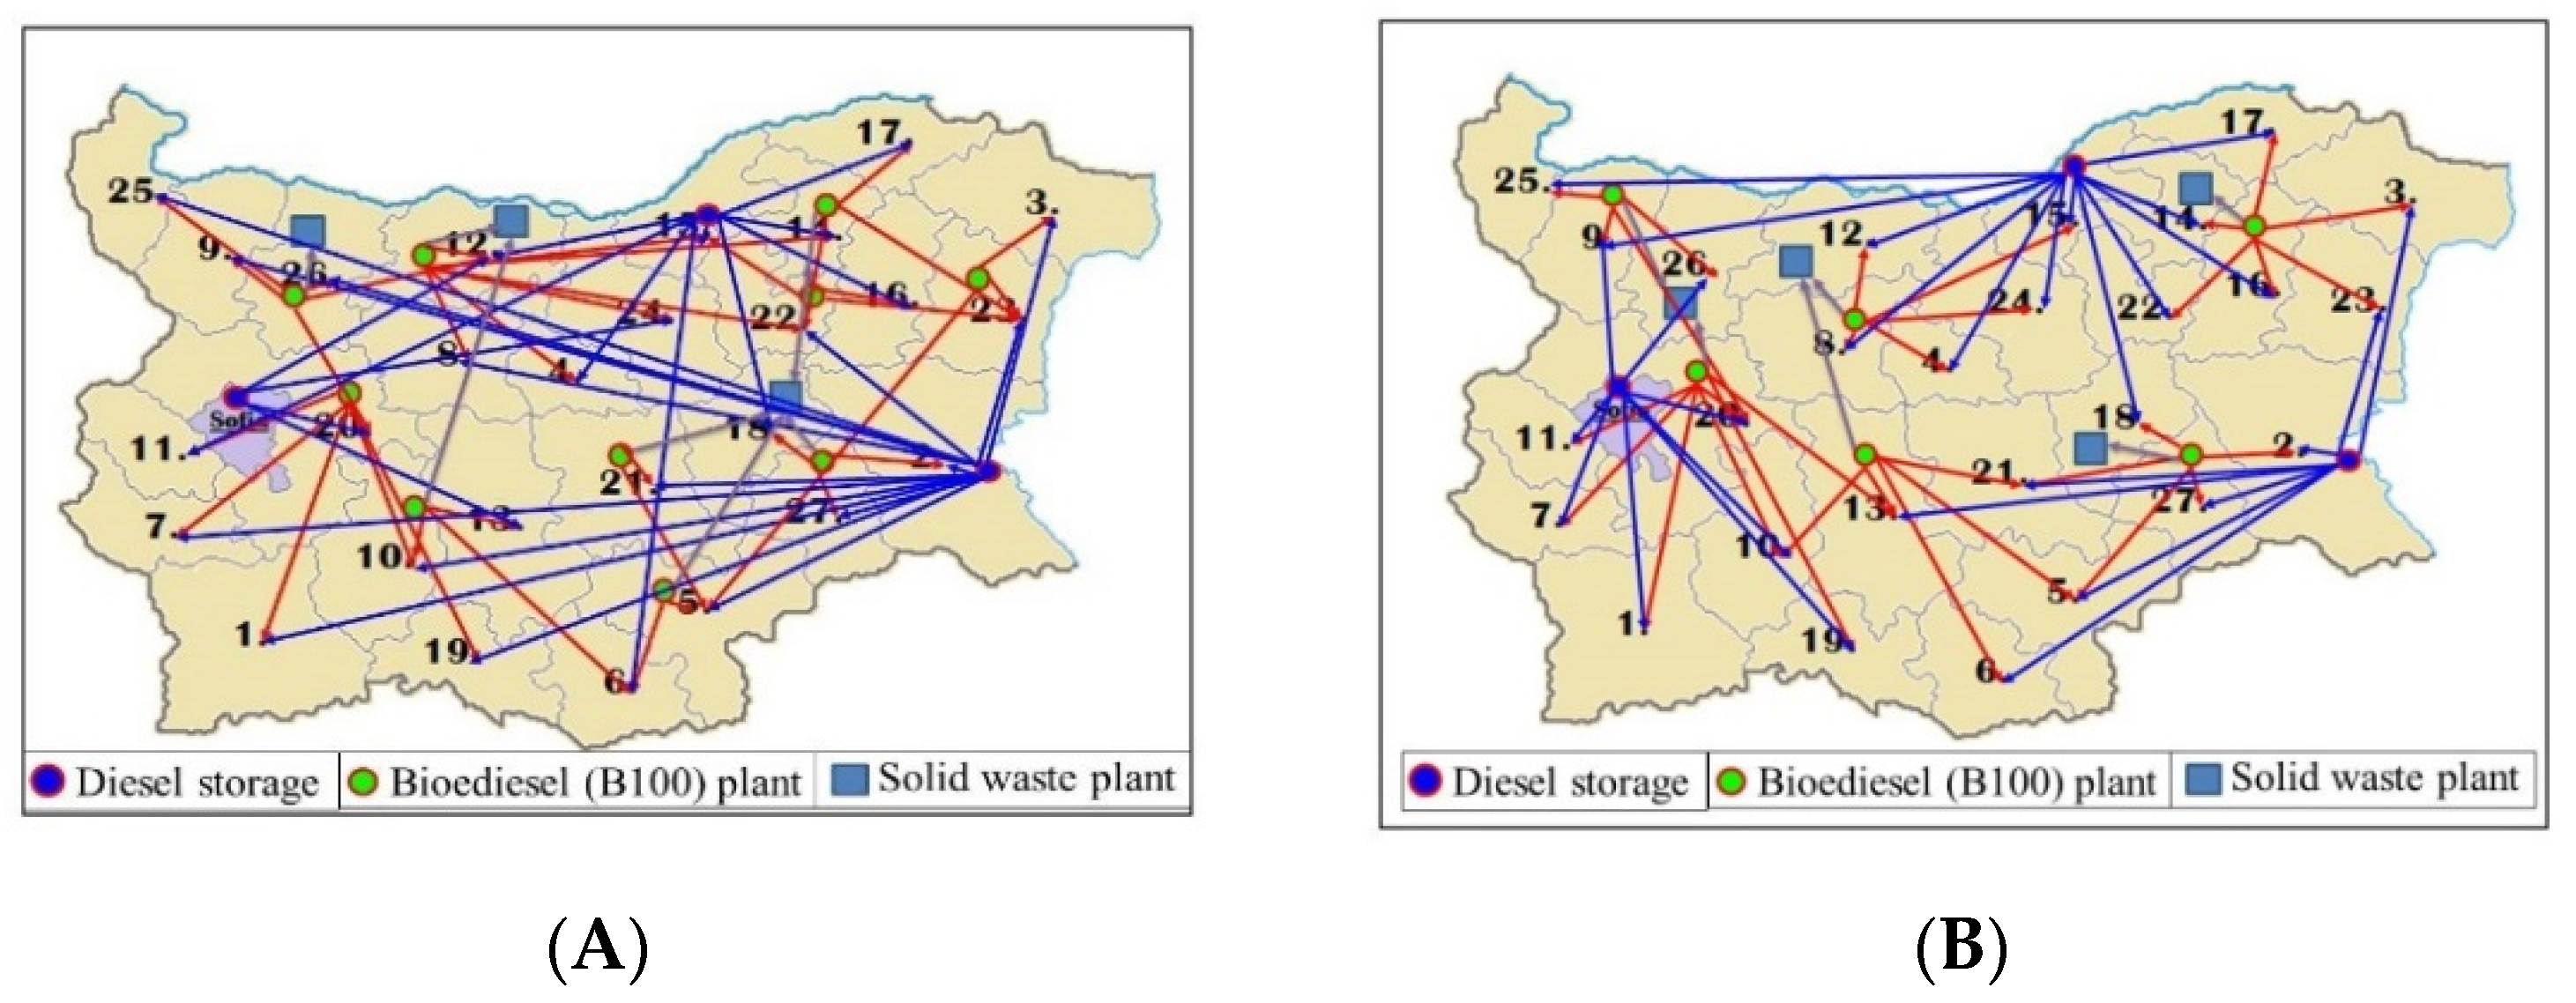
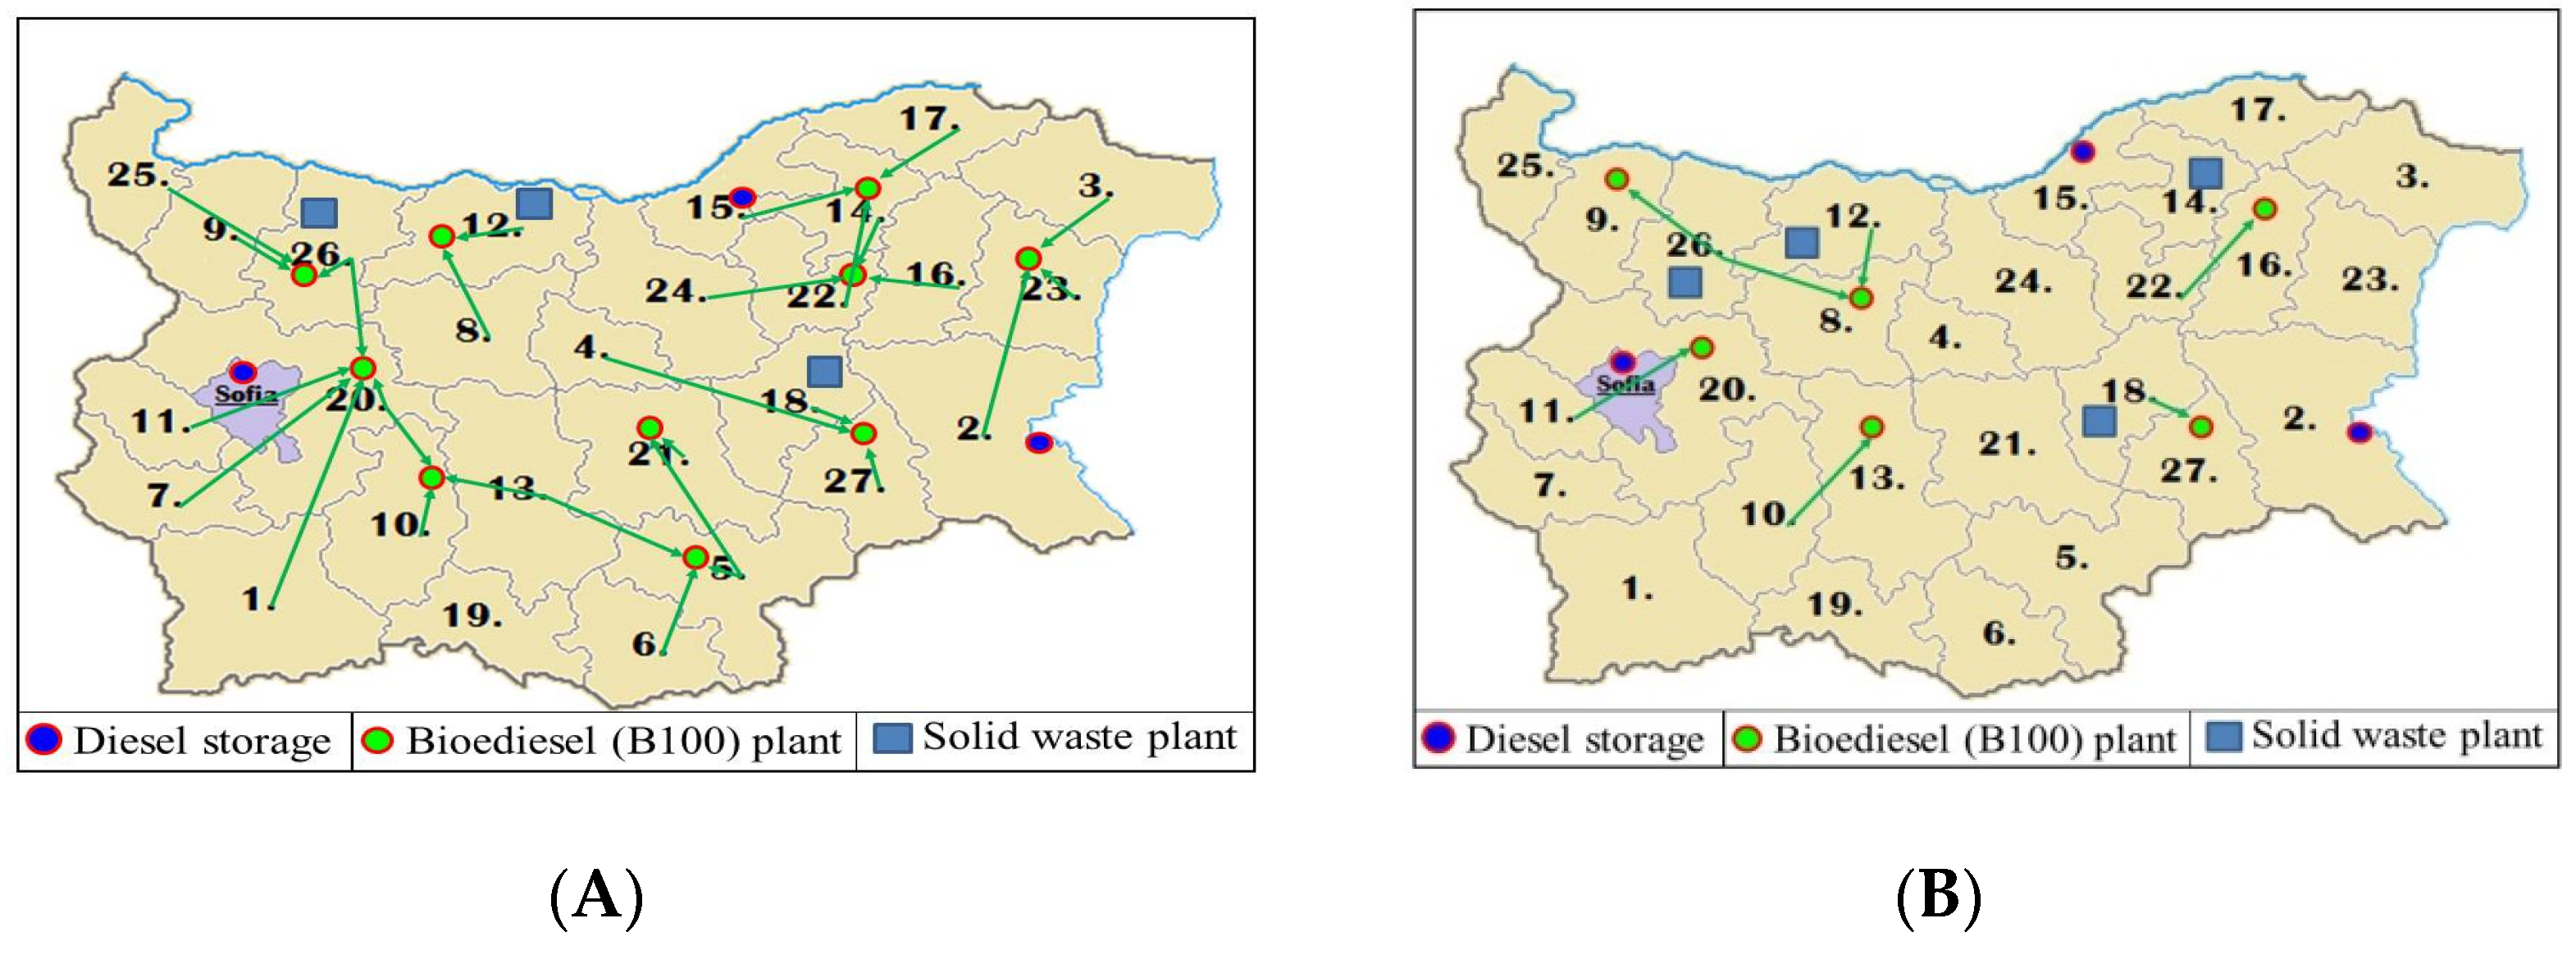
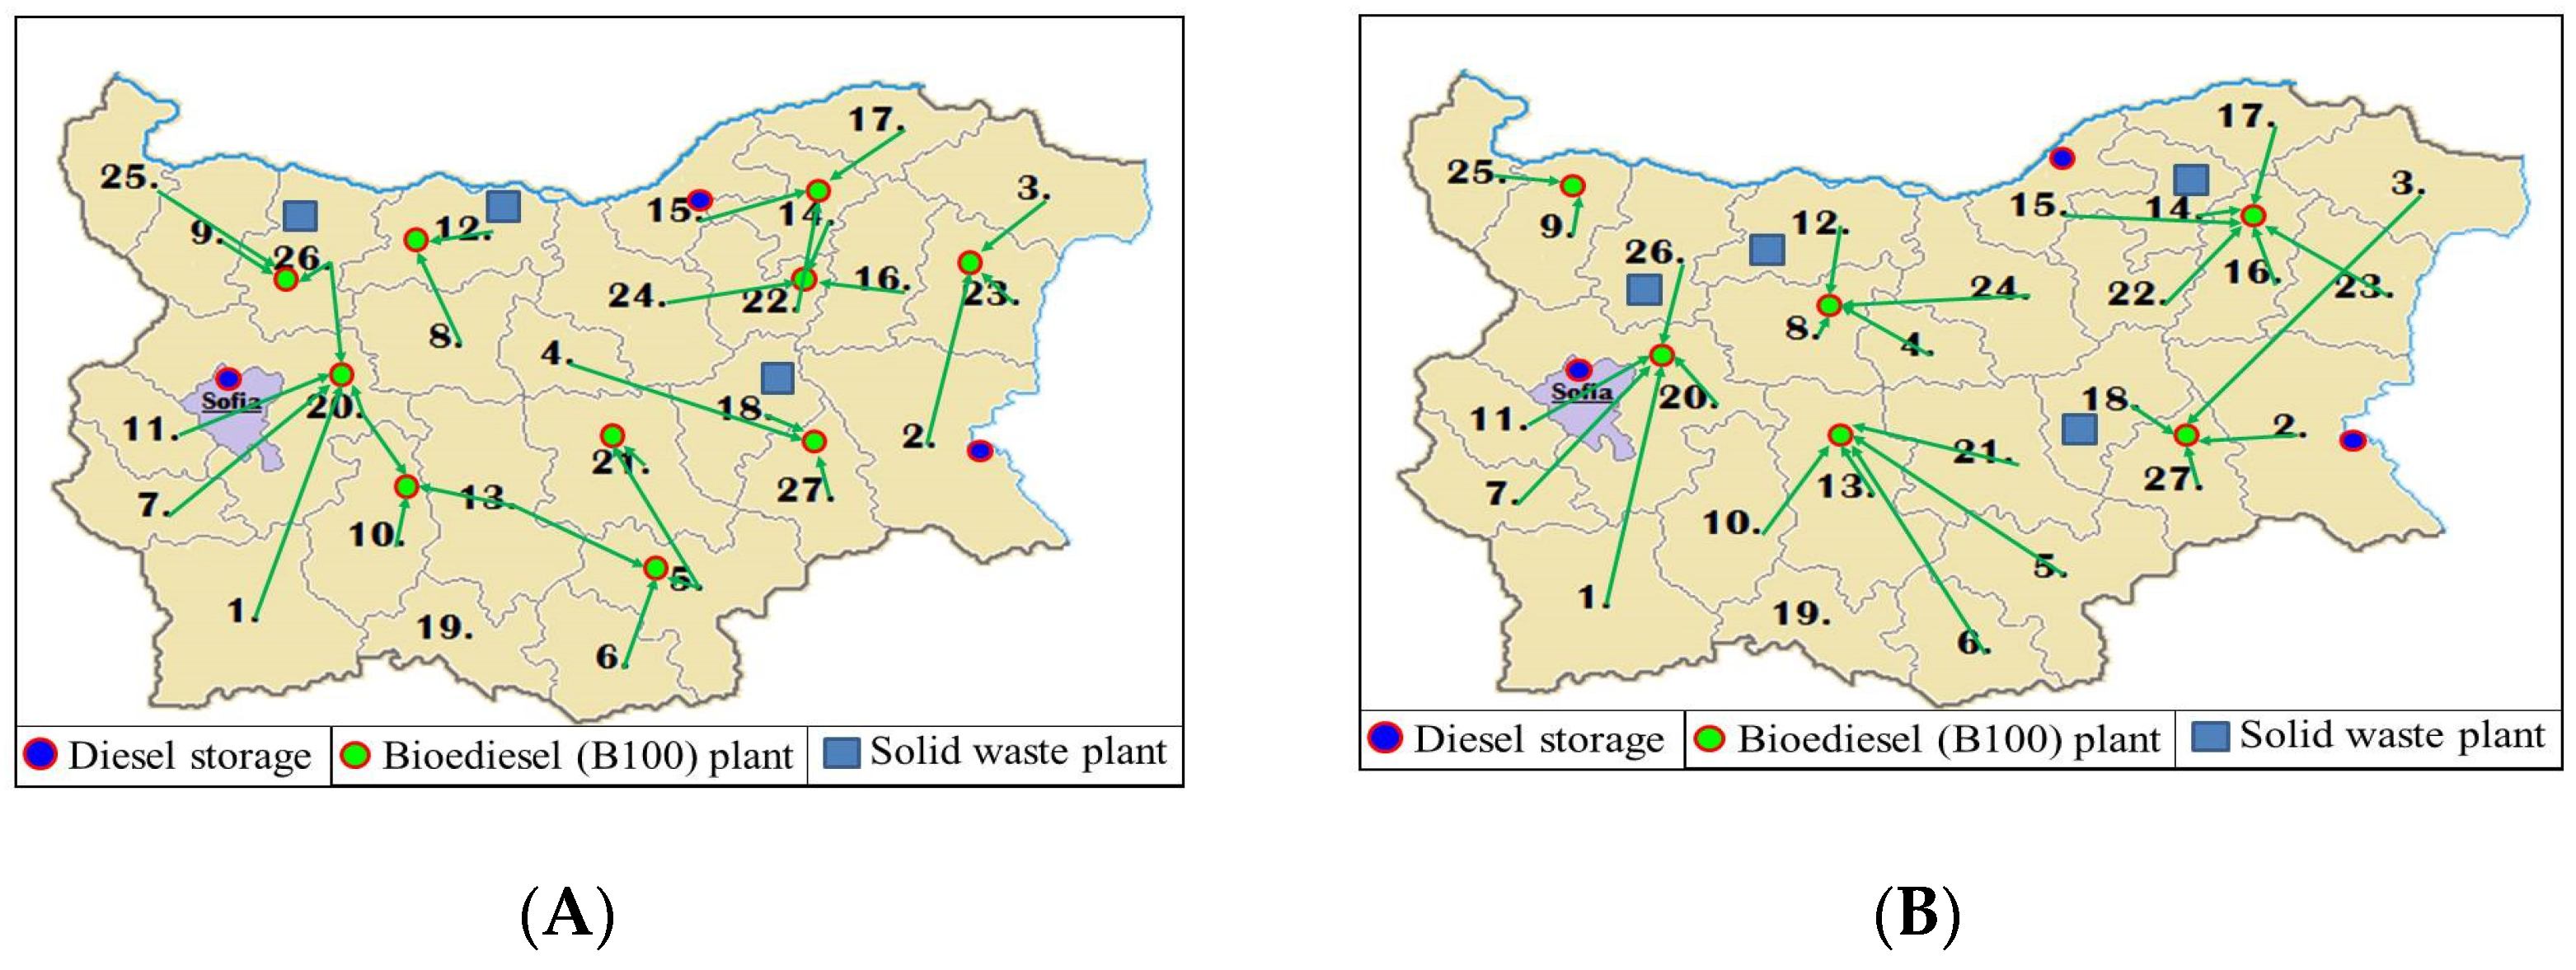
4. Case Study
4.1. Input Data
4.2. Computational Results and Analysis
5. Conclusions
- The available agricultural land in Bulgaria meets the needs for production of a sufficient amount of first-generation feedstock for the production of the required amount of biodiesel (B100) in order to meet Bulgarian needs and reach the required quota of 10% for liquid biofuel by 2020.
- The optimal land required for sunflower and rapeseed cultivation is concentrated in a small number of regions of the country, selected independently of the optimization criteria for the optimal design of IBDSC.
- The optimal mix of first-generation bioresources, applying the approach based on the “Minimum total annual costs” criterion for the design of IBDSC for 2020, requires 14% of the agricultural land to be used for sunflower cultivation and 2% to be used for rapeseed cultivation. Applying the approach based on the “Minimum total GHG emissions” criterion requires 12% of the agricultural land to be used for rapeseed cultivation and 3% for sunflower cultivation. Applying the approach based on using both criteria, second-generation bioresources (waste cooking oils and animal fats) are used as the main raw material to meet the requirements of the required quota of 10% for biodiesel by 2020.
- An important conclusion for transportation is that rail is the optimal mode of transport to use for both types of bioresources (sunflower and rapeseed; animal fats and waste oils) and fuels (biodiesel (B100) and petroleum diesel).
- The average price of biodiesel (B100) for the period (2016–2020) applying the approach based on the “Minimum total annual costs” criterion is 378 , while applying the approach based on the “Minimum total GHG emissions” criterion in the same circumstances gives a price of 428 , i.e., 14% higher.
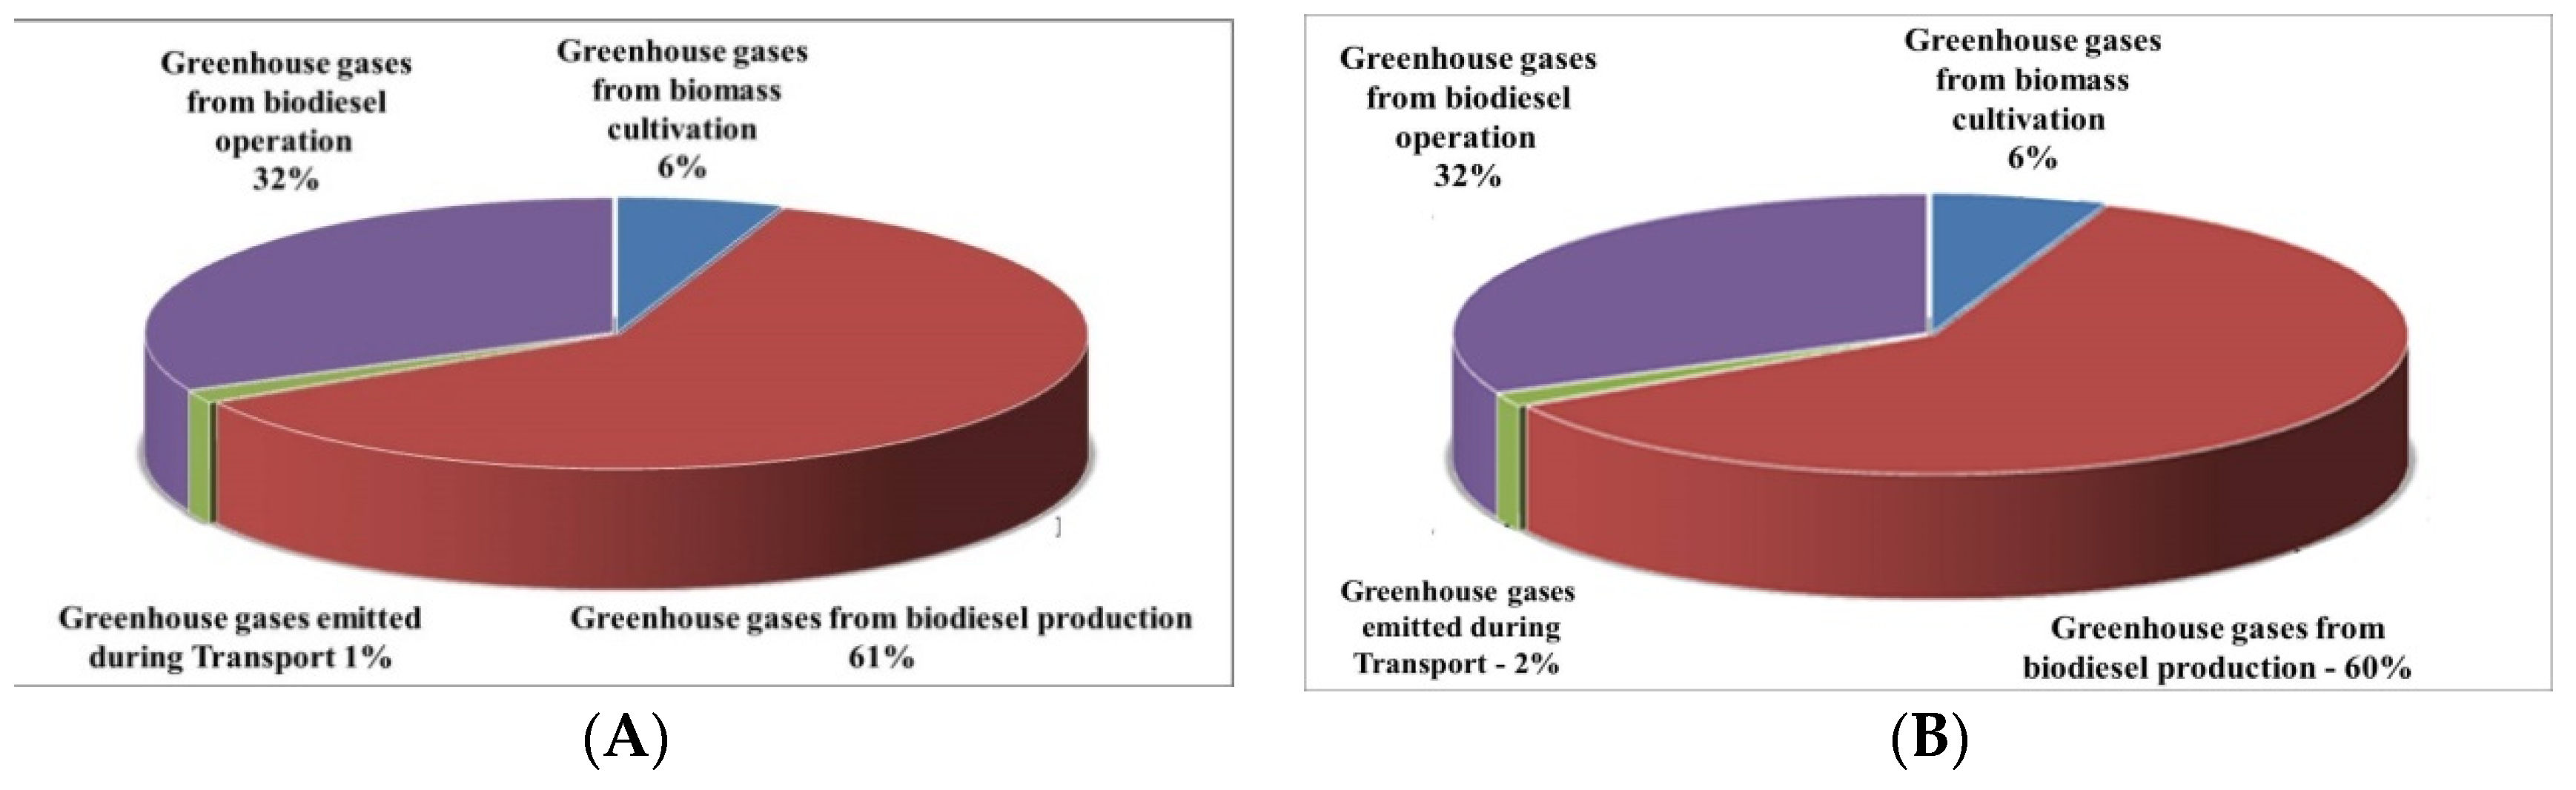
- Applying the approach based on the “Minimum total GHG emissions” criterion showed that GHG emissions have a 6.6% lower value compared to the use of the criterion “Minimum total annual costs”, while the price of biodiesel is 14% higher.
- The estimated value of capital investment for the entire period (2016–2020) is $96.779 million, applying the approach based on the “Minimum Total Annual Costs” criterion, and $127.257 million for the solution obtained when the “Minimum Total GHG Emissions” criterion is used based on the same input data.
Author Contributions
Funding
Institutional Review Board Statement
Informed Consent Statement
Data Availability Statement
Acknowledgments
Conflicts of Interest
Appendix A
- Sets/Indexes
- Set of first-generation feedstock (sunflower and rapeseed), ;
- Set of second-generation feedstock (waste cooking oil and animal fat),;
- Set of type of vehicles for transportation, ;
- Set of type of plants for biodiesel (B100) production and thier capacities, ;
- Set of type of facilities for solid waste use and thier capacities, ;
- Set of the regions into which the territory of Republic of Bulgaria is divided, ;
- Set of proportions biodiesel (B100) and diesel, subject to blending for each of the customer areas, ;
- Set of time intervals .
- Subsets/Indexes
- Set of types of vehicles for transportation of biodiesel (B100) and diesel, which is subset of , ;
- Set of types of vehicles for transportation of biomass, which is subset of , ;
- Set of types of vehicles for transportation of WCO and animal fat, which is subset of , ;
- Set of types of vehicles for transportation of solid waste, which is subset of , ;
- Set of types of vehicles for transportation of waste biomass, which is subset of , ;
- Set of types of vehicles for transportation of sunflower and rapeseed for food, which is subset of , ;
- Set of regions for biodiesel (B100) production, which is subset of f;
- Set of areas for blending and use of biodiesel, which is subset of ;
- Sets for the supply and production of petroleum diesel, which are subsets of ;
- Set of regions for collection and treatment of solid waste, which is subset ;
- Set of regions for treatment and use of glycerol, which is subset of ;
- Set of regions for treatment and use of sunflower husk, which is subset of ;
- Set of regions for collection and treatment of waste biomass, which is subset of ;
- Set of regions for using sunflower and rapeseed for food, which is subset of ;
- Set of regions for collection of WCO and animal fat, which is subset of h;
- G Set of regions for bioresources cultivation (sunflower, rapeseed, etc.) (G ⊂ GF), g;
- Constant parameters or those that can change very slowly over time:
- Environmental parameters
- Emission factor for biodiesel (B100) production from biomass according to technology
- Emission factor for biodiesel (B100) production from WCO and animal fat
- according to technology ,
- Emission factor for pollution caused by waste biomass , if not used for other purposes, ;
- Emissions released from solid waste use, if performed at the plant , ;
- Emission factor for pollution caused by solid waste when they used in plant
- according to technology , if not used for other purposes, ;
- Emission factor for petroleum diesel production in region ,
- Emission factor for biomass , transported using vehicles of type , ;
- Emission factor for WCO , transported using vehicles of type , ;
- Emission factor for WCO , which causes environmental pollution, if it is not used for biodiesel (B100), ;
- Emission factor for transportation of biodiesel (B100) and petroleum diesel using vehicles of type , ;
- Emission factor for transportation of solid waste using vehicles of type , ;
- Emission factor for transportation of waste biomass using vehicles of type , ;
- Emission factor for transportation of sunflower and rapeseed for food using vehicles of type , ;
- Emissions (), released during burning biodiesel (B100), ;
- ECG Emissions (), released during burning petroleum diesel,
- Economic parameters
- Price of petroleum diesel,
- Price of glycerol,
- Price of the cake used as animal feed, ;
- Tax on carbon emissions, expressed in terms of unit equivalent of , generated during IBDSC operation, ;
- Fixed costs for transportation of biomass using vehicles of type , ;
- Variable costs for transportation of biomass using vehicles of type , ;
- Fixed costs for transportation of WCO using vehicles of type , ;
- Variable costs for transportation of WCO using vehicles of type , ;
- Fixed costs for transportation of biodiesel (B100) using vehicles of type , ;
- Variable costs for transportation of biodiesel (B100) using vehicles of type ,
- Fixed costs for transportation of petroleum diesel using vehicles of type , ;
- Variable costs for transportation of petroleum diesel using vehicles of type , ;
- Fixed costs for transportation of solid waste using vehicles of type , ;
- Variable costs for transportation of solid waste using vehicles of type , ;
- Fixed costs for transportation of biomass using vehicles of type , ;
- Variable costs for transportation of biomass using vehicles of type ,
- Fixed costs for transportation of sunflower and rapeseed for food using vehicles of type , ;
- Variable costs for transportation of sunflower and rapeseed for food using vehicles of type , .
- Technical parameters
- Minimum transport capacity , used for transportation of biomass , ;
- Minimum transport capacity used for transportation of biodiesel, ;
- Amount of glycerol obtained in the process of processing feedstock in the production of biodiesel, ;
- Amount of glycerol obtained in the process of processing WCO in the production of biodiesel, ;
- Amount of cake obtained in the process of processing 1 ton feedstock in the f biodiesel,
- Amount of grist obtained in the process of processing of 1 ton WCO in the production of biodiesel, ;
- Maximum annual capacity of plant of type for the production of biodiesel (B100), using sunflower and rapeseed of type and WCO of type , ;
- Minimum annual capacity of plant of type for the production of biodiesel (B100), using sunflower and rapeseed of type and WCO of , ;
- Maximum annual capacity of plant of type for the production of biodiesel (B100), using sunflower and rapeseed of type , ;
- Minimum annual capacity of plant of type or the production of biodiesel (B100), using sunflower and rapeseed of type , ;
- Maximum annual capacity of plant of type for the production of biodiesel (B100), using WCO of type , ;
- Minimum annual capacity of plant of type for the production of biodiesel (B100), using WCO of type , ;
- Minimum annual capacity of the type facility for solid waste processing,
- Maximum annual capacity of the type facility for solid waste processing,
- Energy equivalent per unit of petroleum diesel, ;
- Energy equivalent per unit of biodiesel (B100), [;
- Delivery distance between regions and using vehicles of type , ;
- Delivery distance between regions and using vehicles of type , ;
- Delivery distance between regions and using vehicles of type , ;
- Delivery distance between regions and using vehicles of type , ;
- Delivery distance between regions and using vehicles of type , ;
- Delivery distance between regions and using vehicles of type , ;
- Delivery distance between regions and using vehicles of type , ;
- Minimum capacity of vehicles of type used for transportation of sunflower and rapeseed , ;
- Minimum capacity of vehicles of type used for transportation of WCO , ;
- Minimum capacity of vehicles of type used for transportation of biodiesel (B100), ;
- Necessary jobs for building biodiesel refinery of size ;
- Necessary jobs for operation of biodiesel refinery of size per year;
- Necessary jobs for cultivation of feedstock of type in region per year;
- Necessary jobs for building solid waste use facilities of size ;
- Necessary jobs for operation of the solid waste use facilities of size per year;
- Factor for changing the employment assessment depending on the region in which the plant is built;
- Factor for changing the employment assessment depending on the region in which the plant is built.
- Parameters depending on time interval
- Environmental parameters depending on the time interval
- Emission factor for cultivation of biomass in region , ;
- Maximum overall environmental impact,
- Economic parameters depending on the time interval
- Interest rate, %;
- Discount factor;
- Factor for the change of the base price, depending on the region according to the location of the plant (), ;
- Sales price of glycerol obtained from the feedstock , ;
- Sales price of glycerol obtained from WCO , ;
- Price obtained from the sale of the feedstock , used for food, ;
- Price obtained from the sale of a pure product obtained from WCO , ;
- Price of petroleum diesel for each time interval , ;
- Price of waste biomass for each time interval , ;
- Coefficient of adjustment in the price of the solid waste facility in the region for each time interval ;
- Capital investment for building the facility for the production of biodiesel (B100) in all areas for each time interval , ;
- Capital costs for building facility for biodiesel production (B100) with productivity according to a given technology, ;
- Capital costs for building facility for solid waste use with productivity according to a given technology, ;
- Maximum total costs of IBDSC for each time interval , ;
- Government incentives for biodiesel production (B100) depending on the region for each time interval , ;
- Production costs per unit of biomass type in region for each time interval , ;
- Costs for obtaining WCO of type in region for each time interval , ;
- Production costs per unit of biodiesel (B100) from biomass of type in a biorefinery of size , built in region for each time interval , ;
- Production costs per unit of biodiesel (B100) from WCO of type in a biorefinery of size , built in region for each time interval , ;
- Production costs per unit of petroleum diesel in refinery, built in region for each time interval , ;
- The price paid for use of a unit of solid waste in a solid waste facility of size , built in region , for each time interval , ;
- The price paid for use of a unit of solid waste, if this is realized in the plants for the production of biodiesel (B100)for each time interval , ;
- The price paid for use of a unit of WCO of type in region for each time interval .
- Technical parameters depending on the time interval
- Proportion of biodiesel (B100) and petroleum diesel during blending for each of the customer’s areas. The ratio of biodiesel (B100) and petroleum diesel has a higher energy equivalent for both fuels for each time interval , ;
- Biomass to biodiesel conversion factor depending on the type of biomass , ;
- Consumption of petroleum diesel in different years in customer areas , ;
- Maximum amount of biomass of type , which can be cultivated in a region per year, ;
- Minimum amount of biomass of type which can be cultivated in a region per year, ;
- Maximum amount of biomass for region , ;
- Maximum amount of biodiesel from the region , ;
- Maximum amount of petroleum diesel from the region , ;
- The total amount of feedstock of type , which should be provided for all regions for food security, ;
- Optimal transport capacity used to transport biomass, ;
- Optimal transport capacity used to transport biodiesel, ;
- Free arable land in the region for cultivation of biomass for each time interval , ;
- Free arable land in region for cultivation of sunflower/rapeseed for food security for each time interval , ;
- Production rate of biomass cultivated in region for each time interval , ;
- Duration of time intervals , ;
- Period of operation of IBDSC for a year, ;
- Biomass to biodiesel (B100) conversion factor for biomass of type , according to for each time interval , ;
- WCO to biodiesel (B100) conversion factor for WCO of type , according to for each time interval , ;
- Amount of solid waste generated during the production of one tonne of biodiesel (B100), using biomass of type and technology ot type during time interval , ;
- Demand for petroleum diesel in customer areas over the years for each time interval , ;
- Maximum amount of biomass of type , which can be cultivated in region per year for each time interval , ;
- Minimum amount of biomass of type , which can be cultivated in region per year for each time interval , ;
- Maximum amount of WCO of type , which can be provided in region per year for each time interval , ;
- Minimum amount of WCO of type , which can be provided in region per year for each time interval , ;
- Maximum permissible flow rate of feedstock of type from region for each time interval , ;
- Maximum permissible flow rate of WCO of type from region for each time interval , ;
- Maximum amount of WCO and animal fat h, ;
- Maximum permissible flow rate of biodiesel (B100) from region for each time interval , ;
- Maximum permissible flow rate of petroleum diesel from region for each time interval , ;
- Maximum permissible flow rate of solid waste from region for each time interval , ;
- Maximum permissible flow rate of waste biomass from region for each time interval , ;
- Maximum permissible flow rate of sunflower/rapeseed for food security from region for each time interval , ;
- total amount of bioresources of type , which should be provided by the regions to provide food security for each time interval , ;
- Optimal capacity of vehicles of type , used to transport biomass of type for each time interval , ;
- Optimal capacity of vehicles of type , used to transport biodiesel (B100) and petroleum diesel for each time interval , ;
- Optimal capacity of vehicles of type , used to transport waste biomass for each time interval , ;
- Optimal capacity of vehicles of type , used to transport sunflower/rapeseed for food security for each time interval , ;Optimal capacity of vehicles of type , used to transport solid waste for each time interval , ;
- Optimal capacity of vehicles of type , used to transport WCO of type for each time interval , .
- Positive continuous variables
- Biodiesel flow rate produced from feedstock of type transported by vehicles of type from region to in each time interval , ;
- Petroleum diesel flow rate transported by vehicles of type from region to , in each time interval , ;
- Amount of petroleum diesel that will be delivered to meet the energy needs of a region , for each time interval , ;
- Amount of biodiesel produced from biomass that will be delivered to meet the energy region , for each time interval , ;
- Land occupied by sunflower/rapeseed in region , for each time interval , ;
- Land occupied by sunflower/rapeseed needed for food security in region , for each time interval , ;
- Price of transport, for each time interval , ;
- Total capital investment, for each time interval , ;
- Total environmental impact, for each time interval , [];
- Total impact of GHG emissions, for each time interval , [];
- Crop biomass of type , which should be provided from region in the time interval ;
- Flow rate of crop biomass of type , transported by vehicles of type from region to , for each time interval , ;
- Flow rate of crop biomass of type , transported by vehicles of type from region to , according to technology , for each time interval , ;
- Flow rate of WCO biomass of type , transported by vehicles of type
- from region to , for each time interval , ;
- Flow rate of WCO biomass of type , transported by vehicles of type from region to according to technology , for each time interval , ;
- Flow rate of biodiesel (B100), produced from biomass of type and , transported by vehicles of type and from region to , for each time interval , ;
- Flow rate of biodiesel (B100), produced from crop biomass of type and transported by vehicles of type from region to , according to technology , for each time interval , ;
- Flow rate of biodiesel (B100), produced from WCO biomass of type and transported by vehicles of type from region to , according to technology , for each time interval , ;
- Flow rate of petroleum diesel, transported by vehicles of type from region to , for each time interval , ;Flow rate of solid waste, transported by vehicles of type from region to , for each time interval , ;
- Flow rate of solid waste, transported by vehicles of type from region to , in plant with size , for each time interval , ;
- Flow rate of straw collected from crop biomass of type and transported for processing by vehicles of type from region to , for each time interval , ;
- Flow rate of sunflower/rapeseed to provide food security transported by vehicles of type from region to , for each time interval , ;
- Amount of diesel that should be provided to meet the energy needs of the region , for each time interval , ;
- Amount of biodiesel (B100) produced from WCO biomass, which is provided to meet the energy needs of the region , for each time interval , ;
- Free arable land for cultivation of crop biomass of type , for the production of biodiesel (B100) in the region , for each time interval , ;
- Free arable land for cultivation of crop biomass of type , needed to meet the food security in the region , for each time interval , ;
- Transportation costs, for each time interval , ;
- Capital investment, for each time interval , ;
- Total environmental impact, for each time interval , [}];
- Total impact of GHG emissions, for each time interval , [}].
- Binary variables
- 0-1 variable, takes value “1”, if crop biomass of type is transported from region to by vehicles of type for production according to technology , and takes “0” otherwise in time interval ;
- 0-1 variable, takes value “1”, if WCO biomass of type is transported from region to by vehicles of type for production according to technology , and takes “0” otherwise in time interval ;
- 0-1 variable, takes value “1”, if biodiesel(B100) is transported from region to by vehicles of type , and takes “0” otherwise in time interval ;
- 0-1 variable, takes value “1”, if solid waste is transported from region to by vehicles of type , and takes “0” otherwise in time interval ;
- 0-1 variable, takes value “1”, if straw is transported from region to by vehicles of type , and takes “0” otherwise in time interval ;
- 0-1 variable, takes value “1”, if crop biomass of type for food security is transported from region to by vehicles of type , and takes “0” otherwise in time interval ;
- 0-1 variable, takes value “1”, if solid waste use facility with size is built in region , and takes “0” otherwise in time interval ;
- 0-1 variable, takes value “1”, if solid waste use facility with size should operate in the region , and takes “0” otherwise in time interval , which includes the facilities built in the previous time interval and the new ones built during this interval, calculated by an equation for the first year the configuration is set by initialization ;
- 0-1 variable, takes value “1”, if plant for biodiesel(B100) production with size should be built in the region , and takes “0” otherwise in time interval ;
- 0-1 variable, takes value “1”, if plant for biodiesel(B100) production with size should operate in the region , and takes “0” otherwise in time interval , which includes the plants built in the previous time interval and the new ones built during this interval, calculated by following recursive equation for the first year the configuration is set by initialization ;
- 0-1 variable, takes value “1”, if diesel is produced in the region , and takes “0” otherwise in time interval ;
- 0-1 variable, takes value “1”, if diesel is transported from region to by vehicles of type , and takes “0” otherwise in time interval .
References
- Viswanathana, V.K.; Thomai, P. Performance and emission characteristics analysis of Elaeocarpus Ganitrus biodiesel blend using CI engine. Fuel 2020, 14, 119611. [Google Scholar] [CrossRef]
- Alsaleh, M.; Abdul-Rahim, A.S. Determinants of cost efficiency of bioenergy industry: Evidence from EU28 countries. Renew. Energy 2018, 127, 746–762. [Google Scholar] [CrossRef]
- Kirubakaran, M.; Arul Mozhi Selvan, V. A comprehensive review of low cost biodiesel production from waste chicken fat. Renew. Sustain. Energy Rev. 2018, 82, 390–401. [Google Scholar] [CrossRef]
- Singh, D.; Sharma, D.; Soni, S.L.; Inda, C.S.; Sharma, S.; Sharma, P.K.; Jhalani, A. A Comprehensive review on 1st-generation biodiesel feedstock palm oil: Production, engine performance, and exhaust emissions. BioEnergy Res. 2021, 14, 1–22. [Google Scholar] [CrossRef]
- Singh, D.; Sharma, D.; Soni, S.L.; Sharma, S.; Sharma, P.K.; Jhalani, A. A review on feedstocks, production processes, and yield for different generations of biodiesel. Fuel 2020, 262, 116553. [Google Scholar] [CrossRef]
- Krishania, N.; Rajak, U.; Chaurasiya, P.K.; Singh, T.S.; Birru, A.K.; Verma, T.N. Investigations of spirulina, waste cooking and animal fats blended biodiesel fuel on auto-ignition diesel engine performance, emission characteristics. Fuel 2020, 276, 118123. [Google Scholar] [CrossRef]
- da Silva Filho, S.C.; Miranda, A.C.; Silva, T.A.F.; Calarge, F.A.; de Souza, R.R.; Santana, J.C.C.; Tambourgi, E.B. Environmental and techno-economic considerations on biodiesel production from waste frying oil in São Paulo city. J. Clean. Prod. 2018, 183, 1034–1042. [Google Scholar] [CrossRef]
- Razzaq, L.; Imran, S.; Anwar, Z.; Farooq, M.; Abbas, M.M.; Khan, H.M.; Asif, T.; Amjad, M.; Soudagar, M.E.M.; Shaukat, N.; et al. Maximising yield and engine efficiency using optimised waste cooking oil biodiesel. Energies 2020, 13, 5941. [Google Scholar] [CrossRef]
- Yesilyurt, M.K.; Cesur, C. Biodiesel synthesis from Styrax officinalis L. seed oil as a novel and potential non-edible feedstock: A parametric optimization study through the Taguchi technique. Fuel 2020, 265, 117025. [Google Scholar] [CrossRef]
- Sharma, A.K.; Sharma, P.K.; Chintala, V.; Khatri, N.; Patel, A. Environment-friendly biodiesel/diesel blends for improving the exhaust emission and engine performance to reduce the pollutants emitted from transportation fleets. Int. J. Environ. Res. Public Health 2020, 17, 3896. [Google Scholar] [CrossRef]
- Anwar, M. Biodiesel feedstocks selection strategies based on economic, technical, and sustainable aspects. Fuel 2012, 283, 119204. [Google Scholar] [CrossRef]
- Awudu, I.; Zhang, J. Uncertainties and sustainability concepts in biofuel supply chain management: A review. Renew. Sustain. Energy Rev. 2012, 16, 1359–1368. [Google Scholar] [CrossRef]
- Ganev, E.; Ivanov, B.; Dzhelil, Y.; Vaklieva-Bancheva, N.; Kirilova, E. Improving energy efficiency biodiesel supply chain using agricultural waste. In Proceedings of the 5th Eusrasia Waste Management Simposium, Istanbul, Turkey, 26–28 October 2020; Volume 168, pp. 737–745. [Google Scholar]
- Habib, M.S.; Asghar, O.; Hussain, A.; Imran, M.; Mughal, M.P.; Sarkar, B. A robust possibilistic programming approach toward animal fat-based biodiesel supply chain network design under uncertain environment. J. Clean. Prod. 2021, 278, 122403. [Google Scholar] [CrossRef]
- Ekşioğlu, S.D.; Acharya, A.; Leightley, L.E.; Arorac, S. Analyzing the design and management of biomass-to-biorefinery supply chain. Comput. Ind. Eng. 2009, 57, 1342–1352. [Google Scholar] [CrossRef]
- Ivanov, B.; Stoyanov, S. A mathematical model formulation for the design of an integrated biodiesel-petroleum diesel blends system. Energy 2016, 99, 221–236. [Google Scholar] [CrossRef]
- Tan, R.R.; Aviso, K.B.; Barilea, I.U.; Culaba, A.B.; Cruz, J.B., Jr. A fuzzy multi-regional input–output optimization model for biomass production and trade under resource and footprint constraints. Appl. Energy 2011, 90, 154–160. [Google Scholar] [CrossRef]
- Amiguna, B.; Kaviti, M.J.; Stafford, W. Biofuels and sustainability in Africa. Renew. Sustain. Energy Rev. 2010, 15, 1360–1372. [Google Scholar] [CrossRef]
- Inderwildi, O.R.; King, D.A. Quo Vadis biofuels? Energy Environ. Sci. 2009, 2, 343–346. [Google Scholar] [CrossRef]
- Karagiannidis, A.; Wittmaier, M.; Langer, S.; Bilitewski, B.; Malamakis, A. Thermal processing of waste organic substrates: Developing and applying an integrated framework for feasibility assessment in developing countries. Renew. Sustain. Energy Rev. 2009, 13, 2156–2162. [Google Scholar] [CrossRef]
- Demirbas, A. Political, economic and environmental impacts of biofuel: A review. Appl. Energy 2009, 86, 108–117. [Google Scholar] [CrossRef]
- Bass, S.; Hawthorne, W.; Hughes, C. Forests, Forests, Biodiversity and Livelihoods: Linking Policy and Practice; Issues Paper for DFID; International Institute for Environment and Development (IIED): London, UK, 1998. [Google Scholar]
- IPCC. IPCC Fourth Assessment Report; Intergovernmental Panel on Climate Change (IPCC): Geneva, Switzerland, 2007. [Google Scholar]
- Zamboni, A.; Bezzo, F.; Shah, N. Spatially explicit static model for the strategic design of future bioethanol production systems, 2. Multi-objective environmental optimization. Energy Fuels 2009, 23, 5134–5143. [Google Scholar] [CrossRef]
- Peskett, L.; Slater, R.; Stevens, C.; Dufey, A. Chapter: Biofuels, Agriculture and Poverty Reduction. Natural Resource Perspectives; Overseas Development Institute: London, UK, 2007; pp. 107–113. [Google Scholar]
- Börjesson, P.; Gustavsson, L. Regional production and utilization of biomass in Sweden. Energy 1996, 21, 747–764. [Google Scholar] [CrossRef]
- Wetterlund, E.; Leduc, S.; Dotzauer, E.; Kindermann, G. Optimal localisation of biofuel production on a European scale. Energy 2012, 41, 462–472. [Google Scholar] [CrossRef]
- Zamboni, A.; Murphy, R.J.; Woods, J.l.; Bezzo, F.; Shah, N. Biofuels carbon footprints: Whole-systems optimisation for GHG emissions reduction. Bioresour. Technol. 2011, 102, 7457–7465. [Google Scholar] [CrossRef]
- Johnson, E.; Heinen, R. Carbon trading: Time for industry involvement. Environ. Int. 2004, 30, 279–288. [Google Scholar] [CrossRef] [PubMed]
- Hansen, S.; Olsen, S.; Ujang, Z. Greenhouse gas reductions through enhanced use of residues in the life cycle of Malaysian palm oil derived biodiesel. Bioresour. Technol. 2012, 104, 358–366. [Google Scholar] [CrossRef] [PubMed]
- Osmani, A.; Zhang, J. Multi-period stochastic optimization of a sustainable multi-feedstock second generation bioethanol supply chain—A logistic case study in Midwestern United States. Land Use Policy 2017, 61, 420–450. [Google Scholar] [CrossRef]
- Walter, Z.; Andrea, M. Energy crops in rotation. A review. Biomass Bioenergy 2011, 35, 12–25. [Google Scholar]
- The Eco-Indicator 99A Damage Oriented Method for Life Cycle Impact Assessment. Available online: https://www.pre-sustainability.com/download/EI99_annexe_v3.pdf (accessed on 29 March 2016).
- Republic of Bulgaria National Statistical Institute. 2015. Available online: http://www.nsi.bg (accessed on 16 April 2021).
- Biofuel Costs, Technologies and Economics in APEC Economies. Available online: https://www.apec.org/Publications/2010/12/Biofuel-Costs-Technologies-and-Economics-in-APEC-Economies (accessed on 10 December 2019).
- International Resource Costs of Biodiesel and Bioethanol. 2014. Available online: http://www.neema.ufc.br/Etanol17.pdf (accessed on 16 April 2021).
- ChemWorld Glycerin. 2015. Available online: http://www.chemworld.com/ChemWorld-Glycerin-p/cw-glycerin-1.htm (accessed on 16 May 2018).
- BorsaAgro. Available online: https://agro-borsa.net/ (accessed on 10 April 2019).
- Open Access Version via Utrecht University Repository. 2014. Available online: http://dspace.library.uu.nl/bitstream/handle/1874/20687/NWS-E-2005-141.pdf?sequence=1 (accessed on 3 June 2018).
- Akgul, O.; Shah, N.; Papageorgion, L. An optimisation framework for a hybrid first/second generation bioethanol supply chain. Comput. Chem. Eng. 2012, 42, 101–114. [Google Scholar] [CrossRef]
- Giarola, S.; Zamboni, A.; Bezzo, F. Spatially explicit multi-objective optimisation for design and planning of hybrid first and second generation biorefineries. Comput. Chem. Eng. 2011, 35, 1782–1797. [Google Scholar] [CrossRef]
- International Energy Agency. 2014. Available online: http://www.iea.org/stats/unit.asp (accessed on 17 March 2018).
- World of Electric Vehicles. 2014. Available online: https://www.ev-volumes.com/ (accessed on 20 November 2018).
- Expert Club for Economics and Politics. 2012. Available online: http://ekipbg.com/2012/05/25/gpricesbg/ (accessed on 16 April 2021).
- Ivanov, B.; Stoyanov, S.; Ganev, E. Application of mathematical model for design of an integrated biodiesel-petroleum diesel blends system for optimal localization of biodiesel production on a Bulgarian scale. Environ. Res. Technol. 2018, 1, 45–68. [Google Scholar]
- GAMS Development Corporation: GAMS—Documentation. Available online: https://www.gams.com/latest/docs/gams.pdf (accessed on 16 April 2021).


| № | Region | Greenhouse Gas Emissions during the Agronomic Phase, | Yield for Different Regions, [t/ha] | ||
|---|---|---|---|---|---|
| Energy Crops | Sunflower | Rapeseed | Sunflower | Rapeseed | |
| 1 | Region-1 | 1700 | 1350 | 1.5 | 1.8 |
| 2 | Region-2 | 1425 | 1120 | 2.8 | 2.8 |
| 3 | Region-3 | 600 | 430 | 3.4 | 3.5 |
| 4 | Region-4 | 1425 | 1120 | 1.8 | 2.2 |
| 5 | Region-5 | 1425 | 1120 | 1.8 | 2.2 |
| 6 | Region-6 | 1700 | 1350 | 1.5 | 1.8 |
| 7 | Region-7 | 1700 | 1350 | 1.5 | 1.8 |
| 8 | Region-8 | 1425 | 1120 | 1.8 | 3.2 |
| 9 | Region-9 | 1150 | 890 | 2.2 | 2.6 |
| 10 | Region-10 | 1700 | 1350 | 2.2 | 3.2 |
| 11 | Region-11 | 1425 | 1120 | 1.8 | 2.2 |
| 12 | Region-12 | 600 | 430 | 2.8 | 3.5 |
| 13 | Region-13 | 1425 | 1120 | 1.8 | 2.2 |
| 14 | Region-14 | 875 | 660 | 2.8 | 3.0 |
| 15 | Region-15 | 600 | 430 | 3.3 | 3.5 |
| 16 | Region-16 | 875 | 660 | 2.8 | 3.0 |
| 17 | Region-17 | 875 | 660 | 2.8 | 3.0 |
| 18 | Region-18 | 1150 | 890 | 2.4 | 2.6 |
| 19 | Region-19 | 1700 | 1350 | 1.5 | 1.8 |
| 20 | Region-20 | 1700 | 1350 | 1.5 | 1.8 |
| 21 | Region-21 | 875 | 660 | 2.8 | 3.0 |
| 22 | Region-22 | 1150 | 890 | 2.2 | 2.6 |
| 23 | Region-23 | 875 | 660 | 2.8 | 3.0 |
| 24 | Region-24 | 875 | 660 | 2.4 | 3.0 |
| 25 | Region-25 | 1425 | 1120 | 2.8 | 2.2 |
| 26 | Region-26 | 875 | 660 | 1.8 | 2.0 |
| 27 | Region-27 | 1150 | 890 | 2.0 | 2.6 |
| Region | Costs for Cultivation per Unit of Biomass, [$/tbiomass] | Maximum Biomass Productivity, [t/y] | |||
|---|---|---|---|---|---|
| Energy Crops | Sunflower | Rapeseed | Sunflower | Rapeseed | |
| 1 | Region-1 | 227 | 239 | 10,768 | 9230 |
| 2 | Region-2 | 213 | 236 | 93,225 | 79,907 |
| 3 | Region-3 | 192 | 227 | 173,150 | 148,414 |
| 4 | Region-4 | 213 | 233 | 11,291 | 9678 |
| 5 | Region-5 | 213 | 236 | 61,245 | 52,496 |
| 6 | Region-6 | 227 | 239 | 6694 | 5738 |
| 7 | Region-7 | 227 | 239 | 9732 | 8342 |
| 8 | Region-8 | 213 | 236 | 35,087 | 30,075 |
| 9 | Region-9 | 198 | 233 | 68,378 | 58,609 |
| 10 | Region-10 | 227 | 239 | 30,279 | 25,954 |
| 11 | Region-11 | 213 | 236 | 17,839 | 15,291 |
| 12 | Region-12 | 192 | 227 | 151,911 | 130,210 |
| 13 | Region-13 | 213 | 236 | 94,193 | 80,737 |
| 14 | Region-14 | 195 | 230 | 73,613 | 63,097 |
| 15 | Region-15 | 192 | 227 | 89,287 | 76,532 |
| 16 | Region-16 | 195 | 230 | 73,932 | 63,370 |
| 17 | Region-17 | 195 | 230 | 76,866 | 65,885 |
| 18 | Region-18 | 198 | 233 | 44,636 | 38,259 |
| 19 | Region-19 | 227 | 239 | 2675 | 2293 |
| 20 | Region-20 | 227 | 239 | 35,806 | 30,690 |
| 21 | Region-21 | 195 | 230 | 91,069 | 78,059 |
| 22 | Region-22 | 198 | 233 | 51,469 | 44,117 |
| 23 | Region-23 | 195 | 230 | 84,412 | 72,353 |
| 24 | Region-24 | 195 | 230 | 88,301 | 75,687 |
| 25 | Region-25 | 213 | 236 | 47,698 | 40,884 |
| 26 | Region-26 | 195 | 230 | 92,152 | 78,987 |
| 27 | Region-27 | 198 | 233 | 78,585 | 67,358 |
| Energy Crops | Conversion Factor, [tbiofuel/tbiomas] | Energy Equivalent of Biomass, [GJ/t] | |
|---|---|---|---|
| 1 | Sunflower | 0.37 | 14.023 |
| 2 | Rapeseed | 0.30 | 11.453 |
| 3 | Waste animal fats | 0.87 | |
| 4 | Waste cooking oil | 0.91 |
| Biodiesel Plant Size (B100) | Capital Costs of a Biodiesel Plant (B100) Costp, [M$] | Minimum Capacity of the Biodiesel Plant (B100) , [t/y] | Maximum Capacity of the Biodiesel Plant (B100) (B100) , [t/y] |
|---|---|---|---|
| Size-1 | 3.800 | 1000 | 8500 |
| Size-2 | 4.800 | 6000 | 19,000 |
| Size-3 | 7.380 | 8000 | 48,000 |
| Size-4 | 8.930 | 10,000 | 74,000 |
| Type of Fuel | Emission Factor, , [42] | Energy Equivalent, [GJ/t] | Energy Equivalent, [MWh/t] [43] | Medium Density, [t/m3] [43] | Price of Biofuel, [$/t] [44] |
|---|---|---|---|---|---|
| Petroleum diesel | 3623 | 42.80 | 11.880 | 0.840 | 1192.70 |
| Biodiesel (B100) | 1204 | 37.80 | 7.720 | 0.880 |
| Energy Crops | Fixed Price, [$/(t km)] [26] | Variable Price, [$/(t km)] [26] | |||||
|---|---|---|---|---|---|---|---|
| Type of Vehicles | Tractor | Truck | Train | Tractor | Truck | Train | |
| 1 | Sunflower | 2.49 | 9.28 | 19.63 | 0.14 | 0.21 | 0.03 |
| 2 | Rapeseed | 2.49 | 9.28 | 19.63 | 0.14 | 0.21 | 0.03 |
| 3 | Waste animal fats | 2.49 | 9.28 | 19.63 | 0.14 | 0.21 | 0.03 |
| 4 | Waste cooking oil | 2.49 | 9.28 | 19.63 | 0.14 | 0.21 | 0.03 |
| Type of Vehicles | Fixed Price OAb, OADb [$/(t km)] [26] | Variable Price OBb, OBDb [$/(t km)] [26] | |||
|---|---|---|---|---|---|
| Truck | Train | Truck | Train | ||
| 1 | Biodiesel (B100) | 24.11 | 7.86 | 0.436 | 0.173 |
| 2 | Petroleum diesel | 24.11 | 7.86 | 0.436 | 0.173 |
| Type of Vehicles | Emission Factor for Biomass Transport, | Emission Factor for Biofuel Transport, | |
|---|---|---|---|
| 1 | Tractor | 0.591 | 0.591 |
| 2 | Truck (average) | 0.228 | 0.228 |
| 3 | Van < 3.5 t | 1.118 | 1.118 |
| 4 | Truck, 16 t | 0.304 | 0.304 |
| 5 | Truck, 32 t | 0.153 | 0.153 |
| 6 | Freight train | 0.038 | 0.038 |
| Years | 2016 | 2017 | 2018 | 2019 | 2020 |
|---|---|---|---|---|---|
| Proportion Biodiesel/Diesel | 6% | 7% | 8% | 9% | 10% |
| Regions | Optimal Size and Capacity of Biorefineries, [t/y] | ||||
| Region-5 | Size_1 | Size_1 | Size_1 | ||
| 7907.96 | 7305.93 | 8500.00 | |||
| Region-10 | Size_3 | Size_3 | Size_3 | Size_3 | Size_3 |
| 27,707.90 | 30,577.38 | 24,101.54 | 24,409.93 | 28,700.37 | |
| Region-12 | Size_3 | Size_3 | Size_3 | Size_3 | |
| 25,506.10 | 15,703.19 | 37,664.44 | 39,045.68 | ||
| Region-14 | Size_1 | Size_1 | Size_1 | Size_1 | |
| 8002.23 | 7481.96 | 8083.69 | 8500.00 | ||
| Region-20 | Size_4 | Size_4 | Size_4 | ||
| 45,452.03 | 25,692.48 | 35,311.27 | |||
| Region-21 | Size_2 | Size_2 | |||
| 18,225.70 | 17,933.16 | ||||
| Region-22 | Size_3 | Size_3 | Size_3 | Size_3 | Size_3 |
| 23,167.91 | 15,601.37 | 18,219.92 | 9527.73 | 10,708.57 | |
| Region-23 | Size_4 | Size_4 | |||
| 17,579.15 | 20,990.37 | ||||
| Region-26 | Size_4 | Size_4 | Size_4 | Size_4 | Size_4 |
| 48,667.82 | 49,516.38 | 36,244.69 | 52,874.40 | 71,105.31 | |
| Region-27 | Size_3 | Size_3 | Size_3 | Size_3 | Size_3 |
| 18,981.74 | 20,713.33 | 30,569.45 | 23,719.49 | 28,364.28 | |
| Optimal Size and Capacity of Solid Waste Facilities, [t/y] | |||||
| Region-12 | Size_W1 | Size_W1 | Size_W1 | Size_W1 | |
| 58,763.95 | 85,000.00 | 85,000.00 | 85,000.00 | ||
| Region-18 | Size_W1 | Size_W1 | Size_W1 | ||
| 38,420.15 | 85,000.00 | 85,000.00 | |||
| Region-26 | Size_W1 | Size_W1 | Size_W1 | Size_W1 | Size_W1 |
| 74,616.52 | 77,706.22 | 85,000.00 | 85,000.00 | 85,000.00 | |
| Years | 2016 | 2017 | 2018 | 2019 | 2020 |
|---|---|---|---|---|---|
| Proportion Biodiesel/Diesel | 6% | 7% | 8% | 9% | 10% |
| Regions | Optimal Size and Capacity of Biorefineries, [t/y] | ||||
| Region-8 | Size_3 | Size_3 | |||
| 40,210.52 | 37,685.86 | ||||
| Region-9 | Size_3 | ||||
| 35,865.99 | |||||
| Region-13 | Size_3 | Size_3 | Size_3 | ||
| 35,559.64 | 28,560.47 | 32,178.49 | |||
| Region-16 | Size_4 | Size_4 | Size_4 | Size_4 | |
| 31,857.90 | 34,632.79 | 38,235.05 | 45,722.29 | ||
| Region-20 | Size_4 | Size_4 | Size_4 | Size_4 | Size_4 |
| 70,525.36 | 74,000.00 | 72,884.91 | 74,000.00 | 70,161.58 | |
| Region-27 | Size_3 | Size_3 | Size_3 | Size_3 | Size_3 |
| 48,000.00 | 44,058.89 | 42,603.40 | 44,076.90 | 47,544.80 | |
| Optimal Size and Capacity of Solid Waste Facilities, [t/y] | |||||
| Region-12 | Size_W1 | Size_W1 | Size_W1 | ||
| 41,021.98 | 74,203.72 | 63,026.74 | |||
| Region-14 | Size_W1 | Size_W1 | |||
| 46,322.35 | 59,259.36 | ||||
| Region-18 | Size_W1 | Size_W1 | Size_W1 | Size_W1 | Size_W1 |
| 40,018.77 | 79,844.32 | 82,398.17 | 84,793.56 | 80,383.87 | |
| Region-26 | Size_W1 | Size_W1 | Size_W1 | Size_W1 | Size_W1 |
| 34,597.76 | 56,625.85 | 85,000.00 | 84,837.31 | 85,000.00 | |
| Years | 2016 | 2017 | 2018 | 2019 | 2020 |
|---|---|---|---|---|---|
| Proportion Biodiesel/Diesel | 6% | 7% | 8% | 9% | 10% |
| Optimization criterion value (72) (A) Minimum total greenhouse gas emissions, 11,960,007,897.41 | |||||
| Objective function value (70) (B) Minimum annual costs, [M$] 1318.237 | |||||
| Objective function value (74) (C) Total number of jobs, 2670.00 | |||||
| Total operating costs of IBDSC, | 188.522 | 210.435 | 294.457 | 309.574 | 315.249 |
| Total costs of biodiesel production, | 415.982 | 60.884 | 82.355 | 112.845 | 118.489 |
| Total GHG emissions, | 1834.796 | 1957.235 | 2682.917 | 2676.472 | 2808.587 |
| Total number of jobs, | 620 | 480 | 570 | 590 | 410 |
| Total amounts of produced biodiesel and diesel | |||||
| Biodiesel from 1G feedstock | 27,738 | 50,732 | 77,479 | 115,165 | 109,872 |
| Biodiesel from 2G feedstock | 90,786 | 99,184 | 108,201 | 109,917 | 159,286 |
| Biodiesel totally | 118,525 | 149,916 | 185,680 | 225,082 | 269,159 |
| Price for biodiesel production | 350.96 | 406.12 | 443.53 | 501.35 | 440.22 |
| Petroleum diesel | 19,45,321 | 2,086,596 | 2,237,010 | 2,384,211 | 2,537,784 |
| Distribution of arable land | |||||
| Land for cultivation of sunflower and rapeseed for biodiesel production | 19,403 | 35,493 | 54,211 | 80,587 | 76,881 |
| Land for cultivation of sunflower and rapeseed for food | 1,464,199 | 1,493,331 | 2,002,839 | 1,897,456 | 1,897,456 |
| Free arable land | 1,997,387 | 1,952,166 | 1,423,940 | 1,502,946 | 1,506,652 |
| Years | 2016 | 2017 | 2018 | 2019 | 2020 |
|---|---|---|---|---|---|
| Proportion Biodiesel/Diesel | 6% | 7% | 8% | 9% | 10% |
| Objective function value (72) (A) Minimum total greenhouse gas emissions 13,323,159,067.04 | |||||
| Objective function value (70) (B) Minimum annual costs, [M$] 1054.008 | |||||
| Objective function value (74) (C) Total number of jobs, 1880 | |||||
| Total operating costs of IBDSC | 143.011 | 162.518 | 240.838 | 249.525 | 258.115 |
| Total costs of biodiesel production | 37.884 | 54.603 | 73.411 | 95.662 | 104.277 |
| Total GHG emissions | 2101.136 | 2224.594 | 2969.221 | 2944.325 | 3083.884 |
| Total number of jobs | 440 | 260 | 370 | 420 | 390. |
| Total amounts of produced biodiesel and diesel | |||||
| Biodiesel from 1G feedstock | 27,738 | 50,732 | 77,479 | 107,865 | 106,940 |
| Biodiesel from 2G feedstock | 90,786 | 99,184 | 108,201 | 117,217 | 162,218 |
| Biodiesel totally | 118,525 | 149,916 | 185,680 | 225,082 | 269,159 |
| Price for biodiesel production | 319.63 | 364.22 | 395.36 | 425.01 | 387.42 |
| Petroleum diesel | 1,945,321 | 2,086,596 | 2,237,010 | 2,384,211 | 2,537,784 |
| Distribution of arable land | |||||
| Land for cultivation of sunflower and rapeseed for biodiesel production | 19,411 | 35,505 | 54,227 | 75,496 | 74,845 |
| Land for cultivation of sunflower and rapeseed for food | 1,464,199 | 1,493,331 | 2,002,839 | 1,897,456 | 1,897,456 |
| Free land | 1,997,379 | 1,952,153 | 1,423,924 | 1,508,037 | 1,508,688 |
Publisher’s Note: MDPI stays neutral with regard to jurisdictional claims in published maps and institutional affiliations. |
© 2021 by the authors. Licensee MDPI, Basel, Switzerland. This article is an open access article distributed under the terms and conditions of the Creative Commons Attribution (CC BY) license (https://creativecommons.org/licenses/by/4.0/).
Share and Cite
Ganev, E.; Ivanov, B.; Vaklieva-Bancheva, N.; Kirilova, E.; Dzhelil, Y. A Multi-Objective Approach toward Optimal Design of Sustainable Integrated Biodiesel/Diesel Supply Chain Based on First- and Second-Generation Feedstock with Solid Waste Use. Energies 2021, 14, 2261. https://doi.org/10.3390/en14082261
Ganev E, Ivanov B, Vaklieva-Bancheva N, Kirilova E, Dzhelil Y. A Multi-Objective Approach toward Optimal Design of Sustainable Integrated Biodiesel/Diesel Supply Chain Based on First- and Second-Generation Feedstock with Solid Waste Use. Energies. 2021; 14(8):2261. https://doi.org/10.3390/en14082261
Chicago/Turabian StyleGanev, Evgeniy, Boyan Ivanov, Natasha Vaklieva-Bancheva, Elisaveta Kirilova, and Yunzile Dzhelil. 2021. "A Multi-Objective Approach toward Optimal Design of Sustainable Integrated Biodiesel/Diesel Supply Chain Based on First- and Second-Generation Feedstock with Solid Waste Use" Energies 14, no. 8: 2261. https://doi.org/10.3390/en14082261
APA StyleGanev, E., Ivanov, B., Vaklieva-Bancheva, N., Kirilova, E., & Dzhelil, Y. (2021). A Multi-Objective Approach toward Optimal Design of Sustainable Integrated Biodiesel/Diesel Supply Chain Based on First- and Second-Generation Feedstock with Solid Waste Use. Energies, 14(8), 2261. https://doi.org/10.3390/en14082261