Abstract
Accuracy of hydrogeological and geotechnical investigation in place of shaft sinking is a key factor for selection of sinking method and design of the shaft lining. The following work presents the influence of the rising level of accuracy of geological data gathered in the area of shaft sinking in the Silesian Coal Basin and technical projects of shaft lining and technology of its sinking, which have been changing over the years. The initial project of the shaft was repeatedly modified. Each modification eventuated in rising requirements for the shaft lining, such as increasing its thickness or changing concrete class. It has become necessary to use additional methods of reinforcing rock mass around the shaft.
1. Introduction
Despite investing in renewable energy sources and development of other energy sources, Polish energy is still coal based. Poland also has extensive resources of coking coal, which is necessary for steel production. These factors cause a need for coal mine operation, because of the coal demand. Economic mine operation requires maintenance, modernization, or elongation of existing mine shafts and even building new. A new mine shaft was designed in the Silesian Coal Basin in southern Poland to raise the effectiveness of a coal mine. The process of the shaft design is presented in the following article. The location of boreholes, with respect to mine workings in coal seam no. 207, geological faults, and borders of water hazard area are presented in Figure 1.
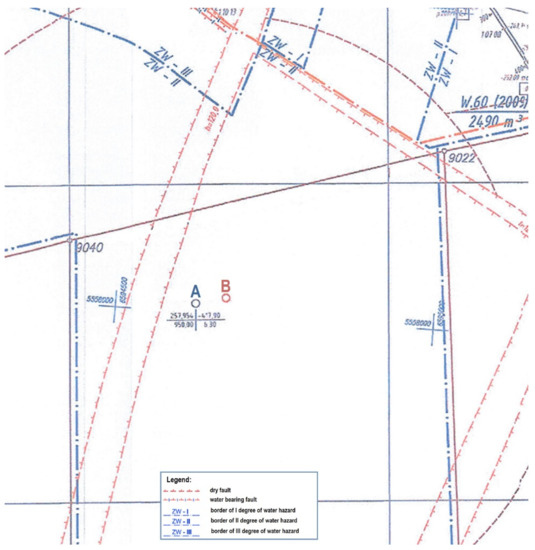
Figure 1.
A map of mine workings in the coal seam no. 207 with geological faults, borders of the water hazard area, and boreholes presented.
The selection of the shaft sinking method is based on hydrogeological conditions in the chosen place [1]. A particularly important factor is the number of aquifers and their parameters, such as hydraulic contact between them, chemical composition of underground water in different aquifers, and occurrence of fault zones [2]. A common method of geological and hydrogeological investigation is research drilling in the vicinity of the designed shaft [3]. This method is required by Polish law [4] as well as the Polish Standard [5]. The following work presents an example of the evolution of the technical project of a mine shaft, caused by the rising level of accuracy of hydrogeological data collected in two boreholes, drilled at different time intervals as well as the results of mining operations on the mine level.
Boreholes A and B were drilled consecutively in 2007 and 2014. Based on data collected from these wells, the occurrence of Tertiary, Quaternary, Triassic, and Carboniferous formations was specified.
Data gathered in the borehole A showed that Quaternary formation is represented by medium and coarse-grained sand, loamy sand, sandy, silty clay and clay loam, silt, and clay. The bottom part of the quaternary formation is formed by a clay–sand–gravel mixture, rock and loam rubble, and gravel. Quaternary formation is covered with 0.2 m thick layer of sandy soil and humus. The thickness of the Quaternary formation is equal 40.5 m.
The tertiary formation consists of clay divided by a layer of micrite limestone at the depth of 94.1–96.7 m and knobby limestone in its bottom part. The thickness of the Tertiary formation is 71.6 m.
The Triassic formation is represented by carbonate rocks—limestone, dolomite, and marl, laying on clay. The total thickness of Triassic formation equals 125.9 m. In both boreholes A and B, Middle (112.1–186.5 m below the surface) and Early Triassic (185.5–238.0 m below the surface) was found.
The Carboniferous formation consists of the Libiąż layers (Westphalian D) and Łaziska layers (Westphalian B and C). Westphalian D, with a thickness of 171.5 m, is represented by thick shoals of coarse-grained, poorly cemented and fractured sandstone containing gravel and pebbles, and fine-grained sandstone delaminated with conglomerate, mudrock, and seams of coal. The thickness of the Westphal C formation is 353.4 m and Westphal D is 187.2 m. They are formed by coarse-grained sandstone with gravel, medium and fine-grained sandstone with mudrock, and several seams of coal.
Tectonics of the designed shaft region, as well as the whole area of the coal deposit, is extremely rich. Numerous faults occur, characterized by throw up to 180 m. Traces of fault lines are located on the N-S, NE-SW, NW-SE, and W-E directions. Seam extent direction is between S-N and NWW-SEE, its dip is oriented to E and NE, and its angle is from 3° to 10°. In the distance of about 350 m on the north from the borehole A, there is a fault of W-E direction and a south-oriented throw with a value between 100 and 140 m. In this borehole, at the depth of 109.80 m, contact between dolomite and limestone breccia was located in the Tertiary formation, which is probably a fault of a 40° dip and a 2.3 m thick zone of breccia. It is also plausible that two caverns filled with clay were drilled through. A geological profile of the rock mass in the vicinity of the designed shaft and boreholes is presented in Figure 2.
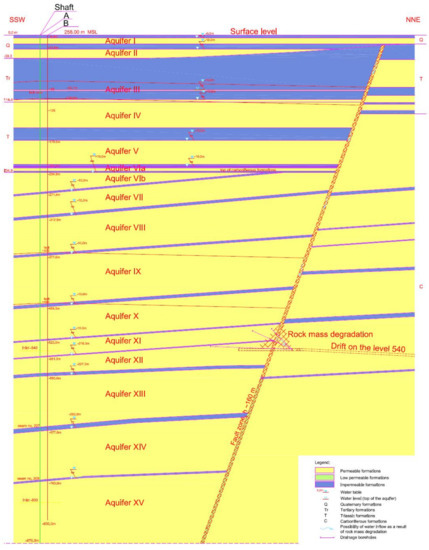
Figure 2.
Geological profile in the vicinity of the designed shaft and boreholes.
2. Results
2.1. Borehole A—Stage I
The following hydrogeological tests were conducted in the borehole A:
- Pumping tests,
- Tests with tube samplers at the depths of 550.0–560.0 m, 630.0–635.0 m, 745.0–750 m, 855.0–860.0 m, and 925.0–930.0 m,
- Determination of following parameters in groundwater samples: pH, carbonate hardness, water hardness, total alkalinity, content of the aggressive CO2, So4, Mg, Cl, NH4, NO3, NO2, HCO3, Ca, Fe, K, Na, Mn, SiO2 ion content, dispersion, dry residue, and assessment of level of water aggressiveness and corrosivity,
- Samples of sandstones layer over the minimum 1.5 m thick coal seams were taken from the drill core and their open porosity, seepage, and chemical composition of pore waters were tested in the laboratory,
- Tests of radioactivity (concentration of radium isotopes) and occurrence of barium ions were conducted for groundwater pumped from a depth of over 500.0 m.
The hydraulic conductivity of aquifers was calculated using the Dupuit (1) formula, and the cone of depression size was determined based on the Sichtard formula (1) using the successive approximation method.
where:
k—hydraulic conductivity,
R—depression cone,
Q—discharge well,
r—well radius,
m—aquifer thickness,
s—drawdown.
Based on the obtained value of the hydraulic conductivity, water inflows (Q) of aquifers was calculated with the so-called “great well” method, using the following formula (2):
where:
Pumping tests were carried out in boreholes, without the use of observation (control) boreholes. In such a case, the cone of depression area calculation was done using the empirical Sichtard formula (1), which is widely accepted by hydrogeologists [6,7]. The Sichtard formula provides an approximated value of the cone of depression radius, of which the logarithm is often used in calculations of water inflow, thus its influence on the final result is minimized.
Based on data gathered from a 950-m-deep borehole A, drilled in 2007, 148 different rock layers were defined, as well as four aquifer systems:
- The Quaternary aquifer system at the depth of 4.50–16.00 m below the surface, in which the pressure head is equal to 0.026 MPa.
- The Triassic aquifer system at the depth of 112.10–222.35 m below the surface, in which the pressure head is 0.915 MPa and the average value of the linear slit index is 6.7.
There are two aquifers in Carboniferous formation:
- The Upper Carboniferous aquifer system at the depth of 234.00–516.00 m below the surface, in which the pressure head is 1.225 MPa and the average am value of the linear slit index is 5.4.
- The Lower Carboniferous aquifer system at the depth of 516.00–947.24 m below the surface, in which the pressure head is 3.376 MPa and the average value of the linear slit index is 4.2.
An example of a graph showing the linear slit index is presented in Figure 3. Similar graphs were prepared for the Carboniferous formations of Westphalian B, C, and D.
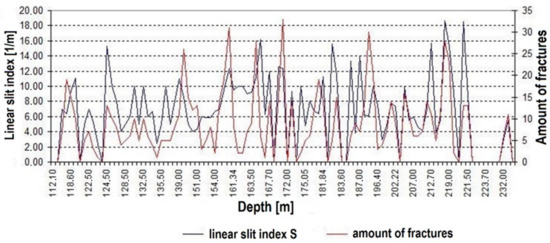
Figure 3.
Graph of the average fracture amount per meter in Triassic formation in the borehole A.
Groundwater was also sampled in borehole A on different levels. The analysis of samples confirmed a phenomenon of rising groundwater mineralization with depth (Figure 4.). The value of the total mineralization rises from about 0.35 g/L in overburden formations, through 3.25 g/L at the depth about 560 m, up to 4.9 at the depth of 700 m.
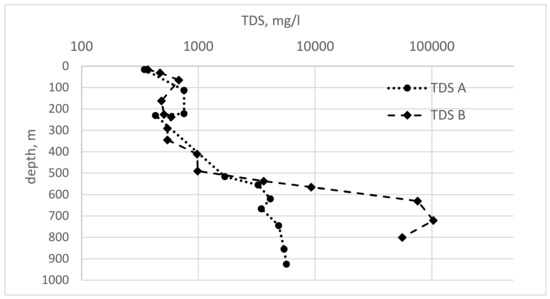
Figure 4.
Total dissolved solids (TDS) profile in boreholes A and B.
Key hydrogeological parameters of different formations are shown in Table 1.

Table 1.
Results of hydrogeological investigation in boreholes A and B.
Calculations revealed that the maximum expected total water inflow is 14 m3/min. Considering fractured and cavernous rock mass (Triassic formation) and pressurized groundwater in some aquifers, the possibility of sudden uncontrolled water inflow to the shaft was recognized as a real threat. Depth intervals in the permeable Carboniferous formations in which the average value of the linear slit index is greater than or equal to double the average value of this index for the aquifer were specified, as well as areas of increased values of RQD, which might be an indicator of increased accumulation of water. Data gathered during drilling show a risk of fault zones occurrence on depths of 109.8, 461.8, 462.8, and 570.5 m below the surface.
Based on the profile of the Quaternary formation, a 20m-deep diagram wall was proposed as a primary shaft lining in this section. The diagram wall could be built without lowering the groundwater level. It is a construction element and it is made of adhering sections. The occurrence of the Tertiary loam below the Quaternary formation allowed the shaft at this section to be sunk without using special methods.
The field and laboratory investigation conducted revealed that Triassic and Carboniferous aquifer systems are characterized with good and very good filtration properties. The Triassic aquifer is of fracture-karstic type, while the Upper Carboniferous aquifer is characterized by a high fracturing level. Both Triassic and Carboniferous formations are fractured. Groundwater in aquifers is under high hydrostatic pressure, while the rock mass has good collector properties. The conducted calculations shows that water inflow from the Triassic formation into the shaft during its sinking exceeds the acceptable value of 0.5 m3/min. A similar situation is forecasted for the Carboniferous formation. This situation requires prior rock mass sealing.
Hydrogeological conditions determined the design of the shaft lining and shaft sinking method. The value of water inflow into the shaft requires insulating the Upper Carboniferous, Quaternary, and Tertiary aquifer systems by using a water-tight shaft lining. General principles of rock mass sealing [8] were adapted to local conditions. The proposed construction of the shaft lining consists of hydro-insulating screens, using modified loam as a base of hydro-insulating solution [9]. Elements of the hydro-insulation include eight control-injection boreholes, which are located on the circle around the shaft outline at the distance of no less than 4–5 m and no higher than 10–12 m from the outline. In case of discontinuity of the shaft insulation, there is the possibility of supplementary rock mass sealing behind the lining from the shaft heading [10]; however, such a situation should not happen.
Some rock layers of the Carboniferous formation, especially sandstone of the Libiąż layers, is characterized with low values of strength. Fractures in fault zones, high hydrostatic pressure, and a low strength value of rock mass might affect rock falling of the shaft walls and expanding of the shaft heading area. In such situations, a web depth should be reduced to 2–3 m. After exposure of the fractured areas in the shaft heading, shaft walls should be supported with a temporary lining or covered with steel segments, or any other way of preventing rocks from falling down from the walls should be used. For certain rock layers, it is recommended to prevent them from contact with water, because of their tendency for dripping (basing on the test of Skutta [11]) and to reduce their exposure time to a maximum of 4 h.
A concept of shaft lining at this stage comprises the following lining solutions:
- Multilayer lining with hydro insulation:
- ▪
- Concrete + concrete panels lining,
- ▪
- Concrete + concrete lining,
- Concrete + concrete panels complex lining,
- Single-layer concrete lining with drainage.
The designed panel lining consists of 0.25 m thick concrete panels made of C20/25 class concrete. One of the lining’s section comprises C35/45 concrete panels. The primary concrete lining is to be made of C25/30 concrete of a thickness between 0.3 and 0.55 m. The permanent lining is designed as a 0.5–1.1-thick concrete layer from C20/25 to C35/45. The primary column of the complex lining is to be made of 0.5 m-thick (0.9 m at one section) C25/30 class concrete (C35/45 at the 0.9 m-thick section). The permanent lining is to be made of 0.25 m-thick concrete panels of C25/30 class concrete (locally C30/37). The remaining section of the shaft is to be supported with a single-layer lining of C20/25 to C30/37 class concrete with a thickness between 0.75 and 0.85 m.
2.2. Borehole B—Stage II
Field and lab investigations of borehole A revealed difficult hydrogeological and engineering conditions in the profile of the designed shaft. As a proper hydrogeological investigation is crucial for the shaft design, additional research should be conducted [12]. To provide more accurate data of geological conditions, borehole B was drilled in 2014 to the depth of 830 m, at the distance of 13m from the designed shaft. An additional hydrogeological investigation was also related to the proposition of change of the shaft sinking method—from hydro-insulating shields to ground freezing. Similar to the borehole A drilling process, drilling fluid loss zones, tightening, and breakouts in the boreholes were analyzed. In situ tests revealed numerous fracture and tightening zones.
Hydrogeological tests in borehole B consist of drawing water using sludger in case the water inflow is less than 10l/min or a deep-well pump for greater inflow values. Pumping with the deep-well pump was conducted with one to three depressions, increased by about one-third of the lowered water head after the water table stabilization. The conducted research allowed to determine the depth and thickness of aquifers and their hydrostatic pressure and hydraulic conductivity. A scope of conducted tests was similar to the case of borehole A, but sampling density was significantly higher. One hundred and fifty-four geotechnical layers were specified. Basied on the conducted investigation, 16 aquifers were identified, of which 2 were in the Quaternary formation, 1 was in the Tertiary-Triassic formation, 2 were in the Triassic formation, and 10 were in the Carboniferous formation. Calculations of hydraulic conductivity and water inflow for aquifers were conducted using the same formulas as in the case of borehole A, but for 16, not 4 aquifers. The results of these calculations are presented in Table 1.
Comparison of the water mineralization revealed significantly greater values of TDS measured in borehole B. In the overburden, it is about 0.55 g/L. At the depth of 560 m, it is equal to 9.25 g/L, while in borehole A, it was only 3.25 g/L. Similarly, below 600 m, TDS varies between 75 and 103 g/L, while in borehole A, it was between 3.5 and 4.9 g/L. Such differences might be an effect of the fault zone occurrence, which allows for both freshwater descending from the overburden formations and brine ascending from deeper formations. Water flow is additionally stimulated by mine workings drainage in this area.
Protecting the shaft walls with a water-tight shaft lining as presented above in terms of calculated water inflows into the shaft might be very complicated [13]. The occurrence of weak rocks softening in water, together with the necessity for reducing water inflows into the shaft, forced the use of the special shaft sinking method, which is ground freezing, to the depth of 475 m. The depth of freezing is based on rock mass hydraulic conductivity, porosity, RQD, and the Protodyakonov coefficient [14]. Below this depth, a 280 m-long drainage hole is designed for the purpose of drainage in the shaft heading. Water is to be transported with the borehole to the mine drainage system. The designed borehole is protected by a steel casing pipe with a diameter of 150 m, and it is able to discharge water in an amount several times greater than its inflow into the shaft.
Ground freezing to the depth of 475 m is carried out using 40 freezing boreholes. Three additional boreholes were drilled for the purpose of control of the ground freezing process. The cooling capacity of the freezing installation is 4.0 MW. The designed shaft sinking method is realized using the shaft excavator in the frozen section. The drill and blast method is forbidden in this section, because of the risk of freezing boreholes damage done by an explosion. The remaining shaft section is to be sunk using the drill and blast method.
The following figures present elements of freezing installation, including the model of the primary system in Figure 5, the model of the secondary system in Figure 6, the cross section of freezing channel between refrigeration plant and shaft in Figure 7, and the cross section of freezing ring in Figure 8. The primary system includes three freezing units, so-called chillers PAC SAB 283 E eco, in which the freezing medium is ammonia. They are cooled by cooling towers Evapco AT 18-3M14. The refrigeration plant also consists of isolated pipes for medium transfer, a brine tank, a discharge tank, a water treatment station, eight pumps, and an armature. The secondary system is basically a channel comprising pipelines used to transfer coolant from refrigeration plant to freezing boreholes and back. The channel consists of two main parts, one of them is a freezing ring and the other one is a channel between the freezing ring and the refrigeration plant. The freezing channel contains two pipelines with a diameter of 350 mm—inlet and outlet pipelines and one venting pipeline with a diameter of 65 mm. Around the shaft outline, pipelines are circle-shaped. The freezing boreholes’ pipes are connected directly to pipelines in the freezing ring.
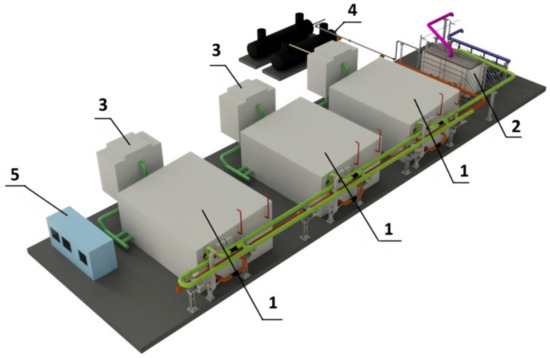
Figure 5.
Model of the primary system of freezing installation: 1—cooling aggregates, 2—brine tank, 3—cooling towers, 4—discharge tank, 5—water treatment station.
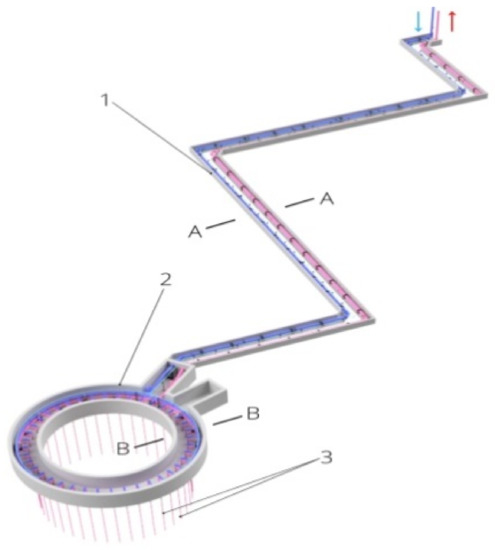
Figure 6.
Secondary system of the freezing installation: 1—freezing channel, 2—freezing ring, 3—freezing boreholes.
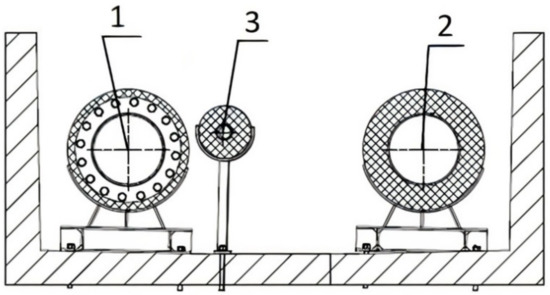
Figure 7.
Cross section through the freezing channel (A-A): 1—inlet pipe, 2—outlet pipe, 3—vent pipe.
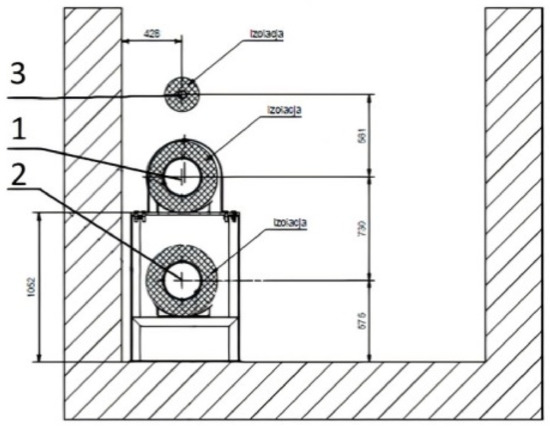
Figure 8.
Cross section through the freezing ring (B-B): 1—inlet pipe, 2—outlet pipe, 3—vent pipe.
More accurate results of the hydrogeological survey are reflected in the updated shaft lining design. Construction of the shaft lining is basically the same and consists of a multilayer lining with hydro insulation and a complex lining at the frozen section, and a complex and single-layer lining at the remaining section. However, the parameters of lining elements have changed, particularly concrete class, which in the case of panels is at least C30/37 and for concrete lining is between C30/37 and C40/50 class. In fault zones, reinforced C40/50 class concrete lining is designed. The thickness of the modernized shaft lining is between 0.85 and 1.2 m.
Figure 9 presents the layout of the shaft lining of two shaft sections. On the left, the top section of the shaft is shown, including the diagram wall, panel lining, backfill pipeline channel inlet, and shaft collar. On the right, the multilayer lining, comprising panels and concrete, is presented.
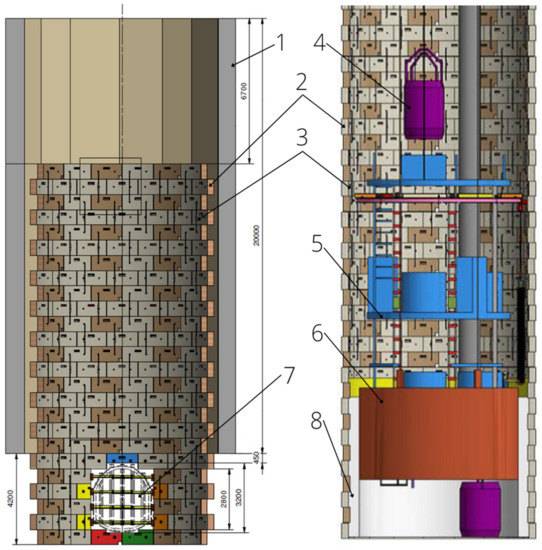
Figure 9.
Layout of the shaft lining: 1—diagram wall, 2 –concrete panel (grey—standard panel; brown—panel with gaps for concreting; yellow, blue, red, green, orange—special construction panel), 3—panel fasteners, 4—sinking bucket, 5—suspended stage, 6—steel formwork, 7—inlet of backfill pipeline channel, 8—final concrete lining.
2.3. Mine Workings—Stage III
Since 2002, coal has been excavated from seams no. 207 and 209 on the north from the designed shaft location. Coal seam no. 207 was excavated at the distance of 1.7 km to the north and 1.3 km to the north-east from the borehole B, at depths between 670 and 550 m. The excavation height in this area is up to 4.6m. Coal seam no. 209 was excavated at the distance of 1.7 km to the north-east from the borehole B, and at the depth of 650 m. Seam’s thickness is up to 4.3 m. Both coal seams were excavated using the longwall method with caving.
In 2019, the development of roadways at the level of 540 m started. New workings were to connect existing excavations with the shaft. The biggest challenge in this process was a fault zone of about 120 m throw, located about 300 m north of the shaft. Rock mass, in which newly developed workings are made, are characterized with low strength, which is effective in inflows of water and bulk material into workings. Values of these inflows varied in time. Drainage and test boreholes, drilled from mine workings, were tightened or filled up with loose rock material inside the fault zone. Boreholes were drilled from several adjacent excavations and allowed to investigate a 300-m-long part of the fault zone. Water pressure in boreholes did not exceed 1.7 MPa, and groundwater chemistry, based on samples from different boreholes, is typical both for low mineralization seepage water and highly mineralized water (brine), which is characteristic for the Carboniferous formation. The conducted tests revealed a rise of open porosity to about 15.7% and hydraulic conductivity to an average value of 1.9 × 10⁻⁶ m/s, several dozens of meters from the fault zone. Water inflow to one of the developed workings reached 2 m3/min; however, its value decreased over the time. Peak values of water inflow were about 0.6 m3/min. Water usually contained a significant amount of loam and sand material. The records of the drilling process of boreholes penetrating the fault zones also indicates strong and uneven water accumulation.
Roadways development at the level of 540 m allowed to gather supplementary data about water accumulation of the fault zones and possible connections between aquifer systems in different formations via the fault zone. In addition, data on water pressure in the fault zones and conditions of groundwater flow were collected.
Data on hydrogeological conditions, fault zones, and geotechnical conditions, gathered during the roadways development at the level of 540 m, caused a necessity for another modification of shaft lining construction. New construction of the designed shaft lining has to deal with difficult conditions identified during mining activity at the level of 540 m. The concept of the shaft lining construction did not change. Key differences between previous and new shaft lining construction occur in the area of fault zones and in the application of rock mass injection, which was not considered necessary in previous projects.
Distinctive changes in the original shaft lining project concern fault zones and the shaft section between the depths of 215.4 and 238.0 m, which is a zone of extensive stress. The designed shaft lining in this section comprises steel sections and a concrete layer and is able to transfer loads of 4.6 MPa. In the area of fault zones, a similar solution of a steel and concrete complex shaft lining, able to transfer loads of 4.0 MPa, was designed. In the described sections, concrete panels were replaced with steel sections of different types, depending on the load to transfer. The shaft lining on these sections also consists of q 0.73 m-thick layer of C50/60 class concrete. The layout of the steel sections ring is presented in Figure 10. Orange and blue panels are so-called closing segments, which are assembled in the last step.
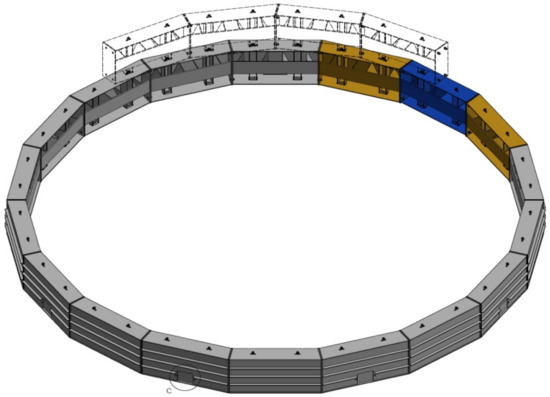
Figure 10.
Layout of the steel sections ring (grey panels—typical segments, blue and orange panels—closing segments).
The application of sealing and reinforcing rock mass injection as well as the preliminary injection in different mine shaft sections was also considered necessary. The sealing injection is to be carried out in the vicinity of bottom ends of the freezing boreholes, after the ground defreezing. Injections are to be done at four levels, at depths of 474.90, 476.90, 478.90, and 480.90 m. Rock mass is to be reinforced with a reinforcing injection at the depth of 624.50 m. For the purpose of rock mass injection, eight horizontal boreholes, drilled through the shaft lining, are to be used on each of listed levels. The designed diameter of boreholes is 40 mm.
The necessity for a preliminary rock mass injection is caused by the occurrence of weak and fractured (RQD < 50%) rock mass in a shaft profile over the depth of 473.90 m. In this area, there is a risk of rock falls from shaft walls, which might affect problems with proper shaft lining installation. The decision of using this method of rock mass reinforcement is to be made by the Head of Mining Operations in cooperation with a geologist. A preliminary injection is to be carried out with eight boreholes, drilled from the shaft bottom at an angle between 15 and 30 degrees, along the shaft outline. The maximum length of the injected section must not exceed 8m. The number of boreholes might be changed by a decision of the Head of Mining Operations. The minimum diameter of boreholes is 50 mm. A preliminary sealing and reinforcing injection is to be carried out using expansion heads and polyurethane adhesives.
3. Discussion
Coal exploitation in coal seams no. 207 and 209 and water drainage caused by this process affected the cone of depression occurrence, at a range of about 2.5 km from goaf, therefore reaching the area of designed shaft. It should be noted that the cone of depression size was defined for the layer of permeable sandstones in the roof of excavated coal seams, while the size of the cone of depression and changes in water pressure in other aquifer systems were not defined, because of the lack of geological data.
According to Table 1, the number of hydrogeological tests conducted is significantly higher in the case of borehole B compared to borehole A. Accordingly, hydrogeological parameters obtained in the investigations in borehole A should be considered generalized and average, not related to specific aquifers.
The comparison of forecasted water inflows for boreholes A and B shows that differences between these values are insignificant in the case of overburden formations (Quaternary, Tertiary, and Triassic). However, in the Carboniferous formation, the value of water inflow is three times bigger for borehole A. This difference is an effect of coal excavation in coal seams no. 207 and 209, which changed hydrogeological conditions in this area. Excavation was carried out near the pillar of the designed shaft and caused water drainage of the Carboniferous formation and possibly overlying aquifer systems. A consequence of the drainage is that it also decreases the piezometric pressure in Carboniferous aquifers. According to the investigation carried out in boreholes A and B, the water table in Carboniferous aquifers decreased by about 20 m, while in bottom aquifers, it was up to 88 m. Water drainage caused the development of a cone of depression of significant size, inclined towards goaf. According to lower values of water inflows, obtained in pump tests in borehole B, the calculated values of hydraulic conductivity and forecasted water inflow are also lower. It is notable in aquifers X to XIV, which are under the influence of intensive drainage caused by goaf. It should be noted that despite this situation, the results obtained in calculations based on the data gathered in borehole B are correct, because water relations in this area are not be restored. On the contrary, Carboniferous aquifers are to be drained, which will affect the total drainage of static resources in this area. Inaccuracy in determining water inflows into the shaft are usually caused by a lack of data or errors in forecasting [15], which in turn requires taking into account the specific value of estimation error for the purpose of the shaft lining design.
Modifications of shaft sinking technology and shaft lining design, caused by the growing accuracy of the hydrogeological data, are mostly changes in the construction of the designed lining. Subsequent modifications are connected to rising concrete class or lining thickness, and in some cases, both of these parameters. Additionally, the investigation of fault zones and other areas of increased pressure caused the necessity for the application of complicated, high-strength construction of a shaft lining, primarily made of reinforced concrete and, in the final project, made of steel. This project introduces a steel and concrete complex lining, which consists of a 0.7 m-thick layer of C50/60 concrete class.
Sudden and uncontrolled water inflows into a sunk [16] or operating shaft [17] in the Silesian Coal Basin are extremely rare, but such situations have happened in history. Accurate investigation of rock mass allows one to locate potentially dangerous zones, which can be a threat for shaft stability. To prevent their influence on the shaft, it is necessary to reinforce rock mass in specific areas, e.g., using preliminary or sealing injection. Sealing injection can be very important at the stage of defreezing rock mass in the vicinity of the shaft. The stages of the hydrogeological conditions investigation presented here revealed that shaft design requires an individual approach to this process [18]. It can also be stated that guidelines for shaft design and sinking included in mining regulations and Standards should be treated like general guidance.
4. Conclusions
Shaft sinking is always an expensive venture, which takes many years to complete. The process of the shaft design itself might last several dozens of months and requires significant financial expenses and cooperation of numerous experts in mining, mechanics, civil and electrical engineering, as well as in many other fields, like geology. Proper geological investigation is crucial for the whole process of the shaft design. In the case of an area like the Silesian Coal Basin, where numerous aquifer systems occur, a hydrogeological survey is vitally important.
The example of the designed shaft presented above shows the importance of proper hydrogeological investigation and its impact on the shaft lining design. Subsequent stages of this investigation affect the modifications of shaft lining design, requiring its higher strength, which was done by the application of a higher concrete class or a thicker layer. Ultimately, the application of customized, high-strength constructions was recognized to be necessary.
Obviously, such an intervention in shaft lining construction raises investment cost, as higher-class concrete is consequently more expensive. Similarly, its thicker layer requires higher amounts of concrete, which also raises expenses. Additional reinforcement of the shaft lining or rock mass also incurs extra cost. The necessity for constant modifications of the shaft lining project also raises investment cost, because it requires man hours spent by designers. It is not difficult to imagine a situation where shaft sinking is no longer profitable, because potential gains can no longer cover huge expenditures incurred by the investor, especially taking into account the fluctuations in the resources market and the insecure future of coal-based energy in Europe.
The incurred expenses and their sudden and unexpected growth cannot cover the biggest advantage of proper and accurate hydrogeological survey, which is safety. Incorrect or inaccurate geological survey can lead to a catastrophe, in which the lives and health of people can be in danger.
Author Contributions
Conceptualization, K.d.; methodology, K.d.; data curation, K.d. and P.K.; formal analysis: J.M.; project administration, K.d.; supervision, K.d.; validation, P.K.; writing, P.K. K.d. is responsible for hydrogeological parts, J.M. is responsible for analysis of water threats, P.K. is responsible for engineering elements, i.e., shaft lining and sinking method analysis. All authors have read and agreed to the published version of the manuscript.
Funding
This research received no external funding.
Institutional Review Board Statement
Not applicable.
Informed Consent Statement
Not applicable.
Conflicts of Interest
The authors declare no conflict of interest.
References
- Kostrz, J. Górnictwo tom VI, Wykonywanie Wyrobisk część 2, Głębienie Szybów Metodami Specjalnymi; Wydawnictwo Śląsk: Katowice, Poland, 1964; p. 436. (In Polish) [Google Scholar]
- Ledingham, P.; Proughten, A.J.; Saulnier, G.J., Jr. Science Design for Two Shafts in Phase 1a of the Proposed Rock Characterisation Facility at Sellafield, UK. Characterization and Evaluation of Sites for Deep Geological Disposal of Radioactive Waste in Fractured Rocks, Proceedings from The 3rd ASPO International Seminar Oskarshamn; Technical Report TR-98-10; Svensk Karnbranslehantering AB: Stockholm, Sweden, 1998; pp. 303–314. [Google Scholar]
- Daw, G.P.; Fear, N.J.; Jeffery, R.I.; Pollard, C.A. Hydrogeological Investigations and Ground Treatment for Shaft Sinking at Asfordby New Mine. In Proceedings of the 3rd International Mine Water Congress, Melbourne, Australia, October 1988; pp. 683–692. [Google Scholar]
- Ministry of the Energy of Poland. Regulation of the Minister of the Energy of November 23, 2016 of specific requirements of work of underground mines. J. Laws Pol. 2017, Item 1118. [Google Scholar]
- Polski Komitet Normalizacyjny. PN-G-05-16:1997 Szyby górnicze—Obudowa—Obciążenia, 1997.
- Soni, A.K. Importance of Radius of Influence and its Estimation in a Limestone Quarry. J. Inst. Eng. India Ser. 2014, 96, 77–83. [Google Scholar] [CrossRef]
- Yihdego, Y. Engineering and enviro-management value of radius of influence estimate from mining excavation. J. Appl. Water Eng. Res. 2017, 6, 329–337. [Google Scholar] [CrossRef]
- Daw, G.P.; Pollard, C.A. Grouting for Ground Water Control in Underground Mining. Int. J. Mine Water 1986, 5, 1–40. [Google Scholar] [CrossRef]
- Kipko, E.I.; Kipko Eh, Y.; Williams, R.E. Integrated Grouting and Hydrogeology of Fractured Rock in the Former USSR; Society for Mining Metallurgy & Exploration Inc.: Englewood, CO, USA, 1993. [Google Scholar]
- Qing, Y.; Kexin, Y.; Jinrong, M.; Hideki, S. Vertical Shaft Support Improvement Studies by Strata Grouting at Aquifer Zone. Adv. Civ. Eng. 2018, 2018, 5365987. [Google Scholar] [CrossRef]
- Skutta, E. Einfache gesteinsmechanische Untersuchungen als Grundlage der Ausbauplannung. Glückauf 1962, 98, 1455–1461. [Google Scholar]
- Greenslade, W.M. Water Control for Shaft Sinking. Presentation AIME Annual Meeting New Orleans, Louisiana; Society of Mining Engineers of AIME: Littleton, CO, USA, 1979; pp. 79–138. [Google Scholar]
- Kostrz, J. Głębienie Szybów, 2nd ed.; Szkoła Eksploatacji Podziemnej: Kraków, Poland, 2014; p. 686. (In Polish) [Google Scholar]
- Duda, R. Methods of Determining Rock Mass Freezing Depth for Shaft Sinking in Difficult Hydrogeological and Geotechnical Conditions. Arch. Min. Sci. 2014, 59, 517–528. [Google Scholar] [CrossRef]
- Chudy, K.; Worsa-Kozak, M.; Pikuła, M. Rozwój metod rozpoznania warunków hydrogeologicznych na potrzeby wykonywania pionowych wyrobisk udostępniających złoże—Przykład LGOM. Prz. Geol. 2017, 65, 1035–1043, (In Polish, with English summary). [Google Scholar]
- Czaja, P.; Kamiński, P.; Dyczko, A. Polish Experiences in Handling Water Hazards during Mine Shaft Sinking. In Mining Techniques—Past, Present and Future 2020; InTech Open: London, UK, 2020. [Google Scholar] [CrossRef]
- Bukowski, P. Water Hazard Assessment in Active Shafts in Upper Silesian Coal Basin Mines. Mine Water Environ. 2011, 30, 302–311. [Google Scholar] [CrossRef]
- Drabek, J.; Sanocki, T.; Wojtaczka, M. Modyfikacja Konstrukcji Obudowy i Technologii Głębienia Szybu w Zawodnionym Górotworze o Niskich Parametrach Wytrzymałościowych. Inż. Gór. 2014, 1, 49–52. (In Polish) [Google Scholar]
Publisher’s Note: MDPI stays neutral with regard to jurisdictional claims in published maps and institutional affiliations. |
© 2021 by the authors. Licensee MDPI, Basel, Switzerland. This article is an open access article distributed under the terms and conditions of the Creative Commons Attribution (CC BY) license (https://creativecommons.org/licenses/by/4.0/).