1. Introduction
The challenge of climate change has led the European Union to a steadfast commitment towards a new energy strategy based on a more secure, sustainable and low-carbon economy. This includes the target of reaching at least a 27% share of renewable energy by 2030 and a 40% reduction in greenhouse gases by 2050 [
1,
2]. In order to achieve such goals, private investment on infrastructure and low-carbon technologies will play a key role. Among the existing technologies, solar photovoltaic (PV) is expected to make a substantial contribution given its potential in many regions, the environmental benefits and the economic profitability [
3,
4]. After years of massive deployment, PV is achieving economic competitiveness with other generation sources in many countries and market segments [
5,
6,
7].
At the residential sector, the cost of PV electricity competes with national grid prices rather than with the generation cost of other sources. Grid electricity is typically more expensive for residential customers, since it includes transmission and distribution costs, as well as taxes, margins and other charges. In contrast, households having a PV system can directly consume their own electricity free of charge. The excess, if any, can be fed into the grid, while the default can be bought from the grid; under a producer–consumer scheme commonly known as “prosumer” [
8]. Hence, when PV electricity is lower than grid prices, utility bills are reduced, and prosumers become profitable.
However, the mismatch between generation and consumption brings the need to inject to the grid a significant part of the PV electricity and only a limited part of the generation can be self-consumed [
9]. The addition of a battery storage enables a higher flexibility for the purchase and sale of electricity, so it can increase self-consumption (share of locally generated electricity that is consumed in-house) and self-sufficiency (share of demand supplied by the domestic PV system) [
10]. Considering the downward trend in the cost of batteries [
11], battery storage along with PV systems emerges as an attractive option for prosumers [
12,
13].
In addition, although the expected financial benefit of residential PV systems is usually a core determinant [
14], research has shown that non-financial benefits such as the aspiration of energy self-sufficiency is also a crucial driver for the investment on domestic renewable facilities [
15,
16]. Therefore, it is important to recognise both economic and environmental benefits as important, in order to align with the current investment motivations [
17].
Over the last few decades, residential PV generation for self-consumption has been promoted by governments through incentives and support schemes [
18]. Such schemes are intended to foster the integration of PV into the electricity market and generally favour the exploitation of energy storage systems [
19]. As a result, there is an increasing interest in the support of PV and battery storage integration through regulation mechanisms [
20]. Additionally, with the steady increase in grid prices [
21], there is a growing interest among residential PV system owners to increase self-consumption and self-sufficiency [
22]. In Spain, transition efforts have been geared by the self-consumption regulation issued in April 2019 [
23]. The law differentiates two types of prosumers [
24]:
Prosumers with facilities up to 100 kW can adopt a net billing mechanism to discount the PV energy injected to the grid from the monthly bill, at a compensation rate of around 30% of the retail price. This value can be an hourly or fixed rate, depending on the contract. In addition, the discount cannot exceed the monthly bill.
Alternatively, prosumers can inject the excess PV production to the grid at a wholesale price, discounting taxes and the grid access charge, as any other retailer.
Although the net billing mechanism is promising to increase PV penetration at the residential sector, the techno-economic impacts in the coming years remain unknown, as they significantly depend on different conditions: the solar irradiation, the load profile, the battery storage, the technology costs and the grid sell/buy prices, among others. Therefore, these factors have to be examined.
1.1. Literature Review
The literature provides a limited understanding of the effects of self-consumption regulation on the economics of PV-battery systems. For instance, many authors have analysed different drivers for achieving grid parity of PV systems; i.e., when PV costs become cheaper than grid prices [
25,
26,
27,
28]. Techno-economic factors such as PV costs, grid prices and facilities location have been examined, but also policy frameworks including feed-in tariffs and other relevant regulations. Regarding battery storage, Hoppmann et al. [
29] and Vieira et al. [
11] explore the impact of battery costs and grid price variations on the profitability of PV–battery systems at a single location. Nyholm et al. [
30] focus on the technical issues of self-consumption in PV–battery systems. Khalilpour and Vasallo [
31,
32] carry out detailed analyses of PV–battery facilities for self-consumption in Australia. They include factors such as PV and battery sizes, the feed-in tariff, the costs of technologies and the geographical location. Green and Staffell [
8] concentrate on the British market and its feed-in tariff regulation; while Kaschub et al. [
33] focus on Germany and instead of a feed-in tariff they consider a market-based earning over the planning horizon. However, the above works do not examine the influence of load profiles on PV–battery profitability and neither do they carry out sensitivity analyses of input parameters.
Some authors have analysed the influence of the load profile on the profitability of battery supported PV systems. For instance, Barbour and González [
34] analyse the profitability of household PV–battery systems in different regions of the USA. For this purpose, they consider different pricing schemes as well as real demand and generation data. They find that PV is already economically feasible, while batteries are not, despite the fact that they can increase self-sufficiency. Fares and Webber [
35] quantify how energy storage can reduce dependence on the utility grid in Texas (USA). Linssen et al. [
9] develop a cost optimisation model for sizing PV–battery systems, showing how results are highly sensitive to the load profile and the regulation framework. On their behalf, Beck et al. [
36] develop an optimisation model for the operation and investment of residential facilities, examining different feed-in tariff schemes. Bertsch et al. [
37] propose a simulation model for the analysis of PV–battery systems’ profitability in Germany and Ireland. The results compare the performance in both countries and examine how the demand can partially become independent from the grid. Finally, O’Shaughnessy et al. [
38] examine how the load control can impact on the economic performance of PV–battery systems, using the REopt (Renewable Energy Integration and Optimization) model.
In recent years, the analysis of profitability under low compensation rates or in the absence of subsidies has been examined: in the Italian residential sector [
39] or comparing Germany, Switzerland and Austria [
5]. However, less attention has been paid to the impact of low compensation rates on both the value and sizing of PV–battery systems. In Spain, there are profitability assessments that study the impact of the current regulation on self-consumption in residential buildings [
24,
40] (see
Table 1). These studies analyse the profitability of a representative Spanish house under average conditions, maximising an economic objective (the net present value or the internal rate of return). Yet, while they offer a valuable perspective of self-consumption PV installations, they do not consider battery storage and solely focus on financial objectives (
Table 1).
1.2. Contribution and Paper Structure
This paper proposes a techno-economic analysis of residential PV–battery facilities under the Spanish regulation. For this purpose, a simulation model is developed. As input data, the characteristics of PV–battery equipment and the location studied are taken into account. As output, the model obtains the system size, the economic profitability and the self-sufficiency. A computational experiment is carried out and a multi-scenario analysis is performed with data from five cities, representing different geographical and meteorological characteristics of the Spanish territory, as well as five load profiles, showing different typologies of Spanish families. In addition, a sensitivity analysis is carried out for parameters such as the compensation rate, the grid price and the cost of technology. In order to align with both economic and environmental investment motivations, the analysis is performed for two alternative objectives: (i) maximising the net present value and, (ii) maximising the self-sufficiency with no extra cost. Results show that, when the maximum profitability is sought, the cost-effectiveness of PV-based facilities widely depends on the load profile and, in a lesser amount, the city location and the compensation rate. When the maximum self-sufficiency is sought, economic benefits are used to purchase additional panels and batteries in order to become more independent from the grid, although remaining far from total independence. Finally, the sensitivity analysis shows a limited impact of the grid tariff and the technology cost on the size of PV systems, but a relevant influence on the economic performance. Both the results obtained, and the simulation model developed can be helpful for investors and families, in order to quantify the risks and benefits when implementing domestic self-consumption facilities.
The remainder of the paper is structured as follows. In
Section 2, the simulation model is described, including the techno-economic characteristics considered. In
Section 3, the computational experiment is carried out to test different load profiles at different Spanish cities. In
Section 4, the results are examined, and a sensitivity analysis is carried out to improve the robustness of the analysis. Finally, in
Section 5, the main conclusions are summarised.
2. Simulation Model
In this section, the proposed simulation model is described. First, an overall perspective of the model is provided (
Section 2.1). Then, the system is technically described (
Section 2.2) and the control strategy for electricity management is defined (
Section 2.3). Finally, the economic analysis performed is detailed (
Section 2.4).
2.1. Overall Perspective
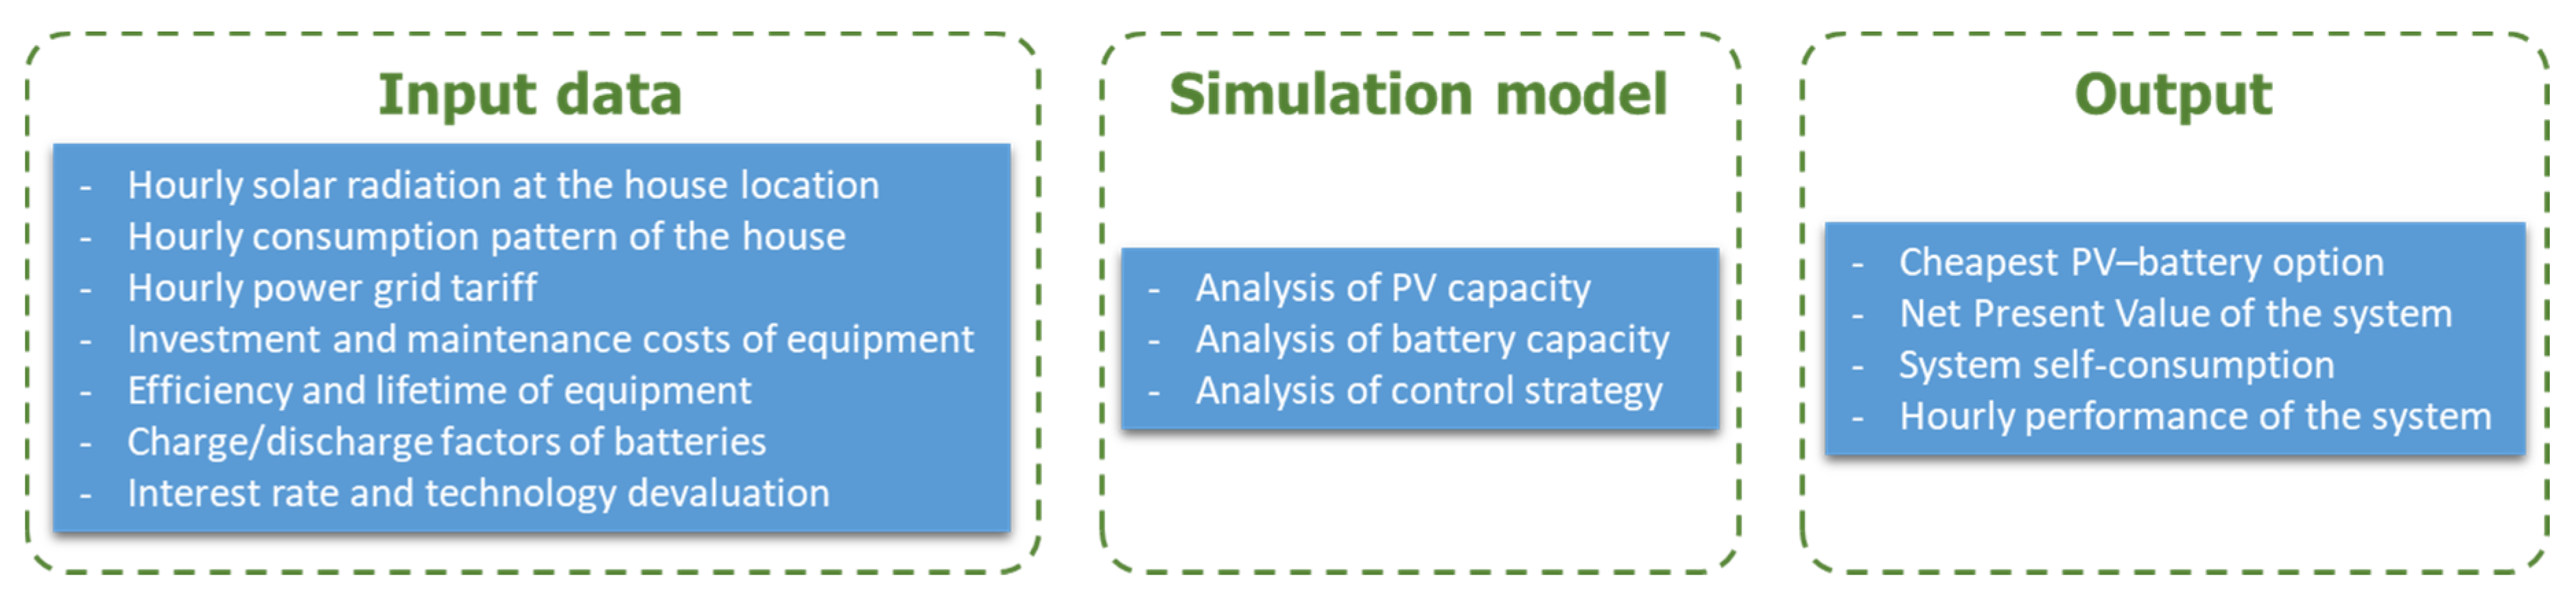
In order to analyse the techno-economic performance of PV–battery residential facilities, a simulation model is developed based on previous works [
41]. As input data, the model considers the household characteristics, including the solar radiation and the load profile, as well as techno-economic details about the equipment to be installed, the utility grid tariff and global indicators such as the interest rate and the technology devaluation. The complete list of input data is detailed in
Section 3. With this information, the model carries out an hourly analysis of the operation of the PV–battery system over the entire project lifetime. More specifically, given an instance (i.e., a specific set of input data), the model iteratively tests all the combinations of PV and battery size, within the set of values defined. For each PV–battery combination, the functioning of the system during the whole lifetime is simulated, taking into account the equipment (
Section 2.2) and the control strategy (
Section 2.3), as well as estimating the yearly savings and costs (
Section 2.4). In short, for each 1 h time slot, the best option to cover the electricity demand of the household is examined, considering, as the main resource to improve self-sufficiency, the PV production according to the solar radiation at that moment, the state of charge of the battery bank and the utility grid. Economically, the yearly savings of electricity from the grid, the saving in the utility bill from the PV electricity injected to the grid, and the costs of equipment (investment, maintenance and renewals) are estimated. As output, the most suitable PV–battery combination is returned both in terms of profitability and self-sufficiency maximisation. The results include details of economic indicators, such as the net present value, and technical indicators, such as the self-sufficiency percentage and the hourly performance. The simulation model inputs and outputs are illustrated in
Figure 1.
2.2. Technical Description
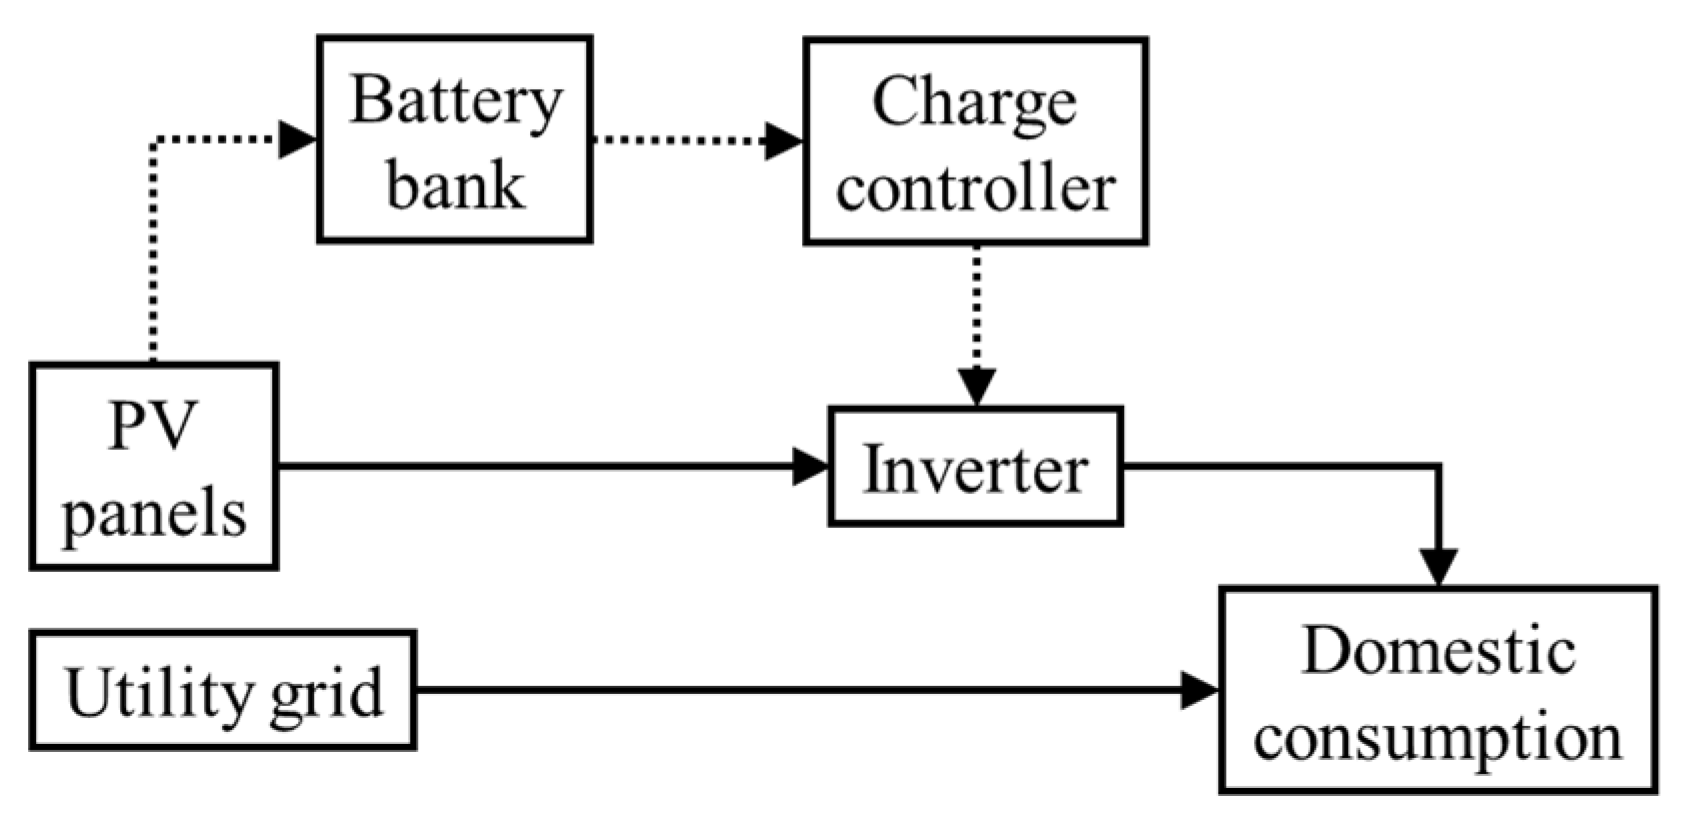
The proposed PV–battery system considers the supply of electricity from PV panels and the utility grid (
Figure 2). On the one hand, PV modules transform solar radiation into electricity at direct current (DC). Polycrystalline or monocrystalline silicon panels can be considered by adjusting the corresponding input data of the model. However, the former option is here considered because of their lower cost, more appropriate for domestic applications. Additionally, a maximum power point tracking could be also included, but it would raise the cost and technical complexity, making it less suitable for residential users. Then, an inverter is installed in order to transform the DC, leaving panels into alternating current (AC), which is used for most electrical appliances. These devices are a cost-effective alternative for domestic facilities. Batteries can be optionally installed to store the excess electricity from PV panels and supply it when the demand is not fully covered by the solar resource (please refer to
Section 2.3 for the detailed management of these devices). In this case, a charge controller coupled to the inverter is needed to properly manage the charge and discharge of the battery bank, avoiding overcharges and deep discharges that could damage the lifespan. Different battery technologies exist, each one having a different depth of discharge and expected lifetime. Again, different options could be taken into account in the model by adjusting the corresponding input data. In this work, lead acid batteries are considered given their affordable cost and proper performance. On the other hand, electricity can be supplied directly from the utility grid, at night-time or in cloudy days without solar generation. The whole system is assumed so as the PV–battery equipment is coupled to the utility grid.
2.3. Control Strategy
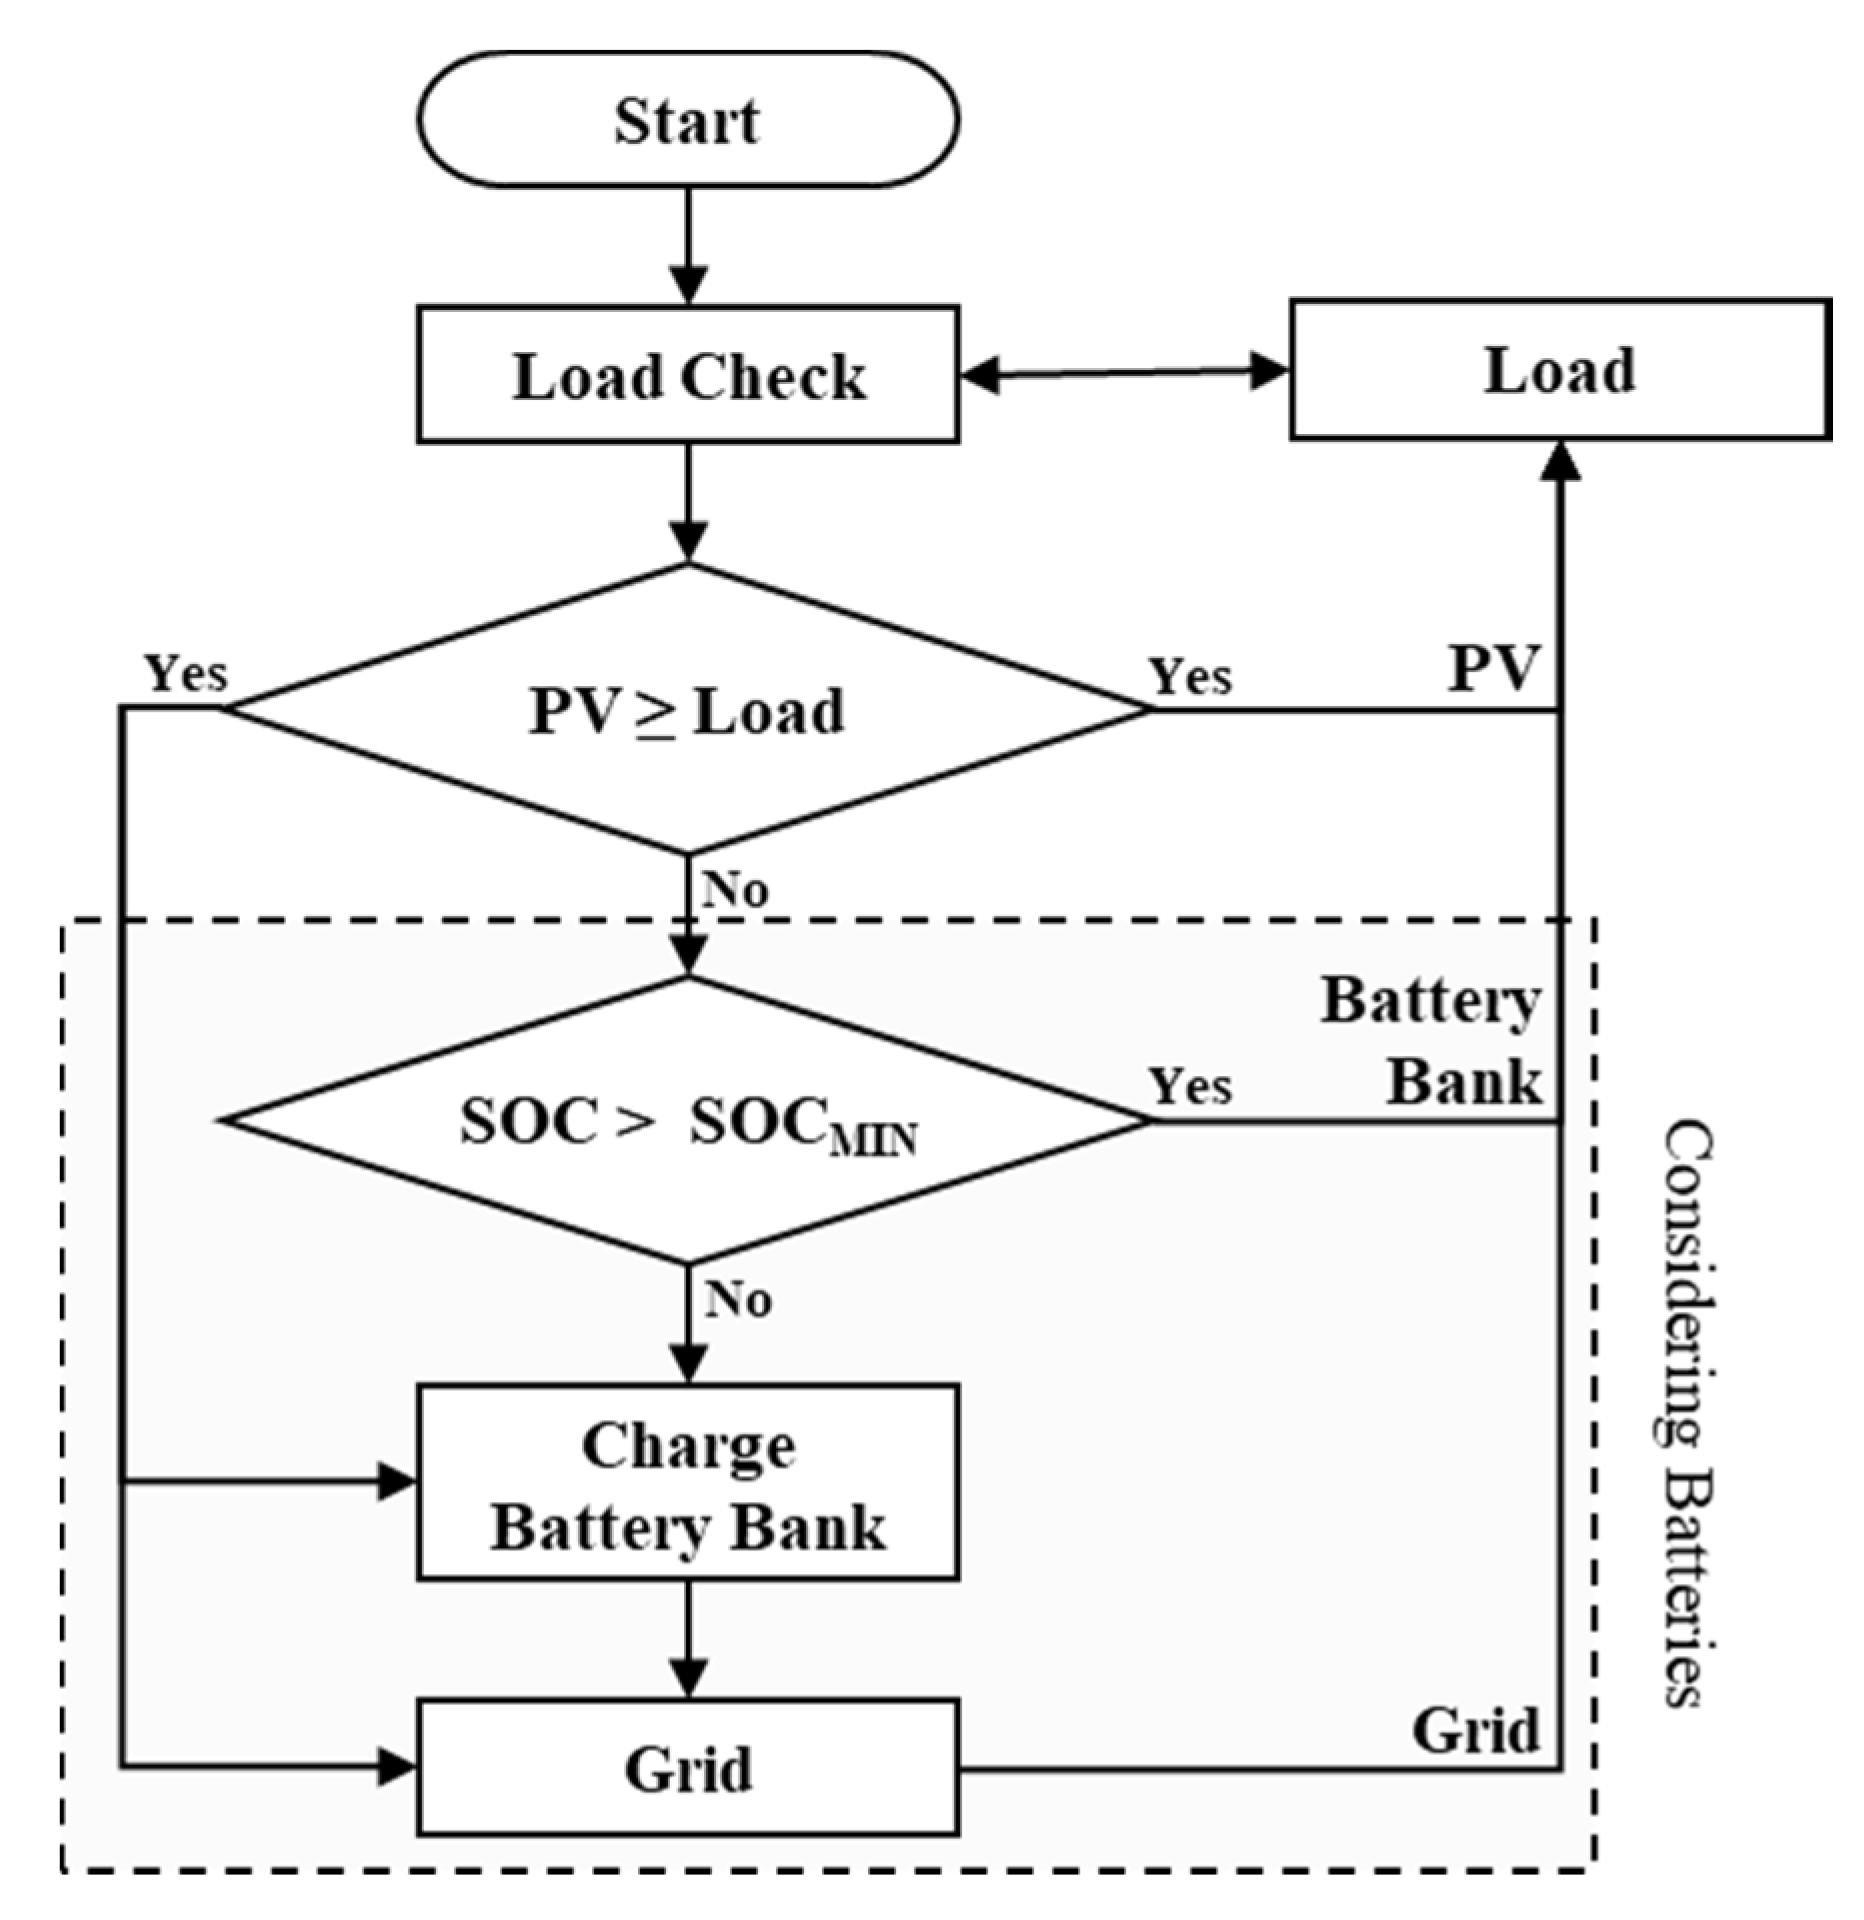
Figure 3 illustrates the control strategy for the studied system. The simulation model makes an hourly analysis of the system which is iteratively repeated over each year of the project lifetime. At each hour, the way electricity is supplied to the household is examined, so as demand never remains unmet. Hence, if the demand can be fully met by solar electricity, this resource is prioritised in order to take as much advantage as possible from PV panels. The excess electricity is stored in the battery bank to be used later, logically if such devices are included. Otherwise, or if the battery bank is full (state of charge, SOC = 100%), the excess electricity is supplied to the grid. Recent changes in the Spanish law establish that such electricity transfer is returned to the consumer as a discount in the monthly utility bill, at a percentage of the purchase tariff [
23].
On the other hand, at some hours the electricity from PV panels may not be enough to cover the demand. In this case, the lack is supplied from the battery bank if such devices are charged. When the battery backup is fully discharged (SOC < SOCMIN), electricity is consumed from the utility grid, thus incurring in a purchase tariff. This cost can be constant or variable, depending on the contract considered for the studied household. The utility grid can be conceived as an unlimited source of electricity, being available at any moment so as the demand is always satisfied.
It must be noted that the battery bank is the most critical issue in domestic PV facilities [
42]. Consequently, the control strategy aims to protect this device from overloads and deep discharges to enlarge its lifetime, respecting charge and discharge factors defined by manufacturers, even if this is detrimental for the techno-economic performance of the system.
2.4. Economic Analysis
The proposed simulation model provides as output, among other elements, the economic performance of the PV–battery system. This indicator considers the yearly cash flows estimated over the project lifetime, taking into account different aspects. The overall cash flow (
CF) Formula (1) and its elements are detailed next.
It must be noted that the interannual variability of savings and costs is significantly different. Most savings are obtained all over the project lifetime, while most costs occur at specific moments, and particularly the initial investment and the renewal of equipment. This situation could discourage potential residential adopters of PV–battery systems. However, this factor is assumed as not having any significant influence on the examination of how the Spanish regulation changes can impact on the performance of PV–battery systems.
ISAV represents the saving by the use of PV electricity instead of consuming from the grid. Under the framework of investment analysis, savings can be conceived as incomes. Each year, part of the electricity that would be consumed from the grid, in case of never installing a PV system, is directly supplied from PV panels at zero cost. Consequently, the sum of yearly savings (
IySAV) over the project lifetime (
L) is considered. This cost must be updated to the present value (year 0), taking into account the yearly electricity price increase (
e) and interest rate (
i), as shown in (2).
IRED represents the reduction in the utility bill by selling the excess PV electricity to the grid. According to Spanish law, the minimum value between the monthly consumption and sale to the grid is considered, applying a percentage factor on the electricity price. This factor does not allow a net payment, but a null bill in the most beneficial case for the user, and was defined to avoid abuses that could be detrimental for the entire electricity market. As before, the monthly utility bill savings over each year (
IymRED) are updated to the present value (3).
CINV represents the investment at the project beginning in all the equipment installed, as well as the installation and launching costs. This value is not updated as it only occurs in year 0, which is taken as reference for the economic analysis.
CMNT represents the maintenance cost over the project lifetime to ensure the appropriate operation of the system, generally estimated as a percentage of the investment value. This cost occurs annually (
CyMNT), so it is updated to the present value, as with the annual increase in maintenance (
m) and the interest rate (4).
CRPL represents the replacement cost of equipment when their lifetime is accomplished. Unlike maintenance, which can be properly approximated, the substitution depends on the expected lifetime of equipment, but if they finally remain working more or less time than predicted, some deviations will logically appear. The calculation is similar to the maintenance but considering the expected decrease in technology prices (
d) (5).
ISVG represents the salvage value of equipment that can still be used at the end of the project lifetime, either to be sold or for a future project. This value is also updated, although not as a sum but a unique income happening at year
L (6).
3. Computational Experiment
As explained in the introduction, this paper examines the techno-economic performance of PV–battery systems under the Spanish net billing scheme for excess electricity delivered to the grid. For this purpose, five Spanish cities and five real-based load profiles are studied. The five cities have been selected as representatives of the different climate conditions existing in the Spanish territory, all of them being regional capitals:
Barcelona: North-Mediterranean climate (scarce rains and soft temperatures).
Bilbao: Mid-Atlantic climate (abundant rains and soft temperatures).
Madrid: Continental (scarce rains and extreme temperatures).
Santiago de Compostela: Atlantic climate (abundant rains and cold temperatures).
Seville: South-Mediterranean climate (scarce rains and high temperatures).
For each city, the climate conditions and, in particular, the solar radiation are determined from the PVGIS (Photovoltaic Geographical Information System) database [
43], which collects worldwide hourly data. Regarding the profiles, different hypotheses in terms of characteristics, number and customs of inhabitants are considered. To obtain them, the Load Profile Generator software is used [
44].
Table 2 shows, for each profile (from 1 to 5), the software code, the household members and the percentage of electricity consumed at daytime hours.
In addition, several values are taken into account regarding different parameters that can have an influence on the techno-economic performance of the PV–battery facilities:
Utility grid price. Two options are considered: a constant tariff at 0.1255 EUR/kWh and a day–night tariff 0.08 EUR/kWh from 22 pm to 12 am and 0.16 EUR/kWh from 12 am to 22 pm. A −20%, −10%, +10% and +20% variation with regard to the original values is taken into account.
Compensation rate. The value established by the Spanish law is around 0.05 EUR/kWh, so the following values are considered: 0.00, 0.05 and 0.10 EUR/kWh.
Solar PV capacity: from 1 to 10 kWp with increases of 1 kWp, which are standard values for domestic facilities [
9].
Battery bank capacity: from 0 to 10 kWh of useful capacity with increases of 1 kWh, which are standard values for domestic facilities [
9]. Note that these values are useful capacity, taking into account real batteries would be larger, as generally there are depth of discharge limits defined by manufacturers.
Technology price. The normal costs for PV panels and batteries are 300 EUR/kWp and 1000 EUR/kWh (useful), respectively. These values were defined from commercial catalogues and, in order to include expected variations in the market, −20%, −10%, +10% and +20% over the original values are considered.
Finally, the following data related to the equipment and facilities to be installed are taken into account, which have been determined considering commercial values:
Project lifetime: 20 years.
Annual increase in the electricity price: 2%
Annual diminution in the technology price: 2%
Annual increase in the maintenance cost: 1%.
Annual interest rate: 5%.
Installation and launching cost of the system: EUR 1000.
Global efficiency of the system, including the shadow factor and real power: 80%.
Annual solar PV panels capacity degradation: 0.5%.
Annual maintenance cost of PV panels: 1% of the panel price.
Expected solar PV panels lifetime: 20 years.
Maximum battery charge factor: 50% of the battery bank capacity per hour.
Maximum battery discharge factor: 10% of the battery bank capacity per hour.
Annual battery bank capacity degradation: 0.5%.
Annual maintenance cost of the batteries: 2% of the battery bank price.
Expected battery bank lifetime: 8 years.
Inverter price: EUR 200 per PV kWp installed.
Expected inverter lifetime: 10 years.
With the above values, a computation experiment is carried out and results are analysed in next section. First, 75 instances are solved taking into account the five cities, the five load profiles and the three options in the compensation rate for excess PV electricity. For each instance, all the combinations of PV and battery sizes are tested, and the results are examined from the perspective of maximising profitability (
Section 4.1) and self-sufficiency (
Section 4.2). Then, a sensitivity analysis of the results is performed, considering the two options in the typology of the grid tariff, the five utility grid price values and the five technology price values (
Section 4.3).
4. Results Analysis and Discussion
In this section, the results of the computational experiment are examined under two assumptions: maximum profitability (
Section 4.1) and maximum self-sufficiency (
Section 4.2). The former aims to identify the best situation in economic terms, while the latter focusses on the higher degree of independence from the grid without economic losses. Finally, a sensitivity analysis of different input parameters is carried out in order to determine their influence on the system techno-economic performance (
Section 4.3). Through this whole analysis, most of the parameters of the model that are expected to have an influence on the results are examined.
4.1. Maximum Profitability Objective
Table 3 summarises the results when the maximum profitability assumption is considered. By columns, the panels size (PV), the net present value (NPV) and the self-sufficiency percentage (SELF) are shown for each city. By rows, results are classified according to the load profile considered and the compensation rate. It must be noted that for each solution, all the studied PV and battery sizes are tested and the one achieving the higher NPV is returned. Under this assumption, results do not include batteries in any case since these devices are still too expensive for residential facilities. Additionally, when no solution is shown it means that the highest NPV has a negative value, so it is economically better not to carry out the PV installation and remain connected to the grid.
As observed, when the compensation rate is 0.00 EUR/kWh, only load profile 3 reaches economic profitability, installing a 4 kW PV system at all the cities. Profile 3 is the largest one in terms of inhabitants and, in addition, a significant part of consumption is carried out at daytime hours as the two seniors spend long times at home daily. The higher the radiation, the higher the self-sufficiency. Therefore, in sunny cities (Barcelona, Madrid and Seville), percentages exceed 47%, especially in Seville; while in cloudy cities (Bilbao and Santiago), percentages remain below 40%.
When a 0.05 EUR/kWh compensation rate is considered, profitability is attained at almost all cases, except for profile 4 (lowest consumption) in Bilbao and Santiago (cloudiest cities). In the case of profile 3, a slightly higher PV system is installed (5 kW) than for the 0.00 EUR/kWh compensation rate (4 kW) in all cities, so logically the self-sufficiency increases. In contrast, the NPV for this profile almost doubles, since the compensation rate allows one to take advantage of any excess electricity from PV panels not consumed. On their behalf, the other profiles remain at between 1 and 3 kW of PV peak power, since the total demand and the daytime consumption are lower, and the NPV values are logically lower. In addition, note that the differences in the self-sufficiency between cities are significantly higher for profiles 3 and 5 than profiles 1 and 2. This is due to the larger daytime percentage the former profiles have, which causes a variation in solar radiation to have a more significant impact on the independence of the system. Finally, when the compensation rate is 0.10 EUR/kWh, solar PV facilities are economically viable for all the cases. As before, although small differences in the size of the system, and so the self-sufficiency, are observed, significant increases in the NPV are attained. In addition, differences in the economic performance and self-sufficiency between cities are larger the higher the daytime consumption percentage. Therefore, all these results prove that the load profile has a huge influence on the systems profitability and self-sufficiency reached.
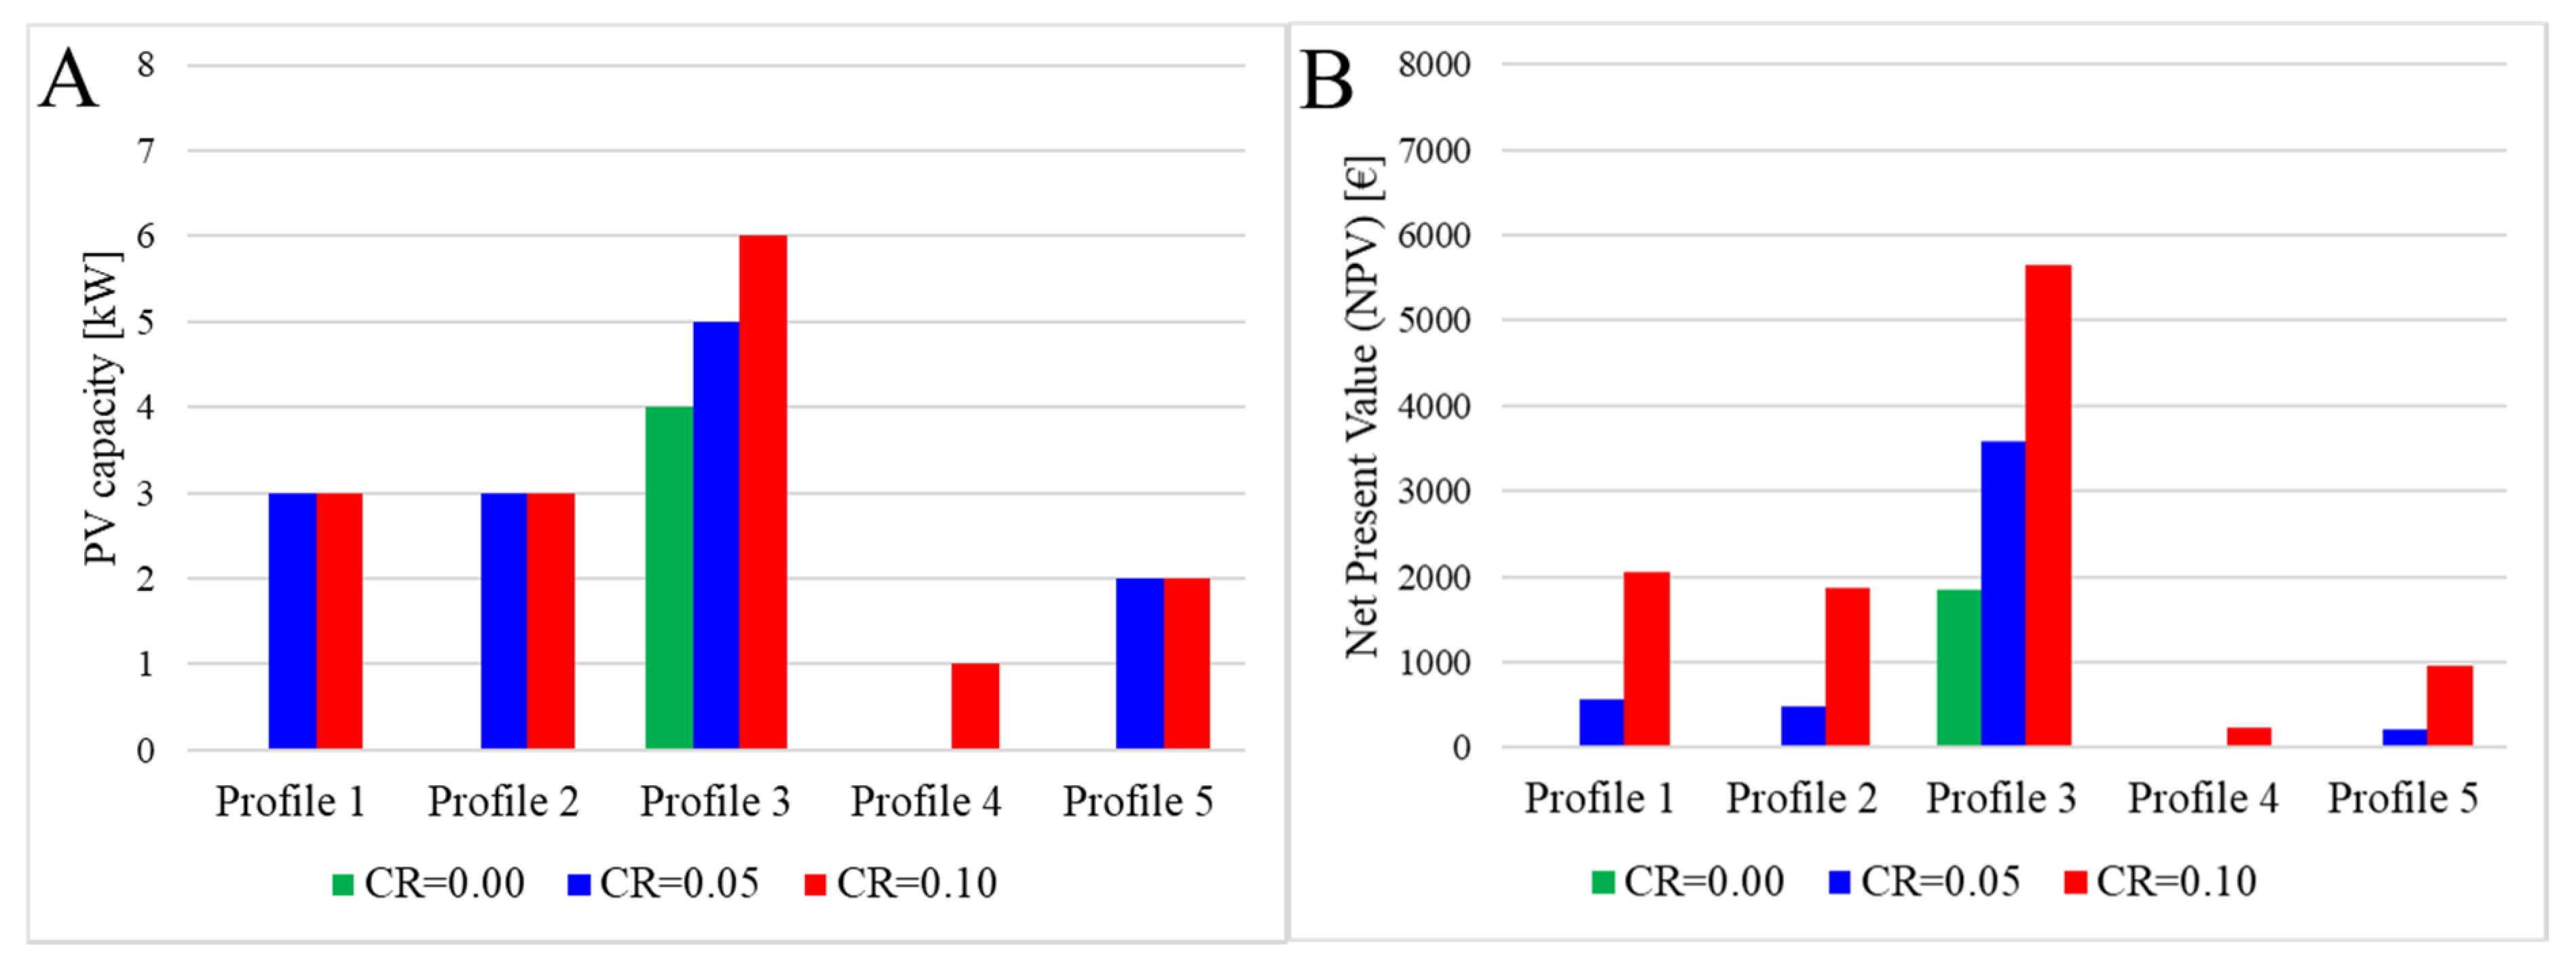
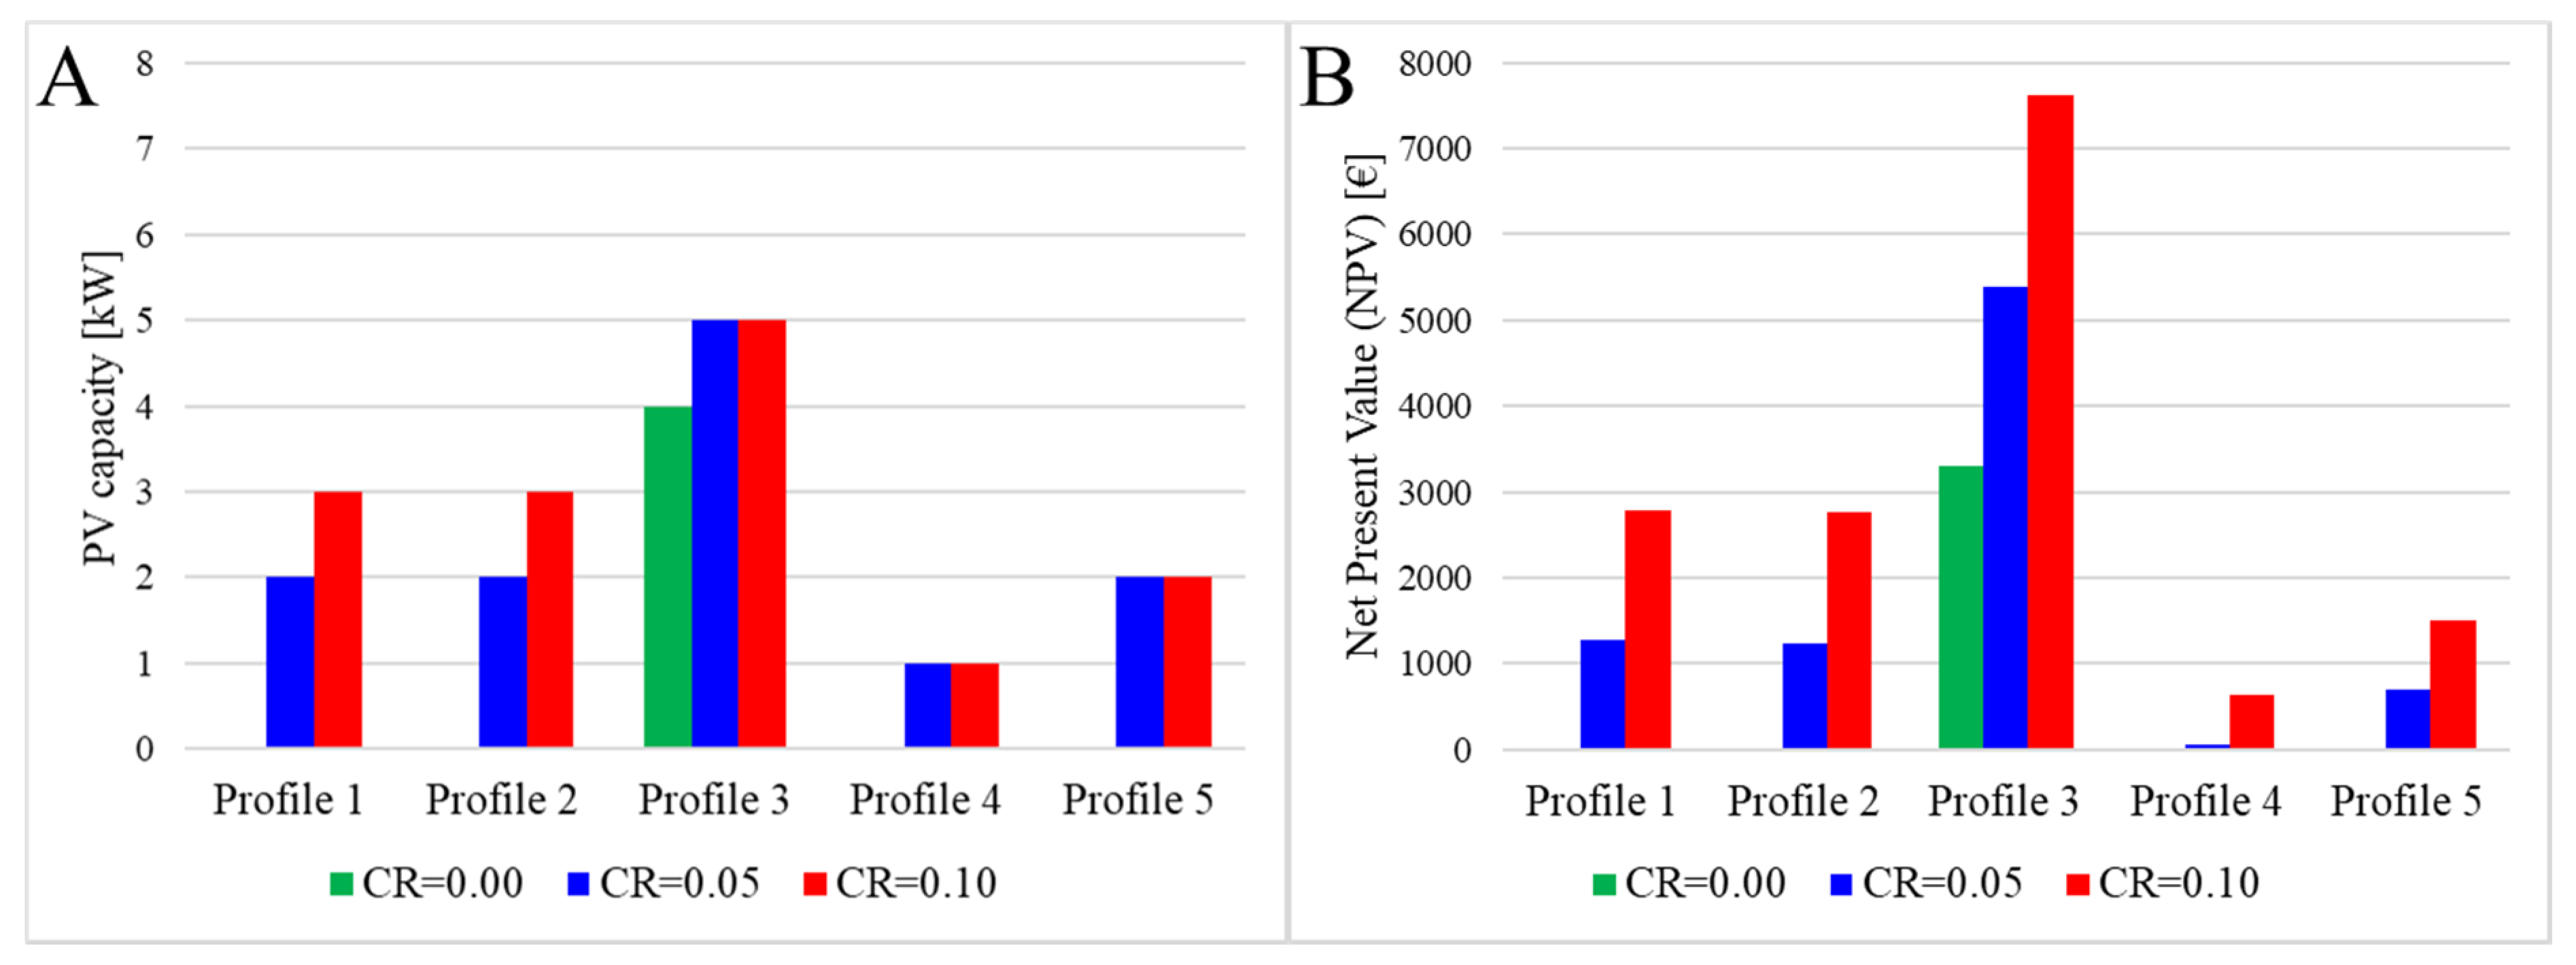
In order to better show the behaviour identified in
Table 3, the results corresponding to the cloudiest and sunniest cities, Bilbao and Seville, are graphically represented in
Figure 4 and
Figure 5, respectively. In particular, the size of the system (in columns) and the economic profitability (in lines) are shown for the five load profiles and three options of compensation rate. Note that the scale of both figures is the same to better reflect the differences between cities, which is particularly relevant for the NPV.
As observed, the compensation rate has a limited influence on the size of the PV installation, not varying or just adding 1 kW when the tariff increases by 0.05 EUR/kWh. In contrast, large differences in the NPV are achieved, especially the higher the consumption. Therefore, while differences in profile 4 are quite small, they are huger for profile 3. When comparing the two cities, which have meaningfully different solar radiations, it can be seen how very similar PV capacities are attained although the profitability significantly changes. In short, when private users aim to implement domestic PV facilities, they should not only be aware of the radiation at their emplacement, but also the typology of consumption.
4.2. Maximum Self-Sufficiency Objective
The maximum self-sufficiency shifts the concept from a maximum economic profitability into a maximum independence from the grid without economic losses. Under this assumption, PV systems should be infinitely large, in order to reach a 100% self-sufficiency or a very close value. However, this would be too expensive, so in this section the system that maximises the self-sufficiency among those reaching economic profitability (even if it is close to zero) is taken into account. In other words, this situation examines how independent a house can become from the grid while not losing money with regard to purchasing all the electricity from the grid.
Table 4 shows the results obtained for this computational experiment. The table is organised in a similar way to
Table 3, but instead of the NPV which is now meaningless and very close to zero, the battery size is shown. Although batteries are not economically profitable as determined in the previous section, in some cases the energy stored can raise the system self-sufficiency without attaining a negative NPV value. As before, the solutions not completed represent cases where a negative NPV is attained for all the tested combinations of PV and battery sizes, so there are always economic losses.
As observed, significantly higher installations are achieved. For instance, for profile 3 and a 0.00 EUR/kWh compensation rate, from 8 to 10 kW peak power is installed instead of the 4 kW that maximised the NPV, even including a 1 kWh battery capacity in some cases. In exchange, more than a 10% raise in the self-sufficiency is obtained. A similar behaviour occurs for the other load profiles and compensation rates. Concerning the batteries, a larger capacity is installed at the sunniest cities (Barcelona, Madrid and Seville). Indeed, an advantage from the additional radiation is that it can be used to store energy and consumed at nights, hence making the self-sufficiency increase. In contrast, in the cloudiest cities (Bilbao and Santiago), such an effect is more limited.
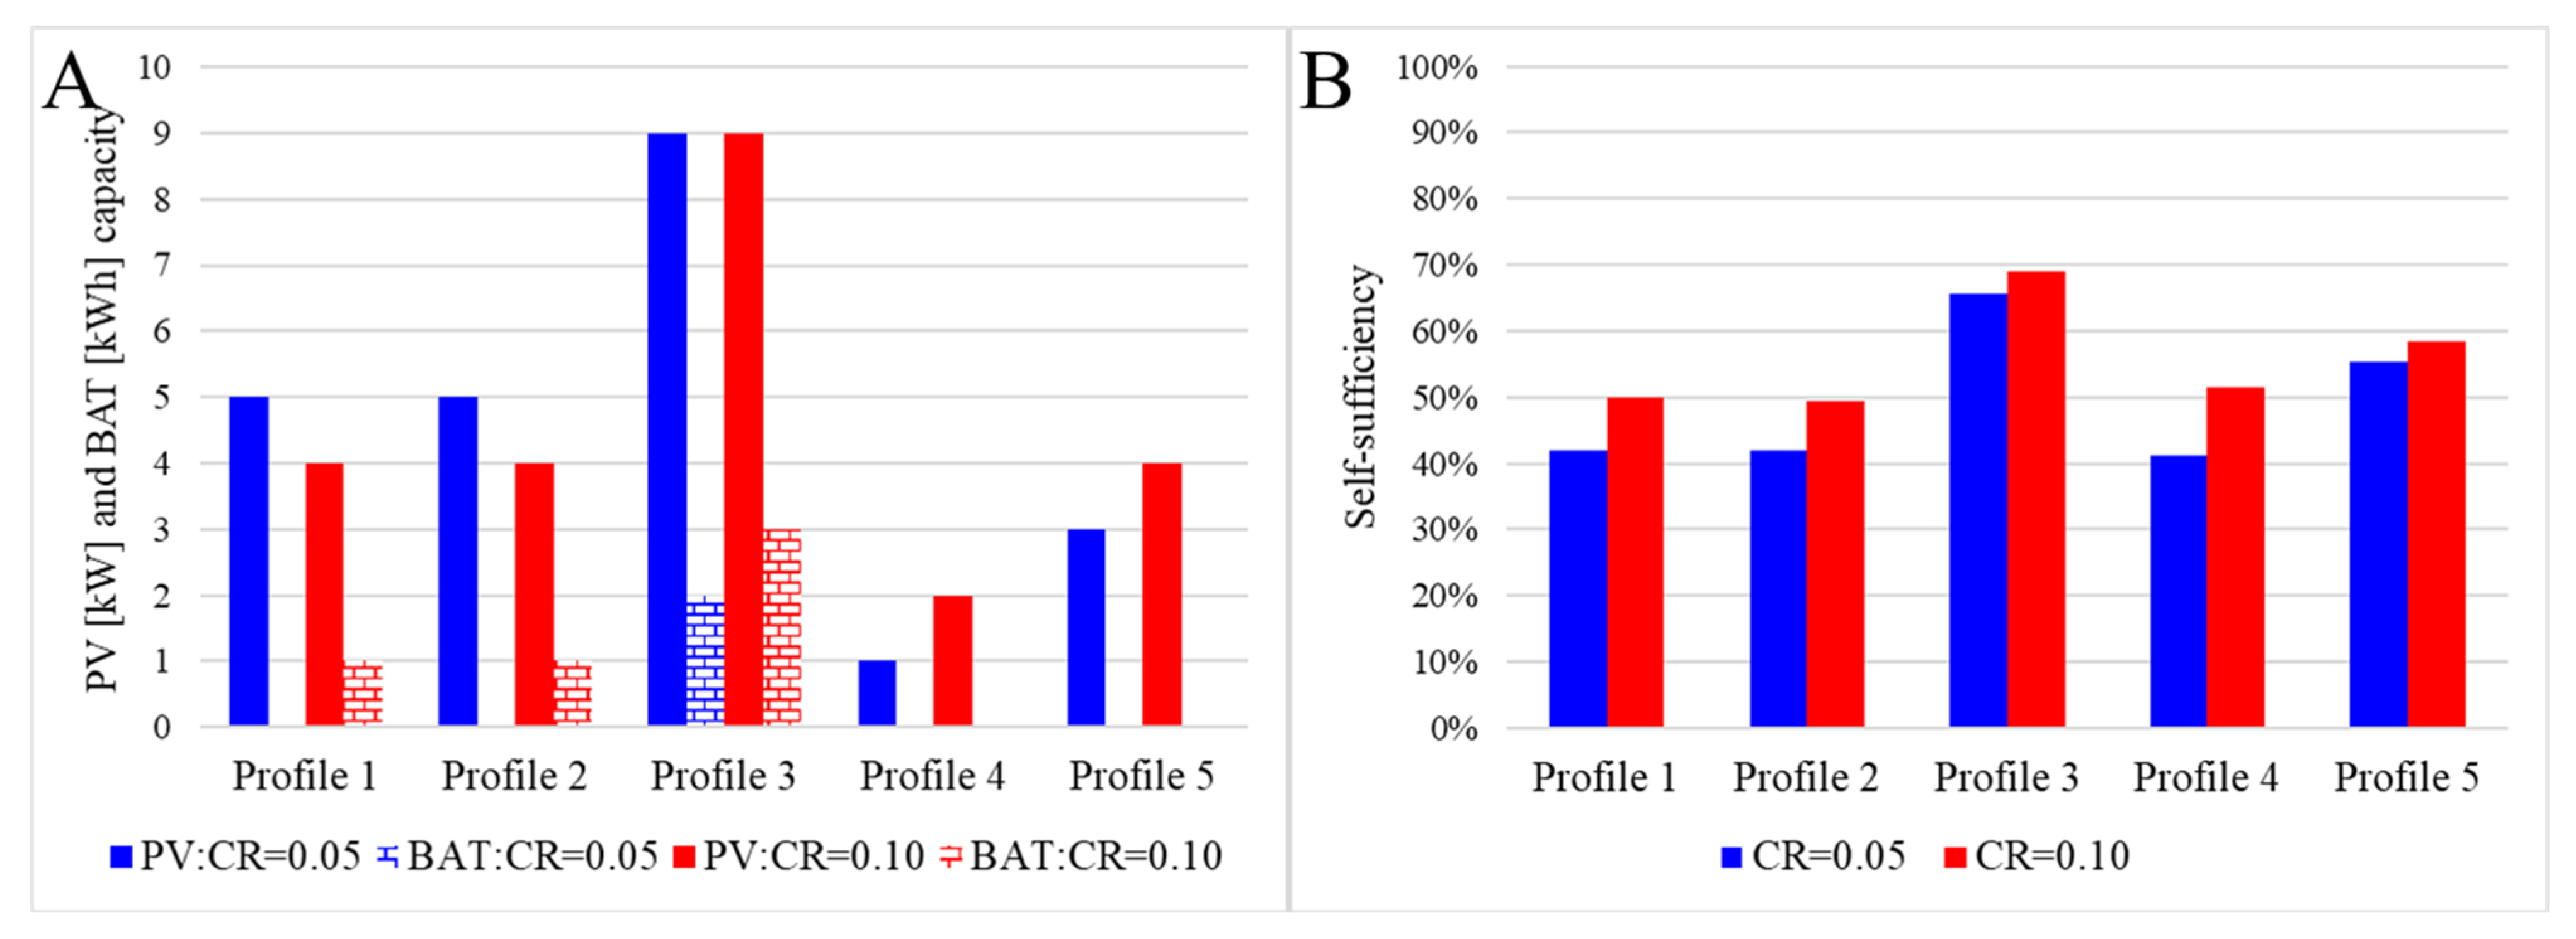
These results show how the behaviour of the influence of the load profile and the solar radiation is similar when the maximum profitability and the maximum self-sufficiency are sought. However, a relevant difference appears when examining the impact of the compensation rate. While for the maximum profitability, the tariff is recovered by the end-user in order to maximise the economic performance, now the tariff is devoted to buy additional generation and storage capacity in order to maximise the self-sufficiency. Consequently, the compensation rate has a higher influence under this assumption on the system to be implemented. In order to illustrate this conclusion,
Figure 6 shows the PV and battery capacity (in columns) as well as the self-sufficiency (in lines) for the compensation rates 0.05 and 0.10 EUR/kWh.
As it can be seen, in load profile 3, the higher compensation rate is used to increase the size of the battery, maintaining the PV capacity. Indeed, above a certain PV size, advantage from additional peak power cannot be used since part of the electricity is consumed at night, so more batteries are installed while the system remains economically viable. In profiles 1 and 2, a 1 kWh battery size is installed with a 0.10 EUR/kWh compensation rate, although slightly reducing the size of generators. In contrast, for the load profiles 4 and 5, the extra compensation rate is spent on more PV capacity. This is because these two profiles have a high daytime demand (above 66%) and a low consumption, so batteries are particularly expensive with regard to the use that can be made of them.
4.3. Sensitivity Analysis
In order to complement the study, a sensitivity analysis is carried out. As explained in
Section 3, the computational experiment is performed using different values regarding the utility grid and the technology price. Concerning the utility grid, two options are considered in terms of the typology: a constant value is paid at any moment of the day and a different value is paid at daytime (more expensive) and nights (cheaper). In addition, the price of grid electricity is also examined from −20% to +20% with regard to the original value; so, the two extreme cases are studied here. Finally, the technology price is also analysed; particularly the −20% and +20% scenarios. It must be highlighted that the above parameters are on the basis of other input data of the model (
Section 3), so their variation is indirectly examined. For instance, the technology cost allows one to analyse variations in the costs of all the equipment (PV panels, batteries and inverters), either in terms of investment/renewal and maintenance.
Table 5 shows the results for the five load profiles and the 0.05 and 0.10 EUR/kWh compensation rates. Each value is calculated as the average for all the cities, and both the PV size and the net present value (NPV) are detailed. Note that the results are determined for the maximum profitability.
Regarding the utility grid tariff typology (constant vs. day–night), the impact on the system size is very limited, as no variations are observed except for profile 4, which is not feasible in one case. In contrast, the impact on the economic profitability is significant. When the same tariff is paid at any moment, higher NPV values are achieved, whatever the compensation rate. According to Spanish law, the peak period ranges from 12 a.m. to 22 p.m., when most of the consumption is concentrated. Hence, at night, when higher savings can be obtained in a day–night scheme, a small part of electricity is consumed, not taking advantage of such option. Moreover, as at most of this period there is no solar radiation, electricity must be consumed through batteries, thus increasing the costs. Note that the load profiles have been obtained from the Load Profile Generator software, without looking at when it is preferable to consume, which is precisely the purpose for which the day–night tariff was conceived.
About the tariff variations, the higher the grid price, the higher the NPV, since a larger saving is obtained thanks to PV electricity. The influence on the size of the installation, in contrast, remains limited. Finally, when the cost of technology (PV panels and batteries) diminishes, logically, these systems become economically more efficient and the NPV attained is higher. However, again, differences in the size of the system remain rather irrelevant. In short, the sensitivity analysis allows one to conclude that variations in the utility grid tariff and the technology have an influence on the economic performance of the systems but not on the size of the systems to be implemented.
5. Conclusions
In this paper, a simulation model has been proposed to assess the techno-economic performance of residential PV–battery systems under the Spanish regulation (low compensation rate). As input data, the model takes into account hourly details of the solar radiation at the emplacement studied, the load profile and the utility grid tariff as well as techno-economic data of the equipment. Internally, the model analyses many PV and battery size combinations, according to the control strategy. As output, the economic profitability (expressed as the net present value) and the technical performance (through the self-sufficiency rate) are obtained. A computational experiment is carried out to analyse five Spanish cities with different climate conditions and five representative load profiles. In addition, a sensibility analysis of some of the input parameters, such as the compensation rate, the utility grid typology and price and the technology costs is performed. The results are examined from two different objectives: the maximum profitability, which is the most common objective for most people; and the maximum self-sufficiency, which represents users aiming to achieve independence from the grid at no extra cost.
When the maximum profitability is sought, results show that the cost-effectiveness and configuration of PV self-consumption under the current Spanish regulation widely depend on the load profile and, in a lesser amount, the city location and the compensation rate. In this case, load profile variations entail significant changes in the PV size up to 5 kWp for the same location, while the NPV exceeds a 10-time difference in some cases and more than 10% divergences are observed for the self-sufficiency. In contrast, variations in the city location (solar radiation) and the compensation rate have a more limited influence: no or 1–2 kWp differences are observed in the PV size, the NPV doubles on average between cases and the self-sufficiency varies around 5%. On the other hand, when the maximum self-sufficiency is sought, any economic benefit is used to increase the system size and achieve a higher independence from the grid. Hence, while the NPV drops close to EUR 0, the PV size almost doubles with regard to the profit maximisation and the usage of small batteries up to 3 kWh appears. In exchange, an average relative increase of 25% in the self-sufficiency is obtained, achieving absolute values above 70%, which is still far from total independence from the grid but is significant assuming no extra costs are allowed. Finally, the sensitivity analysis carried out to examine the tariff typology, the grid price and the technology cost shows that the impact of these factors on the PV size is very limited, observing no changes or only 1 kWp differences. In contrast, their impact on the economic performance is relevant: for the tariff typology and the technology cost, from EUR 200 to 700 differences; and for the grid price, from EUR 800 to 3000.
Both the results and the simulation model can assist project developers and residential users in making more informed decisions when implementing domestic PV–battery systems. The recent change in Spanish law has definitely helped to promote such facilities, as it can be deduced from the current growth of this sector. Indeed, this work shows how domestic PV–battery facilities are currently a viable option in Spain, either if the objective is to save costs or if it is to become independent from the grid. However, investments must be carried out cautiously, as the techno-economic performance does not only depend on solar radiation, but also the load profile, the cost of technology and the utility grid tariff, among others.
The current compensation rate is enough to make the PV technology profitable for the residential sector in almost all the territory and higher values would not necessarily represent a significant increase in the independence from the grid. In addition, the NPV values obtained for most profiles are not excessively high, assuming a 20-year horizon is considered. Consequently, the massive deployment of such facilities is not expected in the short term, which could cause a collapse of the whole system. In the long term, the same tariff can be maintained, or even reduced, and PV–battery systems will still remain profitable, especially if technology costs continue to drop. In this manner, energy transition towards a more sustainable Spanish energy matrix can be promoted without a significant impact on the country’s economy.
The limitations and uncertainties of this study are: (1) although representative, only five cities are considered; (2) the load profiles are obtained from a simulation generator; and (3) the analysis is performed for the profit and self-sufficiency maximisation assumptions. Therefore, as future research, additional cities could be considered, profiles gathered from real households could be examined and novel strategies regarding the sizing of equipment could be studied. Besides, the impact of variations in parameters such as the lifetime of equipment could be also included. These analyses would allow to complement this work and to improve the robustness of results.


