Article

Research on the Time-Domain Dielectric Response of Multiple Impulse Voltage Aging Oil-Film Dielectrics †

1
State Grid Sichuan Electric Power Research Institute, Chengdu 610041, China
2
State Key Laboratory of Power Transmission Equipment & System Security and New Technology, Chongqing University, Chongqing 400044, China
3
State Grid Sichuan Electric Power Company, Chengdu 610041, China
*
Author to whom correspondence should be addressed.
This paper is an extended version of our paper published in International Conference on High Voltage Engineering and Application 2020, Beijing, China, 6–10 September 2020.
Energies 2021, 14(7), 1948; https://doi.org/10.3390/en14071948
Submission received: 6 March 2021 / Revised: 28 March 2021 / Accepted: 30 March 2021 / Published: 1 April 2021

Abstract

:
Power capacitors suffer multiple impulse voltages during their lifetime. With the multiple impulse voltage aging, the internal insulation, oil-film dielectric may deteriorate and even fail in the early stage, which is called accumulative effect. Hence, the time-domain dielectric response of oil-film dielectric with multiple impulse voltage aging is studied in this paper. At first, the procedure of the preparation of the tested samples were introduced. Secondly, an aging platform, impulse voltage generator was built to test the accumulative effect of capacitor under multiple impulse voltage. Then, a device was used to test the time-domain dielectric response (polarization depolarization current, PDC) of oil-film dielectric in different aging states. And finally, according to the PDC data, extended Debye model and characteristic parameters were obtained by matrix pencil algorithm identification. The results indicated that with the increase of impulse voltage times, the time-domain dielectric response of oil-film dielectric changed accordingly. The polarization current curve moved up gradually, the insulation resistance decreased when subjected to the repeated impulses. In frequency domain, the frequency spectrum of tan δ changed along with the impulse accumulation aging, especially at low frequency. At last, combined with the aging mechanism of oil-film dielectric under multiple impulse voltage, the test results were discussed.

1. Introduction

With the leap in power infrastructure and the increase of social power consumption, the long-distance, large capacity and low loss UHV transmission project has gradually become an important part of the transmission network [1,2,3,4]. As the key equipment of reactive power compensation and filtering, power capacitor is widely used in power system. However, during their decades long operation cycles, frequent switching will expose capacitors to high operating overvoltages and impulse voltages. The cumulative effects of these impulse voltages will lead to deterioration and insulation failure of the oil-film dielectric of the capacitor, which seriously threatens the stable operation of the power system. Therefore, it is of great practical significance to study the failure laws of oil-film dielectrics and to be able to judge the degree of aging of capacitors under multiple impulse voltage exposure.
In 1956, Standring firstly proposed the phenomenon whereby the insulation state of a dielectric will degenerate under the action of impulse voltages, which he named “accumulative effect” [5]. However, his study concept was limited to solid and liquid dielectrics in combination. Since then, more and more researchers have devoted their efforts to investigating this phenomenon in composite dielectrics, such as oil-impregnated paper insulation and oil-film insulation. In order to reflect the cumulative effect of repeated impulses accurately, the most effective method is the U-N characteristic one. In [6], the cumulative effect of oil-film dielectrics was studied and their U-N characteristic was plotted as in Figure 1. The U-N curve shows that the repeated effect of impulse voltages made the breakdown voltage of the oil-film dielectric decrease. Figure 1 is divided into two parts, Area Ι and Area II. When the oil-film dielectric is subjected to less impulse voltages, its breakdown voltage decreases swiftly, which is represented by Area Ι. On the contrary, in Area II, with the accumulation of multiple instances of impulse voltage, the breakdown voltage of oil-film dielectrics drops slowly. Atomic force microscopy (AFM) was used in [7] to observe the surface morphology of oil-impregnated paper insulation. With the continual accumulation of impulse voltages, the roughness of the surface morphology increased. Moreover, more and more wart-like protuberances appeared and the height difference between different points became very obvious.
With regard to the research of the accumulative effect on dielectric breakdown, this field had been dug into deeply, and many breakthrough results were summarized, but when the dielectric was not broken down, a simple and efficient method was needed to reflect the accumulative effect and comprehend the aging mechanism. The traditional methods to detect the insulation state of power equipment are mainly divided into electrical, chemical and physical characteristic parameter measurements, including dissolved gas analysis (DGA), average degree of polymerization (DP), partial discharge (PD), etc. [8,9,10]. However, sampling for these methods is more or less difficult, the parameters are hard to detect, and measurements are easily affected by external factors. In recent years, the polarization-depolarization current method based on the time-domain dielectric response has been paid much attention by many scholars [11,12,13]. Under the action of an external electric field, the dipoles in the dielectric will change direction under the action of the external force, which is called a polarization process, mainly including turning polarization, ion displacement polarization and interface polarization. When the external electric field is removed, the dipole will return to the discrete state due to its relaxation property, which requires a certain time and energy loss. The dielectric response refers to the lossy relaxation polarization response [14,15]. When the insulation performance of dielectric materials decreases, the relaxation polarization response will change significantly, the degree of change can be used as a standard to judge the degree of aging of dielectric materials. The PDC method has the advantages of being non-destructive, with fast test speed and so on. The degree of aging of oil-film dielectrics can be effectively evaluated by using the PDC curve to extract the corresponding index and fitting calculations [16].
Based on the phenomenon of dielectric polarization, the dielectric response function of the oil-film insulation system is quantified in the extended time domain, and an equivalent circuit model (such as the extended Debye model) can also be established. Therefore, through reasonable parameter identification of the equivalent circuit model, the oil-film dielectric in different aging states can be judged. Zhang et al. [17] use the characteristic quantity of the initial slope of the recovery voltage as the basis to judge the state of aging of transformer oil paper insulation, but that paper fixed the number of branches of the Debye equivalent circuit, which is not universal. Conclusions can be drawn from [18] that the resistance R and capacitor C corresponding to the maximum and minimum time constants in the equivalent Debye model of oil-paper insulation can be used as the aging characteristic quantities. However, in [19], the depolarization current is only fitted and calculated by three exponential polynomials. In fact, there should be more types of interface polarization. The least squares method that identifies the parameters in the equivalent circuit as discussed in [20] contains integral operations, which is not only complicated to calculate, but also requires a high sampling frequency and has a great impact on the precision of parameters. An artificial intelligence algorithm is adopted by the authors in [21] to apply the hybrid algorithm of information entropy and particle swarm optimization to the identification of equivalent parameters, but the solution process is complex and prone to local optimization.
In order to solve the deficiencies mentioned above, the matrix pencil algorithm is adopted in this work to accurately identify the parameters of the extended Debye model of an oil film medium. The algorithm firstly discretized the depolarization current, constructed the Hankel matrix from the discretized values and decomposed the singular values. The number of large singular values was used as the RC branch number of the Debye equivalent circuit of oil-film dielectric, and on this basis, the characteristic parameters of each branch and the maximum depolarization current amplitude were obtained. Finally, the feasibility of the method was verified by experiments and simulations.

2. Basic Principle and Selection of Characteristic Quantity

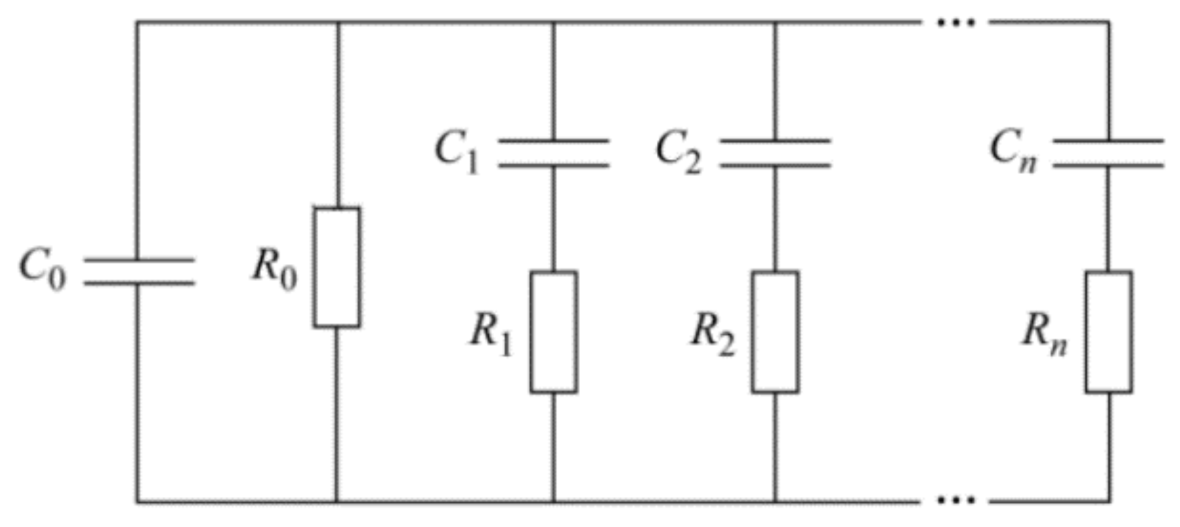
2.1. The Dielectric Response Theory

When a voltage is applied to a measured dielectric, the composite dielectric can be equivalent to the capacitance, which can be understood as the applied electric field E(t) acting on the sample capacitance. According to the full current equation, the current inside the dielectric material can be expressed as [22,23]:
i t = C 0 σ 0 ε 0 U t + ε d U t d t + d d t 0 t f t τ U τ d τ
where, C0 represent the equivalent capacitance of the sample. σ0 and ε0 represent the DC conductivity and the vacuum dielectric constant of the dielectric, respectively. ε is the relative permittivity. f(t) is an attenuation function, which is used to express the response ability of dielectric polarization process, and the attenuation depends on the dielectric material and external factors.
When the applied voltage is replaced by the DC voltage, the dielectric is in the polarization state, that is, a constant dc source U(t) is used to charge the sample capacitor. Since it is a DC voltage, there is no differential term in Equation (1), and the polarization current ip can be expressed as:
i p t = C 0 U t σ 0 ε 0 + f t
When the DC power supply is removed, the effect of the external electric field also disappears and it enters the depolarization process. The charged particle in the dielectric generates a depolarized current id contrary to the polarization current due to its relaxation property, then id can be expressed as:
i d t = C 0 U f t + t d f t
In Equation (3), td represents the polarization time. The PDC original curve is shown in Figure 2.
Therefore the insulation resistance R0, one of the important parameters characterizing the insulation of power capacitors, can be derived from Equations (2) and (3):
R 0 = i p t i d t U t
This parameter is sensitive to the state of the material, and is generally applicable to the aging detection of the insulation material. So it can be used as the basis to judge the aging degree of the oil-film dielectric.
The law of action of oil-film dielectric under an applied electric field can be equivalent with the extended Debye model [24], as shown in Figure 3. In the figure, the geometric capacitance of the dielectric is represented as C0. R0 is the insulation resistance of the composite medium. The equivalent resistance capacitance of each relaxation branch is replaced by Ri and Ci (i = 1, 2, …, N).
Thus, it can be deduced that the equivalent admittance of the model is:
1 Z = j ω C 0 + 1 R 0 + i = 1 n 1 R i + 1 / j ω C i ,
Therefore, the dielectric complex capacitance can be deduced as:
C * = 1 j ω Z = C 0 j 1 ω R 0 + i = 1 n C i 1 j ω R i C i 1 + ω R i C i 2 ,
The real and imaginary parts of the complex capacitor are:
C = Re C * = C 0 + i = 1 n C i 1 + ω R i C i 2 ,
C = Im C * = 1 ω R 0 + i = 1 n ω R i C i 2 1 + ω R i C i 2 ,
so the tangent value of the dielectric loss angle tan δ, another characteristic quantity to judge the aging degree of the dielectric in frequency domain, can be expressed as the ratio between the imaginary part and the real part of the complex capacitance [25]:
tan δ = C C = 1 R 0 + i = 1 n R i ω 2 C i 2 1 + ω R i C i 2 ω C 0 + i = 1 n ω C i 1 + ω R i C i 2 ,
That is to say, as long as the polarization-depolarization current curve is collected and the parameters of each branch in the extended Debye model are identified more accurately, the above two physical quantities in time domain and frequency domain can be calculated, so as to judge the aging degree of insulating medium in different aging states.

2.2. Matrix Pencil Algorithm

In the PDC curve of oil-film dielectric, the polarization current is composed of the conductance current and the depolarization current. The depolarization current contains more information to reflect the dielectric insulation state than the conductance current. In order to avoid the influence of conductance current, depolarization current is used as the research object of the algorithm. According to the extended Debye model, as shown in Figure 3, the depolarization current y(t) can be expressed as the discharge of n RC branches. That is, the linear superposition of n attenuation exponential functions:
y t = x t + n s t = i = 1 n U C R i 1 e t p τ e t R i C i + n s t = i = 1 n A i e t τ i + n s t
In the above equation, x(t) is the noiseless signal under ideal conditions. ns(t) is the interference signal caused by environmental noise. Uc is the magnitude of the dc voltage. Ai is the amplitude coefficient of depolarization current. τi is the decay time constant. By discretization of Equation (10), the following expressions can be obtained:
y k T s = x k T s + n k T s = i = 1 n A i e k T s τ i + n k T s
where Ts stands for the sampling time interval, k = 0, 1, 2, …, N − 1, N is the maximum sampling number. Therefore, Hankel matrix constructed by sampling sequence yk (k = 0, 1, 2, …, N − 1) can be expressed as:
Y = y 0 y 1 y L y 1 y 2 y L + 1 y N L 1 y N L y N 1 ,
L is the matrix pencil parameter, which is usually evaluated between N/4 and N/3. Singular value decomposition of Hankel matrix:
Y = S V D T ,
S is an orthogonal matrix of (NL) × (NL). V is a diagonal matrix of (NL) × (L + 1). Its diagonal element σi, the singular value of Hankel matrix Y, is arranged in descending order. D is an orthogonal matrix of (L + 1) × (L + 1).
Noise interference is unavoidable in actual measurements, but if the noise signal is weak compared with the dominant signal, a threshold value can be set to intercept the singular value appropriately, and the negative impact of noise on parameter identification accuracy can be reduced by retaining the previous M large data [26,27,28]. Therefore, M is usually used as the equivalent RC branch of the extended Debye model. When the number of singular values is M, the matrix V is intercepted and the former M column is reserved to form a new matrix V’. Take the former M major right singular vectors of the matrix D to form the matrix D’, remove the last row of D’ and call it D1, remove the first row of D’ and call it D2. Hence, two new matrices of (NL) × L can be obtained:
Y 1 = S V D 1 T ,
Y 2 = S V D 2 T ,
According to the calculation of Equations (14) and (15), it can be considered that Y1 and Y2 no longer contain noise signal. They just contain x(k) in the Equation (10):
Y 1 = x 1 x 2 x L x 2 x 3 x L + 1 x N L x N L + 1 x N 1 N L × L ,
Y 2 = x 2 x 3 x L + 1 x 3 x 4 x L + 2 x N L + 1 x N L + 2 x N N L × L ,
The matrix pencil Y2λY1 consists of Y1 and Y2, and its generalized eigenvalue G is:
G = Y 1 + Y 2 ,
Y 1 + is the pseudo-inverse matrix of Y1. The M eigenvalues of G can be denoted as λ1(I = 1, 2, …, M). When M and λi are known, the complex amplitude of the signal Pi can be obtained by the least squares method:
y 1 y 2 y N = 1 1 1 λ 1 λ 2 λ M λ 1 N 1 λ 2 N 1 λ M N 1 P 1 P 2 P M ,
After the Pi are calculated, the depolarization current amplitude Ai and time constant τi in the extended Debye model can be obtained:
A i = P i ,
τ i = T S Re ln λ i ,
where, TS is the sampling interval.
After obtaining the above parameters in the extended Debye model, the tangent value of the dielectric loss angle can be calculated.

3. The Experimental Setup

3.1. The Oil-Film Dielectric Samples

Unlike the insulation system in a transformer whose pressboard can absorb the insulating oil easily, in order to simulate the internal insulation structure of a capacitor and ensure full contact between the insulating oil and polypropylene film, the oil-film dielectric is made by using the test oilcan as shown in Figure 4. The film can be compressed tightly by the column-column electrodes, which help the insulating oil soak it better. The electrodes and oil-film dielectric are sealed in this container.
The oil used in this experiment is C101 manufactured and provided by Mianzhu Xinan Electrotechnical Equipment Co., Ltd. (Mianzhu, China). Its main component is benzyltoluene. The thickness of the polypropylene film is just 12 µm. The film need to be cut into squares with a side length of 60 mm. Considering that the single-layer polypropylene film may be broken down when the impulse voltage was applied a four-layer film was used and immersed in benzyltoluene. Some oil-film dielectric sample pretreatment steps were carried out before subjecting it to an impulse voltage:
(1)
Putting the samples into the vacuum drying oven and setting the temperature to 50 °C, which aimed at removing the moisture from the oil and eliminating the bubles in the oil-film interface;
(2)
The samples were dried for 48 h with an air pressure of 100 Pa;
(3)
Taking out the samples and sealing them with plastic wrap. It can prevent the moisture and impurities in the air;
(4)
All the pretreated samples should be sealed in a dry, isolated and well-ventilated area. Lastly, waiting the temperature of the samples dropped to room temperature.

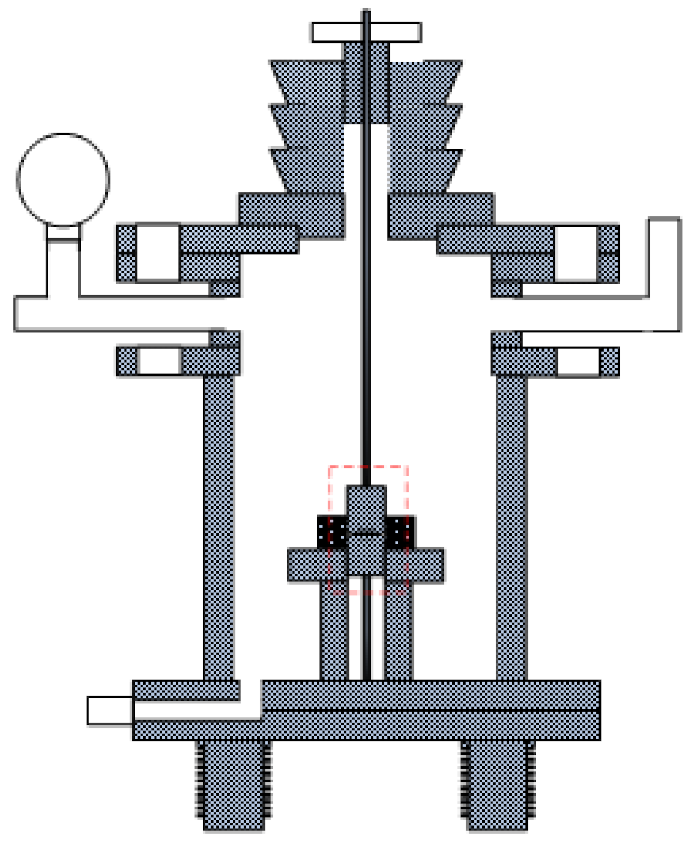
3.2. The Aging Platform

A continuous impulse voltage generator, as shown in Figure 5, was used as an aging platform to apply impulse voltages of different durations to the oil-film dielectric, which aimed to simulate the aging conditions of insulation in the capacitor. In the Figure 5, the schematic diagram of impulse voltage generator, it can be observed that this aging platform is composed of a test transformer T, main capacitor C, high voltage silicon reactor D, spherical gap g, wave head resistance Rf and wave tail resistance Rt. The impulse generator was a traditional Marx type impulse generator, manufactured by HUAGAO Electric Co., Ltd. (Hongan, Hubei, China) This impulses accumulation test platform can generate standard negative switching impulse (250/2500 µs), which rated parameter is 30 kJ/300 kV. The distance between the gaps is changed by the control system of the computer terminal, which ensures that the impulse voltage generator can be fully triggered. The breakdown voltage of the samples was 20 kV. In order to continuously apply impulse voltage and prevent accidental breakdown of oil-film dielectric during the experiment, the amplitude of impulse voltage was set to 17 kV and an impulse was applied every 60 s.

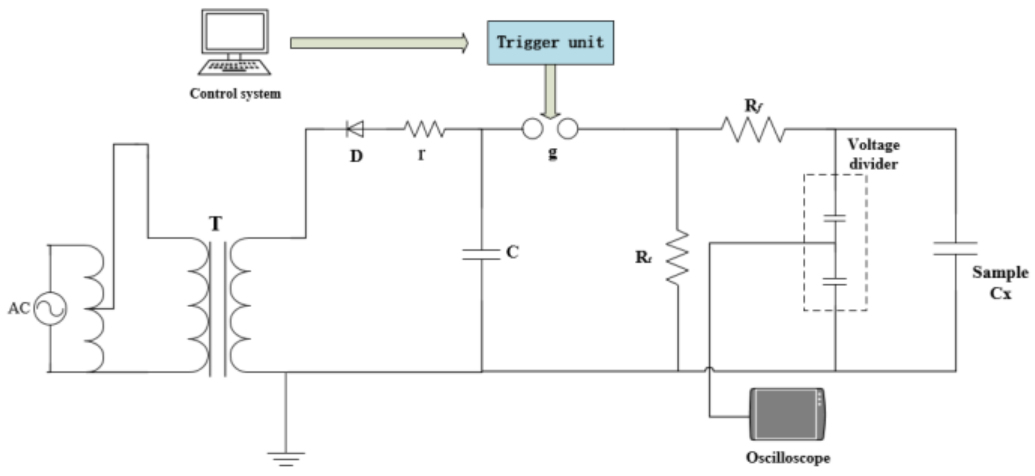
3.3. The PDC Test Platform

The PDC curve of oil-film dielectric was measured and sampled by the measuring instrument as shown in Figure 6. This instrument was designed and manufactured to conduct the PDC measurements. It consisted of a high voltage DC source, a picoammeter and a high voltage double throw switch. The corresponding schematic diagram is shown in the Figure 7. The instrument includes a PDC high-voltage detection device, with a high-voltage output range of 0~10 kV and a current range of 0~3 mA, which needs to be supplied by a power supply of 220 V. In order to make the polarization of oil-film dielectric more sufficient and prevent interference from other factors, the polarization voltage and polarization time were set to 1500 V and 1800 s, respectively.
When the measurement started, according to Figure 7, the vacuum high voltage relay was set to S1, the sample Cx was charged by DC voltage, the dielectric began to polarize. After 1800 s, the switch turned to S2 and the Cx was discharged through insulation resistance, which meant the beginning of depolarization. The sampling procedure applicable to the instrument is installed in the supporting upper computer. When the measurement is finished, a text document is generated to record the sampling data. Finally, the original polarization-depolarization current curve can be plotted as shown in Figure 2. In that figure, the curve is not level and smooth, so the matrix pencil algorithm was needed to process the curves.

4. The Experiment Results

During this experiment, 100, 200, 300 and 400 impulse voltages were applied to the samples in turn. Although all polarization types are included in the whole process, such as electronic polarization, ionic polarization, dipole polarization and interface polarization, however, the time required for the first two polarization types is short extremely, about 10−15 s~10−13 s. However the dipole and interface polarization need to take a few seconds or even an hour. As the PDC measurement takes a long time (several hundred seconds) and the measurement started 1 or more seconds after the switch action, so the electronic polarization and ionic polarization can’t be recorded, and the polarization-depolarization current of oil-film dielectric is mainly caused by dipole and interface polarization.
Every time a new substance is generated, it will correspond to a new interface polarization. Due to the different dielectric properties of each material, the corresponding time constant of interface polarization is not the same, which requires different equivalent RC branches to represent it. Based on this conclusion, the matrix pencil algorithm was used to calculate the number of larger singular values of the matrix constructed by the depolarization current of the samples under different impact times, that is, the RC branch number reflecting the equivalent model of oil-film dielectric, as shown in Figure 8. Figure 8 is the calculation result of matrix pencil algorithm for one sample, which is not damaged. It has three larger singular values in the figure, so we set its number of RC branches to 3. This is different from [17] in that the number of RC branches is calculated by the matrix pencil algorithm. According to [29], when the polarization process of a dielectric lasts a long time, such as in EPR insulated cable and capacitors, a relatively low number (3–4) of RC branches with acceptable error can model the dielectric response better. Then, according to the same method, the number of larger singular values under different aging degrees was counted, so all the curves can be denoised. The fitting situation of original curve and denoised curve is as shown in Figure 9. Table 1 lists the parameter Rnew between the denoised curves and the original curves. This parameter is used to judge the fitting degree of nonlinear regression equation and its unit is 1. It can be obtained that the feasibility of the algorithm was verified. Finally, the parameters of each branch in the Debye model can be simulated by the matrix pencil algorithm, and the characteristic parameters mentioned above will also be obtained.

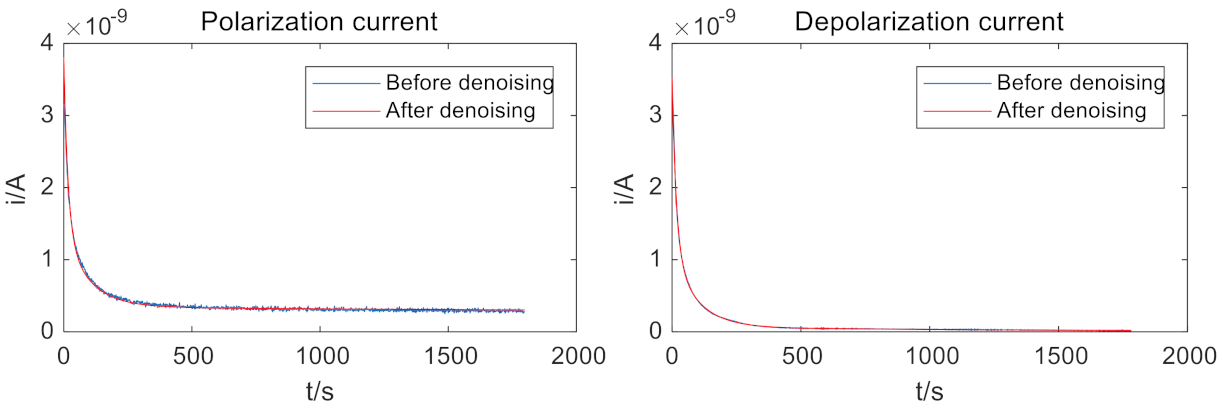
4.1. The Polarization Current of an Oil-Film Dielectric with Different Degree of Aging

The polarization current curves of an oil-film dielectric under different aging degree, denoised by the matrix pencil algorithm were drawn in the same coordinate axis, which is shown in Figure 10. From this coordinate axis, we can see that when the polarization process was begining, the polarization current of oil-film dielectric had a large initial amplitude, which can be explained by the Debye model. As time goes by, the polarization current decreases rapidly. When it falls to a certain level, it will maintain a stable value, which also means that the polarization process is coming to an end. When the oil-film sample is not damaged, its polarization curve is in a lower position. Under the continuous action of impulse voltages, the polarization curve gradually moves up. At the same time, the value of the initial amplitude also increases. Table 2 lists the value of initial amplitude of oil-film dielectrics under different aging states. Due to the polarization current consisted of depolarization current and conductance current, the steady-state value of depolarization current was almost zero. Thus, the conductance current varied with the number of impulse voltages applied, which reflectes the change of insulation resistance.

4.2. The Change of Insulation Resistance

According to Equation (4) and Figure 11, the value of the conductance current was equal to the steady-state value of the depolarization current, so the insulation resistance R0 can be calculated. The variation of insulation resistance R0 under different numbers of impulse voltages is shown in Figure 10. It can be seen from the figure that the insulation resistance of the oil-film dielectric generally shows a downward trend with different numbers of impulse voltages. When the oil-film dielectric isn’t subjected to impulse voltages, its insulation resistance was 3.37 × 10+12 Ω. With the accumulation of the number of impulse voltage instances, the damage of the oil-film sample was also increasing. Finally, the insulation resistance fell to 1.45 × 10+12 Ω when the number of impulse voltages reached 400. That’s down by 57.0%.

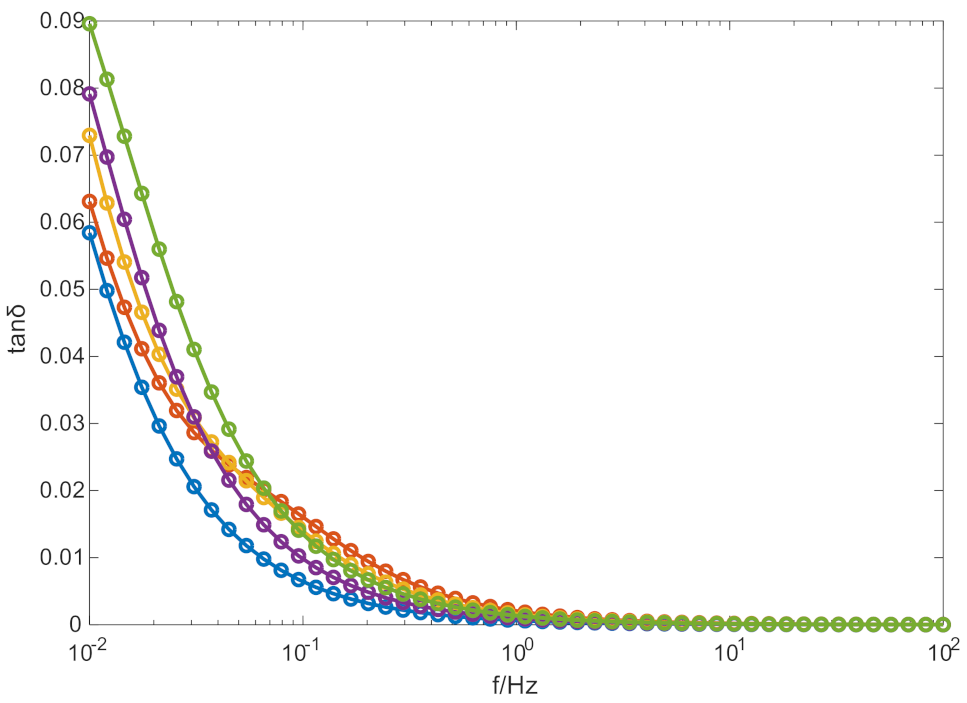
4.3. The Results of the Tangent Value of the Dielectric Loss Angle at Low Frequency

For the convenience of this study, the frequency band was set between 0.01 Hz and 100 Hz and we took 50 points where each point had an equal interval in this frequency band. Because the tangent value of the dielectric loss angle of oil-film dielectric with different degrees of aging changes more obviously at low frequency, the tangent value of the dielectric loss angle at low frequency is used as the basis for judging the state of aging.
According to Equation (9), the frequency spectrum curves of tan δ of oil-film dielectric with different aging degrees are shown in Figure 12. Obviously, the frequency spectrum of the oil-film dielectric also shows a downward trend. When the frequency was low, the tan δ of oil-film dielectric changed along with the impulse accumulation aging. With the increase of frequency, the frequency spectrum curves bent to coincide gradually. Lastly, they almost reduced to zero when the frequency reached 100 Hz. With the continuous accumulation of impulse voltage, the tangent value of dielectric loss angle increased at lower frequency. Table 3 shows the tanδ of oil-film dielectric with different degrees of aging at 0.01 Hz.

5. Discussion

We can acquire the change of polarization current curve and aging mechanism from an oil-film dielectric from the experimental results described in Section 3. Firstly, combined with the extend Debye model which consisted of RC branched in parallel, when an extra electric field was applied, the characteristics of RC branches made the initial value of current larger and then decrease rapidly. At the end of the polarization process, the capacitor of the branch Ci was charged, the polarization current finally decreased to a constant due to the existence of a resistance Ri.
From a macro point of view, the continuous effect of impulse voltages makes the oil-film dielectric age over time. The deepening of the degree of aging means that the damage to the oil-film dielectric increases, so the conductive ability of the composite medium composed of polypropylene film and insulating oil is enhanced, which makes the conductance current in the oil-film sample increase. That is, as the conductivity increases, the polarization current curve will move up and the insulation resistance of the entire composite medium will decrease.
From the micro point of view, with the increase of the number of impulse voltages, the polypropylene film and insulating oil changed to varying degrees. The molecular chains of the polypropylene film are broken by the action of impulse voltages, whereby more charged particles and small molecules are generated. The insulating oil will also decompose into water molecules, acids and other substances, so the number of conductive particles in the oil-film dielectric will grow in number. Therefore, under an exterior electric field, more charged particles will move directionally, which makes the initial value of polarization current increase and the polarization current curve move up. At the same time, the polar particles and ions in the new material can enhance the conductivity and polarizability of the oil-film dielectric, which leads to an increase of the conductivity and polarizability loss of the oil-film sample. The sum of the two just represents the tangent value of the dielectric loss angle, thus the tanδ value will increase at lower frequency.

6. Conclusions

Different numbers of impulse voltages were applied to an oil-film dielectric sample by simulating the oil-film insulation in the capacitor, and the polarization-depolarization current (PDC) method was used to test the PDC curves of samples with different degrees of aging. Finally, the matrix pencil algorithm was used to identify and fit the parameters of the measured curves, and the following conclusions were drawn: According to the matrix pencil algorithm, the number of larger singular value represents the RC branches in the Debye model, which will make the calculation results more reasonable. With the increase of the number of impulse voltages applied, the degree of aging of the oil-film dielectric is deepening. The conductivity of the oil-film dielectric is enhanced, so the initial value of polarization current will increase and the polarization current curve will move up. From a microscopic perspective, more moisture and small molecules are generated, and the conductivity of the complex medium is improved. Accordingly, the insulation resistance of oil-film dielectric will decrease. Similarly, the effect of multiple impulse voltages leads to the increase of the conductivity loss and polarizability loss, so the tangent value of dielectric loss angle will increase with the deepening of aging degree at low frequency.

Author Contributions

Investigation, C.Z., K.Z., Y.Z. and S.X.; Methodology, C.Z.; Supervision N.J.; project administration, C.H. All authors have read and agreed to the published version of the manuscript.

Funding

This work is supported by Sichuan Electric Power Company Research Project 521997190010.

Institutional Review Board Statement

Not applicable.

Informed Consent Statement

Not applicable.

Data Availability Statement

The study did not report any data.

Acknowledgments

Thank Zhou Mu, Yalong Xia and Donghui Luo for their advice and help in the process of paper compilation.

Conflicts of Interest

The authors declare no conflict of interest.

References

  1. Saha, T.; Purkait, P. Investigation of an expert system for the condition assessment of transformer insulation based on dielectric response measurements. IEEE Trans. Power Deliv. 2004, 19, 1127–1134. [Google Scholar] [CrossRef] [Green Version]
  2. Koch, M.; Prevost, T. Analysis of dielectric response measurements for condition assessment of oil-paper transformer insulation. IEEE Trans. Dielectr. Electr. Insul. 2012, 19, 1908–1915. [Google Scholar] [CrossRef]
  3. Wang, M.; Vandermaar, A.J.; Srivastava, K.D. Review of condition assessment of power transformers in service. IEEE Electr. Insul. Mag. 2002, 18, 12–15. [Google Scholar] [CrossRef]
  4. Fofana, I.; Hadjadj, Y. Electrical-based diagnostic techniques for assessing insulation condition in aged transformers. Energies 2016, 6, 697. [Google Scholar] [CrossRef]
  5. Standring, W.G.; Hughes, R.C. Breakdown under impulse voltages of solid and liquid dielectrics in combination. IEEE Proc. Power Eng. 1956, 103, 583–597. [Google Scholar] [CrossRef]
  6. Zhang, C.; Xie, S.; Zhang, Y. Repeated impulse aging of oil-polypropylene insulation. IEEE Trans. Dielectr. Electr. Insul. 2019, 26, 1581–1587. [Google Scholar] [CrossRef]
  7. Sima, W.; Sun, P.; Yang, Q.; Yuan, T.; Lu, C.; Yang, M. Study on the accumulative effect of repeated lightning impulses on insulation characteristics of transformer oil impregnated paper. IEEE Trans. Dielectr. Electr. Insul. 2014, 21, 1933–1941. [Google Scholar] [CrossRef]
  8. Linhjell, D.; Lundgaard, L.; Gafvert, U. Dielectric response of mineral oil impregnated cellulose and the impact of aging. IEEE Trans. Dielectr. Electr. Insul. 2007, 14, 156–169. [Google Scholar] [CrossRef]
  9. Zdanowski, M. Streaming Electrification of Mineral Insulating Oil and Synthetic Ester MIDEL 7131. IEEE Trans. Dielectr. Electr. Insul. 2014, 21, 1127–1132. [Google Scholar] [CrossRef]
  10. Saha, T.K. Review of Modern Diagnostic Techniques for Assessing Insulation Condition in aged transformers. IEEE Trans. Dielectr. Electr. Insul. 2003, 10, 903–917. [Google Scholar] [CrossRef] [Green Version]
  11. Saha, T.K.; Yao, Z.T. Experience with return voltage measurements for assessing insulation conditions in service-aged transformers. IEEE Trans. Power Deliv. 2003, 18, 128–135. [Google Scholar] [CrossRef] [Green Version]
  12. N’cho, J.S.; Fofana, I.; Hadjadj, Y.; Beroual, A. Review of physicochemical-based diagnostic techniques for assessing insulation condition in aged transformers. Energies 2016, 9, 367. [Google Scholar] [CrossRef]
  13. Liao, R.; Liang, S.; Sun, C.; Yang, L.; Sun, H. A comparative study of thermal aging of transformer insulation paper impregnated in natural ester and in mineral oil. Eur. Trans. Electr. Power 2010, 20, 518–533. [Google Scholar] [CrossRef]
  14. Hao, J.; Liao, R.; Chen, G.; Ma, Z.; Yang, L. Quantitative analysis ageing status of natural ester-paper insulation and mineral oil-paper insulation by polarization/depolarization current. IEEE Trans. Dielectr. Electr. Insul. 2012, 19, 188–199. [Google Scholar]
  15. Darveniza, M.; Saha, T.; Hill, D.; Le, T. Investigations into effective methods for assessing the condition of insulation in aged power transformers. IEEE Trans. Power Deliv. 1998, 13, 1214–1223. [Google Scholar] [CrossRef]
  16. Zhao, K.; Zhang, C.; Deng, Y.; Li, L.; Xie, S.; Zhang, Y. Research on Time-domain Dielectric Response of Multiple Impulse Voltage Aging Oil-film Dielectric. In Proceedings of the 2020 IEEE International Conference on High-Voltage Engineering (ICHVE 2020), Beijing, China, 6–10 September 2020. [Google Scholar]
  17. Zhang, T.; Cai, J. Research on parameters identification for dielectric response equivalent circuit of transformers with oil-paper insulation. Adv. Technol. Electr. Eng. Energy 2010, 29, 35–39. [Google Scholar]
  18. Tang, P.; Yin, Y.; Wu, J.; Yan, X. Study of oil-paper insulated transformers’aging state based on depolarization current measurements. Adv. Technol. Electr. Eng. Energy 2012, 31, 39–42. [Google Scholar]
  19. Xu, S.; Middleton, R.; Fetherston, F.; Pantalone, D. A comparison of return voltage measurement and frequency domain spectroscopy test on high voltage insulation. In Proceedings of the 2003 IEEE International Conference on Properties and Applications of Ei Electric, Materials, Nagoya, Japan, 1–5 June 2003; pp. 351–355. [Google Scholar]
  20. Chen, J.; Jiang, X.; Cai, J.; Li, A. Application Circuit Analysis Method to Assess the State of Transformers Oil-paper Insulation. Proc. CSU-EPSA 2016, 28, 30–35. [Google Scholar]
  21. Yang, F.; Du, L.; Yang, L.; Wei, C.; Wang, Y.; Ran, L.; He, P. A Parameterization Approach for the Dielectric Response Model of Oil Paper Insulation Using FDS Measurements. Energies 2018, 11, 622. [Google Scholar] [CrossRef] [Green Version]
  22. Andrzej, K. Dielectric Relaxation in Solids: Chelsea Dielectric Press. J. Phys. Appl. Phys. 1983. [Google Scholar] [CrossRef]
  23. Walter, S. Dielectric spectroscopy in time and frequency domain for HV power equipment. I. Theoretical considerations. IEEE Electr. Insul. Mag. 2003, 19, 5–19. [Google Scholar]
  24. Subocz, J.; Mrozik, A.; Bohatyrewicz, P.; Zenker, M. Condition Assessment of HV Bushings with Solid Insulation based on the SVM and the FDS Methods. Energies 2020, 13, 853. [Google Scholar] [CrossRef] [Green Version]
  25. Hua, Y.; Sarkar, T. On SVD for estimating generalized eigen values of singular matrix pencil in noise. IEEE Trans. Signal Process. 1991, 39, 892–900. [Google Scholar] [CrossRef] [Green Version]
  26. Peter, B.; Vasile, S.; Matthias, V. L-Norm Computation for Continuous-Time Descriptor Systems Using Structured Matrix Pencils. IEEE Trans. Automat. Contr. 2012, 57, 233–238. [Google Scholar]
  27. Liu, Y.; Liu, H.; Nie, Z. Reducing the Number of Elements in the Synthesis of Shaped-Beam Patterns by the Forward-Backward Matrix Pencil Method. IEEE Trans. Antennas Propag. 2010, 58, 604–608. [Google Scholar]
  28. Yilmazer, N.; Koh, J.; Sarkar, T. Utilization of a unitary transform for efficient computation in the matrix pencil method to find the direction of arrival. IEEE Trans. Antennas Propag. 2006, 54, 175–181. [Google Scholar] [CrossRef]
  29. Tan, S.; Zhang, C. Aging Detection of Oil Film Insulation for Surge Capacitor Based on Polarization-depolarization Current Method. Sichuan Electr. Power Technol. 2019, 24, 42. [Google Scholar]
Figure 1. The U-N characteristics of an oil-film dielectric [6].
Energies 14 01948 g001
Figure 2. The PDC curve.
Energies 14 01948 g002
Figure 3. Extended Debye model.
Energies 14 01948 g003
Figure 4. The oil-film dielectric sample.
Energies 14 01948 g004
Figure 5. Experimental schematic diagram of impulse voltage generator.
Energies 14 01948 g005
Figure 6. PDC measuring instrument.
Energies 14 01948 g006
Figure 7. The schematic diagram of PDC measuring instrument.
Energies 14 01948 g007
Figure 8. The results of the number of singular values when oil−film dielectric is not damaged.
Energies 14 01948 g008
Figure 9. The fitting situation of original curve and denoised curve.
Energies 14 01948 g009
Figure 10. The polarization current curves of oil-film dielectrics under different degrees of aging.
Energies 14 01948 g010
Figure 11. Variation trend of insulation resistance of oil-film dielectric with different numbers of impulse voltages.
Energies 14 01948 g011
Figure 12. The frequency spectrum curves of tanδ of oil-film dielectric with different aging degrees.
Energies 14 01948 g012
Table 1. Calculation results of Rnew of an oil-film dielectric under different aging states.
Times of Impulse Voltage/Times0100200300400
Rnew/10.974910.954910.958280.980860.96411
Table 2. The value of initial amplitude of oil-film dielectrics under different aging states.
Number of Impulse Voltages0100200300400
The Value of Initial Amplitude/A1.986 × 10−92.151 × 10−92.536 × 10−93.147 × 10−93.493 × 10−9
Table 3. The tan δ of oil-film dielectric under different numbers of impulse voltages at 0.01 Hz.
Number of Impulse Voltages0100200300400
tan δ at 0.01 Hz0.05830.06310.07290.07870.0896
Publisher’s Note: MDPI stays neutral with regard to jurisdictional claims in published maps and institutional affiliations.

