Article

Research on the Non-Contact Pollution Monitoring Method of Composite Insulator Based on Space Electric Field †

1
School of Electrical Engineering, Nanjing Institute of Technology, Nanjing 210000, China
2
State Key Laboratory of Power Transmission Equipment & System Security and New Technology, Chongqing University, Chongqing 400000, China
3
State Grid Zhejiang Ninghai County Power Supply Company, Ningbo 315000, China
*
Author to whom correspondence should be addressed.
This paper is an extended version of our paper published in 2020 IEEE International Conference on High Voltage Engineering and Application (ICHVE), Beijing, China, 6–10 September 2020.
Energies 2021, 14(8), 2116; https://doi.org/10.3390/en14082116
Submission received: 10 March 2021 / Revised: 6 April 2021 / Accepted: 8 April 2021 / Published: 10 April 2021

Abstract

:
Through spatial electric field monitoring, it is expected to realize insulator pollution condition monitoring and contamination flashover warning in a non-contact way. Therefore, in this paper, the spatial electric field distribution characteristics of 110 kV composite insulators are simulated, where the effects of different surface states and their discharge levels on the spatial electric field of insulators are analyzed. On this basis, a non-contact monitoring method for composite insulator pollution based on the spatial electric field is proposed. The results show that there are significant differences in the spatial electric field of the composite insulator among three conditions, namely cleaning, pollution layer wetting, and dry band arcing. Increases of pollution layer wetting and dry band arcing would lead to an increase of the amplitude of the spatial electric field of the insulator. Verification experiments well indicated that it is feasible to identify the degree of pollution layer wetting as well as dry band arcing of the insulator string by fixed-point monitoring, the spatial electric field signal at the cross-strand of d = 0.5 m and directly opposite the last three positions. Research results can provide references for the online monitoring of overhead line polluted insulators and its flashover warning.

1. Introduction

Compared with the traditional string of porcelain and glass insulators, composite insulators, with excellent electrical and mechanical properties, are widely accepted in high-voltage power transmission systems. However, aging and deterioration of composite insulators are particularly serious in some typical heavily soiled, coastal, high-temperature, and high-humidity areas, so that their water-repellent performance and anti-fouling flash performance are significantly weakened, which has led to several pollution flashover accidents [1,2,3,4]. In 2016, the insulators of the ±600kV DC transmission line in Dezhou, Shandong were discharged due to heavy pollution in the shed. In 2018, the post-insulators of the Henan substation were polluted by heavy industrial dust, resulting in multiple pollution flashovers throughout the year.
Therefore, effective and stable online monitoring and early warning of pollution flashover for the pollution of external insulation in harsh environments still have practical engineering significance. Some scholars have conducted a large number of studies on the online monitoring of dirty insulators. In the current research, the leakage current method is widely adopted, but it still has some problems [5,6,7,8,9]. The literature [9] points out that the method of measuring the leakage current using a centrifugal structural current sensor or a microcurrent sensor has the disadvantages of single feature and consuming excessive transmission load. At present, relevant scientific research institutions are still carrying out tests. As a matter of fact, this method still has certain shortcomings. There is no unified conclusion about the selection of characteristic parameters of current signal leakage, pollution degree evaluation algorithms, and the corresponding early warning threshold settings. In addition, the sensors for leakage current monitoring require contact installation with the tower, which is not easy for post-maintenance.
Furthermore, other scholars have proposed some advanced online monitoring methods, such as thermal imaging, ultrasound, UV imaging, etc. [10,11,12,13]. However, the literature [14] points out that thermal imaging is influenced and limited by climatic conditions, while the ultrasound method has the problems of coupling and attenuation, and it is also limited by the performance of the ultrasonic converter. For the UV imaging-based external insulation detection technology for power transmission and distribution, there have been many years of research experience, but there is still no unified opinion on the selection of characteristic parameters such as spot area and photon number, and the recognition algorithm is complicated [15]. In addition, the actual operating insulators in the line generally only have severe corona discharge at the high-voltage end, so there are certain defects in the applicability of ultraviolet detection.
As one of the important parameters of electrical equipment, the electric field strength can well reflect the operating state of the external insulation of power transmission and transformation, and it can be measured in a non-contact manner [16,17]. Existing studies have shown that contamination of the surface of an insulator affects its surrounding electric field distribution. For example, the literature [18,19] pointed out that the electric field distribution around the insulator under different contaminated conditions is significantly different, and when the contaminated composite insulator discharges along the surface, the electric field distribution of the local arc head significant changes from a weak vertical component to a strong vertical component structure. The authors in [20] simulated the microscopic development process of the local arc of the pollution flashover and proposed the influence of different pollution distribution conditions and the salt density conductivity of different pollution layers on the local potential and electric field distribution of composite insulators. They [20] also proved that the insulator pollution flashover process is directly associated with the variation of its surrounding electric field strength.
However, the above research did not compare the electric field distribution characteristics of the insulators under different surface conditions in order to obtain the relationship between the changes of insulator spatial electric field and its surface pollution conditions, which can provide theoretical support for non-contact pollution insulator condition monitoring and the provision of a pollution flashover warning. In addition, other monitoring and detection methods have their own defects, as were aforementioned. In summary, to propose a novel and non-contact condition monitoring method of a polluted insulator based on the spatial electric field, this paper takes 110 kV composite insulator string as the object and studies the spatial electric field variation laws of insulator strings under different pollution conditions through finite element simulation. The influence of observation position and distance on the spatial electric field distribution of the insulator string is compared and analyzed. Furthermore, the correlation relationship between the spatial electric field amplitude and pollution surface conditions is obtained and experimentally verified. The research results can provide a reference for non-contact monitoring and pollution flashover early warning of the external pollution insulation of the power system.

2. Finite Element Simulation Model for Pollution Insulator

2.1. Basic Simulation Settings

The basic setup of the simulation calculation domain is as follows: (1) the domain is solved with single-phase loading voltage [21]; (2) the three-dimensional axisymmetric structure of the insulator string is simplified to a two-dimensional model for analysis; (3) the pollution layer, water film, etc., are set as uniform media; (4) the simulation mainly considers the changes in electric field distribution caused by the boundary conditions and properties of the medium, while ignoring corona discharge, water droplet flow, and other factors.
The conductivity of the insulator surface in a clean state is very small, and its electric field is a capacitively distributed axisymmetric electric field. The electrostatic field method can be used to establish a two-dimensional cross-sectional model for solution. Once the contamination on the surface of the contaminated insulator is moistened, the conductivity increases sharply, and the surface leakage current increases, so the surface electric field of the insulator becomes a non-static field distribution. Considering the power frequency alternating current, the electric field distribution on the surface of the shed exhibits resistance–capacitance properties. Therefore, the electrostatic field method alone cannot solve the electric field distribution of contaminated insulators. In this paper, the calculation domain of the electric field distribution of the dirty insulator is set as the quasi-current field, and the complex domain is applied. At this time, the insulator potential changes from a scalar to a complex vector, and the calculation domain potential distribution equation is
1 r r { r ( σ + j w ε ) ϕ r } + z { ( σ + j w ε ) ϕ z } = 0
Boundary conditions for composite insulators are as follows:
{ φ | l 0 = U φ | l 1 = 0
Since the electric field strength is very small at a place far away from the insulator, it has no effect on the simulation results. Therefore, on the boundary of the model, we set the bottom surface as the ground and the other five surfaces as the artificial cut surface. The voltage on the artificially cut surface is zero.
The formula for the boundaries of different media are as follows:
{ ϕ 1 = ϕ 2 ( σ 1 + j w ε 1 ) ϕ 1 n = ( σ 2 + j w ε 2 ) ϕ 2 n
The finite element solution of the variable partition equation is as follows:
F ( ϕ ) = 1 2 Ω ( σ + j ω ε ) ( ϕ ) 2 d Ω + Γ = L 1 ( σ + j ω ε ) ( 1 2 f 1 ϕ 2 f 2 ϕ 2 ) d T
The function F is the intermediate variable for solving the electric potential distribution based on the variational method, and its minimum value is the solution of the differential equation, where ε and σ are the conductivity and dielectric constant of the material, respectively; r and z are the coordinates in the model; l0 is the high-voltage electrode; l1 is the ground electrode; Φ is the potential; Ω is the solving field; T is the curve surrounding the solving field; and W is the power angle frequency.

2.2. Simulation Model

This paper selected the FXBW4-110/120 composite insulator as the simulation sample. As shown in Figure 1, the minimum nominal creepage distance of the insulator is 3600 mm, the structure height is 1440 mm, the insulation distance is 1200 mm, and the dielectric material properties are as shown in Table 1 [22,23,24]. The conductivity of the water was set at 0.03 S/m to simulate the pollution severity level I. The insulator shed number was set from No. 1 to No. 27 with the high voltage end as the starting point.
In this paper, the unbounded domain was processed by the manual truncation method, and the structure height of the composite insulator was set as 3 times the calculation domain, as shown in Figure 2a. The spatial electric field distribution on a straight line parallel to the insulator string was studied at different distances d outside the shed, as shown in Figure 2b. The high voltage end of the composite insulator was the highest amplitude-phase voltage, and the low voltage end and the side of the gold were grounded, of which the potential was 0 kV.

2.3. Pollution Conditions Setting Method

In this paper, simulation models of composite insulators with different wet pollution states and different arc starting stages were established. The specific settings were as follows:
(1)
The water bead morphology and water film coverage area on the surface of the shed are defined by the water spray classification method. As shown in Figure 2c, the water bead formation model corresponds to HC1. As shown in Figure 2d, the intermittent water band model corresponds to HC4.
(2)
In actual situations, the high-voltage end and the low-voltage end are most likely to produce local arcs. As shown in Figure 2e, this paper simulates two different arc starting stages, namely high voltage end arcing (stage 1), and high and low voltage two-end arcing (stage 2). The local arc is simulated by setting the potential difference on the surface boundary of the insulator shed surface, and local arc bridging regions are simulated with alternating potentials. In order to obtain the value of this potential difference, we need to calculate the voltage of the arc in the simulation using Equation (5). The arc volt–ampere characteristic equation is as follows:
U a = A I n a L a
where Ua is the peak value of the local arc voltage; I is the peak value of leakage current; La is the arc length; and A and na are arc coefficients, which are associated with environmental parameters. When the composite insulator string starts arcing, the leakage current is not high. According to the recommended value in the literature [25], in this paper, I was set as 10 mA, La was set as 60 mm, A was set as 60, and na was set as 0.35. Under this case, the arc potential was about 1500 V, and this value was used in the computation model to set the boundary potential.

3. Space Electric Field Distribution Simulation Results and Analysis

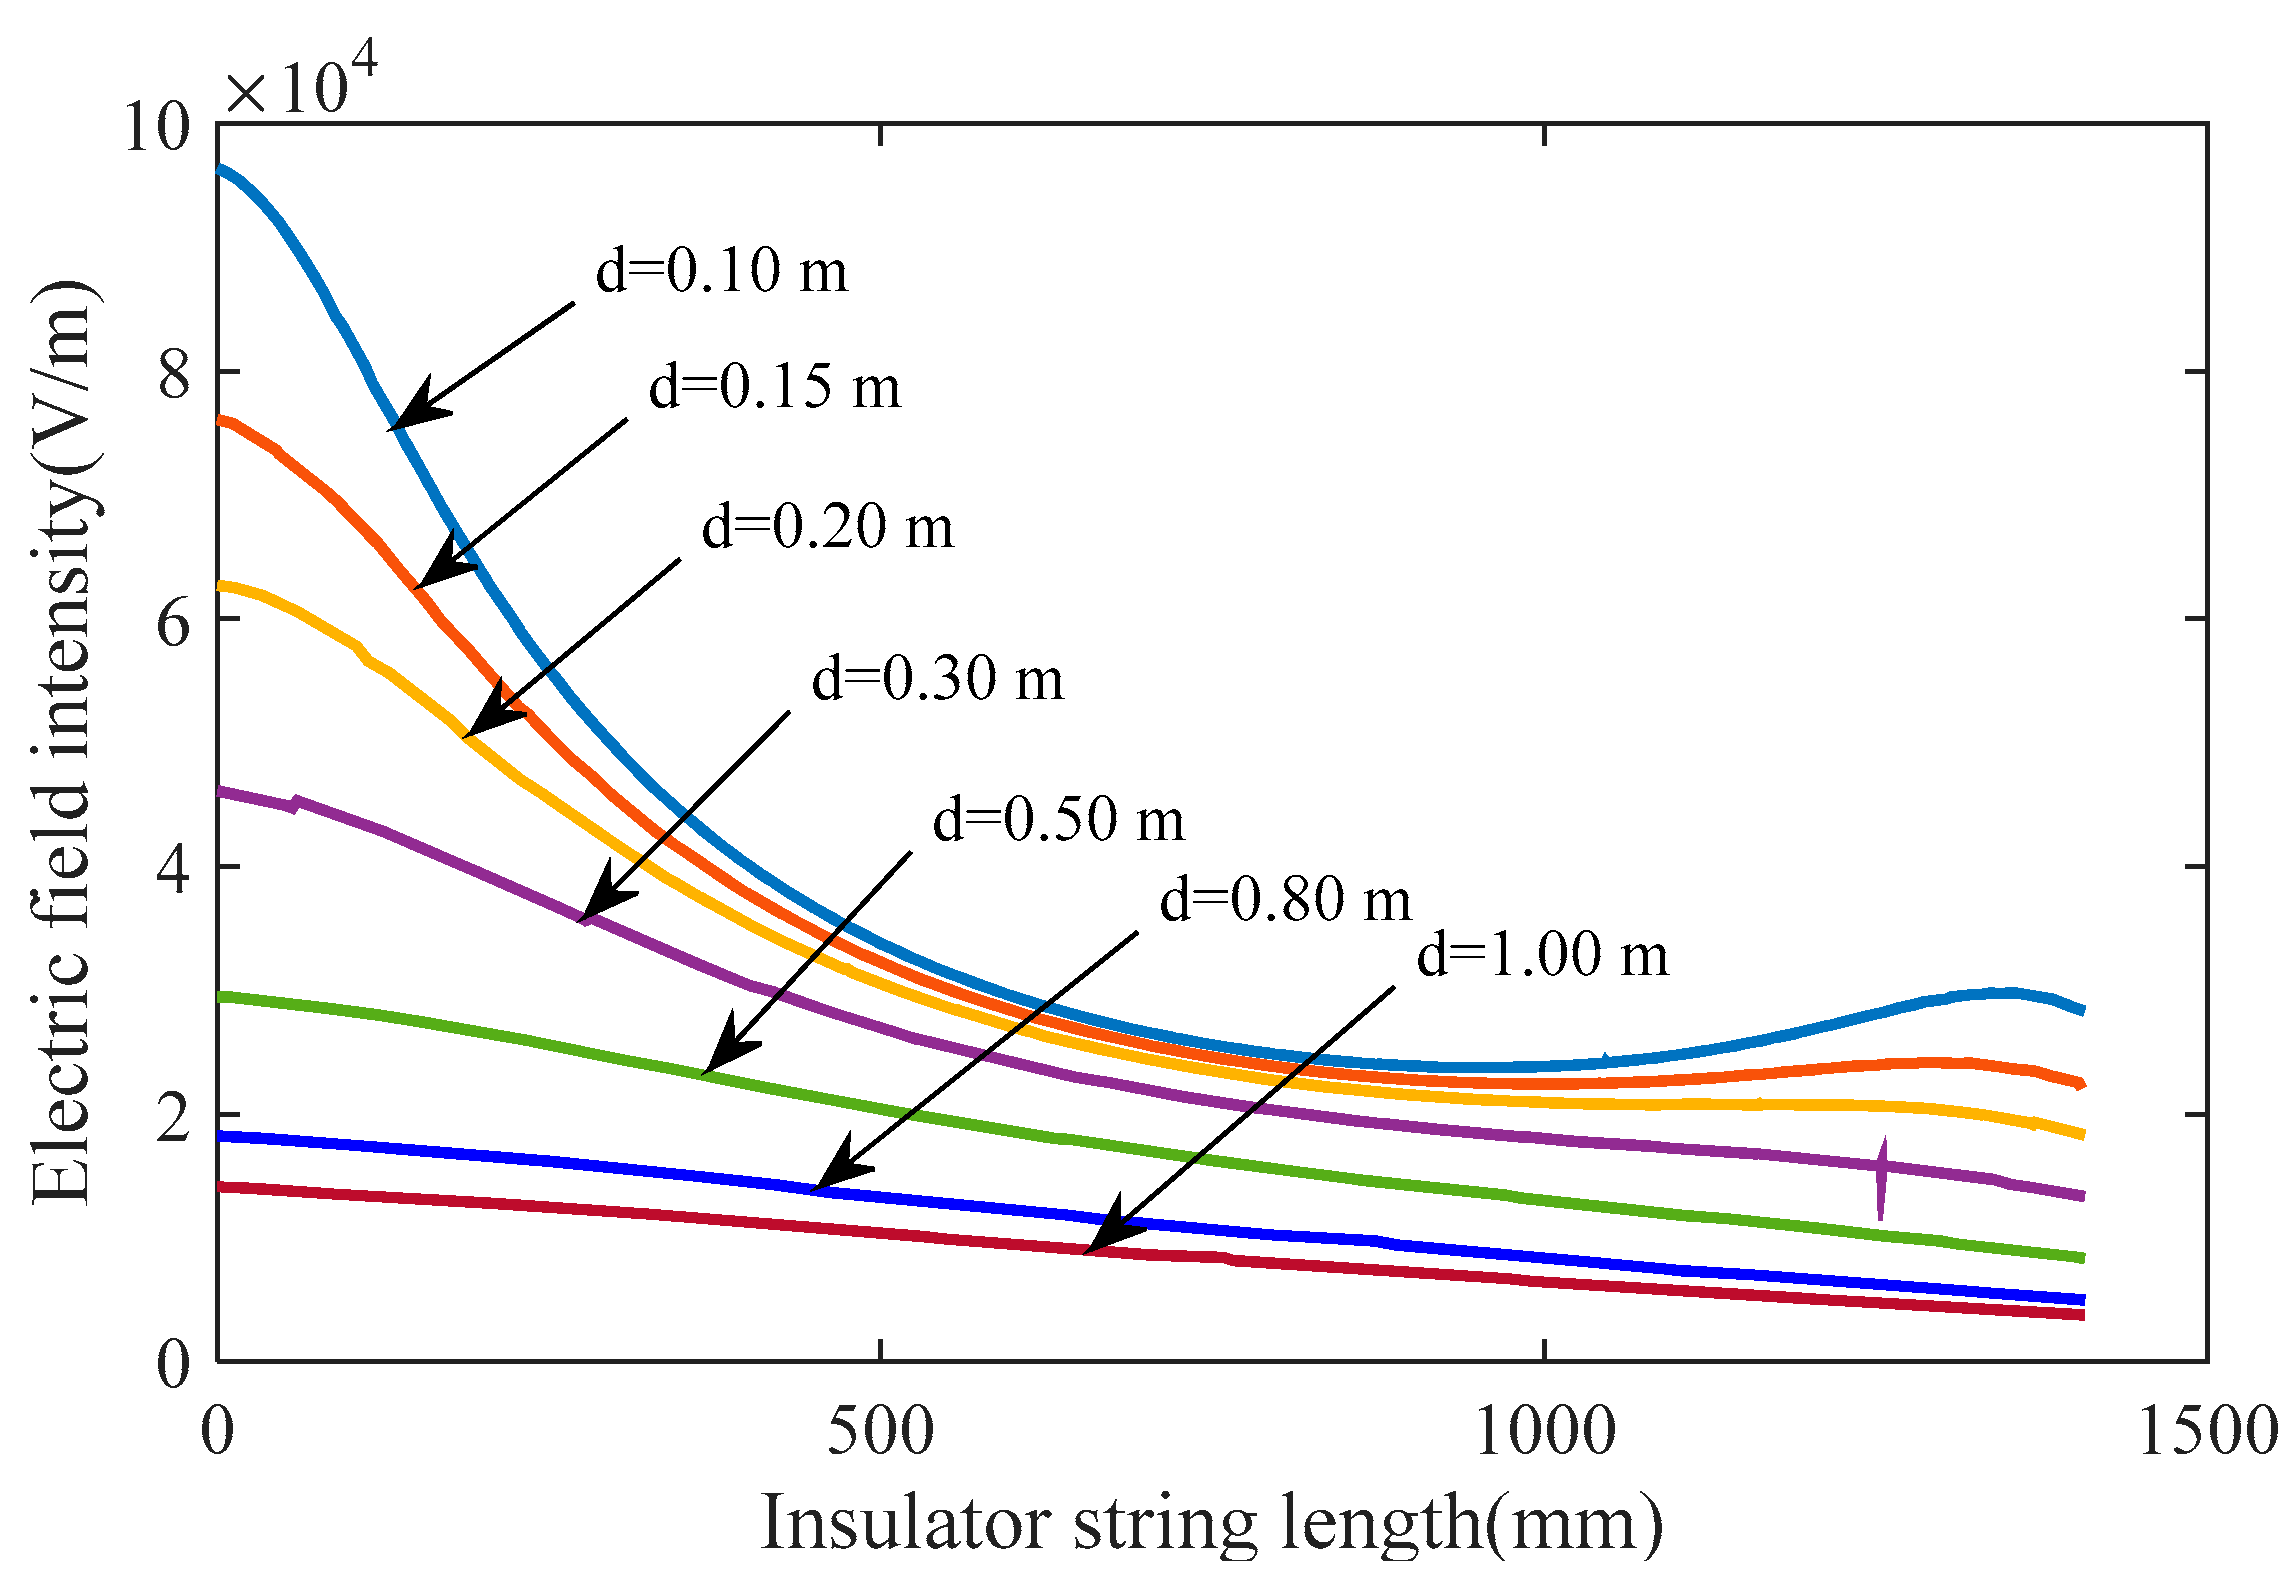
3.1. Electric Field Distribution of Clean Insulator Strings

Figure 3 shows the electric field magnitude distribution of clean composite insulator strings at different radial distances. As shown in Figure 3, an increase of d would lead to a decrease of the spatial electric field magnitude. When the radial distance d increases from 0.2 m to 0.5 m, the insulator string spatial electric field magnitude attenuation can reach 80%. When d is greater than 0.5 m, the distribution curve no longer has a saddle shape. Therefore, in this paper, d = 0.3 m and 0.5 m were selected to study the spatial electric field distribution characteristics of insulator strings under different pollution conditions. The electric field change rate ΔE was set as follows:
{ Δ E i , k = ( | E k E i | ) / E i Δ E i , m = ( | E m E i | ) / E i
where i represents the clean composite insulator string, k represents the pollution layer wetting condition, and m represents the dry band arcing condition.

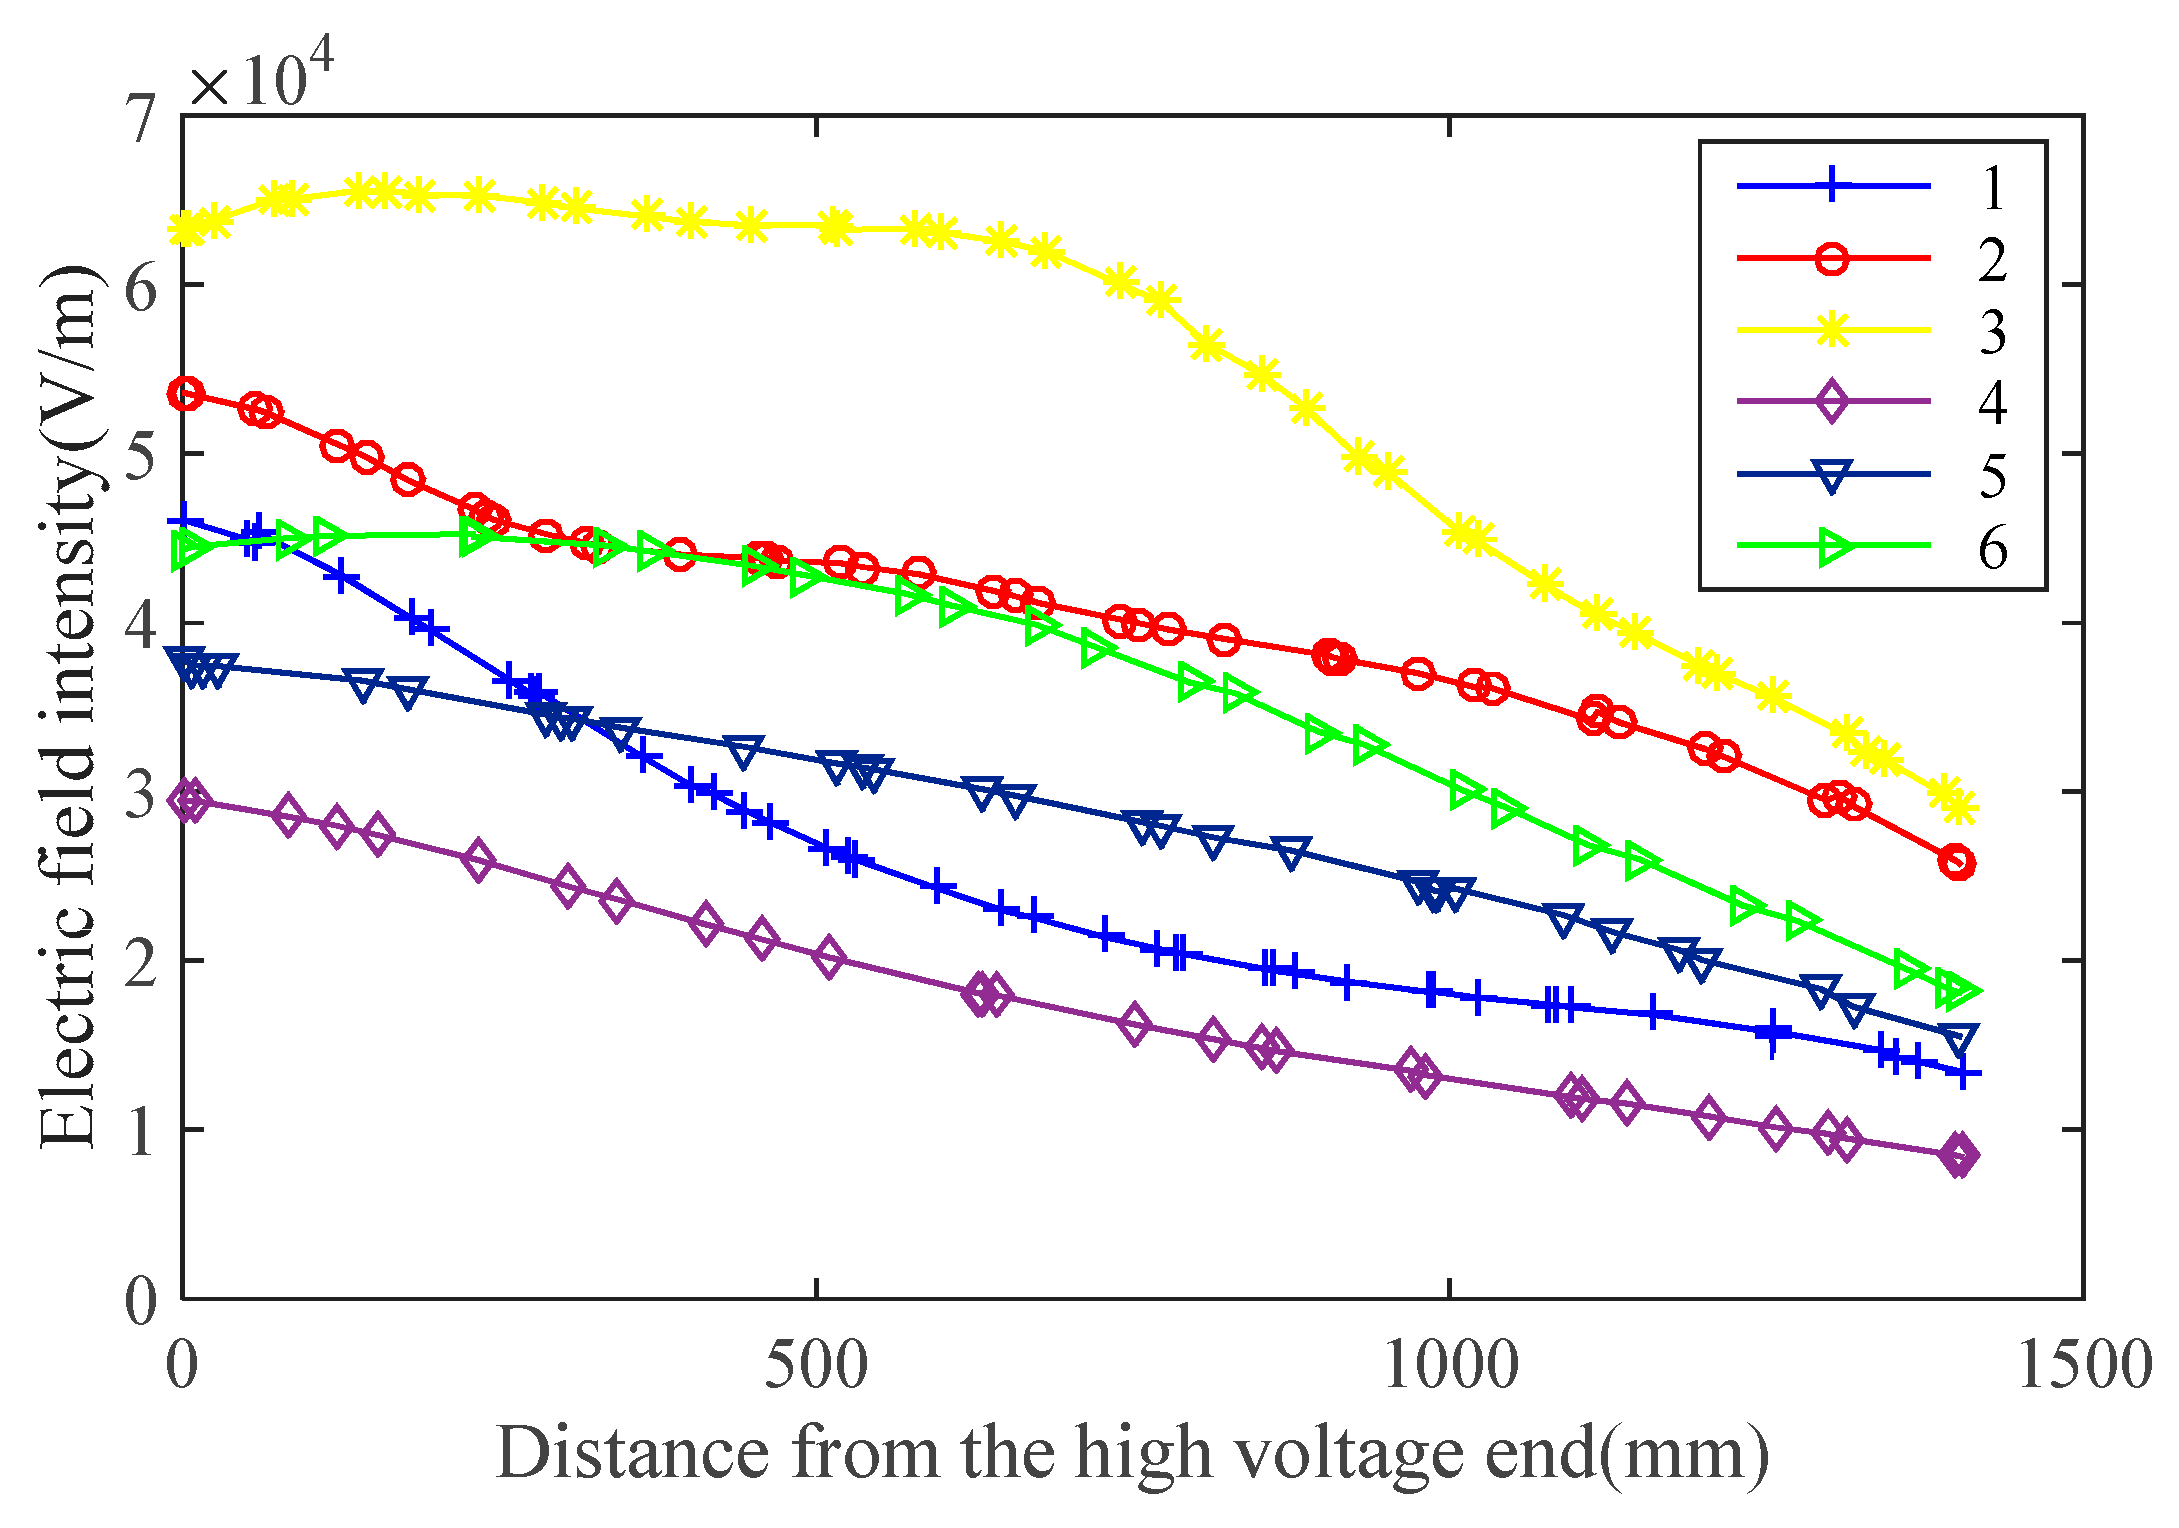
3.2. Electric Field Distribution of Insulator Strings under Surface Pollution Wetting Condition

The spatial electric field distribution of the insulator string under different pollution wetting conditions is shown in Figure 4. As shown in Figure 4, when a water film formed on the insulator pollution surface, the spatial electric field showed obvious fluctuations with the change of the distance of the high voltage end. This may be due to the change of the resistance–capacitance distribution characteristics of the insulator string caused by the formation of conductive water bands. Compared to the clean condition, the spatial electric field values of the insulator under the pollution wetting condition changed significantly. The maxima of ΔEi,k were 3.2% and 53.7% for the droplet formation condition and water film formation condition, respectively, when d = 0.3 m. When d = 0.5 m, the maxima of ΔEi,k were 3.2% and 44.2% under the two respective conditions. The maximum values of ΔEi,k occurred at around 1000 mm and 1400 mm from the high voltage end.

3.3. Electric Field Distribution of Insulator Strings under Dry Band Arcing Conditions

Figure 5 shows the electric field distribution of the composite insulator string under dry band arcing conditions. As shown in Figure 5, in the case of a local arc, the spatial electric field distribution of the insulator string no longer exhibited a saddle shape, because the local arc and the conductive water film greatly changed the potential distribution on the surface of the insulator. Compared to the clean condition, the spatial electric field values of the insulator under dry band arcing conditions changed significantly. The maximum values of ΔEi,k were 103.6% and 151.9% for the arcing stage 1 and arcing stage 2, respectively, when d = 0.3 m. When d = 0.5 m, the maximum values of ΔEi,k were 86.7% and 131.5% under the two respective arcing stages. The maximum values of ΔEi,m also appeared at about 1000–1400 mm from the high voltage end.

4. Non-Contact Monitoring Method for Contaminated Insulators

Previous research has shown that the amplitude of the insulator’s spatial electric field changes most obviously under different surface contamination states. Therefore, the simulation results of the spatial electric field amplitude of the insulators under all the above-mentioned typical pollution conditions were selected and drawn into a broken line diagram, as shown in Figure 6. As shown in Figure 6, the amplitude of the spatial electric field near the low-voltage end of the insulator changed obviously with the variation of pollution conditions, under both d = 0.3 m and d = 0.5 m. The maximum rate of change of the spatial electric field amplitude of the insulator was similar, and they all appeared at a distance of about 1000–1400 mm from the high voltage end, that is, the low voltage end.
Taking into account the convenience of on-site installation and subsequent maintenance, the safety net distance d of the monitoring sensor should be as large as possible; therefore, in this paper, d = 0.5 m was selected as the representative position for monitoring the spatial electric field distribution characteristics of the insulator string under different surface pollution states.
As was mentioned, it is expected to be close to the low-voltage end, and the greater the d, the easier it is to install and use the space electric field probe. Therefore, d = 0.5 m was selected, and the spatial electric field amplitudes were compared at the corresponding positions of the three insulators of No. 25, No. 26, and No. 27 under different pollution layer conditions, which are recorded as A, B, and C, respectively (as shown in Figure 7), and the simulation results were drawn as a line chart, as shown in Figure 8.
It can be seen from Figure 8 that under the condition of surface pollution, when the insulator developed from a surface pollution wetting state to a stage where local arcs were generated, the amplitude of the space electric field of the insulator at three locations gradually increased, and the closer to the pollution flashover, the greater the increase. Therefore, the above results indicate that it is feasible to identify the degree of contamination and the degree of arc development by monitoring the space electric field signal at a point of d = 0.5 m at 110 kV composite insulator cross-arm, directly facing the designated patch position. At that location, the electric field value is in the scale of 8 kV/m to 22 kV/m under different pollution layer conditions, and after calculation, when the insulator pollution surface is wetting, the space electric field amplitude may increase by 3–43.1%. When a local arc occurs, the amplitude of the space electric field may increase by 83.6–119.4%.

5. Artificial Verification Test

The research results in this paper preliminarily show that there is a clear correlation between the changing rate of the spatial electric field of the polluted composite insulator string and its surface pollution condition. Based on the simulation, the spatial electric field waveform during insulator flashover was monitored at a fixed point in laboratory to propose a non-contact method for pollution insulator surface state identification and pollution flashover warning. Due to the limitation of test power supply capacity, this paper selected a 35 kV short composite insulator as the sample for the artificial pollution test. The structure parameters of the sample are shown in Table 2.
The test layout and circuit diagram are shown in Figure 9. The test power supply was a 100 kVA test transformer with a maximum AC output voltage of 50 kV and a rated current of 2.0 A. A plexiglass jar with an inner diameter of 80 cm and a height of 120 cm was used to simulate the environment of the fog chamber. The sample was suspended vertically in the fog chamber, and the ultrasonic fog generator was passed into the fog chamber from the top to wet the surface of the sample. In order to fully wet the surface of the entire series of test samples, four fans were installed under the glass jar to distribute the fog evenly and fill the entire fog chamber. A d-dot sensor [26] was used to measure the electric field strength in the space around the insulator, which could convert the electric field strength signal into a millivolt–volt voltage signal for oscilloscope acquisition. It was hung on the cross arm of the insulator during the test, and the distance from the insulator was 0.5 m. In order to increase the contrast of the spatial electric field signal, the leakage current of the contaminated insulator string was measured by a 1 ohm non-inductive sampling resistor in this test, and the signal was also recorded by an oscilloscope.
In this paper, the withstand voltage method was used to simulate the pollution flashover process of the insulator under the operating lines, that is, applying the operating voltage first and then opening the fog generator. The corresponding electrical measurement signals during the withstand process were recorded. The test procedure is as follows:
(1)
Cleaning. The sample was cleaned and allowed to dry naturally.
(2)
Polluting. The equivalent salt deposit density, which was set as 0.05 mg/cm2, was simulated by sodium chloride, and the non-soluble deposit density was simulated by kaolin. Their mas ratio was set as 1:6. During polluting of the insulator sample, the surface was firstly covered with a thin layer of kaolin, and then the surface was uniformly brushed to make it evenly coated with a pollution layer, and then the polluted sample was dried in the shade for 24 h.
(3)
Evaluating. The sample was hung, the wiring circuit was arranged, the voltage was evenly increased to the rated operating voltage of the insulator, and the ultrasonic fog generator and the fans were turned on. In order to fully wet the surface of the entire series of the sample, the wind direction of the fans went up vertically, and the speed of wind was 2–3 m/s. The arc development on the surface of the sample and the waveform of the oscilloscope were recorded in real time, including electric field signals and leakage current signals. If the flashover did not occur for one hour, the test was stopped. During the test, the arc development was observed and the signal changes recorded by the oscilloscope, and a single rising edge trigger mode was set to intercept the spatial electric field as well as the leakage current waveform at the moment of local arc generation.
The withstand voltage time of this test was set as 1 h. During the test, local arcs were found on the surface of the insulator many times, but no flashover occurred till the end of the withstand process. This may be due to low contamination degree, cold fog, and the long withstand time, which caused the loss of the pollution layer. In addition, due to the good hydrophobicity of the composite insulating material and the insufficient pollution degree, a stable power frequency arc was not generated during the test, so the recorded leakage current waveform during pollution flashover of the sample showed pulse characteristics. The typical waveform obtained during the test is shown in Figure 10.
It can be seen from the figure that the spatial electric field signal at the characteristic position of the insulator under dry conditions was basically a sinusoidal waveform with no obvious distortion. After the dirty layer was wet for 12 min, the dirty layer on the surface of the insulator showed obvious conductive characteristics, and the resistive component of the leakage current increased. Coupled with the influence of corona discharge interference, the phase of the space electric field signal was shifted and the waveform was distorted. After 35 min of pressure, the dirt layer was fully wet, and the local arcs were alternately extinguished, causing multiple pulses of leakage current and space electric field signals. The distortion of the spatial electric field signal was more obvious, especially at its peak.
Comparing the leakage current and the signal waveform of the space electric field at different stages, it can be seen from Figure 10 that for the leakage current in the three states of the pollution flashover discharge of the composite insulator, the surface was dry, the pollution layer was wet, and the local arc started. The change of the current average value was not very obvious, but the amplitude change was obvious, and the largest pulse amplitude reached 500 mA, while the smallest pulse amplitude was about 10 mA. However, the spatial electric field signal waveform not only had obvious amplitude changes, but also had obvious pulse signals. Moreover, the effective value of the spatial electric field waveform also had an obvious upward trend in the three states, which was consistent with the previous simulation results, thus verifying the previously proposed non-contact monitoring method of insulator pollution flashover based on the spatial electric field signal. In addition, for the spatial electric field signal, there are obvious distortion characteristics in the state where the dirt layer is wet and there is local arcing. In summary, compared with the leakage current signal, the space electric field can not only be measured in a non-contact manner, but it also has richer change characteristics if serving as a basis for early warning of pollution flashover.
After calculation, the comparison of the characteristic parameters of the leakage current signal and the spatial electric field signal under different contaminated insulator surface conditions is shown in Table 3.
It can be seen from the data in the table that under different contaminated insulator surface conditions, the change characteristics of the spatial electric field signal were more obvious than the leakage current. The test results also confirmed the validity of the previous simulation conclusions for 110 kV insulators. It is feasible to realize pollution flashover warning by monitoring the spatial electric field signal through a non-contact manner. In the follow-up, based on the artificial pollution test, the relationship between the characteristic parameters of the space electric field signal and the salt density of the insulator surface and the degree of wetness and discharge will be established, and corresponding pollution flashover warning measures are to be proposed.
When recommending the adoption of this methodology on live HVAC lines, we would like to supplement that compared with the leakage current monitoring device, which needs to arrange a current-collecting-ring on the surface of the insulator shed, the non-contact electric field monitoring device in this paper is hung under a cross-arm and 0.5 m away from the string, so we are sure that it has no influence on the insulation distance and thus will not impact the withstand performance on a live tower structure application. Secondly, compared to the insulator string, the electric field sensor is very small and away from the string, so it has little effect on the electric field distribution of the whole string, especially the electric field changing properties under different surface conditions. Moreover, the other phases’ rated voltages will have less effects on the proposed non-contact method in a live system, not only because the other phase voltage source is far away from the electric field monitoring device compared with its own phase, but also because the grounded cross-arms and steel tower architecture of the other phase itself will play the role of electromagnetic shielding. Normally, since the same tower corresponds to the same pollution level, it is recommended to install only one non-contact monitoring device to realize flashover warning. However, for a wider tower structure with multiple phases, two or three devices may be better.

6. Conclusions

This paper studies the spatial electric field variation laws of insulator string under different pollution conditions through simulations and artificial verification tests and proposes a non-contact condition monitoring method of polluted insulators based on the spatial electric field. The conclusions are as follows:
(1)
In the simulation, with the aggravation of the degree of pollution layer wetting and dry band arcing, the insulator spatial electric field amplitude near the low voltage end has an obvious increasing trend.
(2)
In the simulation, for the 110 kV composite insulator, it is feasible to identify its pollution layer wetting condition and local arc development through fixed-point monitoring of the spatial electric field signal at a point of d = 0.5 m at the cross-arm, directly facing the last three units of the string.
(3)
For the above monitoring locations, the simulation results show that the electric field value is in the scale of 8 kV/m to 22 kV/m under different pollution layer conditions. Compared with clean conditions, the space electric field amplitude increases by 3–43.1% under pollution layer wetting conditions and increases by 83.6–119.4% under local arcing conditions.
(4)
The artificial test verified well the proposed method by simulation. Test results show that under different contaminated insulator surface conditions, the change characteristics of the spatial electric field signal are more obvious than the leakage current, which are waveform distortion, fundamental wave amplitude increase, and pulse amplitude increase. Thus, it is feasible to realize pollution flashover warning by monitoring the spatial electric field signal through a non-contact manner.

Author Contributions

Conceptualization, D.Z., H.X., Z.Z., X.J.; methodology, D.Z., H.X., J.L.; software, D.Z., J.L.; validation, H.X., J.L.; formal analysis, C.Y.; in-vestigation, H.X., J.L.; resources, D.Z., X.H.; data curation, H.X., J.L.; writing—original draft preparation, D.Z., H.X., J.L.; writing—review and editing, H.X., J.L.; visualization, H.X., J.L.; supervision, D.Z.; project administration, D.Z.; funding acquisition, D.Z., X.H. All authors have read and agreed to the published version of the manuscript.

Funding

This resea rch was funded by Open Research Fund of Jiangsu Collaborative Innovation Center for Smart Distribution Network, Nanjing Institute of Technology, grant number XTCX201806; Jiangsu Natural Science Foundation Project, grant number BK20181021; High-level Talent Introduction Scientific Research Foundation of Nanjing Institute of Technology, grant number YKJ201819; Nanjing Institute of Technology Graduate Science and Technology and Innovation Foundation Project, grant number TB202117042. The APC was funded by YKJ201819.

Conflicts of Interest

The authors declare no conflict of interest.

References

  1. Yang, Z.; Fan, P.; Wang, Q.F.; Wang, S.W.; Chen, J.; Huang, W.; Wu, B.Q.; Zhou, D. Electric field analysis of internal gaps in composite insulators for high-voltage transmission lines. Power Grid Clean Energy 2019, 35, 1–8. [Google Scholar]
  2. Zhang, Z.J.; Yang, S.H.; Jiang, X.L.; Qiao, X.H.; Xiang, Y.Z.; Zhang, D.D. DC flashover dynamic model of post insulator under non-uniform pollution between windward and leeward sides. Energies 2019, 12, 2345. [Google Scholar] [CrossRef] [Green Version]
  3. Majid Hussain, M.; Farokhi, S.; McMeekin, S.G.; Farzaneh, M. Risk Assessment of Failure of Outdoor High Voltage Polluted Insulators under Combined Stresses Near Shoreline. Energies 2017, 10, 1661. [Google Scholar] [CrossRef] [Green Version]
  4. Majid Hussain, M.; Farokhi, S.; McMeekin, S.G.; Farzaneh, M. Effect of uneven wetting on E-field distribution along composite insulators. In Proceedings of the 2016 IEEE Electrical Insulation Conference (EIC), Montreal, QC, Canada, 19–22 June 2016. [Google Scholar]
  5. Hao, Y.; Liao, Y.; Kuang, Z.; Sun, Y.; Shang, G.; Zhang, W.; Mao, G.; Yang, L.; Zhang, F.; Li, L. Experimental Investigation on Influence of Shed Parameters on Surface Rainwater Characteristics of Large-Diameter Composite Post Insulators under Rain Conditions. Energies 2020, 13, 5011. [Google Scholar] [CrossRef]
  6. Wang, S.H.; Tan, G.L. Fuzzy evaluation of insulator pollution flashover based on improved EMD de-noising and entropy weight method. IEEE J. Inf. Comput. Sci. 2015, 12, 5687–5696. [Google Scholar] [CrossRef]
  7. Ghosh, R.; Chatterjee, B.; Chakravorti, S. A Novel Leakage Current Index for the Field Monitoring of Overhead Insulators Under Harmonic Voltage. IEEE Trans. Ind. Electron. 2018, 65, 1568–1576. [Google Scholar] [CrossRef]
  8. Majid Hussain, M.; Farokhi, S.; McMeekin, S.G.; Farzaneh, M. Effect of cold fog on leakage current characteristics of polluted insulators. In Proceedings of the 2015 International Conference on Condition Assessment Techniques in Electrical Systems (CATCON), Bangalore, India, 10–12 December 2015. [Google Scholar]
  9. Chandrasekar, S.; Kalaivanan, C.; Montanari, G.C.; Cavallini, A. Partial discharge detection as a tool to infer pollution severity of polymeric insulators. IEEE Trans. Dielectr. Electr. Insul. 2010, 17, 181–188. [Google Scholar] [CrossRef]
  10. Ma, Z.B. Research and Design of Online Monitoring and Management System of Insulator Pollution in Distribution Networks in Mining Areas. Master’s Thesis, China University of Mining and Technology, Xuzhou, China, 2019. [Google Scholar]
  11. Jiang, T.; Wang, J.; He, W.; Yang, F. Non-contact on-line insulators monitoring based on UV-pulse detecting. In Proceedings of the World Automation Congress, Hawaii, HI, USA, 28 September–2 October 2008. [Google Scholar]
  12. Albano, M.; Waters, R.T.; Charalampidis, P.; Griffiths, H.; Haddad, A. Infrared analysis of dry-band flashover of silicone rubber insulators. IEEE Trans. Dielectr. Electr. Insul. 2016, 23, 304–310. [Google Scholar] [CrossRef]
  13. Prasad, P.S.; Rao, B.P. Condition monitoring of 11 kV overhead power distribution line insulators using combined wavelet and LBP-HF features. IET Gener. Transm. Distrib. 2017, 11, 1144–1153. [Google Scholar] [CrossRef]
  14. Jin, L.; Tian, Z.; Ai, J.; Zhang, Y.; Gao, K. Condition evaluation of the contaminated insulators by visible light images assisted with infrared information. IEEE Trans. Instrum. Meas. 2018, 67, 1349–1358. [Google Scholar] [CrossRef]
  15. Wei, J.C. Research on the Method of Ultraviolet Image Diagnosis of Faulty Insulators and Its Influencing Factors. Master’s Thesis, Shandong University, Shandong, China, 2018. [Google Scholar]
  16. Zhang, D.; Chen, S. Intelligent Recognition of Insulator Contamination Grade Based on the Deep Learning of Ultraviolet Discharge Image Information. Energies 2020, 13, 5221. [Google Scholar] [CrossRef]
  17. Qi, B.; Zhao, X.L.; Zhang, S.Q.; Huang, M.; Li, C.R. Measurement of the electric field strength in transformer oil under impulse voltage. IEEE Trans. Dielectr. Electr. Insul. 2017, 24, 1256–1262. [Google Scholar] [CrossRef]
  18. Arshad; Nekahi, A.; McMeekin, S.G.; Farzaneh, M. Effect of Pollution Severity on Electric Field Distribution along a Polymeric Insulator. In Proceedings of the 2015 IEEE 11th International Conference on the Properties and Applications of Dielectric Materials (ICPADM), Sydney, NSW, Australia, 19–22 July 2015. [Google Scholar]
  19. Majid Hussain, M.; Farokhi, S.; McMeekin, S.G.; Farzaneh, M. The effects of salt contamination deposition on HV insulators under environmental stresses. In Proceedings of the 2015 IEEE 11th International Conference on the Properties and Applications of Dielectric Materials (ICPADM), Sydney, NSW, Australia, 19–22 July 2015. [Google Scholar]
  20. Kong, D.S. Experimental Study on Surface Discharge of Silicone Rubber Insulators. Master’s Thesis, Huazhong University of Science and Technology, Wuhan, China, 2016. [Google Scholar]
  21. Rasara, H.L.; Wong, K.L. Study of electrical field and micro arcing in a wooden supporting structure using Finite Element Method. In Proceedings of the 2012 International Conference on High Voltage Engineering and Application, Shanghai, China, 17–20 September 2012. [Google Scholar]
  22. Qiao, X.H.; Zhang, Z.J.; Jiang, X.L.; Sundararajan, R.J.; You, J.W. DC pollution flashover performance of HVDC composite insulator under different non-uniform pollution conditions. Electr. Power Syst. Res. 2020, 185. [Google Scholar] [CrossRef]
  23. Jamshid, M.; Mohammad, M.; Shayegani, A.; Abbas, A. Effect of accumulated surface charges on DC flashover of SiR insulators under pollution and aging conditions. Electr. Eng. 2020, 102, 2123–2133. [Google Scholar] [CrossRef]
  24. Bhavani, J.; Phani, K.C. Finite Element Modeling of Voltage and Electric Field Distribution along the Insulators. In Proceedings of the 2019 4th International Conference on Recent Trends on Electronics, Information, Communication & Technology, Bangalore, India, 17–18 May 2019. [Google Scholar]
  25. Jiang, X.L.; Shu, L.C.; Sun, C.X. Power System Pollution and Icing Insulation, 1st ed.; China Electric Power Press: Beijing, China, 2009; pp. 59–124. [Google Scholar]
  26. Huang, Q.J. Study on Partial Disrcharge On-line Mornitoring of High Voltage Switchgears Based on Ultral-High-Frequency Method. Master’s Thesis, Chongqing University, Chongqing, China, 2013. [Google Scholar]
Figure 1. Diagram of FXBW4-110/120 composite insulator structure diagram (unit: mm).
Energies 14 02116 g001
Figure 2. Simulation diagrams of composite insulator in different pollution conditions: (a) composite insulator string model, (b) spatial electric field simulation measurement, (c) water bead formation model, (d) water belt formation model, (e) local arcing model.
Energies 14 02116 g002aEnergies 14 02116 g002b
Figure 3. Electric field distribution of clean composite insulator string.
Energies 14 02116 g003
Figure 4. Effects of wet pollution condition on space electric field of composite insulator.
Energies 14 02116 g004
Figure 5. Effect of local arc on space field of composite insulator (1—d = 0.3 m clean insulator string, 2—d = 0.3 m arcing stage 1, 3—d = 0.3 m arcing stage 2, 4—d = 0.5 m clean insulator string, 5—d = 0.5 m arcing stage 1, 6—d = 0.5 m arcing stage 2).
Energies 14 02116 g005
Figure 6. Effect of different pollution conditions on the space electric field of composite insulator. (1—clean insulator strings, 2—dry state, 3—a few drops of water, 4—many water drops, 5—water band formation, 6—localized arc phase I, 7—localized arc phase II).
Energies 14 02116 g006
Figure 7. Monitoring position diagram of insulator unit No. 25, No. 26, No. 27.
Energies 14 02116 g007
Figure 8. Changes in the amplitude of the electric field at three locations with different pollution states (1—clean insulator strings, 2—droplet formation, 3—water band formation, 4—localized arc phase I, 5—localized arc phase II).
Energies 14 02116 g008
Figure 9. Laboratory test arrangement and circuit diagram.
Energies 14 02116 g009aEnergies 14 02116 g009b
Figure 10. Typical waveform during the artificial tests.
Energies 14 02116 g010
Table 1. Properties of each dielectric material.
Type of MaterialRelative Dielectric Constant εConductivity (S/m)
Silicone rubber3.51 × 10−12
Goldsmith10005.998 × 107
Mandrel61 × 10−12
Water droplet/film810.03
Air1.021 × 10−22
Table 2. Structure parameters of the sample (unit: mm).
TypeHeightShed DiameterCreepage DistanceStructure Diagram
FXBW-35/70620129/891280 Energies 14 02116 i001
Table 3. Comparison of various characteristic parameters of leakage current signal and spatial electric field signal under different contaminated insulator surface conditions.
Signal TypeSpatial Electric Field SignalLeakage Current Signal
Fundamental Wave Amplitude (mV)Pulse Amplitude (mV)Variation by l Wave AmplitudeSimulation ResultsFundamental Wave Amplitude (mA)Pulse Amplitude (mA)
Dry2030//1.42
Pollution layer wetting305633.3%3–43.1%0.810–44
Wetting with arcs41190–68090.5%83.6–119.4%3.116–560
Publisher’s Note: MDPI stays neutral with regard to jurisdictional claims in published maps and institutional affiliations.

