Article

Achieving High-Performance Spherical Natural Graphite Anode through a Modified Carbon Coating for Lithium-Ion Batteries

1
Department of Materials Science & Engineering, Kangwon National University, 1 Gangwondaehakgil, Chuncheon-Si 24341, Korea
2
R&D Campus, LG Energy Solution, 188 Munji-ro, Yuseong-gu, Dae-jeon-Si 34122, Korea
*
Author to whom correspondence should be addressed.
Energies 2021, 14(7), 1946; https://doi.org/10.3390/en14071946
Submission received: 7 March 2021 / Revised: 26 March 2021 / Accepted: 30 March 2021 / Published: 1 April 2021
(This article belongs to the Special Issue Advanced Materials and Technologies for Lithium-Ion Battery)

Abstract

:
The electrochemical performance of modified natural graphite (MNG) and artificial graphite (AG) was investigated as a function of electrode density ranging from 1.55 to 1.7 g∙cm−3. The best performance was obtained at 1.55 g∙cm−3 and 1.60 g∙cm−3 for the AG and MNG electrodes, respectively. Both AG, at a density of 1.55 g∙cm−3, and MNG, at a density of 1.60 g∙cm−3, showed quite similar performance with regard to cycling stability and coulombic efficiency during cycling at 30 and 45 °C, while the MNG electrodes at a density of 1.60 g∙cm−3 and 1.7 g∙cm−3 showed better rate performance than the AG electrodes at a density of 1.55 g∙cm−3. The superior rate capability of MNG electrodes can be explained by the following effects: first, their spherical morphology and higher electrode density led to enhanced electrical conductivity. Second, for the MNG sample, favorable electrode tortuosity was retained and thus Li+ transport in the electrode pore was not significantly affected, even at high electrode densities of 1.60 g∙cm−3 and 1.7 g∙cm−3. MNG electrodes also exhibited a similar electrochemical swelling behavior to the AG electrodes.

1. Introduction

Graphitic carbons, such as natural graphite (NG) and artificial graphite (AG), are currently used as negative electrode material for Li-ion batteries (LiBs). Among them, NG is preferred because it shows lower production costs and higher capacity, arising from its higher graphitization degree [1,2]. However, it is known that LiBs using NG negative electrodes exhibit significant capacity fade during extended cycling, and only a moderate rate capability, which limits their application to devices requiring long-term cycling capability and high power densities, such as electric vehicles (EV) and energy storage systems (ESS) [2,3,4,5]. On the other hand, AG is known to have good cycling performance due to its stable structure during electrochemical cycling [6].
In general, NG is prepared through impact, by milling natural graphite flakes, in which small, natural graphite flakes are bent concentrically and assembled in a spherical shape [7,8,9]. NG, as an anode material, appears to perform poorly because of its structural instability during the charge/discharge process, i.e., the formation of cracks and swelling throughout the particles as caused by repeated volume changes during cycling [10]. Moreover, when roll pressure is increased to produce high-density electrodes, NG is easily deformed, resulting in a decrease in the porosity and ionic conductivity. Thus, highly roll-pressed NG electrodes suffer from poor rate performance at high C-rates [2,11,12]. Carbon coating on NG has greatly improved the electrochemical performance of NG [13,14,15,16,17,18,19], and carbon-coated NG (CNG) is used commercially. Nevertheless, it is still not sufficient to meet the demand for devices requiring long-term cycling capability and high power densities, such as EV and ESS.
Recently, it was reported that the structure of NG can be significantly stabilized through a modification process using ultrasonication [4]. Hereafter, NG samples obtained through the modified carbon coating process is abbreviated to “MNG”. It appears that the cycle performance of the MNG anode is superior to that of the CNG anode. In light of the current practical situation in which AG is preferred over CNG in sectors requiring high power densities and extended cycling performance, it is meaningful to make a direct comparison between AG and MNG as anode materials. Moreover, there have been few reports of direct comparison in terms of electrochemical performance between AG and NG. In this work, we compared the electrochemical properties of AG and MNG, including discharge capacity, initial and subsequent cycle efficiency, cyclability, and charge/discharge rate performance.

2. Experimental

2.1. Material Fabrication

MNG powders were prepared by using NG powder (~16 μm, POSCO Chemical Co., Ltd., Sejong-si, Korea) as the raw material, and a mixture of coal-tar pitch and petroleum pitch (provided by POSCO Chemical Co., Ltd.) as the carbon precursor via a similar method as used in a previous report [4]. After a series of processes, including ultrasonication, drying, and heat treatment, the amount of carbon derived from a mixture of coal-tar pitch and petroleum pitch was approximately 7 wt. %. The resulting MNG powder had a mean diameter of ~18.5 μm. It should be noted here that coal-tar pitch and petroleum pitch were utilized as carbon precursors for the above-mentioned process. Utilizing cheap and abundant raw materials can lead to lower production costs, which is crucial from a commercial viewpoint.
For comparison, a commercial artificial graphite (D50 = ~21 μm; Jiangxi Zichen Technology Co., Ltd., Fengxin, Jiangxi) was investigated. In some cases, CNG (~16 μm, POSCO Chemical Co., Ltd.) was also compared with MNG and AG samples.

2.2. Material Characterization

The surface area was measured by the BET (Brunauer–Emmett–Teller; Tristar ll 3020, Protechkorea) method. Field emission scanning electron microscopy (FE-SEM, HITACHI S-4300) and high-resolution transmission electron microscopy (HRTEM, JEOL JEM-2100F) were used to observe the morphology and microstructure of MNG. The tap density was measured by a tap density tester (NIT-TDM, Sinjung Precision Machinery), using a 50 mL graduated glass cylinder and a 25 g sample. The sample preparation for cross-section and TEM analyses was done on a focused ion beam (FIB) system (FEI COMPANY, NOVA 200). A four-point probe method was used to measure the electrical resistance of the electrodes. A Raman spectrometer (LabRAM Aramis, Horiba Jobin Yvon) was used to analyze the Raman spectra of the graphite samples.

2.3. Electrochemical Measurements

The electrodes were prepared by coating a mixture of 96 wt % active material and 4 wt % binder onto a copper film, roll-pressing, and then drying at 180 °C for 12 h under vacuum. The binder used was styrene butadiene rubber/carboxymethyl cellulose (SBR/CMC) binder (1:1 weight ratio). The density of the electrodes was controlled at 1.55 and 1.6 g∙cm−3 for AG and at 1.6 and 1.7 g∙cm−3 for MNG, respectively. The percent error in electrode measurement was ~0.3%. The mass loading was 5 g∙cm−2.
Half-cells (CR2032-type coin) were composed of a graphite electrode and lithium foil as the counter/reference electrodes. The electrolyte was 1M LiPF6 in a mixture of ethylene carbonate (EC)/diethyl carbonate (DEC) (50:50 by volume). To examine the intrinsic performance of AG and MNG, no electrolyte additive was used.
For the initial formation, conditions were as follows: the cells were charged (intercalated) in constant current–constant voltage (CC-CV, CC at 0.2 C-CV at 0.01 V) mode and discharged (de-intercalated) in constant current (CC) mode at 0.2 C, within a voltage range of 0.01 and 1.5 V, for 3 cycles at 30 °C. The cycle performance was measured at 30 and 45 °C.
In order to measure the cyclic performance, the charge and discharge were carried out in CC-CV mode (CC at 0.5 C-CV at 0.01 V) and in CC mode at 0.5 C, respectively. To evaluate the charge rate capability, the cells were galvanostatically charged at rates between 0.2 and 3.0 C and discharged at 0.2 C. The discharge rate performance was measured by charging in CC-CV mode (CC at 0.2 C-CV at 0.01 V) and then galvanostatically discharging at various current densities between 0.2 and 10 C.
The electrochemical impedance of the electrodes was characterized by the electrochemical impedance spectroscopy (EIS) method. The EIS measurements were performed on the fully charged electrodes after cycling, using an impedance analyzer (IM6 Zahner Elektrik) with 5 mV amplitude in the 0.1 to 1 MHz range.
The surface morphological changes in electrodes with cycling were investigated in accordance with the following procedure: after cycling, cells discharged to 1.5 V were disassembled, washed with diethyl carbonate (DEC) in an argon-filled glove box, and then vacuum-dried. For analysis of uncycled samples, and to consider the effect of the possible swelling of the polymer binder, bare electrodes were soaked for 12 h before cycling in an electrolyte solution, washed with DEC, and then vacuum-dried. To measure electrode swelling, the thickness change was also measured in micro-scale with a micrometer (HST-30.4, Wellcos Co., Ltd).

3. Results and Discussion

SEM and TEM images of as-prepared MNG and AG samples are shown in Figure 1. There was an apparent morphological distinction between spherical MNG and irregular-shaped AG, as shown in Figure 1b,c. The AG sample looked similar to a random aggregate of small particles. The MNG had a spherical shape, similar to pristine NG (Figure 1a), but a partially open surface morphology formed during the modified carbon coating using ultrasonication treatment, as discussed in detail in our previous report [4]. From the particle size distribution analysis (Figure 1d), the mean particle size of NG, MNG, and AG samples was 17.3, 18.5, and 22.5 μm, respectively, in which the distribution width, defined as D0.9-D0.1/D0.5, appeared to be larger in AG than in NG and MNG.
Figure 2a shows a cross-sectional TEM (XTEM) image of AG, indicating that the AG particle was coated with amorphous carbon. The HRTEM images of selected areas Figure 2c–f clearly verify that all surface and internal graphite sheets of MNG particle were coated by amorphous carbon. It should be noted here that the coal-tar pitch and petroleum pitch used as carbon precursors in the present work have a higher carbon yield (~30%) than the PVC (~10%) and F127 (~0%) used in the previous work. As a result, the MNG particles became stiffer. Figure 3 displays the compaction density as a function of applied pressure for AG and MNG powders, in which the corresponding plot of commercial CNG is also provided. The procedures for the compaction density test are explained in the previous work [4]. MNG behaved similarly to the AG sample, while the CNG sample showed a higher densification rate and a greater density at all pressures. At this point, it is important to note that the highly roll-pressed CNG electrodes for high energy density of LiBs exhibited poor electrochemical performance because CNG is easily deformed during electrode preparation due to its softness and thus becomes too compressed [2,20].
Electrodes were prepared at two different levels of electrode density: 1.55 and 1.6 g∙cm−3 for AG and 1.6 and 1.7 g∙cm−3 for MNG. The AG electrode is not easy to press above 1.60 g∙cm−3. The SEM images of AG and MNG electrodes with different densities are illustrated in Figure S1. By increasing the electrode density for both the AG and MNG electrodes, the electrodes were densely packed, and thus their porosity seemingly decreased, while the characteristics of the porous electrode were still maintained, as can be seen from the top row of images in Figure 1. This is supported by the variation in sheet resistance with electrode density, as in Table 1, indicating that the electrical resistance of the electrode was lower in the electrode of higher density. Notably, the electrical resistance of the MNG electrode appeared to be lower than that of the AG electrode at the same density of 1.60 g∙cm−3. Moreover, the tap density appeared to be higher in the MNG sample (1.07 g∙cm−3) than in AG (0.85 g∙cm−3), which is basically due to the spheroidal morphology of MNG. The low inter-particle resistance may lower the barrier for electron transport between active materials. The high tap density and packing density might be beneficial for the high volumetric capacities in the electrode and cell.
Table 2 shows the initial discharge capacities and coulombic efficiencies of AG and MNG electrodes with different densities in the formation cycle. MNG showed a higher reversible capacity than AG, while the initial coulombic efficiency for all samples appeared to be similar. No considerable impact of the electrode density was observed on the electrochemical properties of the initial formation cycles. Notably, the initial coulombic efficiency of MNG was also comparable to that of AG, even though the specific surface area of MNG (3.3 m2 g−1) was larger than that of AG (0.85 m2 g−1). The N2 adsorption and desorption isotherms used for calculating the specific surface area are shown in Figure S2. The high coulombic efficiency of MNG can be attributed to the fact that all surface and internal graphite sheets of the MNG particle were coated with amorphous carbon, as shown in Figure 2b–f.
Figure 4 represents the cycling performance behavior of the AG electrodes with densities of 1.55 and 1.6 g∙cm−3 at 30 and 45 °C. As displayed in this figure, the AG electrode with 1.55 g∙cm−3 showed better capacity retention and higher coulombic efficiency during cycling than the electrode with 1.6 g∙cm−3. The capacity decay of the electrode with 1.6 g∙cm−3 was more significant during cycling at 45 °C. It is known that the major degradation mechanism for cycle aging of the graphite electrode is the continuous growth of the solid electrolyte interface (SEI) layer caused by side reactions between the graphite electrode and the electrolyte, such as electrolyte decomposition and the solvent co-intercalation process, and that these mechanisms are accelerated when cycling at a higher temperature [21,22,23].
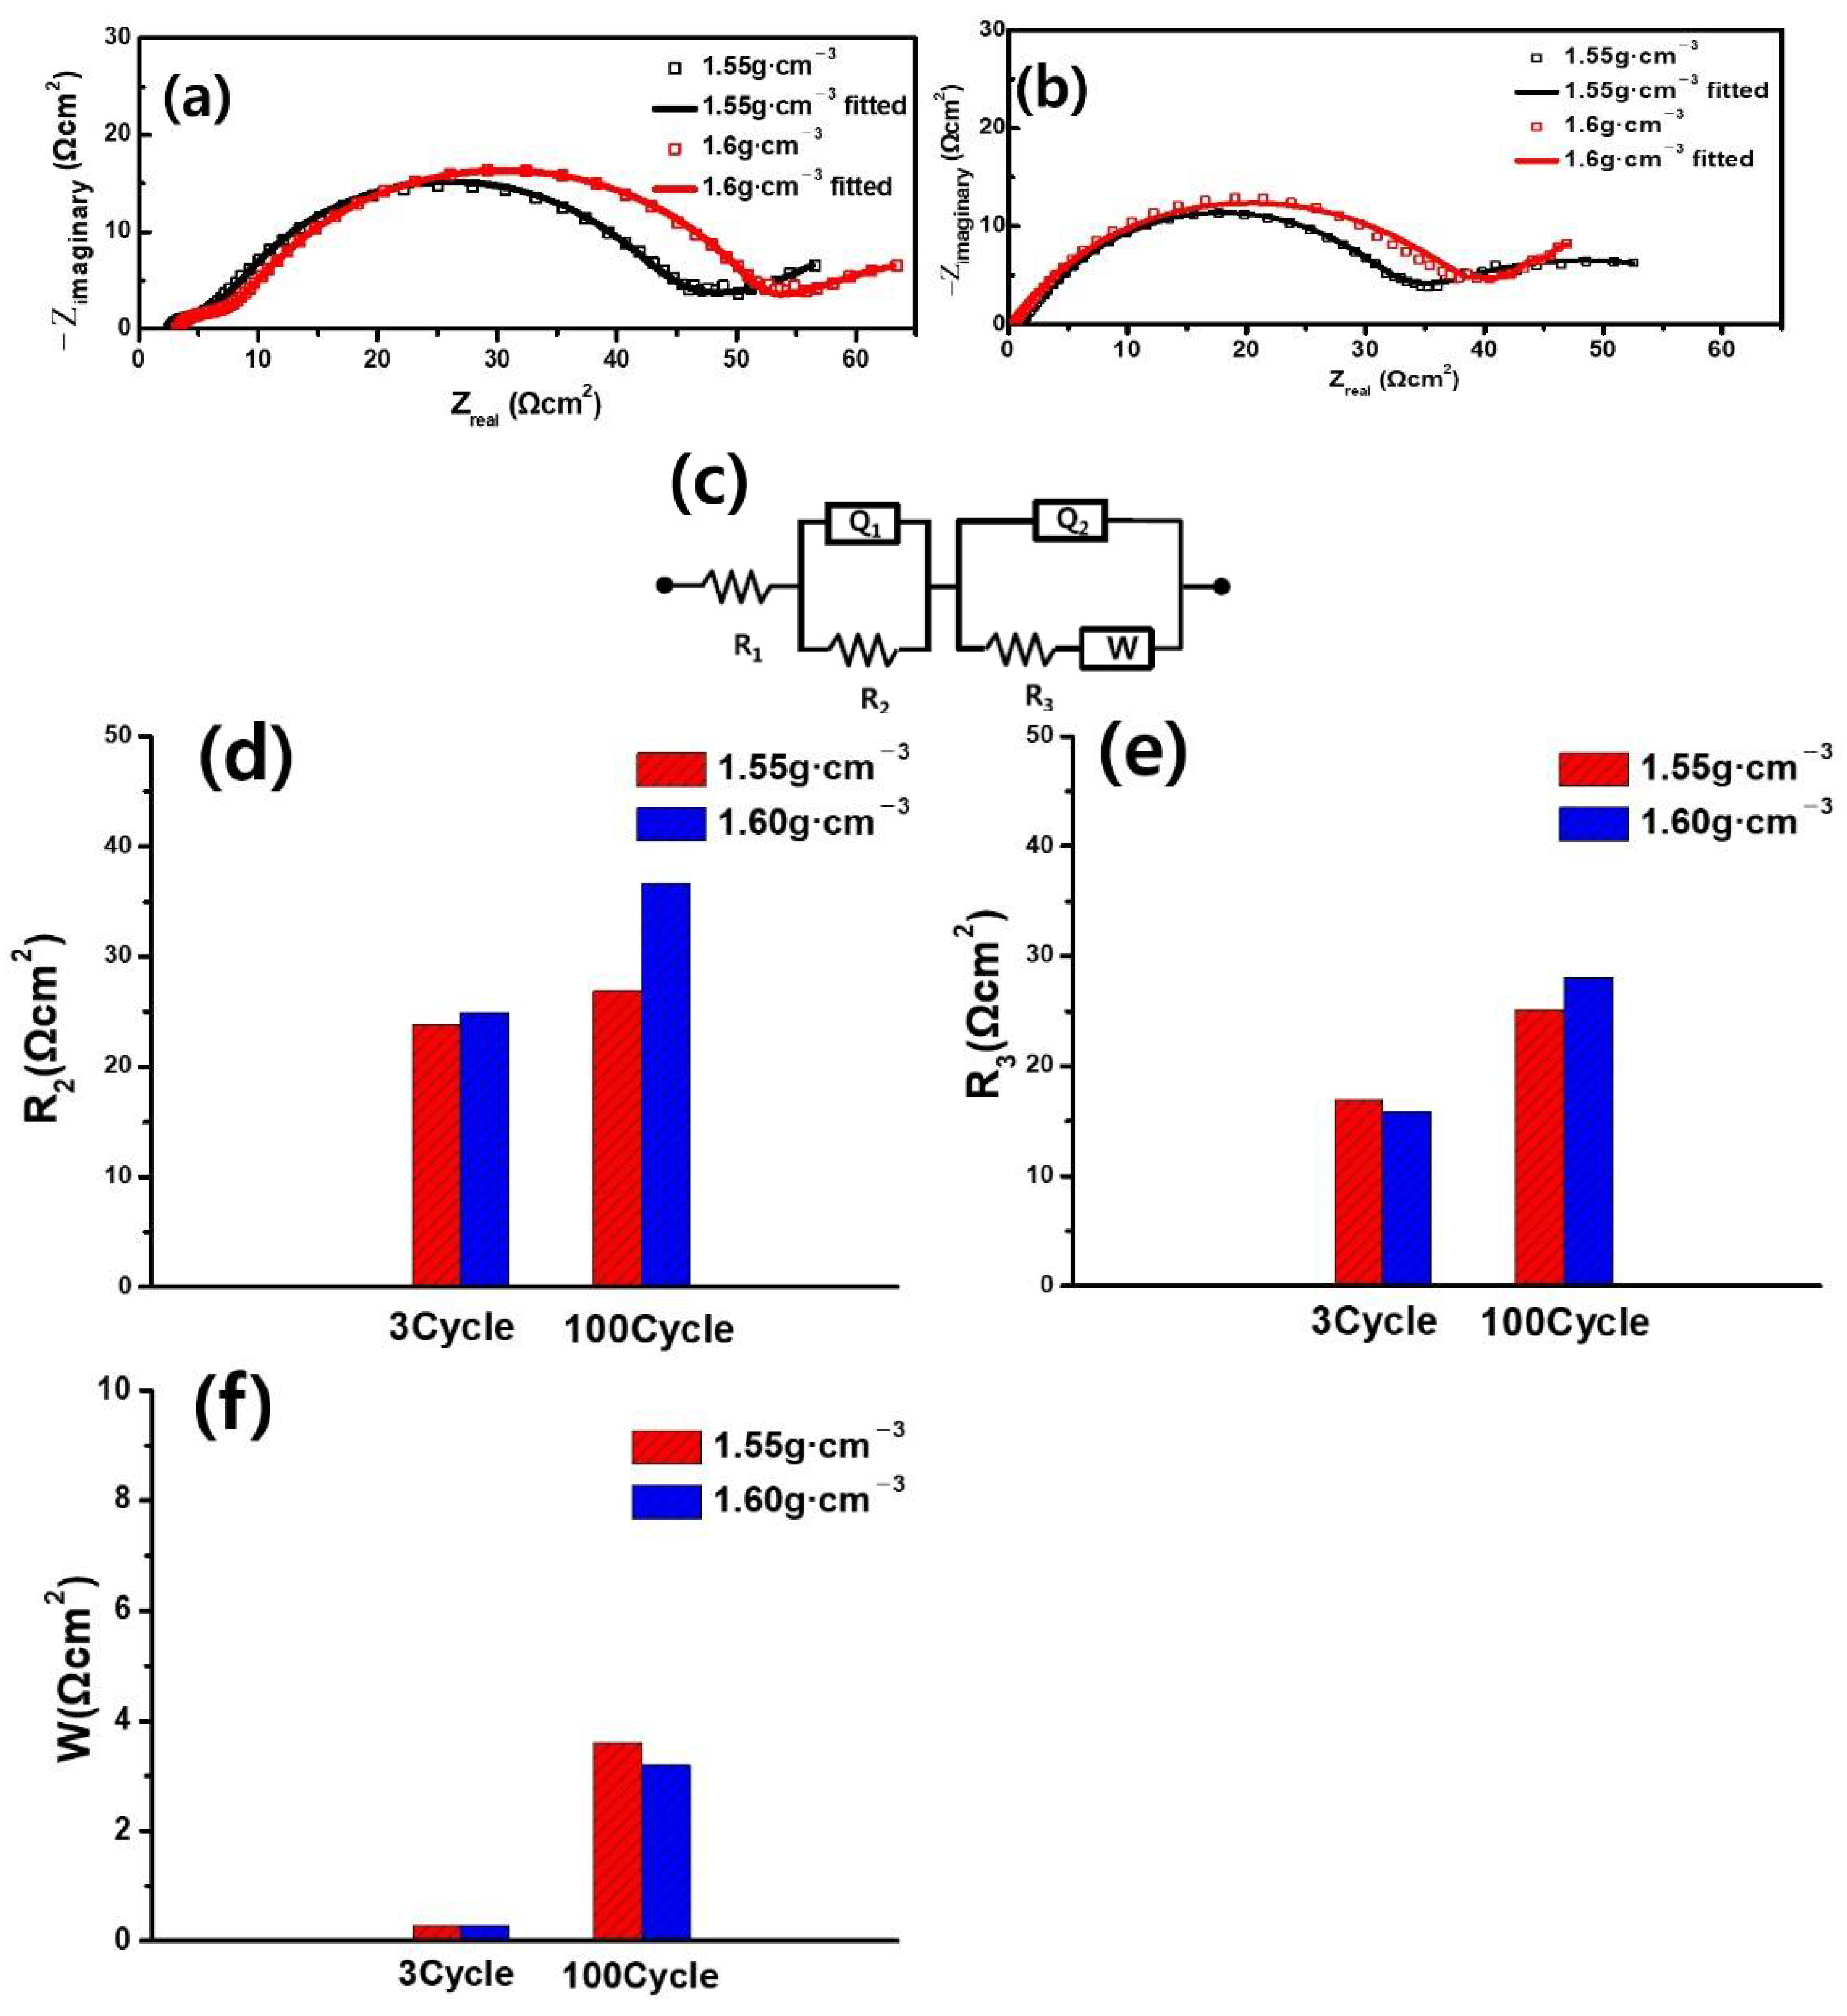
These degradation behaviors are effectively suppressed by carbon coating on graphite [3,5,24]. In view of this, it is assumed that some AG particles are cracked when pressed into higher electrode densities, as inferred from their morphology, i.e., aggregates of small, rigid particles, as shown in Figure 1c, and the AG particles were exposed to electrolytes, which can lead to electrochemical decline during long-term cycling of the AG electrode with 1.60 g∙cm−3, as displayed in Figure 4. This is consistent with the electrochemical impedance spectroscopy (EIS) results. Figure 5a,b shows the impedance response recorded from these two electrodes after formation cycling and after 100 cycles, respectively.
The Nyquist plots show a depressed semicircle, followed by a short, sloping line. In general, the high-frequency semicircle is related to the resistance of the SEI film and the charge transfer resistance, leading to two distinct semicircles, and the linear portion is associated with the diffusion process of lithium ions on the electrode material [25,26,27]. Therefore, in this work, the impedance elements were estimated by fitting the experimental impedance data using the proposed equivalent circuit model (Figure 5c), in which R1, R2, R3, and W1 are the bulk resistance of the cell and the resistance of the SEI film, with the charge-transfer resistance and the Warburg impedance arising from the diffusional effect of lithium ions on the electrode material, respectively. The computed resistances R2 and R3 of the AG electrodes with densities of 1.55 and 1.6 g∙cm−3 after 3 and 100 cycles are plotted in Figure 5d,e. Both R2 and R3 increased with the cycle number more in the 1.6 g∙cm−3 electrode than in the 1.55 g∙cm−3 electrode. This observation suggests that the electrolyte decomposition to form the SEI film during charge/discharge cycling is more significant in 1.6 g∙cm−3 electrodes than in 1.55 g∙cm−3, resulting in an increase in the charge-transfer resistance.
On the other hand, in contrast to the three-cycle electrodes, the 100-cycle electrodes showed a small semi-circle at high frequency (Figure 5b). This may be attributed to a change in the structure and composition of the SEI film caused by long-term cycling. However, at this point, the reason is not clear.
The cycling performance of MNG electrodes with densities of 1.6 and 1.7 g∙cm−3 at 30 and 45 °C is shown in Figure S3. In the case of MNG, the performance of the electrode with 1.7 g∙cm−3 appeared to be comparable to that of the electrode with 1.6 g∙cm−3, although the electrode with 1.6 g∙cm−3 showed better performance than the electrode with 1.7 g∙cm−3. EIS results (Figure S4) and resistances obtained by fitting analysis (Figure S5) revealed that the charge-transfer resistance R3 was smaller for the 1.7 g∙cm−3 electrode than the 1.6 g∙cm−3 electrode. This can be attributed to the lower electrical resistance in the 1.7 g∙cm−3 electrode, as shown in Table 1.
For a direct comparison of AG and MNG samples, both electrodes of AG with a density of 1.55 g∙cm−3, and those of MNG with a density of 1.6 g∙cm−3, were used. Figure 6 shows the cycling behavior and coulombic efficiency of AG and MNG at 30 and 45 °C, in which that of a commercial CNG electrode with a density of 1.6 g∙cm−3, for comparison, is also displayed. Both AG and MNG showed stable cycle performance at 30 and 45 °C, which was superior to that of the CNG electrode. There was no significant difference in cycling stability and coulombic efficiency during cycling between the AG and MNG samples.
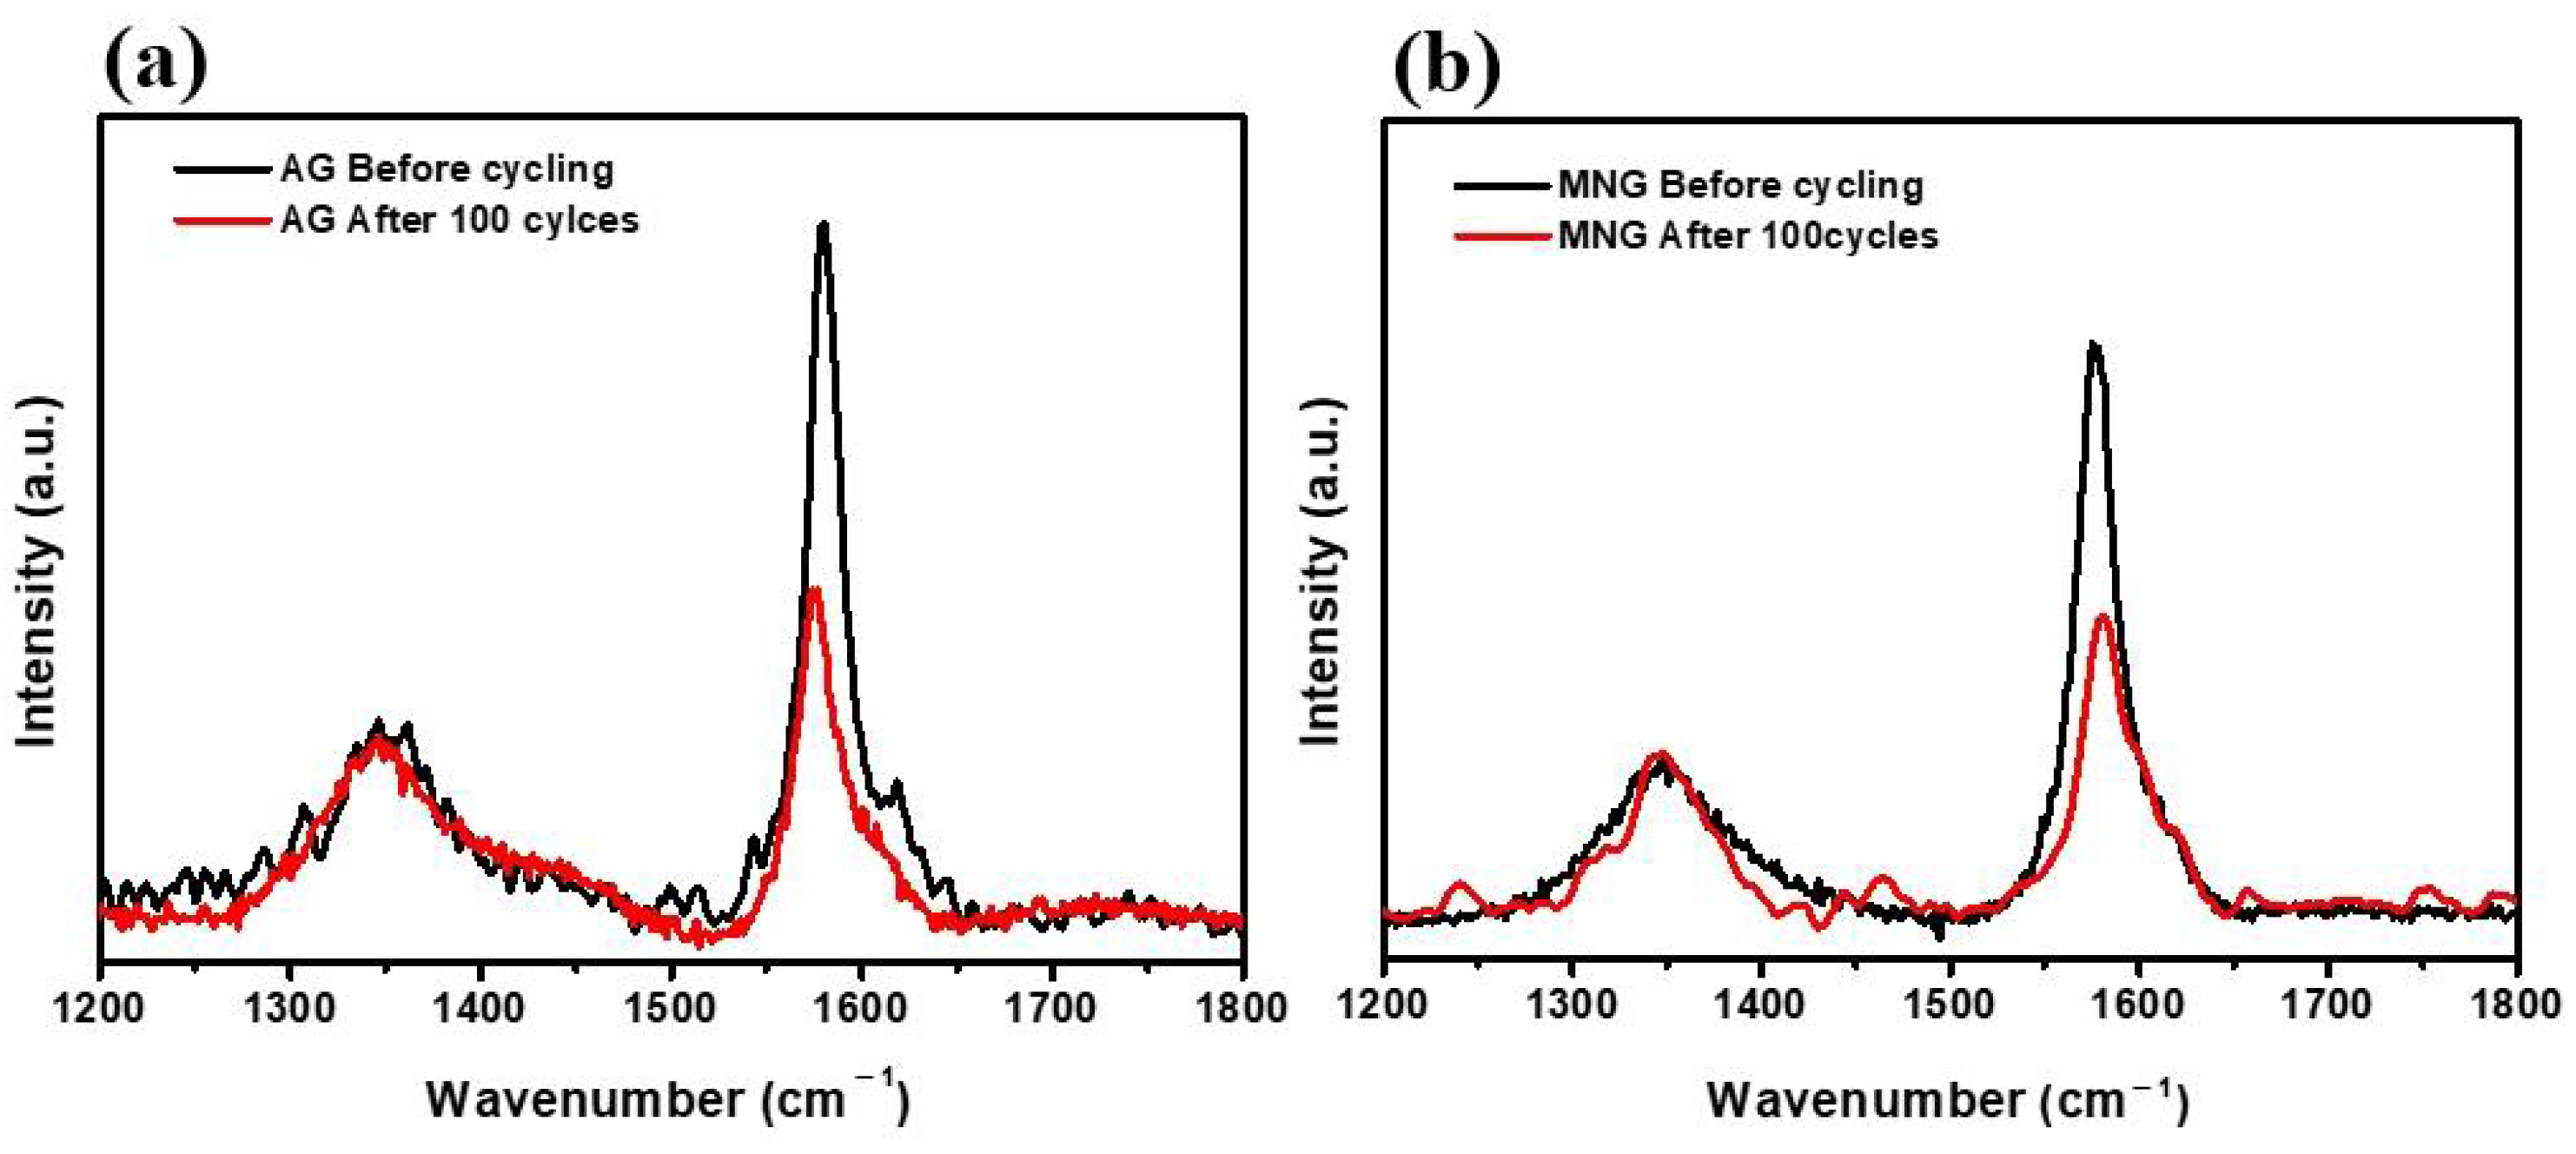
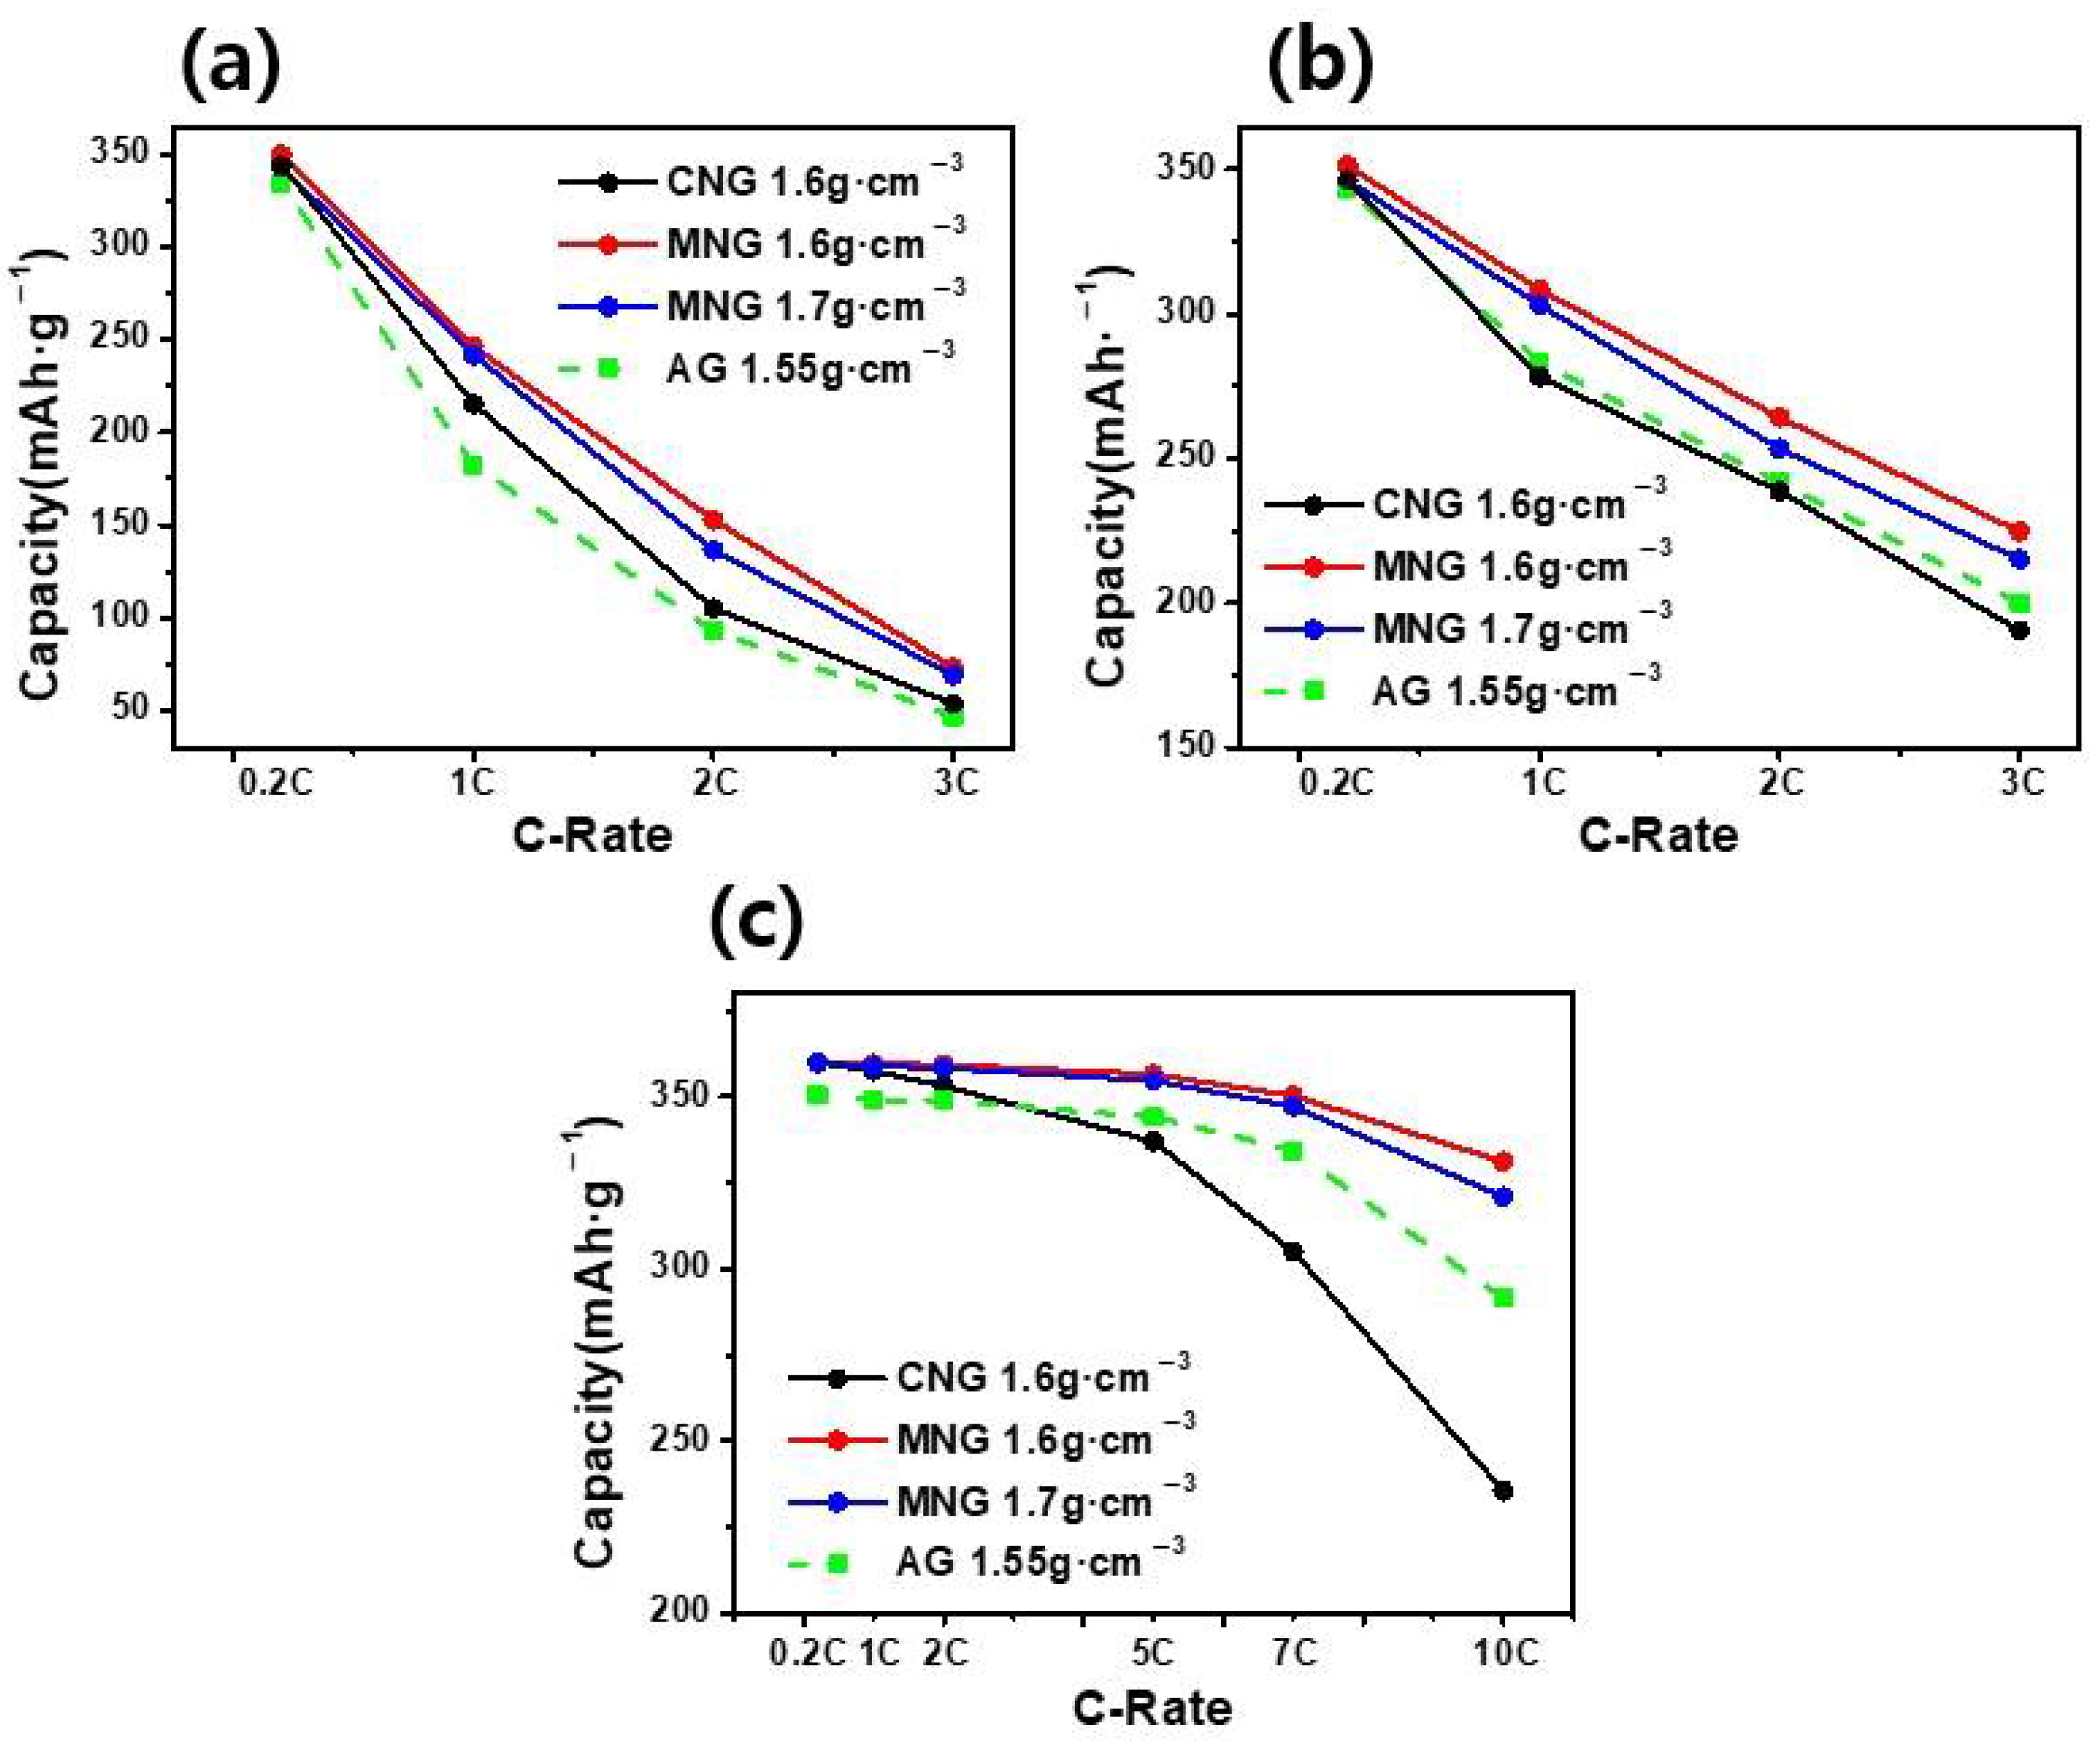
To obtain information on the structural changes in AG and MNG electrodes during cycling, Raman spectroscopy analysis was done. Figure 7 shows the Raman spectra of the AG and MNG electrodes before cycling and after 100 cycles. Two intense peaks were observed at 1580 and 1340 cm−1, corresponding to the G and D bands. The intensity ratio of the D band and G band (ID/IG) is generally used to evaluate the structural characteristics of carbon materials [28]. The ID/IG values of the AG and MNG electrodes increased after cycling, indicating that structural disordering proceeded in both electrodes with cycling. However, the percentage of increase appeared to be similar: 48.2% and 49.1% for AG and MNG electrodes, respectively. This was consistent with the cycling performance of AG and MNG electrodes, as shown in Figure 6. On the other hand, it appears that the charge/discharge rate performance of the MNG electrode was better than that of the AG one, as shown in Figure 8. It is worth pointing out that the density of the AG electrode (1.55 g∙cm−3) was lower than that of the MNG electrode (1.6 g∙cm−3), and the MNG electrode with 1.7 g∙cm−3 also exhibited a comparable rate capability to that of the MNG with 1.6 g∙cm−3. To achieve good rate capability, in general, the electrode should allow fast charge transfer at the electrode/electrolyte interface and fast Li-ion transport across the pore, filled with the electrolyte in the electrode [12,29,30]. Considering that the latter could be limited in highly pressed electrodes due to a decrease in porosity, it is noticeable that the MNG showed good rate performance, even for an electrode with a high density of 1.7 g∙cm−3.
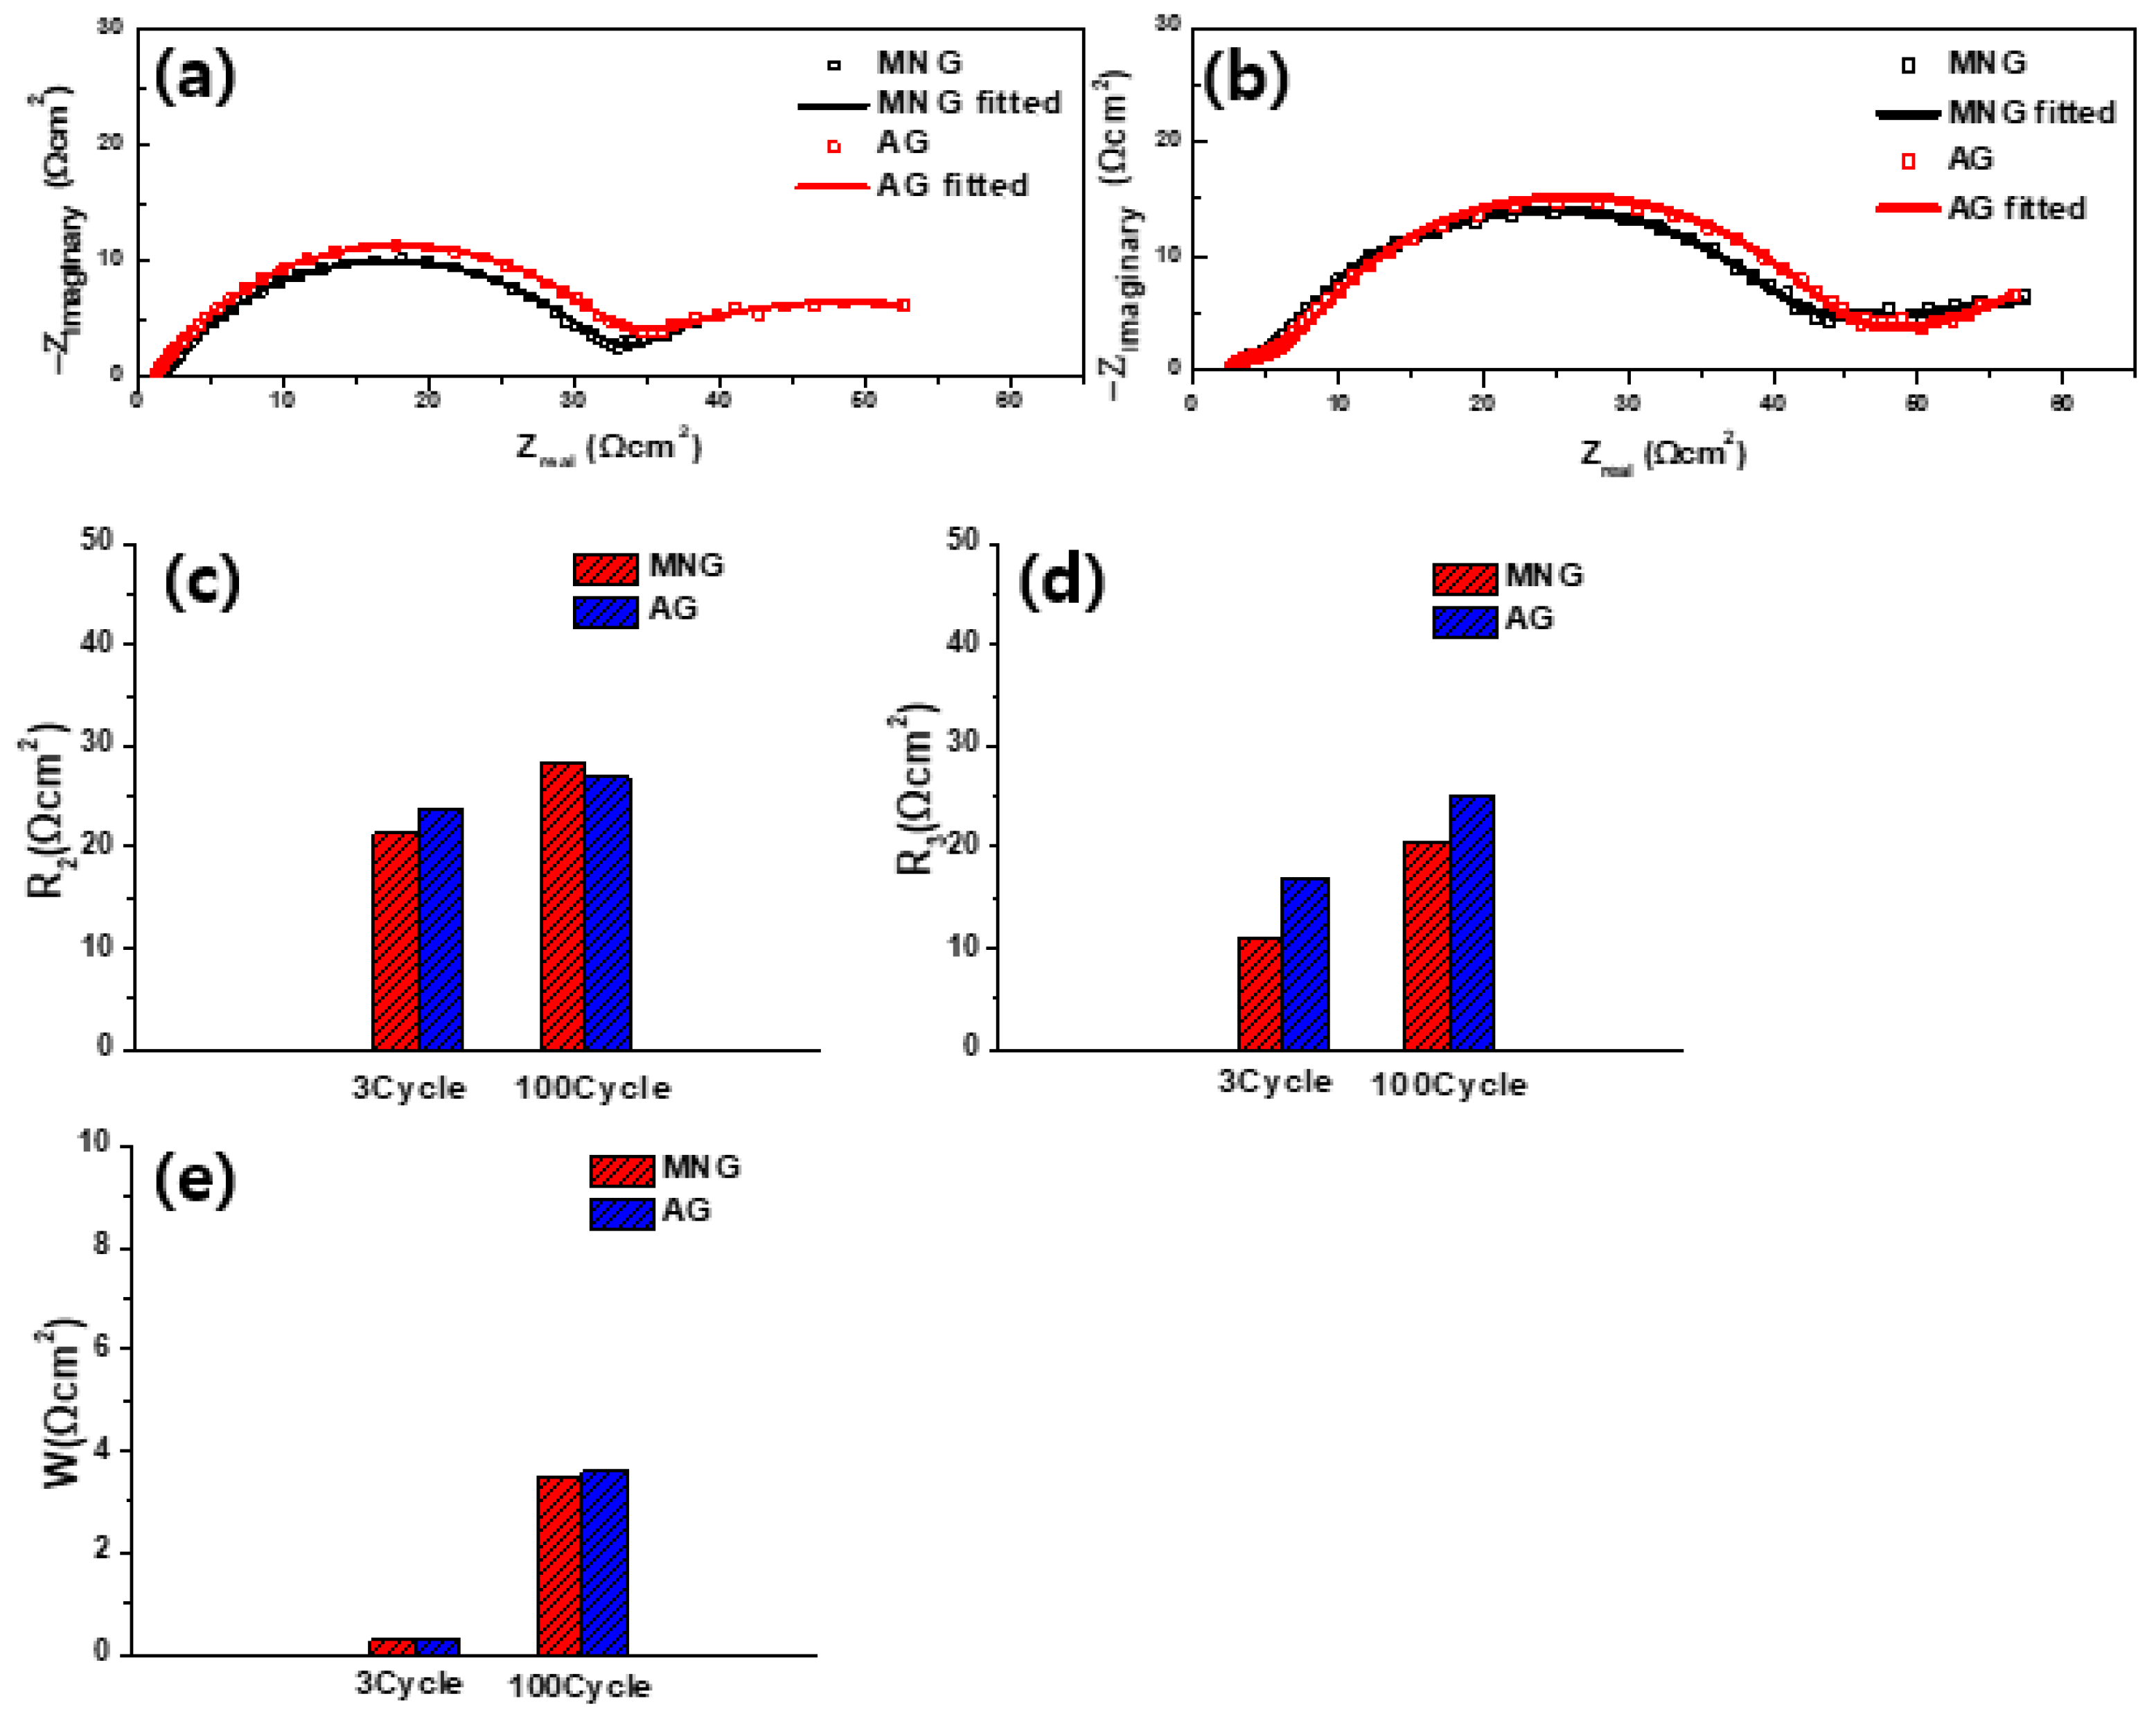
The Nyquist plots of the MNG electrode with a density of 1.6 g∙cm−3 and the AG electrode with a density of 1.55 g∙cm−3 at 3 and 100 cycles are compared in Figure 9a,b. The impedance components obtained by fitting to an equivalent circuit (Figure 5c) are displayed in Figure 9c,d. The resistance of both the electrodes increased with the cycle number. In particular, it can be seen that the charge-transfer resistance was smaller for the MNG electrode than for the AG electrode. This might be attributed to the higher electric conductivity in the MNG electrode, as presented in Table 1. Furthermore, the stage transition reaction at charging rates above 1.0 C was more significantly limited in the AG electrode compared to the MNG electrode, owing to its higher charge-transfer over-potential, as illustrated in Figure S6.
To better understand the electrochemical properties of AG and MNG, the diffusion coefficient of Li-ion for the electrodes was estimated by the impedance spectroscopy technique [31]. The diffusion coefficient was calculated by the impedance spectroscopy method from the impedance data (Figure 5a,b and Figure 9a,b). The calculated diffusion coefficients are listed in Table 3. For both samples of AG and MNG, the value of diffusivity in the three-cycle electrodes was higher compared that of the 100-cycle electrodes. This may be due to the lattice disordering caused by the repeated intercalation/de-intercalation cycling process, as represented in the Raman spectroscopy analysis of Figure 7. At the same electrode density of 1.6 g∙cm−3, the AG electrode had a higher diffusivity value than the MNG electrode.
Considering the superior rate capability of MNG electrodes mentioned above, this indicates that the rate performance was dominated by the charge-transfer process.
On the other hand, since electrode swelling hinders the increase in the volumetric energy density of LiBs, it is important to investigate the dilation behavior of graphite anodes, especially the electrochemical swelling caused by the electrochemical cycling of the electrodes. It is known that electrochemical swelling is related to a reversible volume change in graphite electrodes during Li-ion intercalation/de-intercalation and an irreversible volume change due to SEI film formation [30,32,33,34,35]. During the cycling of electrodes, it is known that the electrochemical swelling of graphite electrodes is related to a reversible volume change in graphite during charge/discharge reactions and an irreversible volume change due to SEI film formation [32,33,34,35,36].
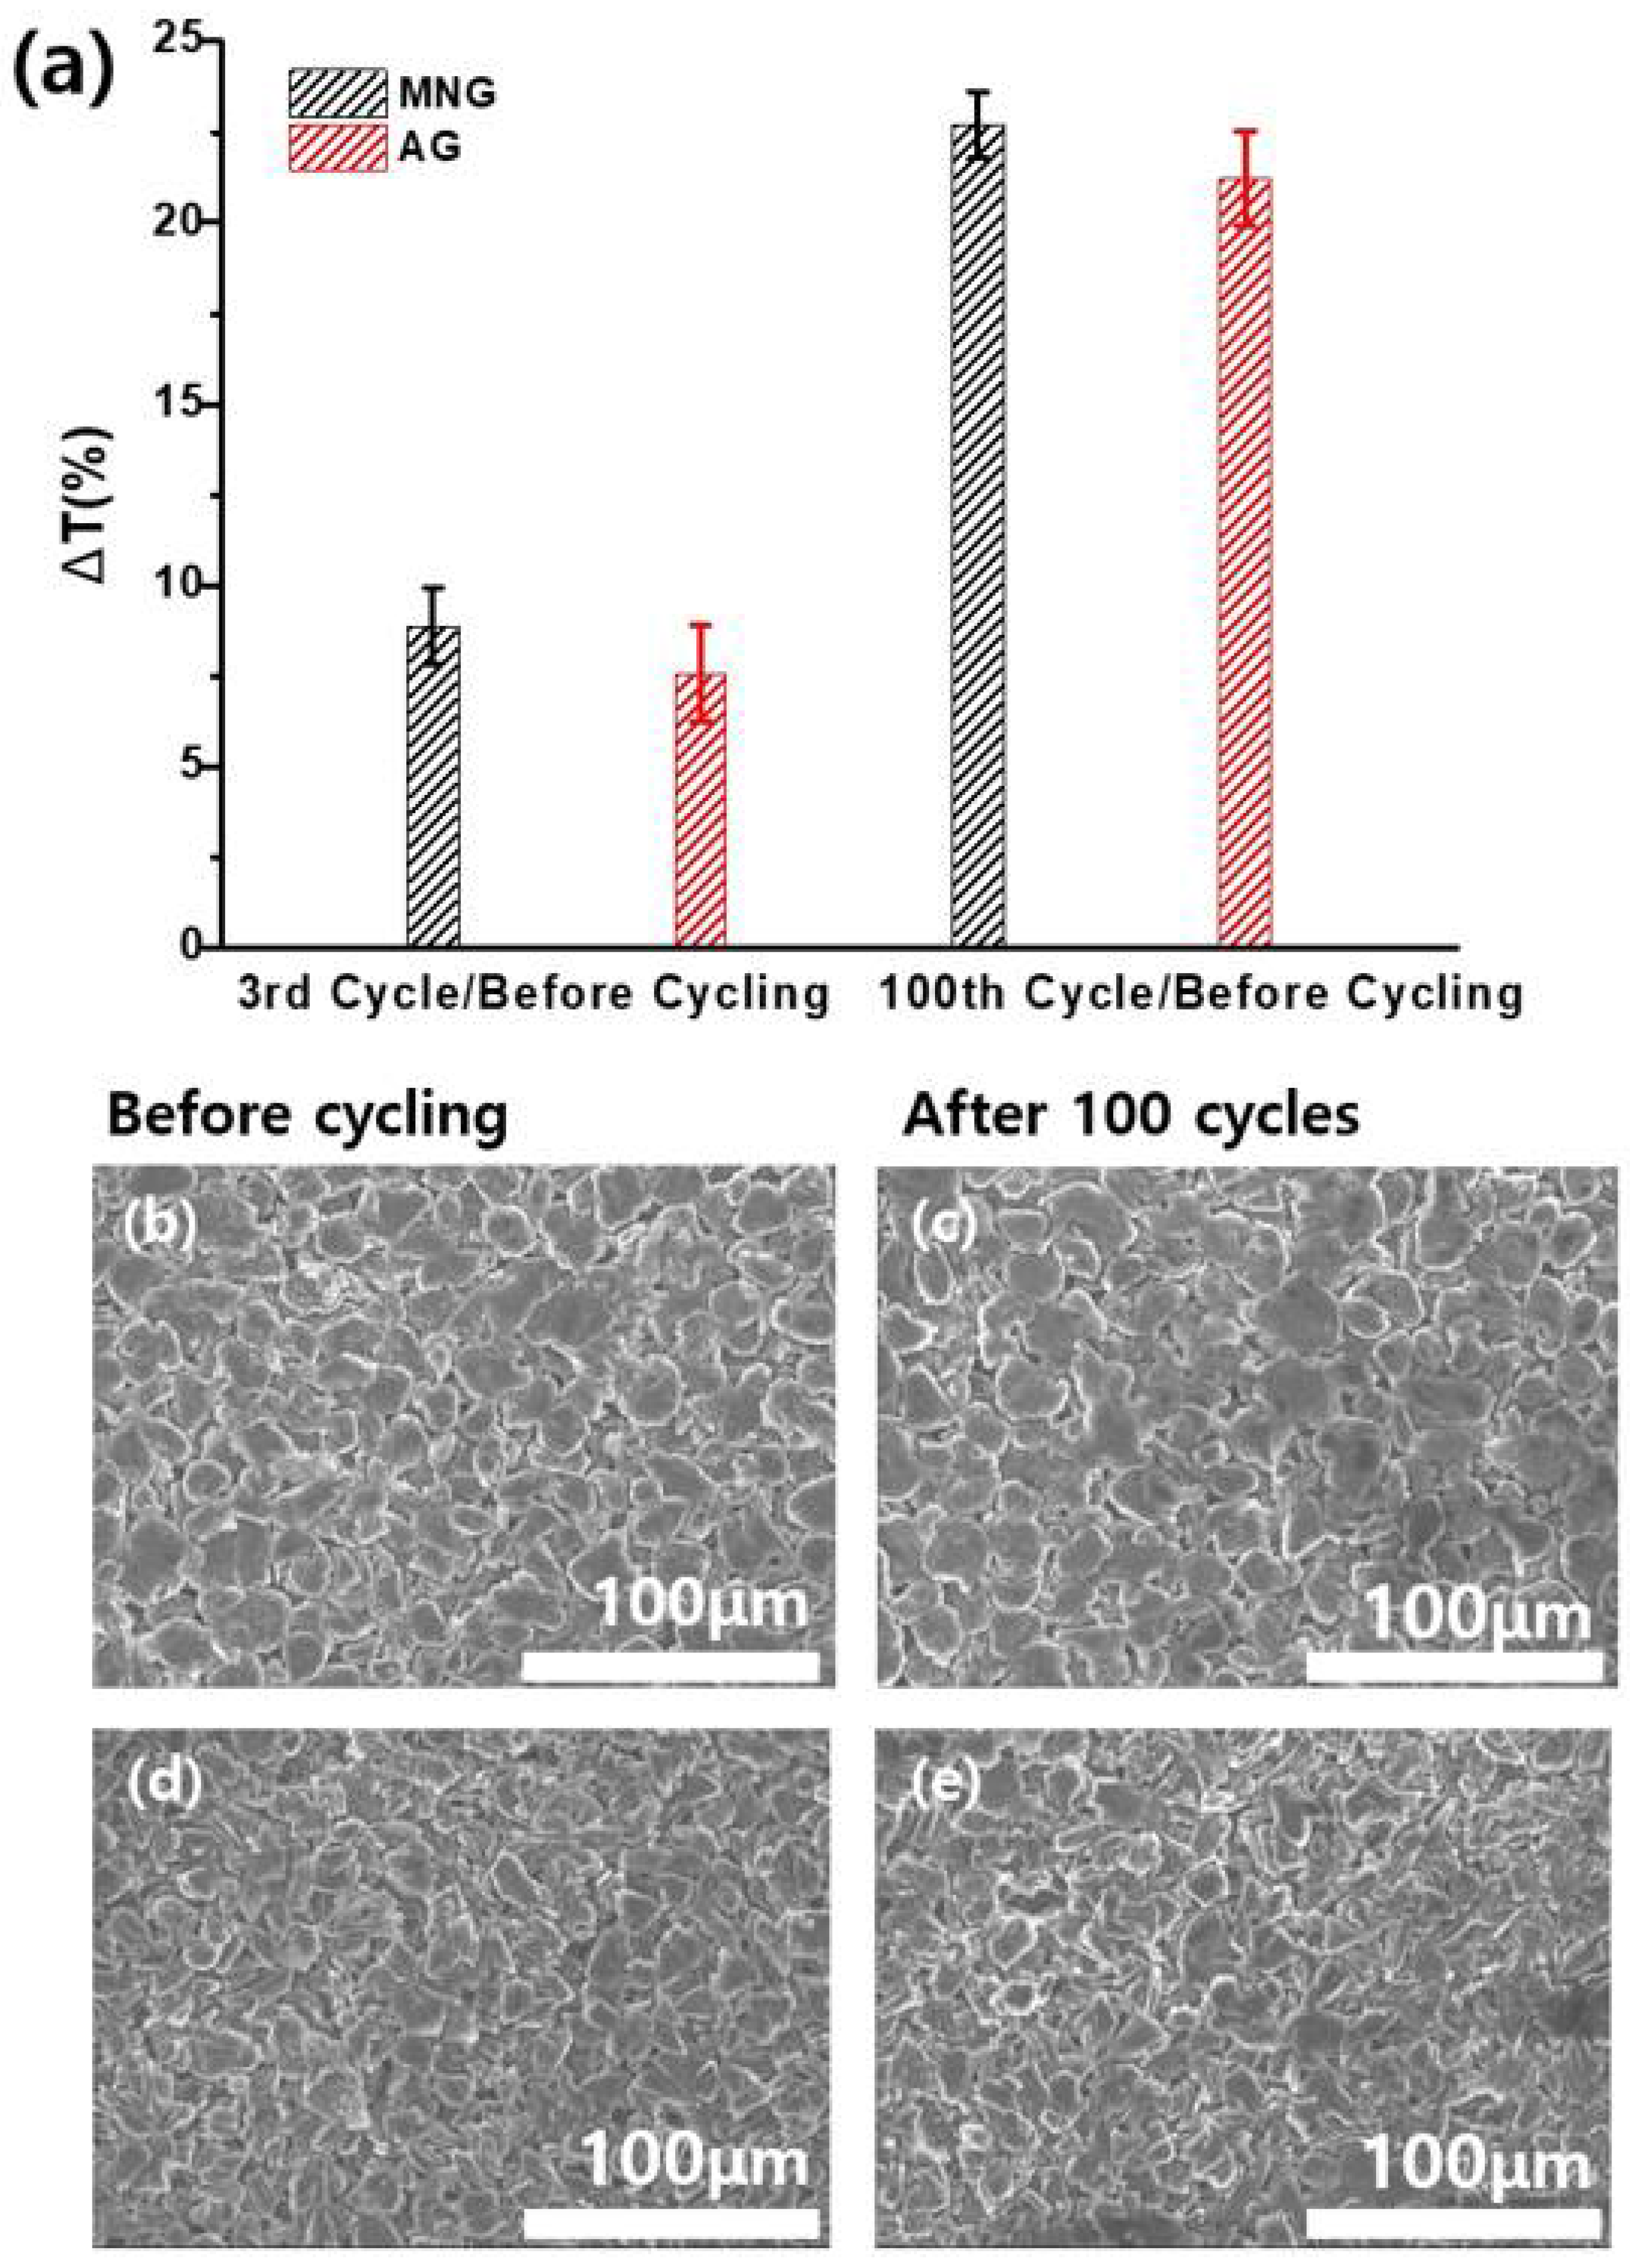
Figure 10 shows the swelling ratio (the change in thickness after cycling/thickness before cycling × 100 (%)) values measured for intercalated and de-intercalated electrodes after 100 cycles at a 0.5 C rate. After 100 cycles, the swelling ratio values of the AG (1.55 g∙cm−3) and MNG (1.6 g∙cm−3) electrodes were close to each other for both the intercalated and de-intercalated states. Considering the fact that commercial CNG suffers from significant swelling due to the additional formation and growth of an SEI film during prolonged cycling [4], it appears that the electrolyte decomposition required to form the SEI film during cycling was effectively suppressed in the MNG and AG electrodes. This is supported by the high coulombic efficiency of MNG and AG during cycling, as shown in Figure 6.

4. Conclusions

MNG powders are successfully synthesized by using a mixture of coal pitch and petroleum pitch as a carbon precursor for a modified carbon coating. Coal pitch and petroleum pitch are very attractive as raw materials due to their low cost and abundance, which is important for their commercial use as negative electrode materials.
The electrochemical performance of MNG and AG anodes was investigated as a function of electrode density ranging from 1.55 to 1.7 g∙cm−3. The best performance was obtained at 1.55 and 1.60 g∙cm−3 for AG and MNG electrodes, respectively. In the case of MNG, comparable performance was achieved even at an electrode density of 1.7 g∙cm−3. Both AG (1.55 g∙cm−3) and MNG (1.60 g∙cm−3) electrodes showed quite similar performance with regard to cycling stability and coulombic efficiency during charge/discharge cycling at 30 and 45 °C, while the MNG electrodes (1.60 and 1.7 g∙cm−3) showed better rate performance than the AG electrode (1.55 g∙cm−3). The superior rate capability of MNG electrodes may be explained by the following aspects: first, their spherical morphology and higher electrode density lead to enhanced electrical conductivity. Second, in the case of the MNG sample, a favorable electrode tortuosity may be still retained and thus Li+ transport in the electrode pore is not significantly affected even at the high electrode densities of 1.60 and 1.7 g∙cm−3. Additionally, MNG electrodes exhibit a similar electrochemical swelling behavior to AG electrodes.

Supplementary Materials

The following are available online at https://www.mdpi.com/article/10.3390/en14071946/s1, Figure S1: SEM images of electrode surface with different density (a) 1.6 g∙cm−3 MNG and (b) 1.7 g∙cm−3 MNG and (c) 1.55 g∙cm−3 AG and (d) 1.6 g∙cm−3 AG, Figure S2: The N2 adsorption and desorption curves of (a) MNG, (b) AG, Figure S3: Comparison of cycling performance behavior of modified spherical natural graphite (MNG) electrode with different electrode density at (a,b) 30 °C and (c,d) 45 °C, Figure S4: Nyquist plots of (a) after 3 cycling MNG electrode and (b) after 100 cycling MNG electrode at different electrode density, Figure S5: Comparison of (a) film resistance (R2), (b) charge-transfer resistance (R3), and (c) warburg resistance(W) of MNG electrodes with different electrode density after 3 and 100 cycles, Figure S6: Staging transition reaction at different charge rate of modified spherical natural graphite (MNG) with 1.6 g∙cm−3 electrode density and artificial graphite (AG) with 1.55 g∙cm−3 electrode density.

Author Contributions

Conceptualization, S.-W.W. and Y.-J.L.; investigation, H.-J.K.; resources, S.-W.W. and Y.-J.L.; data curation, H.-J.K. and S.-M.L.; writing—original draft preparation, H.-J.K.; writing—review and editing, S.-M.L.; visualization, H.-J.K.; supervision, S.-M.L.; funding acquisition, J.-Y.K. All authors have read and agreed to the published version of the manuscript.

Funding

This research received no external funding.

Institutional Review Board Statement

Not applicable.

Informed Consent Statement

Not applicable.

Data Availability Statement

Not applicable.

Acknowledgments

This study was supported by LG Energy Solution.

Conflicts of Interest

The authors declare no conflict of interest.

References

  1. Endo, M.; Kim, C.; Nishimura, K.; Fujino, T.; Miyashita, K. Recent development of carbon materials for Li ion batteries. Carbon 2000, 38, 183–197. [Google Scholar] [CrossRef]
  2. Shim, J.; Striebel, K.A. Cycling performance of low-cost lithium ion batteries with natural graphite and LiFePO. J. Power Sources 2003, 119–121, 955–958. [Google Scholar] [CrossRef] [Green Version]
  3. Yoshio, M.; Wang, H.; Fukuda, K. Spherical Carbon-Coated Natural Graphite as a Lithium-Ion Battery-Anode Material. Angew. Chem. Int. Ed. 2003, 42, 4203–4206. [Google Scholar] [CrossRef] [PubMed]
  4. Park, Y.-S.; Lee, T.-W.; Shin, M.-S.; Lim, S.-H.; Lee, S.-M. Modification for Improving the Electrochemical Performance of Spherically-Shaped Natural Graphite as Anode Material for Lithium-Ion batteries. J. Electrochem. Soc. 2016, 163, A3078–A3086. [Google Scholar] [CrossRef]
  5. Yoshio, M.; Wang, H.; Fukuda, K.; Hara, Y.; Adachi, Y. Effect of Carbon Coating on Electrochemical Performance of Treated Natural Graphite as Lithium-Ion Battery Anode Material. J. Electrochem. Soc. 2000, 147, 1245–1250. [Google Scholar] [CrossRef]
  6. Glazier, S.L.; Li, J.; Louli, A.J.; Allen, J.P.; Dahn, J.R. An Analysis of Artificial and Natural Graphite in Lithium Ion Pouch Cells Using Ultra-High Precision Coulometry, Isothermal Microcalorimetry, Gas Evolution, Long Term Cycling and Pressure Measurements. J. Electrochem. Soc. 2017, 164, A3545–A3555. [Google Scholar] [CrossRef]
  7. Yoshio, M.; Wang, H.; Fukuda, K.; Umeno, T.; Abe, T.; Ogumi, Z. Improvement of natural graphite as a lithium-ion battery anode material, from raw flake to carbon-coated sphere Electronic supplementary information (ESI). Colour versions of Figs. 6, 8. J. Mater. Chem. 2004, 14, 1754–1758. Available online: http://www.rsc.org/suppdata/jm/b3/b316702j/ (accessed on 12 February 2021). [CrossRef]
  8. Yoshio, M.; Wang, H.; Fukuda, K. Spherical Carbon-Coated Natural Graphite as a Lithium-Ion Battery-Anode Material. Angew. Chem. 2003, 115, 4335–4338. [Google Scholar] [CrossRef]
  9. Zaghib, K.; Song, X.; Guerfi, A.; Kostecki, R.; Kinoshita, K. Effect of particle morphology on lithium intercalation rates in natural graphite. J. Power Sources 2003, 124, 505–512. [Google Scholar] [CrossRef]
  10. Zhang, H.L.; Li, F.; Liu, C.; Tan, J.; Cheng, H.M. New Insight into Solid Electrolyte Interphase with Use of a Focused Ion Beam. J. Phys. Chem. B. 2005, 109, 22205–22211. [Google Scholar] [CrossRef] [PubMed]
  11. Striebel, K.A.; Sierra, A.; Shim, J.; Wang, C.-W.; Sastry, A.M. The Effect of Compression on Natural Graphite Anode Performance and Matrix Conductivity. J. Power Sources 2004, 134, 241–251. [Google Scholar] [CrossRef] [Green Version]
  12. Wang, C.-W.; Yi, Y.-B.; Sastry, A.M.; Shim, J.; Striebel, K.A. Particle Compression and Conductivity in Li-Ion Anodes with Graphite Additives. J. Electrochem. Soc. 2004, 151, 1489–1498. [Google Scholar] [CrossRef]
  13. Kuribayashi, I.; Yokoyama, M.; Yamashita, M. Battery characteristics with various carbonaceous materials. J. Power Sources 1995, 54, 1–5. [Google Scholar] [CrossRef]
  14. Wang, H.; Yoshio, M. Carbon-coated natural graphite prepared by thermal vapor decomposition process, a candidate anode material for lithium-ion battery. J. Power Sources 2001, 93, 123–129. [Google Scholar] [CrossRef]
  15. Yoon, S.; Kim, H.; Oh, S.M. Surface modification of graphite by coke coating for reduction of initial irreversible capacity in lithium secondary batteries. J. Power Sources 2001, 94, 68–73. [Google Scholar] [CrossRef]
  16. Zhang, H.L.; Liu, S.H.; Li, F.; Bai, S.; Liu, C.; Tan, J.; Cheng, H.M. Electrochemical performance of pyrolytic carbon-coated natural graphite spheres. Carbon 2006, 44, 2212–2218. [Google Scholar] [CrossRef]
  17. Zhang, H.L.; Li, F.; Liu, C.; Cheng, H.M. Poly(vinyl chloride) (PVC) Coated Idea Revisited: Influence of Carbonization Procedures on PVC-Coated Natural Graphite as Anode Materials for Lithium Ion Batteries. J. Phys. Chem. C. 2008, 112, 7767–7772. [Google Scholar] [CrossRef]
  18. Wu, Y.S.; Wang, Y.H.; Lee, Y.H. Performance enhancement of spherical natural graphite by phenol resin in lithium ion batteries. J. Alloys Compd. 2006, 426, 218–222. [Google Scholar] [CrossRef]
  19. Wang, H.; Umeno, T.; Mizuma, K.; Yoshio, M. Highly conductive bridges between graphite spheres to improve the cycle performance of a graphite anode in lithium-ion batteries. J. Power Sources 2008, 175, 886–890. [Google Scholar] [CrossRef]
  20. Park, Y.S.; Oh, E.S.; Lee, S.M. Effect of polymeric binder type on the thermal stability and tolerance to roll-pressing of spherical natural graphite anodes for Li-ion batteries. J. Power Sources 2014, 248, 1191–1196. [Google Scholar] [CrossRef]
  21. Waldmann, T.; Wilka, M.; Kasper, M.; Fleischhammer, M.; Wohlfahrt-Mehrens, M. Temperature dependent ageing mechanisms in Lithium-ion batteries—A Post-Mortem study. J. Power Sources 2014, 262, 129–135. [Google Scholar] [CrossRef]
  22. Van Schalkwijk, W.; Scrosati, B. Advances in Lithium-Ion Batteries; Springer Publishing Company: New York, NY, USA, 2002; pp. 47–68. [Google Scholar]
  23. Agubra, V.; Fergus, J. Lithium Ion Battery Anode Aging Mechanisms. Materials 2013, 6, 1310–1325. [Google Scholar] [CrossRef] [Green Version]
  24. Lee, H.-Y.; Baek, J.-K.; Lee, S.-M.; Park, H.-K.; Lee, K.-Y.; Kim, M.-H. Effect of carbon coating on elevated temperature performance of graphite as lithium-ion battery anode material. J. Power Sources 2004, 128, 61–66. [Google Scholar] [CrossRef]
  25. Barsoukov, E.; Kim, J.H.; Yoon, C.H.; Lee, H. Effect of Low-Temperature Conditions on Passive Layer Growth on Li Intercalation Materials: In Situ Impedance Study. J. Electrochem. Soc. 1998, 145, 2711–2717. [Google Scholar] [CrossRef]
  26. Piao, T.; Park, S.M.; Doh, C.H.; Moon, S.I. Intercalation of Lithium Ions into Graphite Electrodes Studied by AC Impedance Measurements. J. Electrochem. Soc. 1999, 146, 2794–2798. [Google Scholar] [CrossRef] [Green Version]
  27. Zhang, S.; Ding, M.S.; Xu, K.; Allen, J.; Jow, T.R. Understanding Solid Electrolyte Interface Film Formation on Graphite Electrodes. Electrochem. Solid-state Lett. 2001, 4, A206–A208. [Google Scholar] [CrossRef]
  28. Tuinstra, F.; Koenig, J.L. Raman Spectrum of Graphite. J. Chem. Phys. 1970, 53, 1126–1130. [Google Scholar] [CrossRef] [Green Version]
  29. Buqa, H.; Goers, D.; Holzapfel, M.; Spahr, M.E.; Novák, P. High Rate Capability of Graphite Negative Electrodes for Lithium-Ion Batteries. J. Electrochem. Soc. 2005, 152, A474–A481. [Google Scholar] [CrossRef]
  30. Malifarge, S.; Delobel, B.; Delacourt, C. Experimental and Modeling Analysis of Graphite Electrodes with Various Thicknesses and Porosities for High-Energy-Density Li-Ion Batteries. J. Electrochem. Soc. 2018, 165, A1275–A1287. [Google Scholar] [CrossRef]
  31. Habte, B.T.; Jiang, F. Effect of microstructure morphology on Li-ion battery graphite anode performance: Electrochemical impedance spectroscopy modeling and analysis. Solid State Ionics 2018, 314, 81–91. [Google Scholar] [CrossRef]
  32. Zhang, N.; Tang, H. Dissecting anode swelling in commercial lithium-ion batteries. J. Power Sources 2012, 218, 52–55. [Google Scholar] [CrossRef]
  33. Mickelson, L.; Castro, H.; Switzer, E.; Friesen, C. Bulk Stress Evolution during Intercalation of Lithium in Graphite. J. Electrochem. Soc. 2014, 161, A2121–A2127. [Google Scholar] [CrossRef]
  34. Ohzuku, T.; Matoba, N.; Sawai, K. Direct evidence on anomalous expansion of graphite-negative electrodes on first charge by dilatometry. J. Power Sources 2001, 97–98, 73–77. [Google Scholar] [CrossRef]
  35. Lee, J.H.; Lee, H.M.; Ahn, S. Battery dimensional changes occurring during charge/discharge cycles-thin rectangular lithium ion and polymer cells. J. Power Sources 2003, 119–121, 833–837. [Google Scholar] [CrossRef]
  36. Harris, S.J.; Deshpande, R.D.; Qi, Y.; Dutta, I.; Cheng, Y.T. Mesopores inside electrode particles can change the Li-ion transport mechanism and diffusion-induced stress. J. Mater. Res. 2010, 25, 1433–1440. [Google Scholar] [CrossRef] [Green Version]
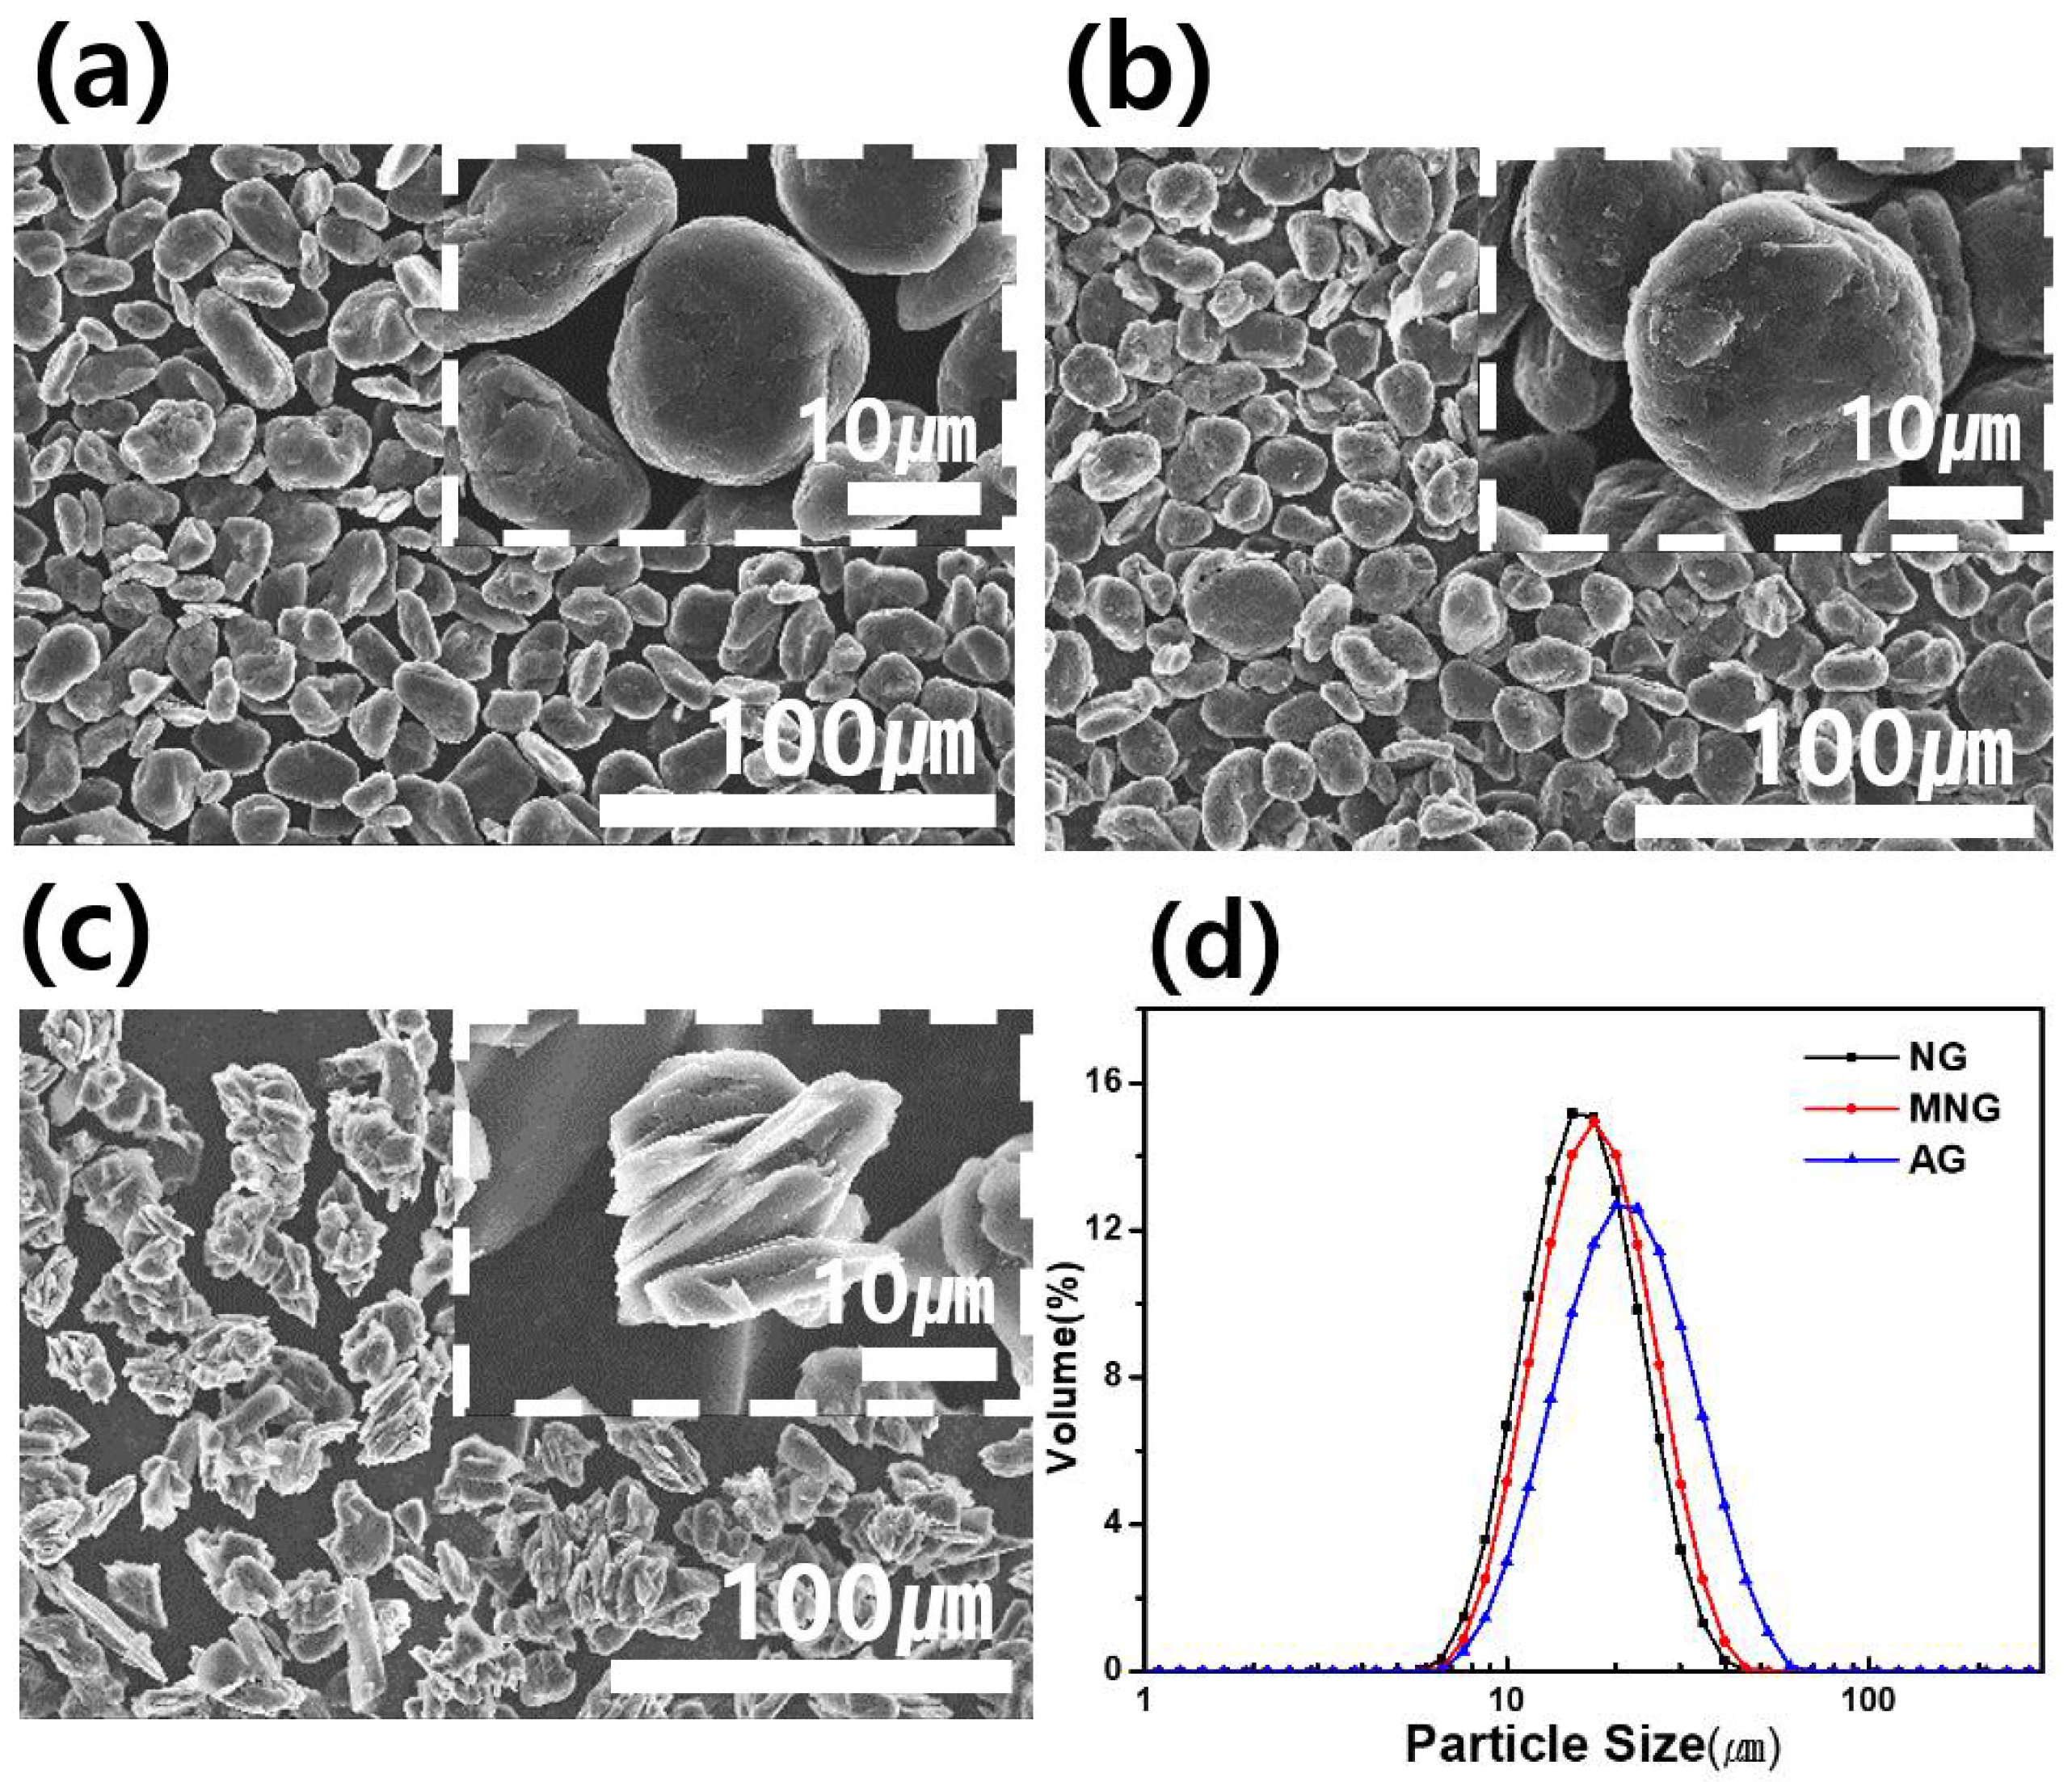
Figure 1. FE–SEM images of (a) pristine natural graphite (NG), (b) modified natural graphite (MNG), (c) artificial graphite (AG), and (d) particle-size distribution of NG, MNG, and AG sample s.
Energies 14 01946 g001
Figure 2. Cross-sectional transmission electron microscopy (TEM) image of AG and MNG particles: low-magnification TEM image of (a) AG, (b) MNG, and (cf) High-resolution transmission electron microscopy(HRTEM) images of selected areas in Figure 2b. Inset represents enlarged image and diffraction pattern for dotted area of each figures.
Energies 14 01946 g002
Figure 3. Compaction density of CNG, MNG, and AG samples.
Energies 14 01946 g003
Figure 4. Comparison of cycling performance behavior of artificial graphite (AG) electrodes with different electrode densities at (a,b) 30 °C and (c,d) 45 °C.
Energies 14 01946 g004
Figure 5. Nyquist plots of AG electrode (a) after 3 cycles and (b) after 100 cycles at different electrode densities; (c) equivalent circuit used for the fitting; and comparison of (d) film resistance (R2), (e) charge-transfer resistance (R3), and (f) Warburg resistance (W) of AG electrodes after 3 and 100 cycles.
Energies 14 01946 g005
Figure 6. Comparison of cycling performance behavior of CNG and MNG with 1.6 g∙cm−3 electrode density and artificial graphite (AG) with 1.55 g∙cm−3 electrode density at (a,b) 30 °C and (c,d) 45 °C.
Energies 14 01946 g006
Figure 7. Raman spectra of AG (a) and MNG (b) electrodes before cycling and after 100 cycles.
Energies 14 01946 g007
Figure 8. Comparison of (a) charge in constant current (CC) mode, (b) charge in constant current–constant voltage (CC-CV) Mode, and (c) discharge rate performance of CNG and MNG and AG.
Energies 14 01946 g008
Figure 9. Nyquist plots of MNG electrodes with a density of 1.6 g∙cm−3 and AG electrodes with a density of 1.55 g∙cm−3 (a) after 3 cycles and (b) after 100 cycles; and comparison of (c) film resistance (R2), (d) charge-transfer resistance (R3), and (e) Warburg resistance (W) of MNG and AG electrodes after 3 and 100 cycles.
Energies 14 01946 g009
Figure 10. (a) Electrode thickness change after 100 cycles for modified spherical natural graphite (MNG), artificial graphite (AG), and electrode surface SEM image of (b,c) MNG and (d,e) AG.
Energies 14 01946 g010
Table 1. Tap density of MNG and AG, and sheet resistance of MNG and AG electrodes with different electrode densities.
SampleMNGAG
Tap density (g∙cm−3)1.070.85
Electrode density (g∙cm−3)1.61.71.551.6
Resistivity (μΩ∙cm)5.11 × 1064.5 × 1067.5 × 1066.4 × 106
Table 2. Initial capacities and coulombic efficiencies of MNG and AG samples with different electrode densities.
SampleElectrode Density (g∙cm−3)Initial Capacity (mAh∙g−1)Coulombic Efficiency (%)
MNG1.6360.393
1.7360.292.8
AG1.55350.592.5
1.6350.392.4
Table 3. Diffusion coefficient for AG and MNG electrodes.
SampleAGMNG
Electrode density(g·cm−3)1.551.61.61.7
3-cycle electrode2.00 × 10 12 1.02 × 10 11 7.89 × 10 12 6.57 × 10 12
100-cycle electrode1.8 × 10 12 3.70 × 10 12 1.91 × 10 12 2.39 × 10 12
Publisher’s Note: MDPI stays neutral with regard to jurisdictional claims in published maps and institutional affiliations.