Abstract
Measurement accuracy is an important performance indicator for high-voltage direct current (HVDC) voltage dividers. The temperature rise effect for a HVDC voltage divider’s internal resistance has an adverse effect on measurement accuracy. In this paper, by building a solid model of a DC voltage divider, the internal temperature rise characteristic and error caused by the temperature rise in a resistance voltage divider were theoretically simulated. We found that with the increase in height and working time, the internal temperature of the voltage divider increased. The results also showed that the lowest temperature was near the lower flange and the highest temperature was near the upper flange in the middle of the voltage divider. The error caused by the temperature rise increased first and then decreased gradually with divider height, increasing with its working time. The measurement error caused by the internal temperature difference in steady state reached a maximum of 158.4 ppm. This study provides a theoretical basis to determine the structure and accuracy improvement for a resistive voltage divider, which is helpful for the selection of components and the optimization of the heat dissipation structure.
1. Introduction
A direct current (DC) voltage divider is the key piece of equipment in a high-voltage direct current (HVDC) transmission system, which is mainly used for voltage measurement and provides voltage signals to secondary protection and related devices [1]. With the increasing importance of HVDC transmission systems, it is necessary to develop an accurate HVDC measurement system that can be realized using a DC resistance divider [2]. Since the HVDC divider is usually exposed to outdoor environments, it should have good measurement stability in order to meet accuracy requirements in a specified operating environment, especially for limiting temperature conditions [3,4,5]. It is significant to improve the constancy of the measuring instrument by using specific error analysis and corresponding elimination methods.
In recent years, the research on precision characteristics of HVDC voltage measuring equipment shows that the influence of temperature on the precision of a resistance ratio is one of the main factors that affects measurement stability. On the one hand, it is expected to increase the voltage divider current to improve accuracy, but the thermal power of the voltage divider also correspondingly increases. On the other hand, the change of ambient temperature leads to a temperature change inside the DC voltage divider [6]. The operating temperature of the HVDC voltage measuring device is between −10 °C and +50 °C, and most of them work outdoors. When the air temperature is relatively high, it has a certain impact on measurement accuracy and even leads to breakage and melting of the voltage divider of internal components, which further leads to a thermal breakdown of components and insulation accidents [7]. Other research results show that the heat generated by the DC voltage divider’s heating element is collected in the upper end of the hollow insulator along with the insulating medium, resulting in a large temperature gradient at the upper and lower ends of the DC voltage divider. The temperature difference can reach 30 K or more than 40 K as the voltage level changes [8,9,10,11,12]. Feng et al. analyzed measurement error caused by the internal temperature difference of DC resistance voltage divider, which reached 3 × 10⁻⁴, but the calculation process was too simple to have universal reference significance [13]. Tingting et al. simulated and tested the temperature distribution of ±100 kV and ±800 kV DC voltage divider. The results showed that the temperature distribution of DC voltage divider had influence on the voltage divider ratio, and the higher the voltage level was, the worst the influence became [14]. Kartik et al. studied the air cooling on a self-heated wire wound precision high voltage divider. They compared the result of the resistance with and without air cooling under laboratory conditions of 25 °C (±1 °C) and relative humidity of 50 (±3%). It was found that the uncertainty of partial pressure ratio has improved from 35 ppm to 20 ppm by using air cooling [15]. The above scholars analyzed the results of the internal temperature rise of the divider in the heat balance of steady state and did not accurately calculate the error caused by the internal temperature rise. The research object of this paper was the reference voltage divider used in the laboratory. In most cases, the experiment duration is too short that the temperature rise of the voltage divider is far away from the steady state. As a result, we pay more attention to the transient temperature rise process, and calculate the specific errors caused by the transient temperature rise process.
In this paper, the influence of the internal temperature difference on the measurement accuracy of the DC voltage divider was analyzed based on its working principle. It provides a theoretical basis for the determination of the structure and the improvement of the accuracy of the voltage divider and helps to select the components in the design stage of the voltage divider. It also helps to evaluate the accuracy and stability of the voltage divider operation at the same time.
2. Typical Structure of DC Voltage Divider
At present, the resistance voltage divider used in HVDC projects is composed of a series of unit resistance elements in succession. The basic structure of a DC voltage divider is shown in Figure 1. R and r are the resistances of the measuring layer and shielding layer, respectively. The head and tail of these two layers are connected, sharing the same potential. An insulating medium is filled between the resistance unit and the inner wall of the insulated sleeve which wraps the outside of the voltage divider.
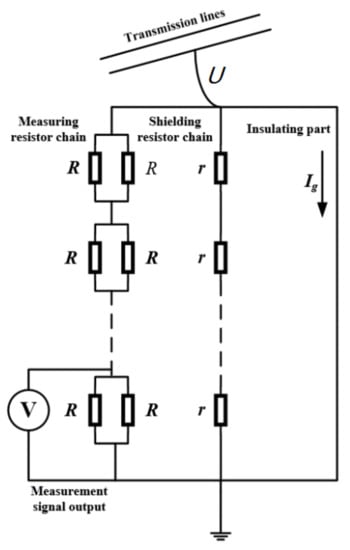
Figure 1.
Basic structure diagram of the resistor divider.
A schematic diagram of the resistance voltage divider is shown in Figure 2, where R1 and R2 denote the respective resistances of the two arms, and U and U2 denote the input voltage and the secondary output voltage, respectively.
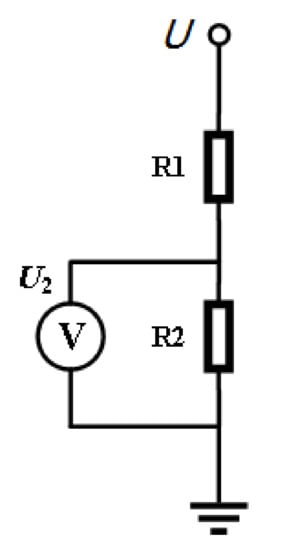
Figure 2.
Schematic diagram of resistor divider.
Theoretically, if R1 and R2 use the same batch of resistors, their temperature coefficients will also be the same. When temperature changes occur simultaneously, the partial voltage ratio K of the resistance voltage separator is a quantitative one, without considering the influence of other external conditions.
The resistance value will be affected by various factors, which will lead to constant changes in the voltage divider partial voltage ratio. The temperature difference of the resistance element is one of the main factors affecting the partial voltage ratio of the DC divider. The resistance elements are usually designed to spiral evenly from the top of the voltage divider down along the bracket, which requires that the wire between the resistance elements to be designed as short as possible to reduce the temperature difference. The surface of the insulating material is prone to generate static electricity, which can absorb dust and water vapor and affect the error, so the internal separator needs to be kept clean. Insulating supports are usually made of plexiglass, Acrylonitrile Butadiene Styrene (ABS), or other insulating materials with good surface properties.
3. The Fundamental Principle of Temperature Rise Calculation for the Resistance Voltage Divider
3.1. Temperature Coefficient
The properties of conductive material and the conductive mechanism determines the properties of the resistance temperature coefficient. The resistance property of metal materials is mainly caused by the scattering of free electrons and the thermal vibration of metal lattice. With the increase in temperature, the thermal vibration of the metal lattice will be more violent, and the movement of free electrons will be more complex and disorderly, and its resistivity will be higher. We can mix some impurity atoms in the metal lattice, which will destroy the arrangement structure of the metal lattice and cause more violent scattering of free electrons. Therefore, the resistivity of pure metals is generally higher than that of alloys with impurities, and the temperature coefficient is generally higher.
The resistivity of a resistive material is a function of temperature, and the relationship between resistance and temperature of different types of resistive elements is complex and diverse. To evaluate the temperature stability of resistors, the resistance temperature coefficient is cited. Resistance temperature coefficient αr refers to the rule that the resistance changes with the temperature of the environment (or itself), which is usually defined as
where R is resistance in Ω. The average temperature coefficient, , is usually represented by the ratio of the resistance change to the corresponding temperature change in the application field. It is generally expressed in parts per million Kelvin (10−6/K).
Here, R1 and R2 correspond to the resistance values of T1 and T2, respectively. When the distribution of resistance and temperature is nonlinear, it is necessary to measure the corresponding average temperature coefficient.
3.2. Basic Concepts of Heat Transfer
3.2.1. Current Field
In the current field, the continuity equation of current distribution can be expressed as
The relationship between electric field intensity, potential density, and current density can be expressed as follows:
where φ is potential in V; γ is the electrical conductivity in S/m; E is electric field intensity in V/m; and J is the current density in A/m2.
3.2.2. Electromagnetic Heat (Joule Heat)
Heat is generated when the current flows through the conductor. In a pure resistance circuit, the work done by the current is mainly converted into heat, and the electrothermal conversion equation is embodied in Joule’s law:
where Qe is the heat of electromagnetic heat in W/m3, J is the current density in A/m2, and γ is the current density in A/m2.
3.2.3. Heat Transfer in Solids
When only the conduction heat transfer process is considered in the solid heat transfer process, conduction heat flux q is proportional to the temperature gradient [16,17,18].
Here, q is heat flux in W/m2, k is thermal conductivity in W/(m·K), and T is temperature in K.
In the transient analysis, the heat transfer equation of the temperature field in a stationary solid can be described in the following form:
where ρ is the density of the solid in kg/m3, T is the temperature in K, Cp is the specific heat capacity at constant pressure in J/(kg·K), K is the thermal conductivity in W/(m·K), and Q is the source of heat in W/m3.
3.2.4. Heat Transfer in Fluid
According to the thermal properties of transformer oil, the temperature conduction is mainly convection or conduction heat transfer [19,20,21,22]. The temperature field in a fluid is as follows:
where u is the velocity field in m/s, and the definitions of other parameters are the same as in Equation (8). The first item from the left denotes heat accumulation, the second item denotes heat convection, the first item on the right denotes heat conduction, and the second item denotes heat source.
3.3. Heat Transfer Process of Voltage Divider
A schematic diagram of the specific heat transfer process [23] of voltage divider is shown in Figure 3.
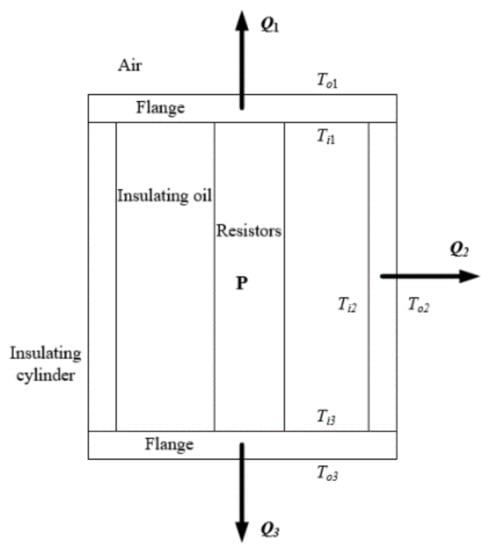
Figure 3.
Schematic diagram of heat transfer of the voltage divider.
In Figure 3, Q1, Q2, and Q3 are the heat transferred to the outside from the outer wall of the metal cover plate of the voltage divider, insulated sleeve, and metal backing plate, respectively. Part of the heat generated by the resistance is defined as Q1’, which is transferred from the transformer oil to the outer wall of the metal cover plate and then to the air outside the voltage divider.
When the heat loss is ignored, the heat transfer in the above three heat transfer processes should be equal to the heat loss Q1 of the metal cover.
Similarly, the heat generated by the resistance and are, respectively, transferred to the air outside the voltage divider from the metal base plate and the insulating sleeve through the same process.
According to the law of conservation of energy, the power consumed by the resistor is equal to the total heat energy transferred to the outside of the voltage divider.
4. Modeling and Error Analysis of the Internal Temperature Rise of the DC Voltage Divider
4.1. Construction of Entity Model of DC Voltage Divider
The 3D entity model of “500 kV”/“2 mA” oil-insulated DC voltage divider was constructed by using the 3D modeling software SolidWorks, as shown in Figure 4. The height of the voltage divider was 3 m. The insulating sleeve was made of epoxy glass, with a height of 2950 mm, an inner diameter of 375 mm, and a wall thickness of 11 mm. The metal cover plate was aluminum. The voltage divider resistor consisted of two groups of 500 high-voltage copper-manganese alloy resistors (1 MΩ/3 W) with a diameter of 35 mm, fixed on an ABS (acrylonitrile butadiene styrene) tube with a diameter of 110 mm.
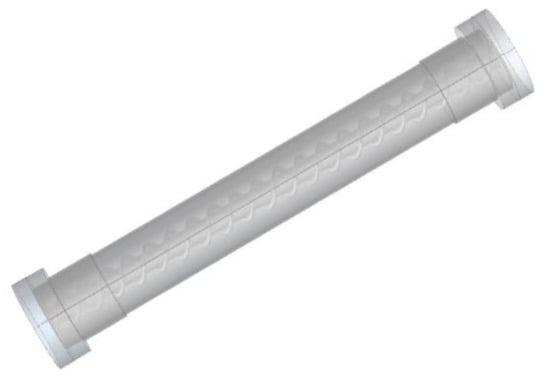
Figure 4.
Entity model of direct current (DC) voltage divider.
4.2. Internal Temperature Simulation of DC Voltage Divider
According to the analysis of the cooling process of the DC voltage divider, the highest temperature of the voltage divider occurred on the voltage divider resistance [24], with a temperature coefficient of 5 ppm/K. Finite element simulation software was used to calculate the temperature rise of DC divider when the ambient temperature was selected as 35 °C and the rated working condition was “500 kV”/“2 mA”. The temperature rise of DC divider was calculated when it worked for 30 min, 60 min, 90 min, 120 min, 160 min, and 200 min.
The material parameters of each component are shown in Table 1, and the temperature distribution at the axis of the voltage divider is shown in Figure 5, which varied with working time. It shows that the divider resistor near the flange had the lowest temperature because the flange had a larger thermal conductivity and a lower temperature, and thus directly exchanged heat with the outside environment. The temperature near the partial pressure resistance connected with it was low. The temperature was the highest near the upper flange in the middle of the voltage divider because it was difficult to transfer the heat energy there to other positions through the flow of oil with worse heat dissipation conditions.

Table 1.
Material parameters.
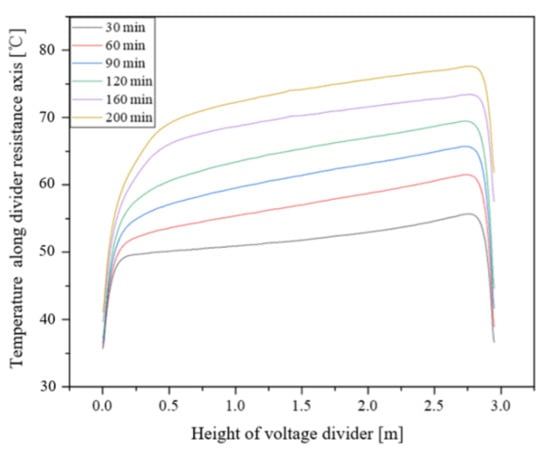
Figure 5.
Temperature distribution at the axis of the divider resistor.
According to Figure 5, the temperature difference inside the device was about 20 °C, 25.5 °C, 29.2 °C, 32.3 °C, 33.8 °C and 36.5 °C, respectively. This was due to the increase in the working time. The thermal effect of resistance was obvious, and heat accumulation led to a temperature rise. In order to analyze the temperature distribution of the DC voltage divider in the steady state, the resistance temperature at every point of the voltage divider was taken at a certain interval for data fitting.
Due to the influence of the thermal process and internal flow field, the temperature rise of each part was different, as was the time to reach steady state. Function T = T∞ + (T0 − T∞) e−T/τ was used to fit the transient temperature rise curve of voltage divider—where T∞ is the steady state temperature, τ is the time constant, and T0 is the ambient temperature. The fitting steady-state temperature distribution of voltage divider resistor is shown in Figure 6, which shows that the internal temperature difference in the steady state was the largest, up to 37.28 °C.
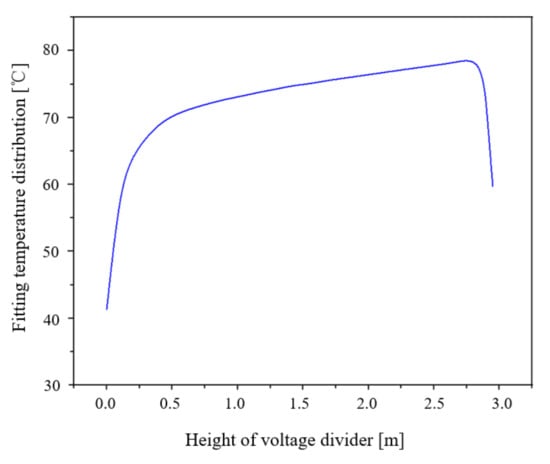
Figure 6.
Steady-state temperature distribution at the axis of the voltage divider resistor.
4.2.1. Theoretical Analysis
The relationship between the conductivity of partial voltage resistance and temperature can be expressed as
where ρ is the resistivity of the partial resistance at the temperature of T (unit: Ω·m); ρ0 is the resistivity of the partial resistance at the reference temperature Tref (unit: Ω·m); α is the temperature coefficient of the resistor (unit: 1/K); T is the temperature of the partial resistance (unit: °C); and Tref is the reference temperature, taking 20 °C.
According to Equation (4), the potential distribution on the voltage divider resistor can be expressed as
where U is the potential of the voltage divider (unit: V); J is the current density (unit: A/m2); k is the pitch of the voltage distributing resistor; L is the length of the voltage distributing resistor (unit: m); R is the inner radius of resistor (unit: m); H is the height of the voltage divider (unit: m); and ∆T is temperature difference (unit: °C).
Order , , then
where V0 is the rated voltage of the divider 500 kV and H is the total height of the resistor (unit: m).
Then, the potential at any point of voltage divider can be expressed as
Without considering the effect of temperature on the conductivity of the voltage divider, the potential at any point of the voltage divider can be expressed as
Therefore, the voltage divider measurement error caused by temperature can be expressed as
Under ideal conditions, the potential distribution of voltage divider is linear. Substituting the temperature distribution at the axis of the divider resistor after working for 30 min under the rated condition of “500 kV”/“2 mA” into Equation (19), the theoretical error graph of potential distribution was calculated using MATLAB, as shown in Figure 7.
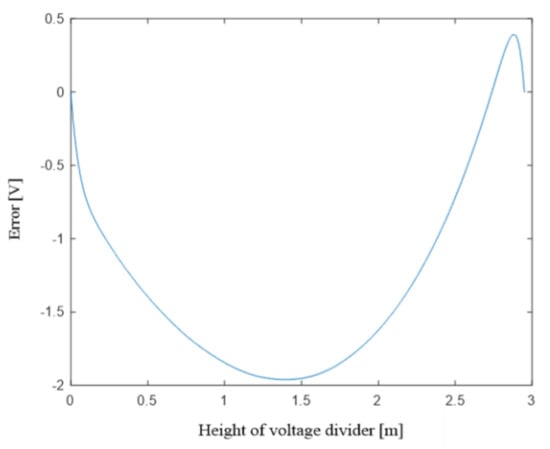
Figure 7.
Theoretical error of the voltage divider.
The temperatures at the upper and lower end of the voltage divider were low because the connection of the flange and other devices with better heat dissipation conditions. Without corresponding cooling measures, the changes of resistivity and the potential difference were large. The potential difference of the divide increased gradually in the lower half of the voltage divider, calculating from h = 0. When it comes to the middle part of the voltage divider, the potential difference reached the maximum with a certain temperature according to the Rolle’s Mean Value Theorem. The potential difference gradually decreased when the resistivity increased and the temperature difference decreased. When the potential difference decreased to 0, it gradually reversed the increase to positive. Near the upper flange, the potential difference gradually reduced to 0 with the decrease in temperature difference and resistivity, due to the heat dissipation effect.
4.2.2. Simulation Analysis
In order to consider the influence of error caused by the temperature rise, the temperature distribution data on the axis of voltage divider resistor was re-imported into COMSOL in the form of interpolation function. The current field and temperature field were simulated and calculated to obtain the potential at each part of the voltage divider considering the temperature. The relevant material parameters are shown in Table 2.
Table 2.
Material parameters.
The potential changes due to the internal temperature changes at every point of the voltage divider were obtained by making a difference between the potential value under different working hours before and after the temperature rise was taken into consideration. The results are shown in Figure 8, where the curve showed that the potential difference of the voltage divider due to the internal temperature difference varies with height.
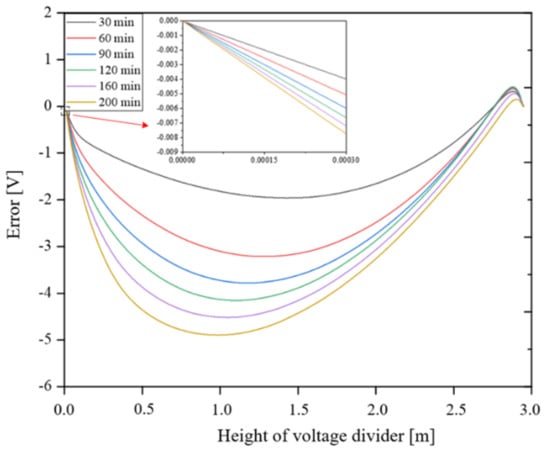
Figure 8.
Voltage divider simulation error with transient temperature rise.
As shown in Figure 8, the potential difference gradually increases and then decreases with the increase in voltage divider height, the same as the change trend of theoretical value. The curves in different colors show the results of the error curves at different working times.
The height of the low-voltage arm is 0.295 mm. We can read the data and analyze the error of the position of the low-voltage arm. The errors are, respectively, −3.98 × 10⁻³ V, −5.06 × 10⁻³ V, −5.91 × 10⁻³ V, −6.64 × 10⁻³ V, −7.21 × 10⁻³ V, and −7.74 × 10⁻³ V. In other words, the high-voltage end potential of the voltage divider measured by the low-voltage arm at this time was 499,960.2 V, 499,949.4 V, 499,940.9 V, 499,933.6 V, 499,927.9 V, and 499,922.6 V. The error of the partial pressure ratio caused by the internal temperature difference increased as the working time increased, and the error reached approximately 154.8 ppm at 200 min.
As shown in Figure 9, the potential error at steady state of the DC voltage divider was analyzed according to the fitted steady-state potential distribution curve, which was about −7.92 × 10⁻³ V. The high-voltage end voltage of the voltage divider was measured by the low-voltage arm and resulted in 499,920.8 V. The error was approximately 158.4 ppm.
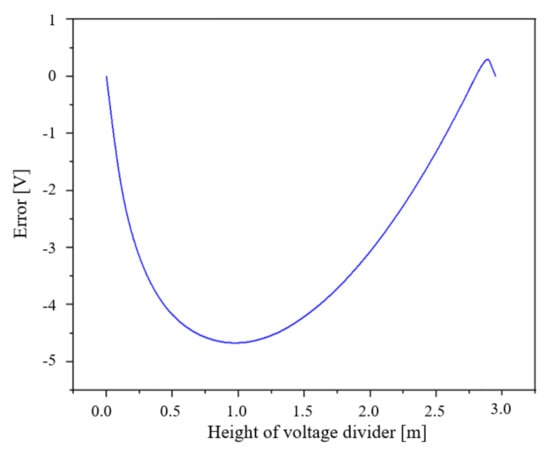
Figure 9.
Potential error of the voltage divider at steady state.
The potential error at steady state was −9.47 × 10⁻³ V, considering the actual situation that the low-voltage arm was externally installed and assuming that the temperature of the low-voltage arm was equal to the ambient temperature. The potential of the high-voltage end of the measured low-voltage arm was 499,905.3 V, and the error was approximately 189.4 ppm. The measurement error when the low-voltage arm was external was larger than that when the low-voltage arm was internal.
The potential errors are shown in Table 3. When the low-voltage arm was internal and external, respectively, the temperature coefficient was changed and the above calculation steps were repeated. As the temperature coefficient increased, the resistance and the potential error gradually increased. When the temperature coefficient was 10 ppm/°C, the errors reached 316.7 ppm and 378.8 ppm, respectively, when the low-voltage arm was internal and external.
Table 3.
Potential errors under different temperature coefficients.
Assuming that the accuracy of the voltage divider was 0.05 level and the error caused by the temperature was no more than 100 ppm in the case of an external low-voltage arm, a resistor with a temperature coefficient below 2 ppm/°C should be selected to meet the accuracy requirements.
5. Conclusions
The effect of temperature change on the accuracy of the voltage measuring device was widely studied, but no detailed quantitative analysis was made. In this paper, a simulation model of the DC voltage divider was built to simulate the internal temperature rise characteristics and to study the potential distribution of the divider, which was helpful for the selection of components and optimize heat dissipation structure, improving the measurement stability when also designing the voltage divider.
The temperature inside the voltage divider increased with height and working time. The temperature of the pressure resistance near the lower flange was the lowest, the temperature of the middle part of the voltage divider was the highest near the upper flange, and the internal temperature difference reached 37.28 °C.
When the voltage divider height increased, the variation trend of the error first increased and then decreased, before gradually increasing with the working time. When the internal heat balance was reached, the measurement error caused by the internal temperature difference reached its maximum, which was approximately 158.4 ppm. The error when the low voltage arm was outside was greater than that when the low voltage arm was inside. Regardless of the position of the low voltage arm, the potential error increased when the temperature coefficient increased.
In order to improve the measurement stability, resistors with appropriate temperature coefficients should be selected. When the voltage divider is assembled, the overall temperature coefficient can be further reduced by connecting the positive and negative temperature coefficient resistors in series at intervals.
Author Contributions
Conceptualization, Z.F.; data curation, D.W.; formal analysis, Y.L. (Yaohua Liao); funding acquisition, S.Z.; investigation, D.W.; methodology, Y.L. (Yi Luo); project administration, S.Z.; resources, B.Q.; software, L.L.; supervision, B.Q.; validation, Y.L. (Yaohua Liao); visualization, L.L.; writing—original draft, Z.F.; writing—review and editing, Y.L. (Yi Luo). All authors have read and agreed to the published version of the manuscript.
Funding
This research was funded by the Science and Technology Plan Projects of China’s southern power grid, grant number ZBKJXM20190054.
Institutional Review Board Statement
Not applicable.
Informed Consent Statement
Not applicable.
Data Availability Statement
Data sharing not applicable.
Acknowledgments
The authors would like to acknowledge the support of NARI-Relays Electric Co., Ltd.
Conflicts of Interest
The author declares no conflict of interest. The funders had no role in the design of the study; in the collection, analyses, or interpretation of data; in the writing of the manuscript; and in the decision to publish the results.
References
- Liu, Z.Y. UHV HVDC Transmission Theory; China Electric Power Press: Beijing, China, 2009. [Google Scholar]
- Riba, J.R.; Capelli, F.; Moreno-Eguilaz, M. Analysis and mitigation of stray capacitance effects in resistive high-voltage dividers. Energies 2019, 12, 2278. [Google Scholar] [CrossRef]
- Liu, X. Design and implementation of DC High Voltage Resistor Voltage divider. Meas. Tech. 2008, 28, 17–19. [Google Scholar]
- Li, Y.; Ediriweera, M.K.; Emms, F.S.; Lohrasby, A. Development of precision DC High-Voltage dividers. IEEE Trans. Instrum. Meas. 2011, 60, 2211–2216. [Google Scholar] [CrossRef]
- Sang, H.L.; Kwang, M.Y.; Jang, Y.C. Low-uncertainty equality between the voltage-dividing and resistance ratio of a DC resistive high voltage divider. J. Electr. Eng. Technol. 2019, 14, 1789–1795. [Google Scholar]
- Liu, B.; Huang, D.X. Thermal design for high precision DC resistance divider. High Volt. Appar. 2011, 2, 31–33. [Google Scholar]
- Li, D.Y.; Li, Q.; Li, H. A Method for Calculation of Thermal Equilibrium Temperature of Conventional DC Voltage Transformer. In Proceedings of the A China Electrical Engineering Society High Voltage Professional Committee Academic Annual Meeting, Wuhan, China, 13–16 November 2009. [Google Scholar]
- Wang, W.C.; Zhang, J.L. Analysis of structure principle and field application of DC and DC regulators. Comp. Tech. Auto 2012, 31, 45–49. [Google Scholar]
- Ye, T.L.; Wu, G.Y.; Wu, J.K. Analysis and treatment on external insulation flashover of DC voltage divider of 500 kV converter station. Electr. Power Constr. 2010, 31, 56–60. [Google Scholar]
- Xie, C.; Luo, Y.H.; Yang, J.L. ±800 kV UHVDC no-load pressure analysis on the abnormal action of protection test. Electr. Eng. 2013, 1, 45–49. [Google Scholar]
- Sun, S.H.; Fu, J.H.; Liu, J. Disturbance analysis and modification of ±500 kV DC voltage divider for converter station. Shaanxi Electr. Power 2012, 4, 34–38. [Google Scholar]
- Hu, X. Analysis of Locking Accident in DC System due to Failure of a DC Voltage Regulator. Sichuan Electr. Power Technol. 2011, 8, 59–61. [Google Scholar]
- Feng, P.; Yong, X.; Guoying, L.; Xia, L.; Hang, S. Analysis of the influencing factors for the 500 kV DC voltage reference divider used for on-site calibration. In Proceedings of the 2015 12th IEEE International Conference on Electronic Measurement & Instruments (ICEMI), Qingdao, China, 16–18 July 2015. [Google Scholar]
- Tingting, X.; Zhongzhou, Y.; Jianhua, F.; Lu, W. Influence of temperature variation on the accuracy of DC voltage measuring device. In Proceedings of the 2017 4th International Conference on Electric Power Equipment—Switching Technology (ICEPE-ST), Xi’an, China, 22–25 October 2017. [Google Scholar]
- Kartik, K.B.; John, T. A study of air force cooling on self heated wire wound Precision High Voltage divider though Automation. J. Phys. Conf. Ser. 2018, 1065, 052005. [Google Scholar] [CrossRef]
- Man, Y.H.; Mi, J.J. A numerical study on three-dimensional conjugate heat transfer of natural convection and conduction in a differentially heated cubic enclosure with a heat-generating cubic conducting body. Int. J. Heat Mass Transf. 2000, 43, 4229–4248. [Google Scholar]
- Li, Z.; Chu, Y.D.; Li, X.F. Numerical simulation of natural convection on vertical wall. J. Heilongjiang Inst. Sci. Technol. 2008, 18, 58–60. [Google Scholar]
- Kapjor, A.; Durcansky, P.; Vantuch, M. Effect of heat source placement on natural convection from cylindrical surfaces. Energies 2020, 13, 4334. [Google Scholar] [CrossRef]
- Xiong, C.A.; Yang, S.G. A study on mathematical model of large volume natural convection and laminar heat transfer. J. Heilongjiang Univ. Sci. Technol. 2000, 10, 42–45. [Google Scholar]
- Kuehn, T.H.; Goldstein, R.J. An experimental and theoretical study of natural convection in the annulus between horizontal concentric cylinders. J. Fluid Mech. 1976, 74, 695–719. [Google Scholar] [CrossRef]
- Choo, J.Y.; Schultz, D.H. A stable high-order method for the heated cavity problem. Int. J. Numer. Methods Fluids 1992, 15, 1313–1332. [Google Scholar] [CrossRef]
- Shao, F. Conjugate of natural convection and conduction in a complicated enclosure. Int. J. Heat Mass Transf. 2004, 47, 233–2239. [Google Scholar]
- Li, D.Y.; Li, Q.; Li, H. Temperature and heat transfer characteristics analysis and calculation under heat balance of DCTV resistive capacitor. High Volt. Technol. 2010, 36, 994–999. [Google Scholar]
- Tan, Y.F. Advanced Engineering Thermodynamics; Harbin University of Technology Press: Harbin, China, 2018. [Google Scholar]
Publisher’s Note: MDPI stays neutral with regard to jurisdictional claims in published maps and institutional affiliations. |
© 2021 by the authors. Licensee MDPI, Basel, Switzerland. This article is an open access article distributed under the terms and conditions of the Creative Commons Attribution (CC BY) license (https://creativecommons.org/licenses/by/4.0/).