Article

A Study on the Economic Feasibility of Stand-Alone Microgrid for Carbon-Free Island in Korea

KEPCO International Nuclear Graduate School (KINGS), 658-91 Haemaji-ro, Seosaeng-Myeon, Ulju-gun, Ulsan 45014, Korea
*
Author to whom correspondence should be addressed.
Energies 2021, 14(7), 1913; https://doi.org/10.3390/en14071913
Submission received: 6 February 2021 / Revised: 27 March 2021 / Accepted: 29 March 2021 / Published: 30 March 2021
(This article belongs to the Section A1: Smart Grids and Microgrids)

Abstract

:
The power industry is rapidly changing as demand for eco-friendly and stable power supply increases along with global greenhouse gas emission regulations. Small-capacity renewable power sources represented by photovoltaics and wind are continuously increasing as a form of microgrid to supply electric power to a community or island. As a result, microgrids based on renewable resources have come into wide usage around small areas or islands in Korea. In particular, the microgrid development policy of Korea is focused on electric power quality, as well as expansion in renewable energy supply for reducing greenhouse gas emissions. From 2009, the government began to develop independent carbon-free microgrids with photovoltaic and wind powers instead of traditional power diesel generators for small islands. The goal of this paper is to investigate a feasible economic microgrid topology for implementing the carbon-free island (CFI) under an acceptable level of reliability. First, we derive three scenarios of power systems including photovoltaics, wind, battery, and fuel cells. Next, we assess economic feasibility on top of the power supply reliability of the scenarios. Then, we perform a sensitivity test to suggest economic conditions for achieving the CFI goals. Finally, we present carbon-free-based microgrid models considering the CFI policy of Korea.

1. Introduction

Climate change, which is partly caused by continued use of fossil fuels in the energy sector, is emerging as an important global issue. Most economies around the world have autonomously established greenhouse gas reduction targets since the adoption of the United Nations Framework Convention on Climate Change (UNFCCC) in 1992 [1]. Korea also joined the stream of low-carbon, green growth policy. In particular, “carbon-free island” (CFI) or “energy-independent island” is an electricity policy model for stand-alone microgrids, replacing the diesel-oriented power systems with renewable energy sources such as photovoltaic and wind power [2,3]. It means the policy transition from diesel-based power generation systems to 100% renewable energy. However, energy storage systems are required to mitigate uncertainty and variability from renewable resource output. In practice, the key question is how to optimize the existing island power system, which currently consists of diesel generators (DG), with new renewable sources such as photovoltaic, wind, and energy storage system (ESS). In particular, there are a wide range of selections in ESS depending on physical duration and energy storage methods. Among them, the hydrogen energy storage system is gaining attention as a promising means for implementing microgrids into carbon-emitting agents due to ease of capacity expansion and long-term usage duration properties [4]. Microgrids have gained more usage with the goal of saving electricity bills from the consumer side, and with the goal of reducing greenhouse gas emissions and fuel cost by expanding renewable energy usage from the national point of view [5]. Examples of such policies include eco-friendly energy towns, CFIs, zero-energy buildings, energy self-reliance campuses, and so on. In particular, the renewable-based microgrid for CFI is expected to be greatly utilized when improving economic feasibility in the island area. The goal of this paper is to investigate a feasible economic microgrid topology for implementing a carbon-free island (CFI) under an acceptable level of reliability (unmet load) condition.
The microgrid of the island is determined considering the distribution and demand of renewable resources at the specific location. Photovoltaics (PV) and wind turbines (WT) are the main power sources in Korea. The BESS (Battery Energy Storage System) capacity is also determined considering the output variability and uncertainty of the renewable sources. Several hybrid-type island microgrids, composed of diesel generators and renewables, were built in Korea. Table 1 shows these examples built between 2012 and 2017.
The three islands are located on the southwest seashore of the Korean Peninsula. Their microgrids comprise PV, WT, BESS, and DG. This combination may be determined considering such conditions as dynamic characteristics as well as economic feasibility of microgrids.
This paper analyzes the economic feasibility (i.e., levelized cost of electricity: LCOE) of microgrid scenarios under acceptable level of power supply reliability (unmet load) for CFI, using HOMER (Hybrid Optimization of Multiple Energy Resources) following the methodology of Reference [9]. In addition, this paper provides a scenario-specific test to find out economically feasible conditions for introducing a set of electrolyzer, hydrogen tank, and fuel cell (P2H2P). The rest of the paper consists of the following. Section 2 analyzes previous research on microgrid design and operation. Section 3 describes input data required for the scenario design and HOMER simulation on the island microgrid considering national energy policy. Section 4 analyzes scenario-specific simulations using HOMER in terms of economic feasibility and power supply reliability, and suggests financially feasible investment cost level for the battery and P2H2P to be competitive. Finally, Section 5 contains the conclusions of this paper.

2. Literature Review

The composition of microgrids in island areas is generally determined by comprehensively considering residents’ power consumption patterns, renewable energy potential, investment capability, and power quality. In addition, various mathematical algorithms and commercial tools [10] are used for optimal microgrid design considering economic and technical aspects. In many countries, microgrids are being carried out for various purposes. Reference [11] evaluates the economics and power supply of wind–diesel, and wind–diesel–hydrogen systems on Grimsey Island, 40 km off Iceland’s north coast, and presents a step-by-step strategy for building a 100% renewable microgrid. Reference [12] presents the effectiveness of applying hydrogen storage systems to conventional power systems such as South Australia’s solar power generation and WT.
The introduction of hydrogen storage systems to microgrids has been shown to be economically advantageous, with LCOE decreasing from USD2.540/kWh to USD 0.626/kWh than by battery alone. It was also argued that the introduction of hydrogen storage systems can reduce the power generation of hydrogen as a fuel source, reducing the cost of microgrids. Reference [13] presented the possibility of optimizing green energy systems for island resorts in Malaysia. The PV–WT–FC model (green energy model) and diesel-only model were compared using HOMER. In addition to PV, WT, and FC, the green energy model also considered electrolyzer, hydrogen tank (HT), and batteries as investable factors for backup power and short- and long-term power storage. As a result of the simulation by HOMER, the minimum cost was USD1.104/kWh, which consisted of PV–WT, but with the battery as a backup power source, and USD1.108/kWh for the LCOE including fuel cell (FC) and hydrogen production/storage facilities. In addition, the NPC was USD1,900,576, which was about 74% of the former model for diesel generators alone. Therefore, it is expected that there will be a drop in FC costs or a drop in diesel prices in order for a 100% renewable microgrid to be economically viable while securing economic feasibility. Then, Reference [14] presented the possibility of introducing hydrogen storage systems for independent microgrids based on 100% renewable power for Australian communities. Economic and environmental advantages and disadvantages of PV-Battery (S1), PV-P2H2P (S2), and PV-P2H2P-Battery (S3) scenarios were analyzed and compared other than diesel-only scenarios (BS). As a result of the simulation by HOMER, the LCOEs of S1, S2, and S3 were USD0.394/kWh, USD0.474/kWh, and USD0.342/kWh, respectively, at 51–71% compared to USD0.665/kWh of BS. In addition, Reference [15] proposed a stand-alone microgrid consisting of PV-P2H2P for irrigation, expected to be more competitive in the future, although more expensive than diesel-only generators. As such, microgrids have different compositions and economic evaluations depending on the distribution and cost level of renewable resources in the target area. Most studies evaluate scenario-based economics and power supply adequacy, taking into account uncertainties in microgrid investment and operating costs. In addition, microgrids designed through this process actually were built in specific regions and the economic and technical points were evaluated [16]. This leads to the establishment of a microgrid model suitable for the region, which leads to commercialization. However, essentially, a key issue in microgrid design and operation is the combination of economics and power supply reliability. To the best of the authors’ knowledge, there are no comprehensive studies on the economic analysis of MG (Micro grid) considering the unmet load by HOMER in Korea.
Furthermore, considering the optimal operation point of view, the real feasibility of the energy mix and its realization can be limited by infrastructure and other technical availability. Such factors include power flows and inversion management, power flows optimization, communication infrastructure, interaction management between distribution system operator (DSO) and distributed generation, storage systems, and so on. We cannot think of real deployment of microgrids without considering these key issues. An isolated hybrid microgrid poses a significant challenge to conventional load flow technique due to small-rating, droop-based distributed generation and by variable but coupled frequency and DC voltage levels [17,18,19]. In particular, the absence of a slack bus, resulting from the small distributed generation rating, hinders the application of traditional analysis approaches. The power flows management and operation are one of the critical topics in power systems analysis [20]. These problems cannot be directly solved because of the nonlinearity of power flow equations. As a result, an iterative method must be used to solve the nonlinear equations. The combination of renewable energy resources with flexible demands such as electric vehicles and air conditioners makes distribution systems more complex and important [21]. The increase in energy prosumers and exchange of electricity in two-way directions increase the complexity and uncertainty of the distribution system operation, too. The observability makes a critical impact on the operation and quality of electricity distribution grids.
The DSOs, who manage the communication infrastructure, confront an increasing complexity due to high complexity in distributed energy systems along with volatile demand such as electrical vehicles [22]. With the increase in renewable energy and decreasing load flexibility, the role of DSO is becoming more complex in microgrids [23]. A two-way electricity flows occurs when the generation from the distributed unit exceeds the local load. In this case, the voltage profile of the distributed network will have a strong influence, and the smart distribution network configuration will change dynamically to minimize power loss and voltage deviations. In summary, the real-time monitoring of the distribution network will become much harder due to the increasing dynamics. The distribution system state estimation will become more challenging due to the scarcity of real-time measurements [24].
Also, the interaction between distributed generation and DSO must be carefully planned [25]. The distributed generation increases along with the microgrid. However, there are still various barriers such as technology, economic feasibility, and regulations for the vitalization of distributed systems. Bayindir, R. et al. [26] presented well the practical issues related with establishing smart power grids, including the technological methods of data transmission, energy efficiency of smart grids, and smart grid application. Smart grids enable monitoring distributed energy systems through remote sensing facilitates and providing load shedding function in case of an emergency. Additionally, they can manage supply and demand response, using historical energy generation and consumption data. In particular, the remote sensing and controls are usually installed in the smart grid application. These functions require a heavy communication system to collect usage data and monitor the operation of the grid. As a result, for considering real feasibility, we need to consider limits in a comprehensive manner including data communication method and network, load flow and demand, energy source efficiency, power quality and intelligent network application, and so on.

3. Methodology

3.1. Scenario Description

Three scenarios are established as shown in Table 2, considering the CFI vitalization policy and needs for hydrogen fuel cells for islands in Korea.
Scenario1 (S1) consists of DGs with a capacity of 150 kW, considering maximum power demand and reserve power. Due to the increase of fuel cost for DGs which includes the transportation cost from the mainland and problems caused by the CO2 emission by DGs, the use of renewable energy resources has become vital. So, scenario2 (S2) consists of PV and WT as renewable sources, together with BESS with the intention of ensuring flexibility in the microgrid. Scenario3 (S3) is designed to achieve compatible output as S2 except adding hydrogen fuel cells, which is a clean energy policy direction of the Korean government.

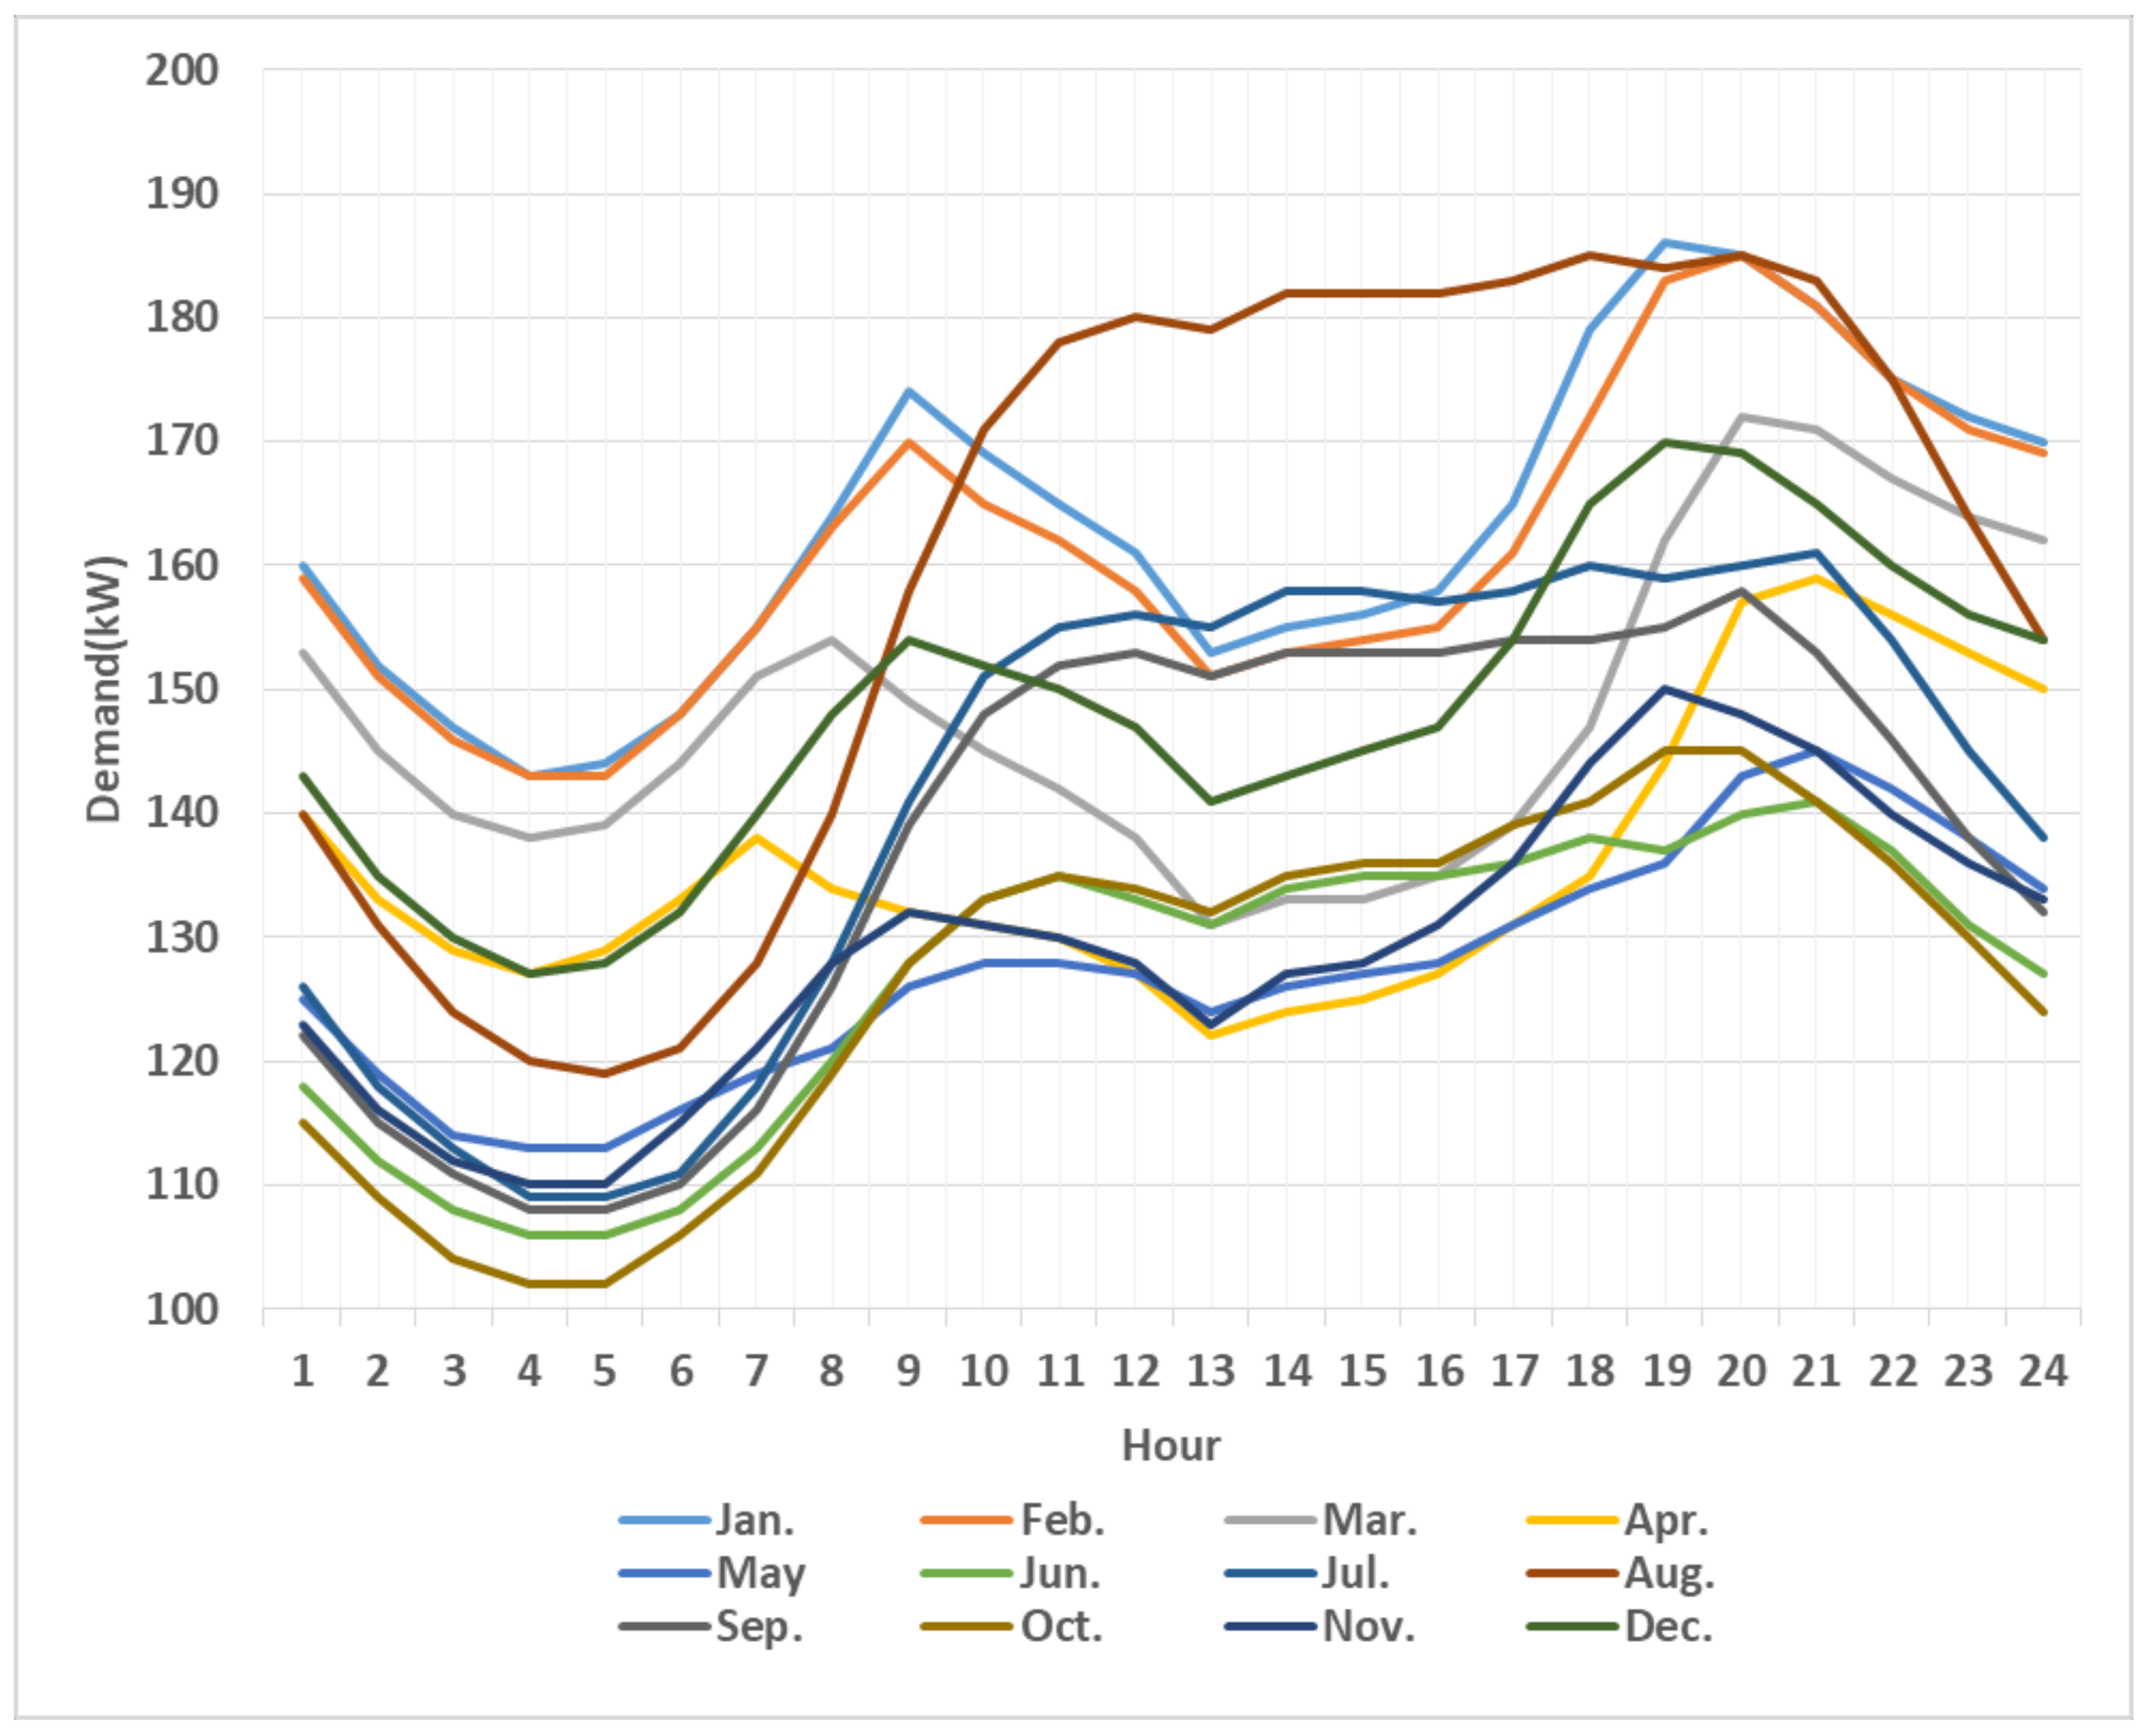
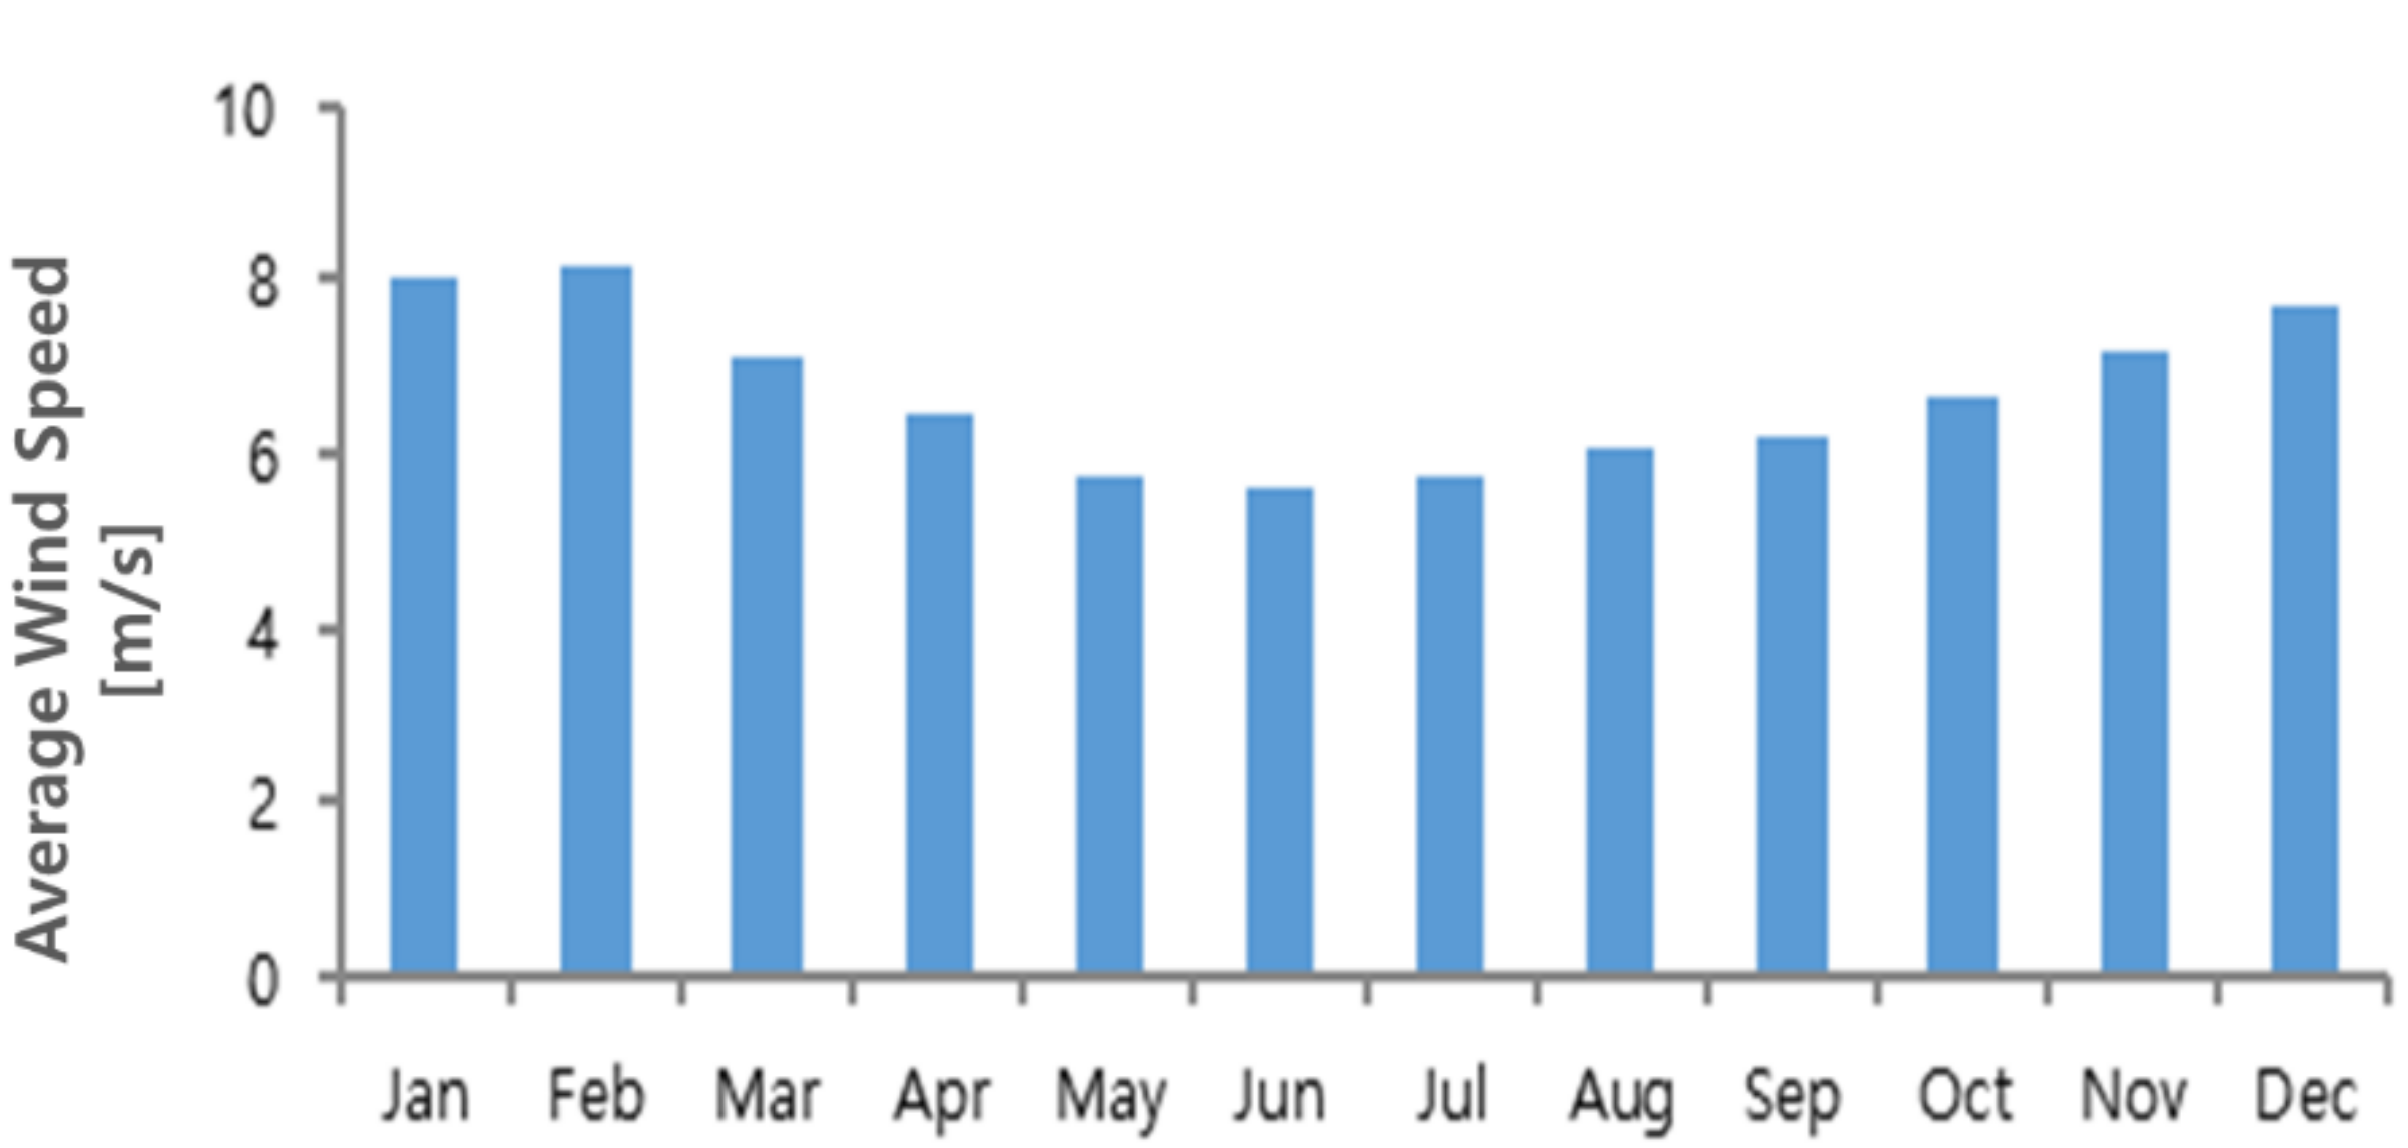
3.2. Data Assumption

Electrical Load: We set the assumption of 220 inhabitants (130 households), most of them in the fishing industry, from previous research [27]. Figure 1 shows daily load patterns for each month. Power demand increases from around 5 a.m. to 8 a.m. in preparation for fishing, and the demand peaks around 8 p.m.
In terms of seasonal power demand patterns, overall demand for electricity is high in the summer and winter seasons due to cooling and heating usages. Especially in January, peak and average power demands are 186 kW and 159.7 kW, respectively. The annual average demand is 140.4 kW, and the average daily energy is 3370 kWh/day with a load factor of 76%.
Solar Radiation:Figure 2 shows average monthly radiation and clearance index. The average solar radiation and clarity are 4.26 kWh/m2/day and 0.49, respectively. Solar radiation from April to August is above average, with the lowest rate of 2.22 kWh/m2/day in December. It shows the highest value of 5.74 kWh/m2/day in June.
Temperature: Solar panels are made of semiconductor materials that reduce power generation efficiency as temperatures rise, so ambient temperatures should also be considered when calculating power generation [28]. The average annual temperature is 16.39 °C, the highest temperature (in August) is 25.82 °C, and the lowest temperature (in January) is 7.5 °C.
Wind Speed:Figure 3 shows the annual wind speed pattern, with an average wind speed of 6.71 m/s, a monthly average maximum wind speed of 8.17 m/s in February, and a minimum wind speed of 5.59 m/s, in June.
PV Panel: We apply single-crystalline solar panels, assuming 20% efficiency and 35 years of life cycle. It is more expensive than other types such as polycrystalline solar cells, thin films, but has better efficiency and longer life. In addition, 80% of the attenuation coefficient and −0.5%/°C of the temperature effect for power are applied for modules considering environmental factors such as dust, snow, and aging. With respect to panel costs, the initial capital cost is set at USD995/kW [29] and the replacement cost is estimated at 80% of the initial cost. In addition, operational and maintenance (O&M) costs are assumed to be USD18.3/kW.
WT: A wind generator is assumed to have a 30 m rotor diameter, 50 m of tower height, 35 years of life span, and 250 kW of unit capacity. The workable wind speed range is 4 m/s to 25 m/s and is expected to generate 250 kW corresponding to the rated output at 14 m/s. The initial investment cost is assumed to be USD1473/kW [29] and the O&M cost to be USD44.5/kW. The replacement cost is assumed at 80% of the initial cost.
Battery: We select a lithium-ion battery considering its fast charge capacity, long life cycle, and high energy density. The initial capital cost is set at USD350/kWh [30] and the replacement cost at 80% of the initial cost, the O&M cost at USD20/kW-year [30], and the round-trip efficiency at 90%. Table 3 shows the summary of technical characteristics of the lithium-ion batteries selected in this research.
Converter: Life expectancy and efficiency are assumed at 15 years and 95%, respectively. The initial investment and O&M costs are set to be USD600/kW and USD3/kW-year, respectively [30]. The replacement cost is assumed as 80% of the initial investment.
DG: A diesel generator with 150 kW of unit capacity, 55,000 h of operation life, USD806/kW of initial investment cost, and 100% of the replacement cost to initial investment is assumed [31]. We also assumed USD2/kW/h of O&M and USD1/liter of fuel costs. In addition, 96 h of maintenance with USD10,000 per 2400 h of operation is considered. The fuel consumption is set as 45 L/h at rated output and the CO2 emissions as 17.794 g/L, the data having been provided by HOMER.
Electrolyzer: An electrolyzer produces hydrogen using surplus power from PV and WT, so its capacity should be higher than the output of PV and WT. The initial investment cost is applied at USD2500/kW and the replacement cost is assumed as 80% of the initial investment. The O&M cost is set as USD80/kW-year. The stack life and lower heat value efficiency are 10 years and 65%, respectively.
HT: We assumed compressed hydrogen storage in a gas form, which will require a storage pressure of 300 bar due to the low density [32] at ambient temperature. The HT investment cost is selected at USD1000/kg, and the replacement and O&M are assumed as 80% and 10% of initial investment, respectively.
Fuel Cells: We selected proton-exchange membrane fuel cells, after analyzing various types of fuel cells, because it has such advantages as high power density, high efficiency, fast electrochemical reactions, and environmental friendliness [33,34]. The FC capacity is assumed at 250 kW considering the peak load, however, the waste heat from electrochemical reactions is not considered. The lifetime is assumed at 60,000 h and the initial investment cost at USD2500/KW [14]. The replacement cost is assumed at 80% of the initial investment cost, USD0.02/op.hour for O&M and 17 kg/h for hydrogen consumption at maximum rated output. Table 4 shows the summary of input data.

4. Analysis Result

We established three scenarios reflecting island fuel mix, future microgrid policies, renewable generation, power supply adequacy, economic feasibility, and environmental feasibility using the HOMER tool. We set 1% of unmet load per year (the amount of electricity not supplied) as an indicator for the adequacy of electricity supply. We assessed economic feasibility based on LCOE and environmental performance based on CO2 emission.

4.1. Scenario 1: Topology_A (Diesel-Only System)

The first scenario includes only diesel generators in the microgrid. We ran HOMER to find out the optimal topology that incurs minimum LCOE and meets our unmet criteria (less than 1%) under this scenario. The selected microgrid topology_A is composed of two units of diesel (150 kW) generators as shown in Figure 4.
We estimated LCOE and CO2 emissions based on the optimal size of diesel generators that satisfies less than 1% of unmet load. Table 5 shows the result. If the microgrid is built with two diesel generators with a capacity of 150 kW, the annual unmet load is 1607 kWh, which is 0.13% of the total electricity demand and meets the unmet criteria (less than 1%). And thus, we determine two units as the optimal size. With this size, the LCOE is calculated at USD0.445/kWh.
Under this scenario, the effect of CO2 penalty on LCOE is USD0.028/kWh, when the penalty for CO2 emissions is priced at USD33/ton. Within this scenario, without considering CFI policies, the plant size will be determined based on the policy weight among power supply reliability, economic feasibility, and environmental concern. Table 6 illustrates the cost structure in case two diesel generators are included in microgrids. Fuel cost accounts for 70.9% of the total cost. In order to reduce this cost, it is essential to replace high-efficiency DGs and improve performance along with reducing CO2 emissions.
Table 7 also shows the power generation, operation time, and utilization rate for each diesel generator. The DG1 and DG2 account for 74.1% and 19.4% of power generation, respectively.

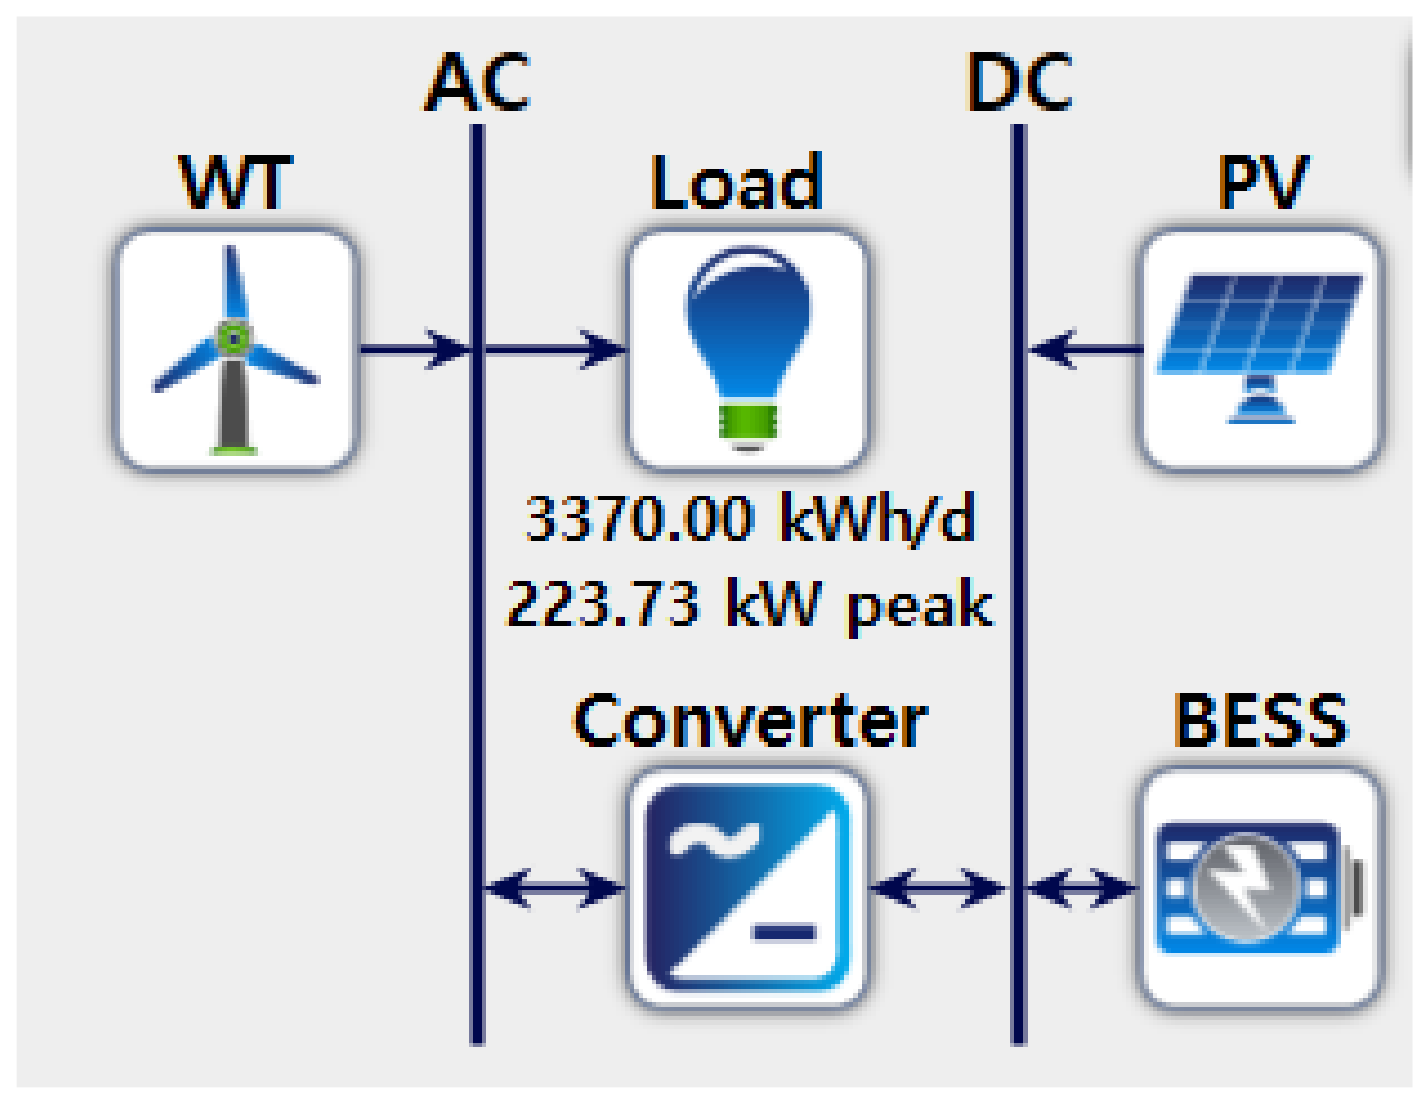
4.2. Scenario 2: Topology_B (PV + WT + BESS System)

The second scenario is designed to achieve the CO2 free energy policy goal. The selected topology_B is composed of WT, PV, and BESS as described in Figure 5 below.
We simulated various cases of topologies under the second scenario, and the result is illustrated in Figure 6 below. It shows the achievable combinations of LCOEs at corresponding unmet loads. The efficient frontier line can be identified as the set of points with minimum LCOEs under given unmet loads. As the unmet load increases, the achievable LCOE decreases, a result that is due to savings in both investment and operation costs.
We derived Equation (1) that describes the efficient frontier line of Figure 6 as follows:
LCOE = 0.0127 Unmet   load 2 0.0616   Unmet   load + 0.2621
It is estimated that the minimum LCOE under the second scenario will be USD 0.254/kWh at 0.13% of unmet load which is compatible with the topology_A.
By selecting the minimum LCOE under 1% unmet load criteria again, we got topology_B, which is composed of PV (700 kW), three units of WT (250 kW), BESS (2304 kWh), and converter (200 kW) from HOMER. The configuration is summarized below in Table 8.
By selecting the minimum LCOE that meets under 1% unmet criteria again, we got topology_B. Table 9 shows the estimation result of topology_B: power generation, unmet load, excess electricity, NPC, and LCOE. The LCOE is estimated at 0.21/kWh when the unmet load is 0.939%, which satisfies under 1% unmet load criteria and achieves the minimum LCOE under S2. This result is smaller than the above USD0.254/kWh under the 0.13% of unmet load condition.
Table 10 shows the lifetime (25 years) cost structure, with initial investment cost accounting for the highest share of 60.6%, followed by replacement cost at 10.1%, operating cost at 36.2%, and residual value at (−)6.9% of total costs. When compared with S1, the initial investment cost and replacement cost increased 11 times and 1.61 times, respectively. However, the O&M cost and fuel cost decreased 76% and 100%, respectively. The residual value increased by 98%, and thus the overall NPC decreased by 12%.
Table 11 also shows the cost portions for microgrid components, with PV, WT, BESS, and converters accounting for 18.8%, 34.8%, 42.8%, and 3.5%, respectively. In particular, BESS, which has a 10-year lifespan, is required for at least two replacements, and has a high initial cost over the life of the project. We expect the LCOE of this scenario will decrease as the cost of lithium-ion batteries is still in a decreasing trend.

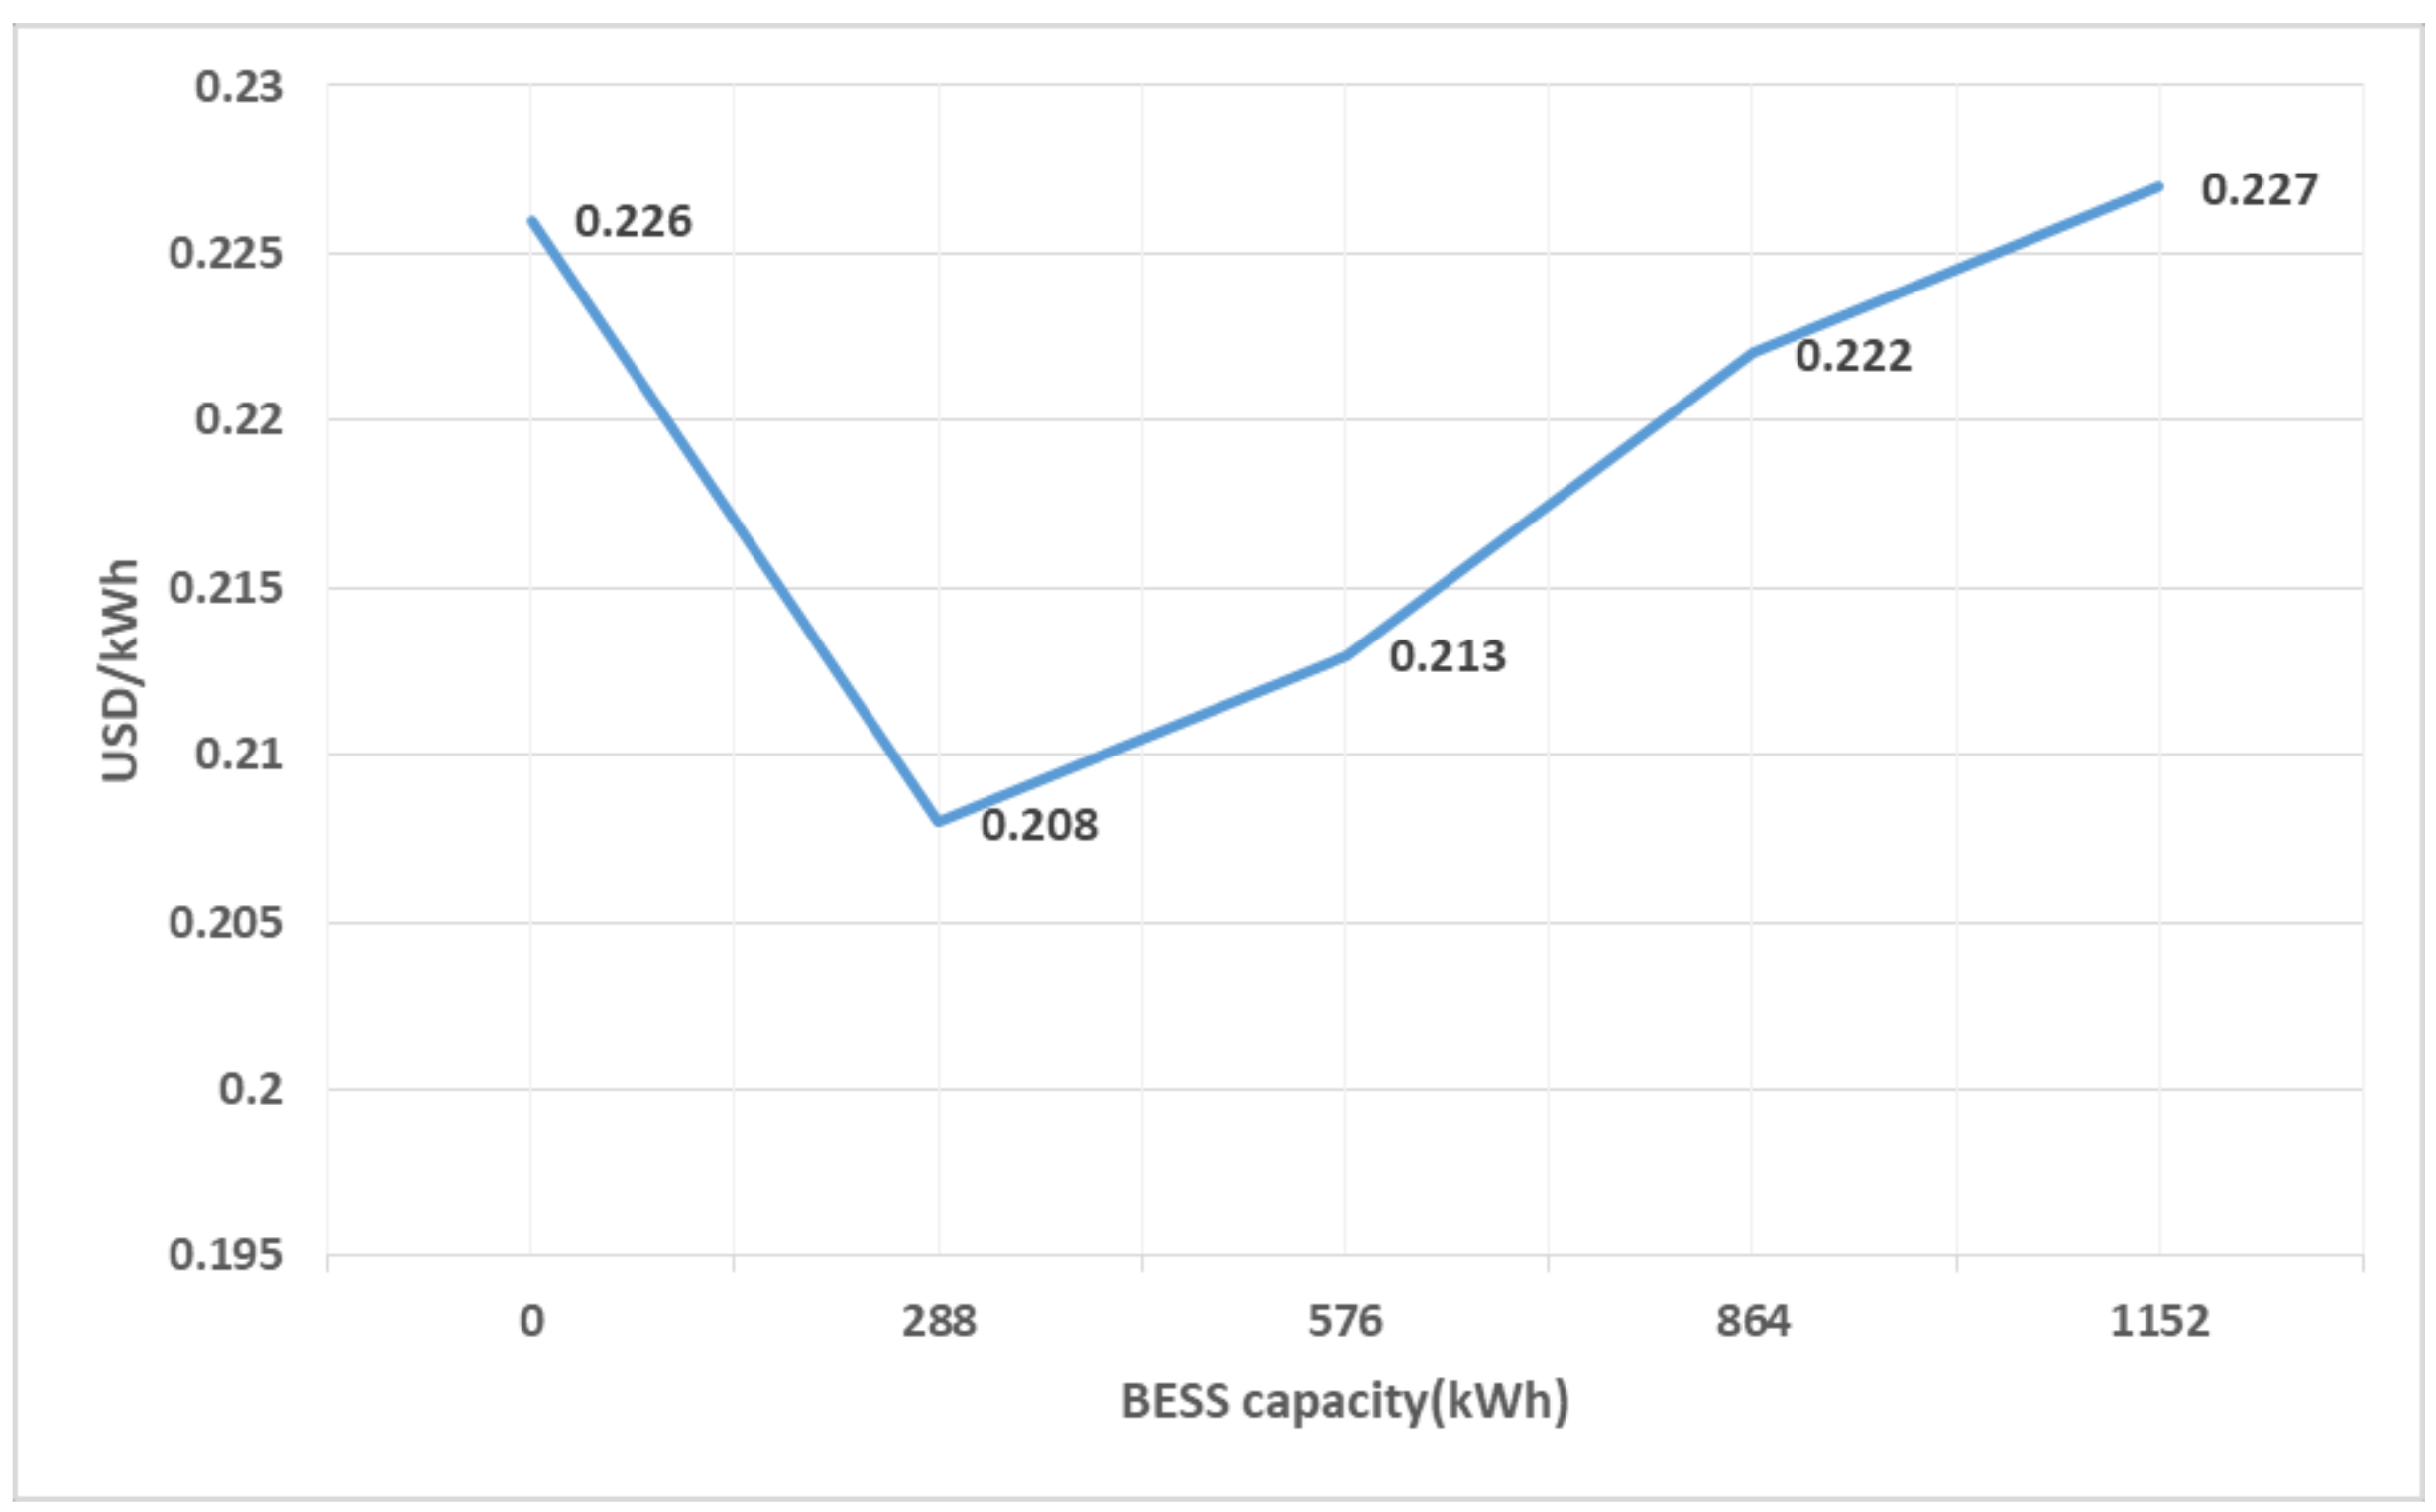
4.3. Scenario 3: Topology_C (PV-WT-BESS-P2H2P)

The third scenario is intended to assess the economic feasibility of a microgrid with P2H2P in the second scenario. As illustrated in Figure 7, the electrolyzer and storage (H2TK) using surplus electric power and FC are added.
Considering the available island area and peak demand, we fixed the FC capacity at 250 kW and set the search space of H2TK as 100 and 500 kg, and the electrolyzer as 50 to 300 kW into HOMER to find the optimal capacity. Table 12 shows the optimal composition (topology_C) under S3 that meets the unmet criteria of less than 1% and achieves minimum LCOE, which was USD 0.208/kWh.
By adding a P2H2P, the unmet load level was decreased to 0.78%, which was 0.159%p lower than S2, and the LCOE also decreased to USD0.208/kWh, which was USD0.002/kWh lower than the topology_B of S2. The cheaper price as well as the higher reliability in topology_C is mainly due to adding P2H2P in substitution for the decreased BESS capacity and thus, generating cheaper electricity. We analyzed how the LCOE changes due to the change in BESS capacity under S3. We found out the LCOE of S3 arrived at a minimum point when BESS capacity was 288 kWh. Of course, the optimal size of P2H2P changes together as the capacity of BESS changes. The result is illustrated in Figure 8.
We found that combining a P2H2P together with BESS can contribute to building an efficient microgrid system under a same unmet load condition. The result may be improved with an optimization algorithm because our result is derived based on limited input range to HOMER.
Table 13 shows the power generation of each component, with WT accounting for 57.1%, PV accounting for 41.3%, and FC accounting for 1.6%. This paper considers the WT and the PV, which contribute to smooth the total generation compared to the WT or PV output, and thus result in reduced storage investment. As a result, the excess electricity of both scenarios (54.6% in S1 and 34% in S2) is estimated lower than previous research such as Reference [14], where only solar PV is applied to all scenarios and the excess electricity was estimated at 74.9% (without hydrogen system scenario) and 35.2% (with hydrogen system scenario). And comparing the excess electricity between the two scenarios of this paper, topology_C (34%) is lower than topology_B (54.6%) by 22.4%. The difference is due to additional storage and usage of extra electricity through the hydrogen system. From the frequency and voltage maintenance point of view, the excess electricity should be curtailed, stored, or consumed in another form of energy. Accordingly, depending on the strategy of excessive electricity usage and investment cost, relative competitiveness will be different.
Table 14 shows the lifetime cost structure in S3, with initial investment costs accounting for 71.1%, facility replacement costs accounting for 10.2%, and O&M costs accounting for 26.5%.
Table 15 shows the cost structure by components, with P2H2P being the highest at 42%, followed by WT at 35.4% and PV at 13.6%. It is observed that the portion of BESS among investment cost decreased from 42.8% in topology_B to 5.4% in topology_C, whereas the portion of P2H2P investment cost increased.
Table 16 shows the capacity factor and operation time for each power source. The capacity factors of PV, WT, and FC are 14.9%, 28.8%, and 10.8%, respectively, and the operating hours are 4360 h, 6668 h, and 1860 h, respectively, which indicates that most of the electricity is supplied by PV and WT directly.

4.4. Capital Cost Forecast and Sensitivity Test

A large number of studies have forecasted price reduction of microgrid components both in capital investment and operation due to a learning curve. Reference [35] forecasted PV cost would decrease around 35.0–41.4% from 2016 to 2025, and around 47.1–55.3% by 2030. It also forecasted the solar LCOE would decrease around 19.6–30.8% from 2016 to 2025, and around 26.5–41.4% by 2030. Reference [36] predicted the price of solid oxide electrolyzer cells (SOECs) would be 1090 €/kW in 2030 based on 12.4% of annual decreasing rate. Reference [37] estimated the cost of Li-ion batteries for ESS would drop from USU94/kWh in 2024 to USD62/kWh in 2018 based on 18% of annual cost saving rate. Reference [38] estimated the cost of electrolyzer would drop to 40% of 2019 price in 2030 based on 16–21% of annual cost reduction rate.
We forecasted the capital costs of microgrid components in 2025 and 2030 based on the annual cost reduction rates from the literature. The result is summarized in Table 17. We also assumed the electricity demand will increase 9.9% by 2020 and 19% by 2030 based on the long-term electricity plan of the Korean government [39].
We executed another set of simulations, applying the forecasted capital costs of Table 17, under S2 and S3. Table 18 summarizes the results of the optimal topologies and LCOE estimations under each of the scenarios. The LCOE of topology_B is estimated to become USD0.121/kWh in 2025, and USD0.105/kWh in 2030. That of topology_C, which adds electrolyzer/H2TK and FC, is estimated to become USD0.128/kWh in 2025, and USD0.10/kWh in 2030. The forecasted LCOE of both scenarios is expected to converge into similar levels in the long term.

5. Conclusions

This paper proposed a plan to build a microgrid based on 100% renewable energy in the island system in conjunction with the CFI policy in Korea. We analyzed and compared economic feasibilities of different microgrid scenarios under an acceptable level of power supply reliability. As is expected, when the unmet load condition increases, the achievable LCOE decreases due to savings in both investment and operation costs. We empirically derived an efficient frontier line that shows inverse relation between minimum LCOE and reliability of the microgrid system.
The conventional power configuration with diesel generators as the power source was set as a basic scenario (S1). The economic feasibility and power supply reliability of topology_A (WT + PV + BESS) and topology_B (WT + PV + BESS + P2H2P) were compared, using HOMER.
The topology_A under S1, which comprises two units of DG (150 kW), is estimated to have USD0.445/kWh of LCOE under 0.13% of unmet condition. The portion of fuel cost is by far the largest (over 70% among NPC) and so it may cause vulnerability to the local electricity price when the global oil price is unstable. More importantly, it is estimated S1 will generate 1012 ton/year of CO2. The requirement for reducing greenhouse gas emissions and carbon-free microgrid policy will vitalize renewables, reducing DG-based microgrids.
The S2 is designed to achieve the CO2-free energy policy goal. The topology_B is selected among options within S2 to achieve minimum LCOE with less than 1% of unmet criteria, resulting in a system with PV (700 kW), three units of WT (250 kW), BESS (2304 kWh), and converter (200 kW). The LCOE of topology_B is estimated at USD0.21/kWh under 0.939% unmet load condition, which is approximately 47% of topology_A. The combination of solar PV and WT, by smoothing the total generation pattern and thus saving storage system budget, can lower LCOE as well as excess electricity more than previous research [14], where a single source of generator (photovoltaic) was used. The major portion of NPC is composed of WT (35%) and BESS (43%), and the resulting cost reduction due to technical development can lead to a further drop of LCOE in the future.
The topology_C is designed to assess the economic feasibility of a microgrid with BESS and P2H2P. The system includes PV (500 kW), two units of WT (250 kW), BESS (288 kWh), HT (200 kg), electrolyzer (200 kW), and FC (250 kW). The LCOE of topology_C is slightly lower than that of topology_B, meaning the combination of BESS and P2H2P topology (topology_C) is more competitive than topology_B. Combining a P2H2P with a BESS enhanced the efficiency of the microgrid system under the same unmet load condition. Our study proved lower LCOE as well as higher reliability can be achieved by partly substituting P2H2P for BESS capacity in topology_C. Also, topology_C resulted in lower excessive electricity than topology_B by 22% due to the additional hydrogen system. However, there may be additional investment needed for monitoring and operation due to higher complexity in topology_C, the cost of which is not considered in this paper. In any case, with the same context with topology_B, the LCOE of topology_C is expected to decline in the future.
We conclude that scenarios with different options of power sources and excessive energy storage will differentiate system composition as well as economic feasibility. We would like to study wider microgrid composition scenarios, taking into account the utilization and dynamic characteristics of surplus electricity, in addition to the economic and power supply reliability as further research.

Author Contributions

Conceptualization, B.M., S.P. and Y.Y.; Data curation, H.M. and B.M.; Formal analysis, H.M. and B.M.; Funding acquisition, Y.Y.; Investigation, H.M. and Y.Y.; Methodology, H.M., S.P. and Y.Y.; Resources, Y.Y.; Software, B.M.; Supervision, S.P.; Validation, S.P.; Writing—original draft, H.M. and B.M.; Writing—review & editing, S.P. and Y.Y. All authors have read and agreed to the published version of the manuscript.

Funding

This study was conducted with the funds of the Ministry of Trade, Industry and Energy in 2019 with the support of the Korea Institute of Energy Technology Evaluation and Planning (KETEP)as a new energy project and a global talent development project (project number: 20194010000090). This work was supported by the 2020 Research Fund of the KEPCO International Nuclear Graduate School (KINGS), Republic of Korea.

Institutional Review Board Statement

Not applicable.

Informed Consent Statement

Not applicable.

Data Availability Statement

No new data were created or analyzed in this study. Data sharing is not applicable to this article.

Conflicts of Interest

The authors declare no conflict of interest.

References

  1. UNFCCC. United Nations Framework Convention; UN: New York, NY, USA, 1992. [Google Scholar]
  2. UNFCCC. Republic of Korea First NDC; UN: New York, NY, USA, 2020; p. 3. [Google Scholar]
  3. Yang, J. Strategies for Low-Carbon Green Growth and Urban Management in Korea. J. Urban Manag. 2013, 2, 85–101. [Google Scholar] [CrossRef]
  4. Liu, Y.; Yu, S.; Zhu, Y.; Wang, D.; Liu, J. Modeling, planning, application and management of energy systems for isolated areas: A review. Renew. Sustain. Energy Rev. 2018, 82, 460–470. [Google Scholar] [CrossRef]
  5. Daeseak, C. A Study on the Construction of a Test-Bed for Demonstration of Microgrid in Island; Korea Electronics Technology Institute: Seongnam, Korea, 2016; Available online: https://www.dbpia.co.kr/Journal (accessed on 11 December 2020).
  6. Chae, U. Gasado Stand-alone Microgrid Establishment Case. Korean Inst. Electr. Eng. 2014, 12, 65–75. Available online: http://www.dbpia.co.kr/journal (accessed on 2 August 2020).
  7. Chang, J.-W.; Moon, H.-J.; Moon, S. Droop Control Method Considering Battery State of Charge(SOC) for Geocha-island Microgrid. Korean Inst. Electr. Eng. 2016. Available online: https://www.dbpia.co.kr/Journal (accessed on 3 August 2020).
  8. Choi, J.-H. Study on utilization of renewable energy in small scale energy independence island. Korean Inst. Electr. Eng. 2018, 871–872. Available online: http://www.dbpia.co.kr/journal (accessed on 20 September 2020).
  9. Rozlan, M.B.M.; Zobaa, A.F.; Abdel Aleem, S.H.E. The optimisation of stand-alone hybrid renewable energy systems using HOMER. Int. Rev. Electr. Eng. 2011, 6, 1802–1810. [Google Scholar]
  10. Jiménez, A.; Haase, S.G.; Mathur, S. Microgrid Analysis Tools Summary. Microgrid Anal. Tools Summ. 2018. [Google Scholar] [CrossRef]
  11. Chade, D.; Miklis, T.; Dvorak, D. Feasibility study of wind-to-hydrogen system for Arctic remote locations—Grimsey island case study. Renew. Energy 2015, 76, 204–211. [Google Scholar] [CrossRef]
  12. Kharel, S.; Shabani, B. Hydrogen as a Long-Term Large-Scale Energy Storage Solution to Support Renewables. Energies 2018, 11, 2825. [Google Scholar] [CrossRef] [Green Version]
  13. Ashourian, M.; Cherati, S.; Zin, A.M.; Niknam, N.; Mokhtar, A.; Anwari, M. Optimal green energy management for island resorts in Malaysia. Renew. Energy 2013, 51, 36–45. [Google Scholar] [CrossRef]
  14. Dawood, F.; Shafiullah, G.M.; Anda, M. Stand-Alone Microgrid with 100% Renewable Energy: A Case Study with Hy-brid Solar PV-Battery-Hydrogen. Sustainability 2020, 12, 2047. [Google Scholar] [CrossRef] [Green Version]
  15. Khadem, T.; Billah, S.B.; Barua, S.; Hossain, S. HOMER based hydrogen fuel cell system design for irrigation in Bangladesh. In Proceedings of the 2017 4th International Conference on Advances in Electrical Engineering (ICAEE), New York, NY, USA, 28–30 September 2017; pp. 445–449. [Google Scholar]
  16. Lidula, N.; Rajapakse, A. Microgrids research: A review of experimental microgrids and test systems. Renew. Sustain. Energy Rev. 2011, 15, 186–202. [Google Scholar] [CrossRef]
  17. Nassar, M.E.; Hamad, A.A.; Salama, M.M.A.; El-Saadany, E.F. A Novel Load Flow Algorithm for Islanded AC/DC Hybrid Microgrids. IEEE Trans. Smart Grid 2017, 10, 1553–1566. [Google Scholar] [CrossRef]
  18. Cataliotti, A.; Cosentino, V.; Di Cara, D.; Tine, G. LV Measurement Device Placement for Load Flow Analysis in MV Smart Grids. IEEE Trans. Instrum. Meas. 2016, 65, 999–1006. [Google Scholar] [CrossRef]
  19. Cataliotti, A.; Cosentino, V.; Di Cara, D.; Russotto, P.; Telaretti, E.; Tine, G. An Innovative Measurement Approach for Load Flow Analysis in MV Smart Grids. IEEE Trans. Smart Grid 2015, 7, 889–896. [Google Scholar] [CrossRef]
  20. Tostado-Véliz, M.; Kamel, S.; Jurado, F. A powerful power-flow method based on Composite Newton-Cotes formula for ill-conditioned power systems. Int. J. Electr. Power Energy Syst. 2020, 116, 105558. [Google Scholar] [CrossRef]
  21. Saldaña-González, A.E.; Sumper, A.; Aragüés-Peñalba, M.; Smolnikar, M. Advanced distribution measurement technologies and data applications for smart grids: A review. Energies 2020, 13, 3730. [Google Scholar] [CrossRef]
  22. Rinaldi, S.; Bonafini, F.; Ferrari, P.; Flammini, A.; Sisinni, E.; Di Cara, D.; Panzavecchia, N.; Tinè, G.; Cataliotti, A.; Cosentino, V.; et al. Characterization of IP-Based Communication for Smart Grid Using Software-Defined Networking. IEEE Trans. Instrum. Meas. 2018, 67, 2410–2419. [Google Scholar] [CrossRef]
  23. Kong, X.; Chen, Y.; Xu, T.; Wang, C.; Yong, C.; Li, P.; Yu, L. A Hybrid State Estimator Based on SCADA and PMU Measurements for Medium Voltage Distribution System. Appl. Sci. 2018, 8, 1527. [Google Scholar] [CrossRef] [Green Version]
  24. Huang, M.; Wei, Z.; Sun, G.; Zang, H. Hybrid State Estimation for Distribution Systems With AMI and SCADA Measurements. IEEE Access 2019, 7, 120350–120359. [Google Scholar] [CrossRef]
  25. Posada, A.F.P.; Villegas, J.G.; López-Lezama, J.M. A Scatter Search Heuristic for the Optimal Location, Sizing and Contract Pricing of Distributed Generation in Electric Distribution Systems. Energies 2017, 10, 1449. [Google Scholar] [CrossRef] [Green Version]
  26. Bayindir, R.; Colak, I.; Fulli, G.; Demirtas, K. Smart grid technologies and applications. Renew. Sustain. Energy Rev. 2016, 66, 499–516. [Google Scholar] [CrossRef]
  27. Lee, S.H. Optimization Study of Microgrid for Energy Self-sufficient Islands. Ph.D. Thesis, Sejong University, Seoul, Korea, 2018. Available online: https://scienceon.kisti.re.kr (accessed on 6 May 2020).
  28. Dubey, S.; Sarvaiya, J.N.; Seshadri, B. Temperature Dependent Photovoltaic (PV) Efficiency and Its Effect on PV Production in the World—A Review. Energy Procedia 2013, 33, 311–321. [Google Scholar] [CrossRef] [Green Version]
  29. IRENA. Renewable Power Generation Costs in 2019; IRENA: Abu Dhabi, UAE, 2020. [Google Scholar]
  30. Lockhart, E.; Li, X.; Booth, S.S.; Olis, D.R.; Salasovich, J.A.; Elsworth, J.; Lisell, L. Comparative Study of Techno-Economics of Lithium-Ion and Lead-Acid Batteries in Micro-Grids in Sub-Saharan Africa; Office of Scientific and Technical Information (OSTI): Washington, DC, USA, 2019. [Google Scholar]
  31. U.S. DOE. Energy Storage Technology and Cost Characterization Report; U.S. DOE: Washington, DC, USA, 2019. [Google Scholar]
  32. Møller, K.T.; Jensen, T.R.; Akiba, E.; Li, H.-W. Hydrogen—A sustainable energy carrier. Prog. Nat. Sci. 2017, 27, 34–40. [Google Scholar] [CrossRef]
  33. He, K.; Zhang, C.; He, Q.; Wu, Q.; Jackson, L.; Mao, L. Effectiveness of PEMFC historical state and operating mode in PEMFC prognosis. Int. J. Hydrog. Energy 2020, 45, 32355–32366. [Google Scholar] [CrossRef]
  34. Uzundurukan, A.; Bilgili, M.; Devrim, Y. Examination of Compression Effects on PEMFC Performance by Numerical and Experimental Analyses. Int. J. Hydrog. Energy 2020, 45, 35085–35096. [Google Scholar] [CrossRef]
  35. Zhou, Y.; Gu, A. Learning Curve Analysis of Wind Power and Photovoltaics Technology in US: Cost Reduction and the Importance of Research, Development and Demonstration. Sustainability 2019, 11, 2310. [Google Scholar] [CrossRef] [Green Version]
  36. Zauner, A.; Böhm, H.; Rosenfeld, D.C.; Tichler, R. Innovative large-scale energy storage technologies and Power-to-Gas concepts after optimization. In European Union’s Horizon 2020 Research and Innovation Programme; European Commission: Brussels, Belgium, 2016. [Google Scholar]
  37. Kwak Byung Sung. Future Development of Energy Technology: Cell and Related Technologies; Korea Institute of Energy Research: Daejeon, Korea, 2019. [Google Scholar]
  38. IRENA. Green Hydrogen Cost Reduction; IRENA: Abu Dhabi, UAE, 2019. [Google Scholar]
  39. Ministry of Trade, Industry and Energy. 9th Long-Term Electric Power Demand and Generation Plan; Ministry of Trade, Industry and Energy: Seoul, Korea, 2020.
Figure 1. Daily load pattern.
Energies 14 01913 g001
Figure 2. Monthly average solar radiation and clearness index.
Energies 14 01913 g002
Figure 3. Monthly average wind speed.
Energies 14 01913 g003
Figure 4. Microgrid topology_A in S1.
Energies 14 01913 g004
Figure 5. Microgrid topology_B in S2.
Energies 14 01913 g005
Figure 6. Unmet load and LCOE distribution under S2.
Energies 14 01913 g006
Figure 7. Microgrid topology_C in S3.
Energies 14 01913 g007
Figure 8. LCOE based on BESS capacity under S3.
Energies 14 01913 g008
Table 1. Hybrid-type island microgrids in Korea.
IslandGasado [6]Geochado [7]Sammado [8]
LoadMax (kW)173305110
Min (kW)618045
DG (kW)10015080
PV (kW)314111122.4
WT (kW)1001003
BESS (kWh)30005001231
Table 2. Scenario settings.
ScenarioS1S2S3
TopologyTopology_A
(DG only)
Topology_B
(PV-WT-Battery)
Topology_C(
PV-WT-Battery-P2H2P)
Table 3. Technical characteristics of BESS unit.
PropertiesValuePropertiesValue
Nominal voltage (V)48Max. charge current (A)200
Nominal capacity (kWh)9.6Min. discharge current (A)500
Round efficiency (%)90Series string size15 units
Table 4. Summary of major component inputs.
ComponentInitial Capital
Cost (USD/kW)
Replacement
(USD/kW)
O&M Cost
(USD/kW)
Lifetime
(Year)
PV99579618.335
Wind Turbine1473117844.535
BESS350 USD/kWh280 USD/kWh20 USD/kW-year10
Converter6003003 USD/kW-year15
Diesel Generator8068062 USD/op. hour55,000 h
Electrolyzer250020008015
HT1000 USD/kg800 USD/kg10 USD/year15
Fuel Cell250020000.02 USD/op.hour60,000 h
Table 5. Simulation result of topology_A (diesel-only system).
CompositionGeneration
(kWh/year)
Unmet Load
(kWh/year)
CO2 Emission (kg/year)NPC
(USD)
LCOE
(USD/kWh)
DG 150 kW*21,228,4431607 (0.13%)1,012,8249,573,4570.445
DG 150 kW*3130,05001,016,2379,696,9310.450
Table 6. Cost structure of topology_A (unit: USD).
CapitalReplacementO&MFuelSalvageTotal
242,000415,4432,148,9446,787,252−20,1829,573,457
2.5%4.3%22.4%70.9%−0.2%100.0%
Table 7. Generation and capacity factor of diesel generators (unit: USD).
ComponentTotal Generation
(kWh/year)
Hours of
Operation (/year)
Capacity
Factors (%)
DG1973,432847274.1
DG2255,011594919.4
Table 8. Microgrid composition of topology_B under S2.
ComponentOptimal CapacityComponentOptimal Capacity
PV700 kWBESS2304 kWh
Wind Turbine250 kW*3unitConverter200 kW
Table 9. Simulation result of topology_B under S2.
ComponentGeneration
(kWh/year)
Unmet Load
(kWh/year)
Excess Electricity
(kWh/year)
CO2 Emission
(kg/year)
NPC
(USD)
LCOE
(USD/kWh)
PV 912,562 (32.6%)11,545 (0.939%)1,531,897 (54.6%)04,498,5100.21
WT 1,892,983 (67.4%)
Total2,805,545 (100%)
Table 10. Lifetime cost structure of topology_B by source (unit: USD).
Initial CapitalReplacementO&MFuelSalvageTotal
2,727,650456,4851,627,7220−313,3374,498,520
60.6%10.1%36.2%0%−6.9%100%
Table 11. Cost structure of topology_B by components (unit: USD).
PVWTBESSConverterTotal
843,9031,567,4051,927,542159,6704,498,520
18.8%34.8%42.8%3.5%100%
Table 12. Microgrid composition of S3.
ComponentOptimal CapacityComponentOptimal Capacity
PV500 kWH2TK200 kg
Wind Turbine250 kW*3unitElectrolyzer200 kW
BESS288 kWhFuel Cell250 kW
Table 13. Simulation result of S3.
ComponentGeneration (kWh/year)Unmet Load
(kWh/year)
Excess Electricity
(kWh/year)
CO2 Emission
(kg)
NPC
(USD)
LCOE
(USD/kWh)
WT1,892,983 (57.1%)14,148 (0.78%)944,421 (34%) 04,429,553USD0.208/kWh
PV651,830 (41.3%)
FC236,840 (1.6%)
Total2,781,652 (100%)
Table 14. Lifetime cost structure of topology_C by source (unit: USD).
Initial CapitalReplacementO&MFuelSalvageTotal
3,148,050453,5841,172,9990−345,0804,429,553
71.1%10.2%26.5%0.0%−7.82%100.0%
Table 15. Cost structure of topology_C by components (unit: USD).
ComponentCostComponentCost
WT1,567,404 (35.4%)P2H2PElectrolyzer974,821 (22.0%)
BESS240,942 (5.4%)HT312,798 (7.1%)
PV602,788 (13.6%)Fuel Cell571,148 (12.9%)
Converter159,670 (3.6%)Sum1,858,767 (42%)
Table 16. Power generation and operation time for each power source in S3.
QuantityPVWTFC
Capacity Factor (%)14.828.810.8
Hours of Operation436066681860
Table 17. Forecasted capital cost in 2025 and 2030.
ComponentsCapital Cost (Base Case: Table 4)
Year of 2025Year of 2030
Forecasted Capital Cost Ratio to Base CaseForecasted Capital CostRatio to Base Case
PV (USD/kW)80681%65766%
Wind Turbine (USD/kW)128787.4%114177.5%
BESS (USD/kWh)9427%6218%
Converter (USD/kW) 48080%36060%
P2H2PElectrolyzer (USD/kW)200080%150060%
HT (USD/kg)80080%80060%
FC (USD/kW)144357.7%109043.6%
Table 18. Simulation result by topologies.
TopologyTopology_B
(PV + WT + BESS)
Topology_C
(PV + WT + BESS + P2H2P)
Year2025203020252030
PV (kW)700600700800
WT (kW)250 kW*3250 kW*4250 kW*2250 kW*2
BESS (kWh)2880288023042880
Converter (kW)200300200200
Electrolyzer (kW)00100100
HT (kg)00100100
FC (kW)00250250
Excess Elec (%)50.054.130.330.6
Unmet Load (%)0.990.910.870.91
LCOE (USD/kWh)0.1210.1050.1280.100
Publisher’s Note: MDPI stays neutral with regard to jurisdictional claims in published maps and institutional affiliations.

