Article

Biochemical Conversion of Lignocellulosic Biomass from Date Palm of Phoenix dactylifera L. into Ethanol Production

1
Department of Chemical, Environmental and Materials Engineering, University of Jaen, 23071 Jaen, Spain
2
Laboratory of Microbial Ecology and Technology, LETMi-INSAT, The National Institute of Applied Sciences and Technology INSAT, University of Carthage, 2, Boulevard de la terre, BP 676, Tunis 1080, Tunisia
*
Author to whom correspondence should be addressed.
Energies 2021, 14(7), 1887; https://doi.org/10.3390/en14071887
Submission received: 29 January 2021 / Revised: 22 March 2021 / Accepted: 25 March 2021 / Published: 29 March 2021
(This article belongs to the Section B: Energy and Environment)

Abstract

:
Cellulosic fibers from date palm are among the most promising lignocellulose feedstock for biorefinery purposes. The world production is between 1.9 and 2.4 million t/year. Initially, a pretreatment with dilute-sulphuric acid of these fibers was performed using a response surface methodology, with temperature and process time as factors. The aim is to produce bioethanol from young and old fibers from date palm, Phoenix dactylifera L. Optimal thermochemical pretreatment conditions for both fibers palms were 220 °C in hydrothermal conditions (without acid); in these conditions pretreated young fibers presented a maximum content in holocelluloses of 45.18% and old fibers 61.97%. Subsequently, during the enzymatic hydrolysis a maximum yield of total reducing sugars (TRS) was reached, 46.32 g/100 g for pretreated dry young fibers and 48.54 g/100 g for pretreated dry old fibers. After enzymatic saccharification, hydrolysates were fermented by Pachysolen tannophilus (ATCC 32691) to ethanol, reaching yields (YE/TRS) of 37.94 g ethanol/100 g of TRS for young fibers and 35.84 g ethanol/100 g of TRS for old fibers. Globally, considering the full process, in the fermentation of the hydrolysates, a yield (YE) of 10.64 g ethanol/100 g of dry young fibers and 10.88 g ethanol/100 g of dry old fibers was reached.

1. Introduction

Date palm P. dactylifera L. is one of the oldest crops existing in the arid zones of the Arabian Peninsula, North Africa and Middle East [1]. Cellulosic fibers are the byproduct of the date palm tree; it is the fibrous part that covers the trunk of the tree which is bonded to the stipe before the death of a palm frond [2]. In Tunisia, its annual quantity is about 30,460 t/year [3]. This substrate is used both crude and oxidized as a composite material [4]. Furthermore, this fiber is used to generate heat by combustion as well as for wood production; it is also employed as an energy resource for the wood industry [5]. Cellulosic fibers have not been used for bioenergy purposes through biochemical pathways; only its combustion evaluation in a fixed bed laboratory reactor and its comparison with sawdust was performed [6]. Therefore, the cellulosic fibers from date palm could be a potential raw material due to its lignocellulosic composition, which is why the purpose of this study was to produce bioethanol through biochemical pathways from both young and old cellulosic fibers of thermochemically pretreated P. dactylifera L. [7,8]. Different techniques of pretreatment were used including physical, chemical, physicochemical and biological in order to improve hydrolysis rates. There are different pretreatment techniques including physical, chemical (alkali, acid, organosolv and ionic liquid), physicochemical (steam explosion, liquid hot water, AFEX and CO2 explosion) and biological [9,10,11]. In general, in these pretreatments, hemicellulose is hydrolysed, and cellulose and lignin are modified, and the values achieved can be improved by the enzymatic hydrolysis. Enzymatic hydrolysis is carried out using cellulases that attack specific sites of the complex lignocellulose biomass structure which cannot be hydrolysed by only one enzyme. In fact, with the synergy of different enzymes (cellulases, endo-1,4-ß-glucanases, exo-1,4-ß-glucanases and ß-glucosidases), cellulose can be hydrolysed into cellobiose, and afterwards ß-glucosidases hydrolyse cellobiose into d-glucose [12].
Subsequently, the released monomeric sugars are converted to ethanol by yeasts. Saccharomyces cerevisiae is the most used microorganism for ethanol production by hydrolyzing cellobiose into hexoses. Other species of yeasts have also shown fermentation capacity for ethanol production from pentoses (d-xylose and l-arabinose) e.g., Pichia stipitis, Candida shehatae, Candida guilliermondii and P. tannophilus, but their ethanol yields are lower than when S. cerevisiae converts hexoses into ethanol [13]. Finally, it has been observed that the continuous process with cell recycling is one good technique for ethanolic fermentation, because this process reduces substrate inhibition and offers higher productivity of ethanol. It also reduces the toxic effects of the components highly concentrated in the medium [14].
In the lignocellulosic biomass pretreatment processes, in addition to sugars, other compounds are generated that inhibit subsequent ethanolic fermentation with yeasts. In this sense, the main compounds generated are: acetic acid, furfural, 5-hydroxy-methyl-furfural (HMF) and phenolic compounds [15,16]. These compounds cause an inhibition per substrate that decreases the specific rate of ethanol production and the yield in this bioproduct. If the stage prior to fermentation is an enzymatic hydrolysis instead of acid hydrolysis, this inhibition effect is less, as has been observed in previous works using P. tannophilus in the fermentation process and fragments of olive stones as substrate [17,18,19].
The aim of this work was to produce bioethanol from both young and old cellulosic fibers from date palm, P. dactylifera L., by a thermochemical pretreatment using a pressure reactor, followed by an enzymatic hydrolysis and a subsequent fermentation process by a non-traditional yeast, such as P. tannophilus, that is resistant to inhibitors production during the process [17,18].

2. Materials and Methods

2.1. Raw Materials and Mechanical Pretreatment

Two kinds of waste cellulosic fibers, derived respectively from young and old date palm trees (Figure 1) were collected in Tozeur, south of Tunisia. The raw materials were dried at 55 °C ± 1 °C during 12 h in an oven type Borel, Mod. BLN300. After that, the samples were crushed by a hammer mill type Vert Saint Denkay, Mod. nf-6i-19ZSIII, in order to reduce fiber size and subsequently this material was sieved by selecting a specific particle range (Ø: 0.425–0.6 mm) using a sieve type. Retsch, mod. Vibro. Finally, the raw materials were stored in glass bottles until use.

2.2. Characterisation of Solid Fractions

The initial raw material, as well as the solid fractions samples from both thermochemical pretreatment and enzymatic hydrolysis, were analysed referring to standard protocols: moisture, insoluble acid lignin, holocellulose (cellulose and hemicellulose) and ash contents. All measurements were performed in duplicate.

2.2.1. Moisture and Volatile Matter

This parameter was determined by calculation of dry matter content for each of the samples using the standard TAPPI T11m-59 norm, evaluating the amount of water at 105 ± 1 °C during 48 h.

2.2.2. Ash Content (P1)

This measure was performed following the standard TAPPI T211 norm, where an incineration process of the samples at 550 ± 5 °C during 3 h in a muffle oven Thermolyne®, Type 1300, is required to determine mineral content.

2.2.3. Acid-Insoluble Acid, AIL (P3)

It was determined following the standard TAPPI T222 os-74 norm, according to which lignin content is defined as the insoluble fraction in 72% sulfuric acid (w/w).

2.2.4. Holocellulose Content (P2)

Neutral detergent fiber (NDF) and Acid detergent fiber (ADF) were determined following the method described by Van Soest and Wine [20].
NDF is the insoluble fraction, corresponding to lignin, cellulose and hemicellulose, which was obtained by subjecting the sample into a slow ebullition in a neutral detergent solution [20].
ADF corresponds to the insoluble fraction, consisting mainly of lignin and cellulose, obtained after subjecting the sample into a slow ebullition in an acid detergent solution [20].
From the percentages of NDF, ADF and AIL, cellulose and hemicellulose fractions were determined. Holocellulose includes hemicellulose and cellulose fractions.

2.2.5. Determination of Residual Solids Content (S)

After the thermochemical pretreatment process, the obtained dry solid phase was weighed (on dry basis). This quantity referred to the amount of dry raw material initially pretreated represents the residual solids content (S).

2.2.6. Structural Characterization of Cellulosic Fibers from Date Palm Fibers by ATR-FTIR

The detection of functional groups, as well as the molecule vibration related to the composition and the structure of both young and old cellulosic fibers, was determined through the non-destructive method of Attenuated Total Reflectance (ATR)-Fourier transform infrared spectroscopy (FTIR) [21]. The spectrum was recorded in transmittance mode at a spectral range of 4000 and 400 cm−1 with an accumulation of 25 scans and a spectral resolution of 0.1 cm−1, using an ALPHA FT-IR spectrophotometer with ATR-Platinum module, BRUKER®. The software used for spectrum acquisition was Opus 7.0.129 [22].

2.3. Characterisation of Liquid Fractions

The liquid fractions were characterised in terms of d-glucose, acetic acid, total reducing sugars concentrations and ethanol. All measurements were performed at least in duplicate.

2.3.1. d-Glucose Concentration (C1)

d-glucose concentration was determined by an enzymatic-colorimetric method following the protocol detailed by Trinder [23], using the commercial kit Trinder GOD-POD.

2.3.2. Acetic Acid Content (C3)

Acetic acid concentration was determined using an enzymatic-colorimetric method according to Bergmeyer and Möllering [24], using the enzymatic kit Cod. No 14826 of Böehringer Mannheim.

2.3.3. Total Reducing Sugars Determination (C2)

Total reducing sugars determination was performed using DNS method according to the protocol described by Miller [25].

2.3.4. Ethanol Production

Ethanol concentration was determined using a commercial kit proposed by Beutler and Michal method [26].

2.4. Experimental Methodology

2.4.1. Thermochemical Pretreatment

A full factorial experimental design 2k was employed in order to optimise thermochemical pretreatment conditions for young and old cellulosic fibers studying two factors, viz.: temperature (150 °C to 220 °C) and sulfuric acid concentration (0.00 M to 0.025 M) [27]. Eleven experiments were carried out, four of them performed in duplicate and a central one in triplicate. The responses were: residual solids content (S), ash measurement (P1), holocellulose content (P2), insoluble lignin (P3), d-glucose concentration (C1), total reducing sugars content (C2) and acetic acid concentration (C3).
The full factorial experimental design illustrates the different dilute acid pretreatment conditions (Figure 2). In order to determine the effect of the two factors on the seven responses, the regression coefficients Cr for each of the responses were calculated using Minitab® software, version 16.0.1, expressed by Equation (1) [28].
C r j   =   1 11   [ i   = 1 11 A i   Y j ]
where:
  • Ai—means either high (+) or low (−) level in experimental run i,
  • Yj—represents each of the response value for which Crj is determined (where j varies from 1 to 7).
If the regression coefficient has a positive sign, the correspondent factor therefore has a positive effect, and its high level will be held for the optimal experiment and vice versa [28]. Moreover, in order to study the relationship between the two factors and the seven responses, a first-order polynomial model exploring main effects of factors, was followed. The mathematical model for full factorial experimental design 2k was expressed by Equation (2) [28].
Y =   b o + i   = 1 k b i   X i
where:
  • bo—constant coefficient,
  • bi—linear coefficients,
  • Xi—factor,
  • k—number of factors (k = 2),
  • Y—predicted response value.
The dilute acid pretreatment experiment step was performed in a thermo-reactor of 2 L, type Parr® series 4522 (Moline, IL, USA), the latter offering the possibility of being loaded up to 0.5% of its capacity. In fact, it was loaded up with a reaction mixture at 10.0% of dry matter of young or old cellulosic fibers solid/liquid fraction about 1/10), 25 g fiber and 0.25 L H2SO4 solution.
Under agitation conditions of 250 rpm, the heating of reactor load was started until reaching the predetermined maximum temperature, which was maintained for 5 min. Subsequently, fast cooling was performed at the same time as decompression was carried out. Then, the reactor was covered with ice in order to lower its temperature to 25 °C, which was usually reached in 30 min. These operating conditions were selected in previous works [7,29].
Once the pretreatment is finished, the solid fraction was separated from the liquid by vacuum filtration; after water-washing, the solid fraction was dried and characterised by the methods described in Section 2.2. The liquid fraction was characterised in relation to d-glucose, TRS and acetic acid concentrations, according to the methodology indicated in the Section 2.3.
Otherwise, it is important to study the combination of the variables reaction time and temperature in a single parameter to correlate the severity of pretreatment with its efficacy; the parameter Ro, Equation (3), combines the effects of both variables in the auto-hydrolysis process of the different fractions that make up the lignocellulose material [30].
R o   =   0 t e T ( t ) T r w g   d t
where:
  • Tr—reference temperature (100 °C, base temperature for an initial process time t = 0), °C,
  • T(t)—function that relates temperature to residence time, °C,
  • t—residence time in reactor, min,
  • wg—fixed parameter (RTr2/Ea = 14.75, where R is the universal gas constant, and Ea is the apparent activation energy).
During the pretreatment with dilute acid, the severity factor (Log Ro) was determined using Mathematical 80 software, version 8.0.4.0, in order to evaluate the area of ‘time versus experiment temperature’ graphic using Simpson method.
Optimal conditions of the thermochemical pretreatment of young and old cellulosic fibers from date palms, which showed the higher percentage of holocellulose and minimum content in lignin, were then used for the subsequent enzymatic saccharification and fermentation processes.

2.4.2. Enzymatic Hydrolysis

The solid residues of both pretreated cellulosic fibers from date palm were enzymatically hydrolysed. Assays were performed in two batch reactors of Pyrex-glass jacketed, stirred-tank type, of 2 L capacity using citrate buffer solution (0.05 M and pH = 4.8). The enzymes used were cellulases, “Celluclast 1.5 L” commercial preparation of Trichoderma reesei, and β-glucosidase, “Novozym® 188” commercial preparation of Aspergillus niger, both provided by Novo Nordisk® Bioindustrial S.A. (Madrid, Spain). The cellulase activity of “Celluclast 1.5 L” was measured by filter paper assay and the activity was expressed in terms of Filter Paper Units (FPU) per gram of substrate. The enzymatic activity was 20 FPU per gram of substrate (cellulase activity) and 10 International Units (IU) per gram of substrate (β-glucosidase activity). Cellulase activity was determined following the standard procedure recommended by the Commission on Biotechnology, IUPAC [31]. During enzymatic saccharification, optimal conditions followed for young cellulosic fibers were 33.33 FPU of cellulases and 336.8 IU of β-glucosidase, and 36.6 FPU of cellulases and 356.4 IU of β-glucosidase for old cellulosic fibers. These experiments were carried out at 50 °C, during 72 h and under stirring conditions of 450 rpm. These operating conditions of the enzymatic hydrolysis processes were selected in previous works [7,29]. A sample of 2 mL was taken every 8 h for three days, in order to analyse TRS, d-glucose and acetic acid concentrations. Finally, the solid fraction was separated from the liquid by vacuum filtration and centrifugation using refrigerated centrifuge Jouan, Mod. MR 18 22. After, the solid fraction was washed, dried and characterised. On the other hand, the liquid hydrolysate was conducted to a fermentation process.

2.4.3. Fermentation

The non-traditional yeast, P. tannophilus ATCC 32691, was stored at 15 °C in 0.1 L test tubes on a sterilized solid culture medium that contained yeast extract (3 g/L), malt extract (3 g/L), casein peptone (5 g/L), d-xylose (10 g/L) and agar-agar (20 g/L). At the beginning of each experiment the microorganisms were inoculated under sterile conditions into glass test tubes and cotton closures containing the solid culture medium described above. These tubes were kept in an incubator at 30 °C for 72 h to obtain cells at the same growth stage for every experiment. Then, the yeast was resuspended into 100 mL of sterile ultrapure water until reaching an initial concentration of 0.1 g/L. Assays were performed in two discontinuous reactors, stirred-tank type, of 2 L of capacity. Experiments were carried out at 30 °C, pH = 4.5 and under stirring conditions of 450 rpm [32]. The hydrolysates (0.5 L) were enriched with the following nutrients: yeast extract (2 g/L), casein peptone (1.8 g/L), (NH4)2SO4 (1.5 g/L), MgSO4·7H2O (1 g/L), KH2PO4 (1 g/L) [33]. During the fermentation, liquid samples of 5 mL were collected at different time intervals for being analysed in ethanol production and sugar consumption (d-glucose and TRS). In the fermentation processes d-glucose, d-xylose, l-arabinose, d-galactose, d-manose and d-fructose concentration were also determined by high-performance-liquid-ionic-chromatographic (HPLIC) using an amperiometric detector, Dionex ICS-3000 (Sunnyvala, CA, USA).

3. Results and Discussions

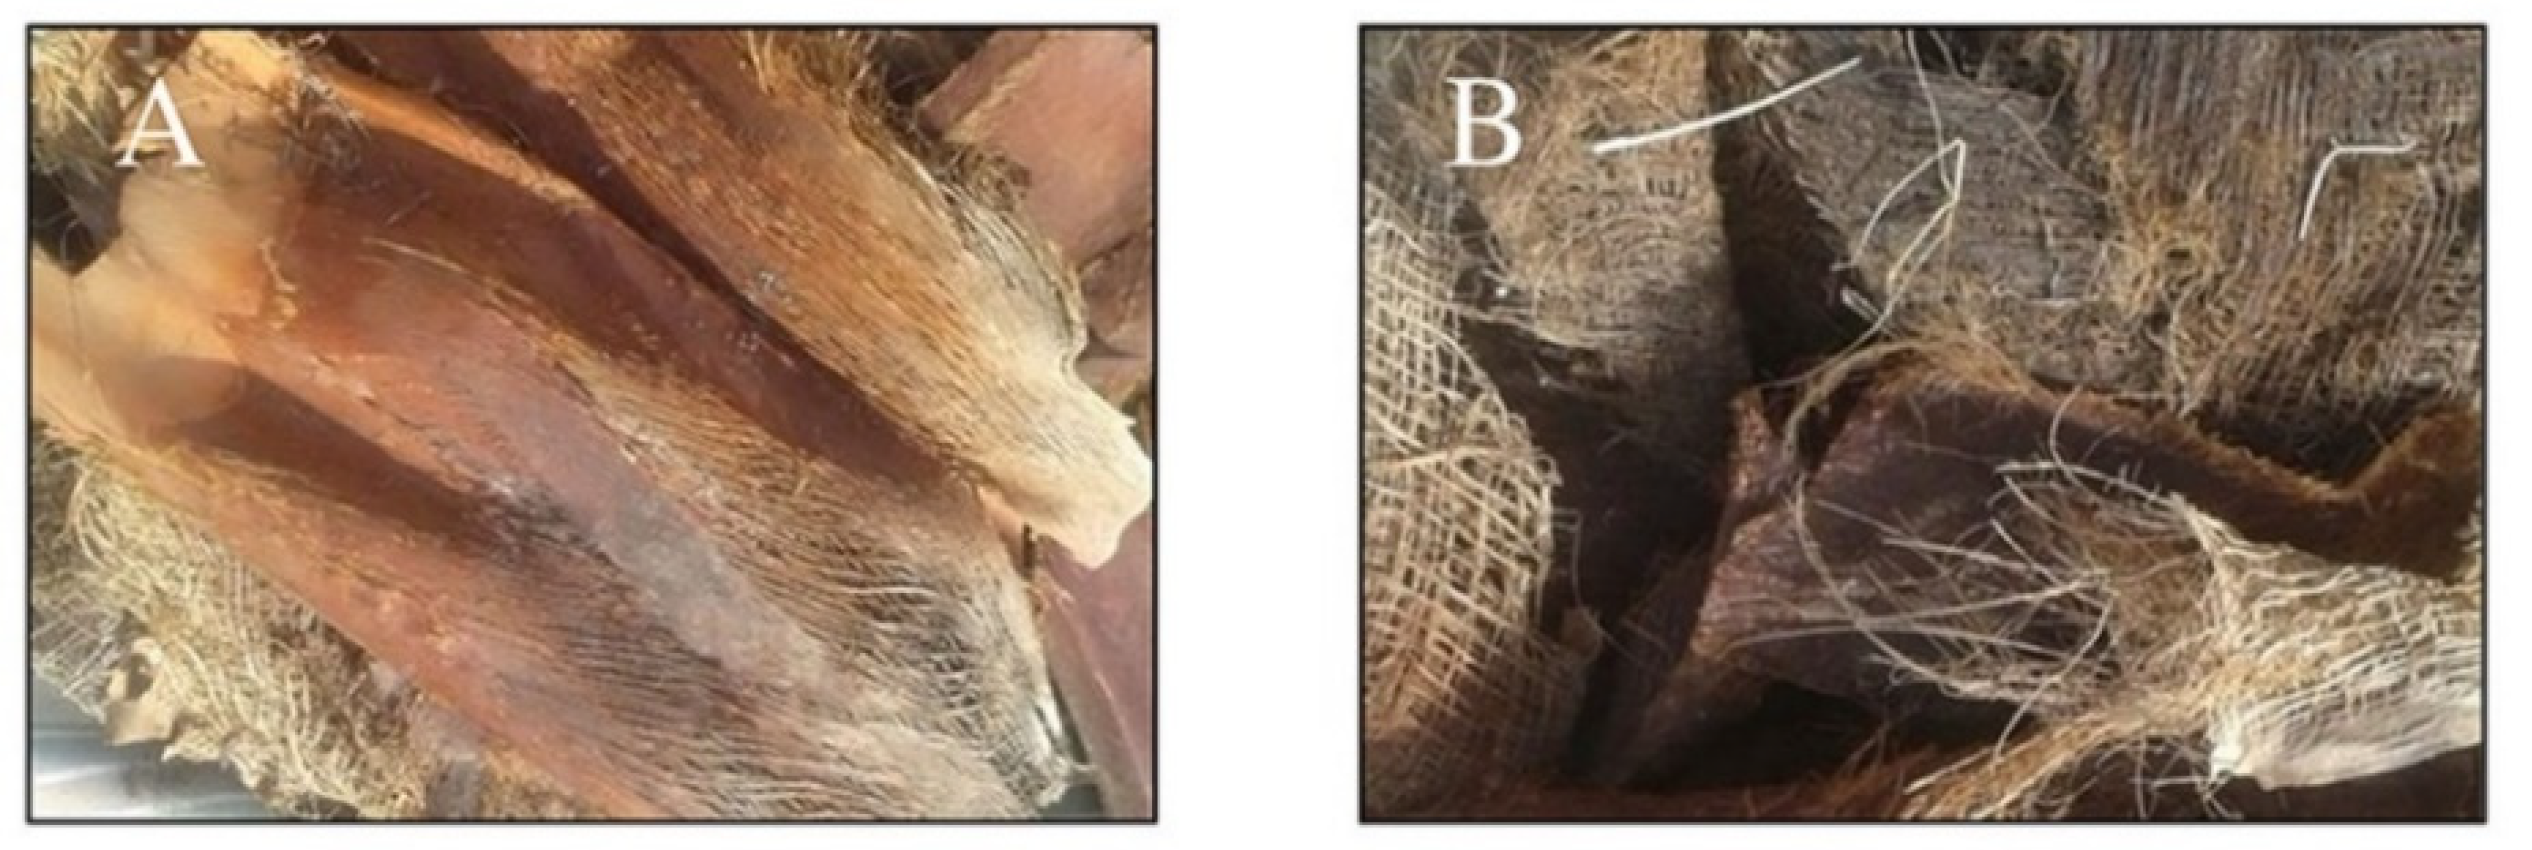
3.1. Physico-Chemical Characterisation of Crude Fibers

The main component in both types of cellulosic fibers from date palm is the cellulose, then lignin and hemicelluloses (Table 1). In young cellulosic fibers, it was achieved a cellulose content of 57.42%, and 62.31% for old cellulosic fibers. These results were similar to those cited in a previous research [34]. In fact, old cellulosic fibers were more lignified, at 21.12%, than young ones, at 13.44%.
However, the high percentage of lignin presents a real problem for access of lignocellulolytic enzymes into the interior lignocellulose structure [35]. Furthermore, the low percentage of mineral material in both types of cellulosic fibers explains that the raw material has a low capacity to produce ash during its combustion. Cellulosic fibers from date palm are the richest lignocellulose biomass in terms of cellulose compared to other biomasses, like: rosemary [36], olive stone [37], and olive pomace [38], which are more lignified than cellulosic fibers from date palm. It is also richer in cellulose content than wheat straw [39] and sugarcane bagasse [40].
Thus, this high content of cellulose of the cellulosic fibers from date palm waste makes it a potential source of cellobiose and fermentable monomeric sugars, which could be liberated during pretreatment and enzymatic hydrolysis steps, in order to produce bioethanol. In general, low concentrations of lignin, particularly in the cellulosic fibers from date palm, decrease the liberation inhibitors that block the activities of enzymes and microorganisms, during saccharification and fermentation processes, respectively [41].

3.2. Structural Characterisation of Cellulosic Fibers from Date Palm Fibers by ATR-FTIR

In order to track the structure of both young and old cellulosic fibers of ‘
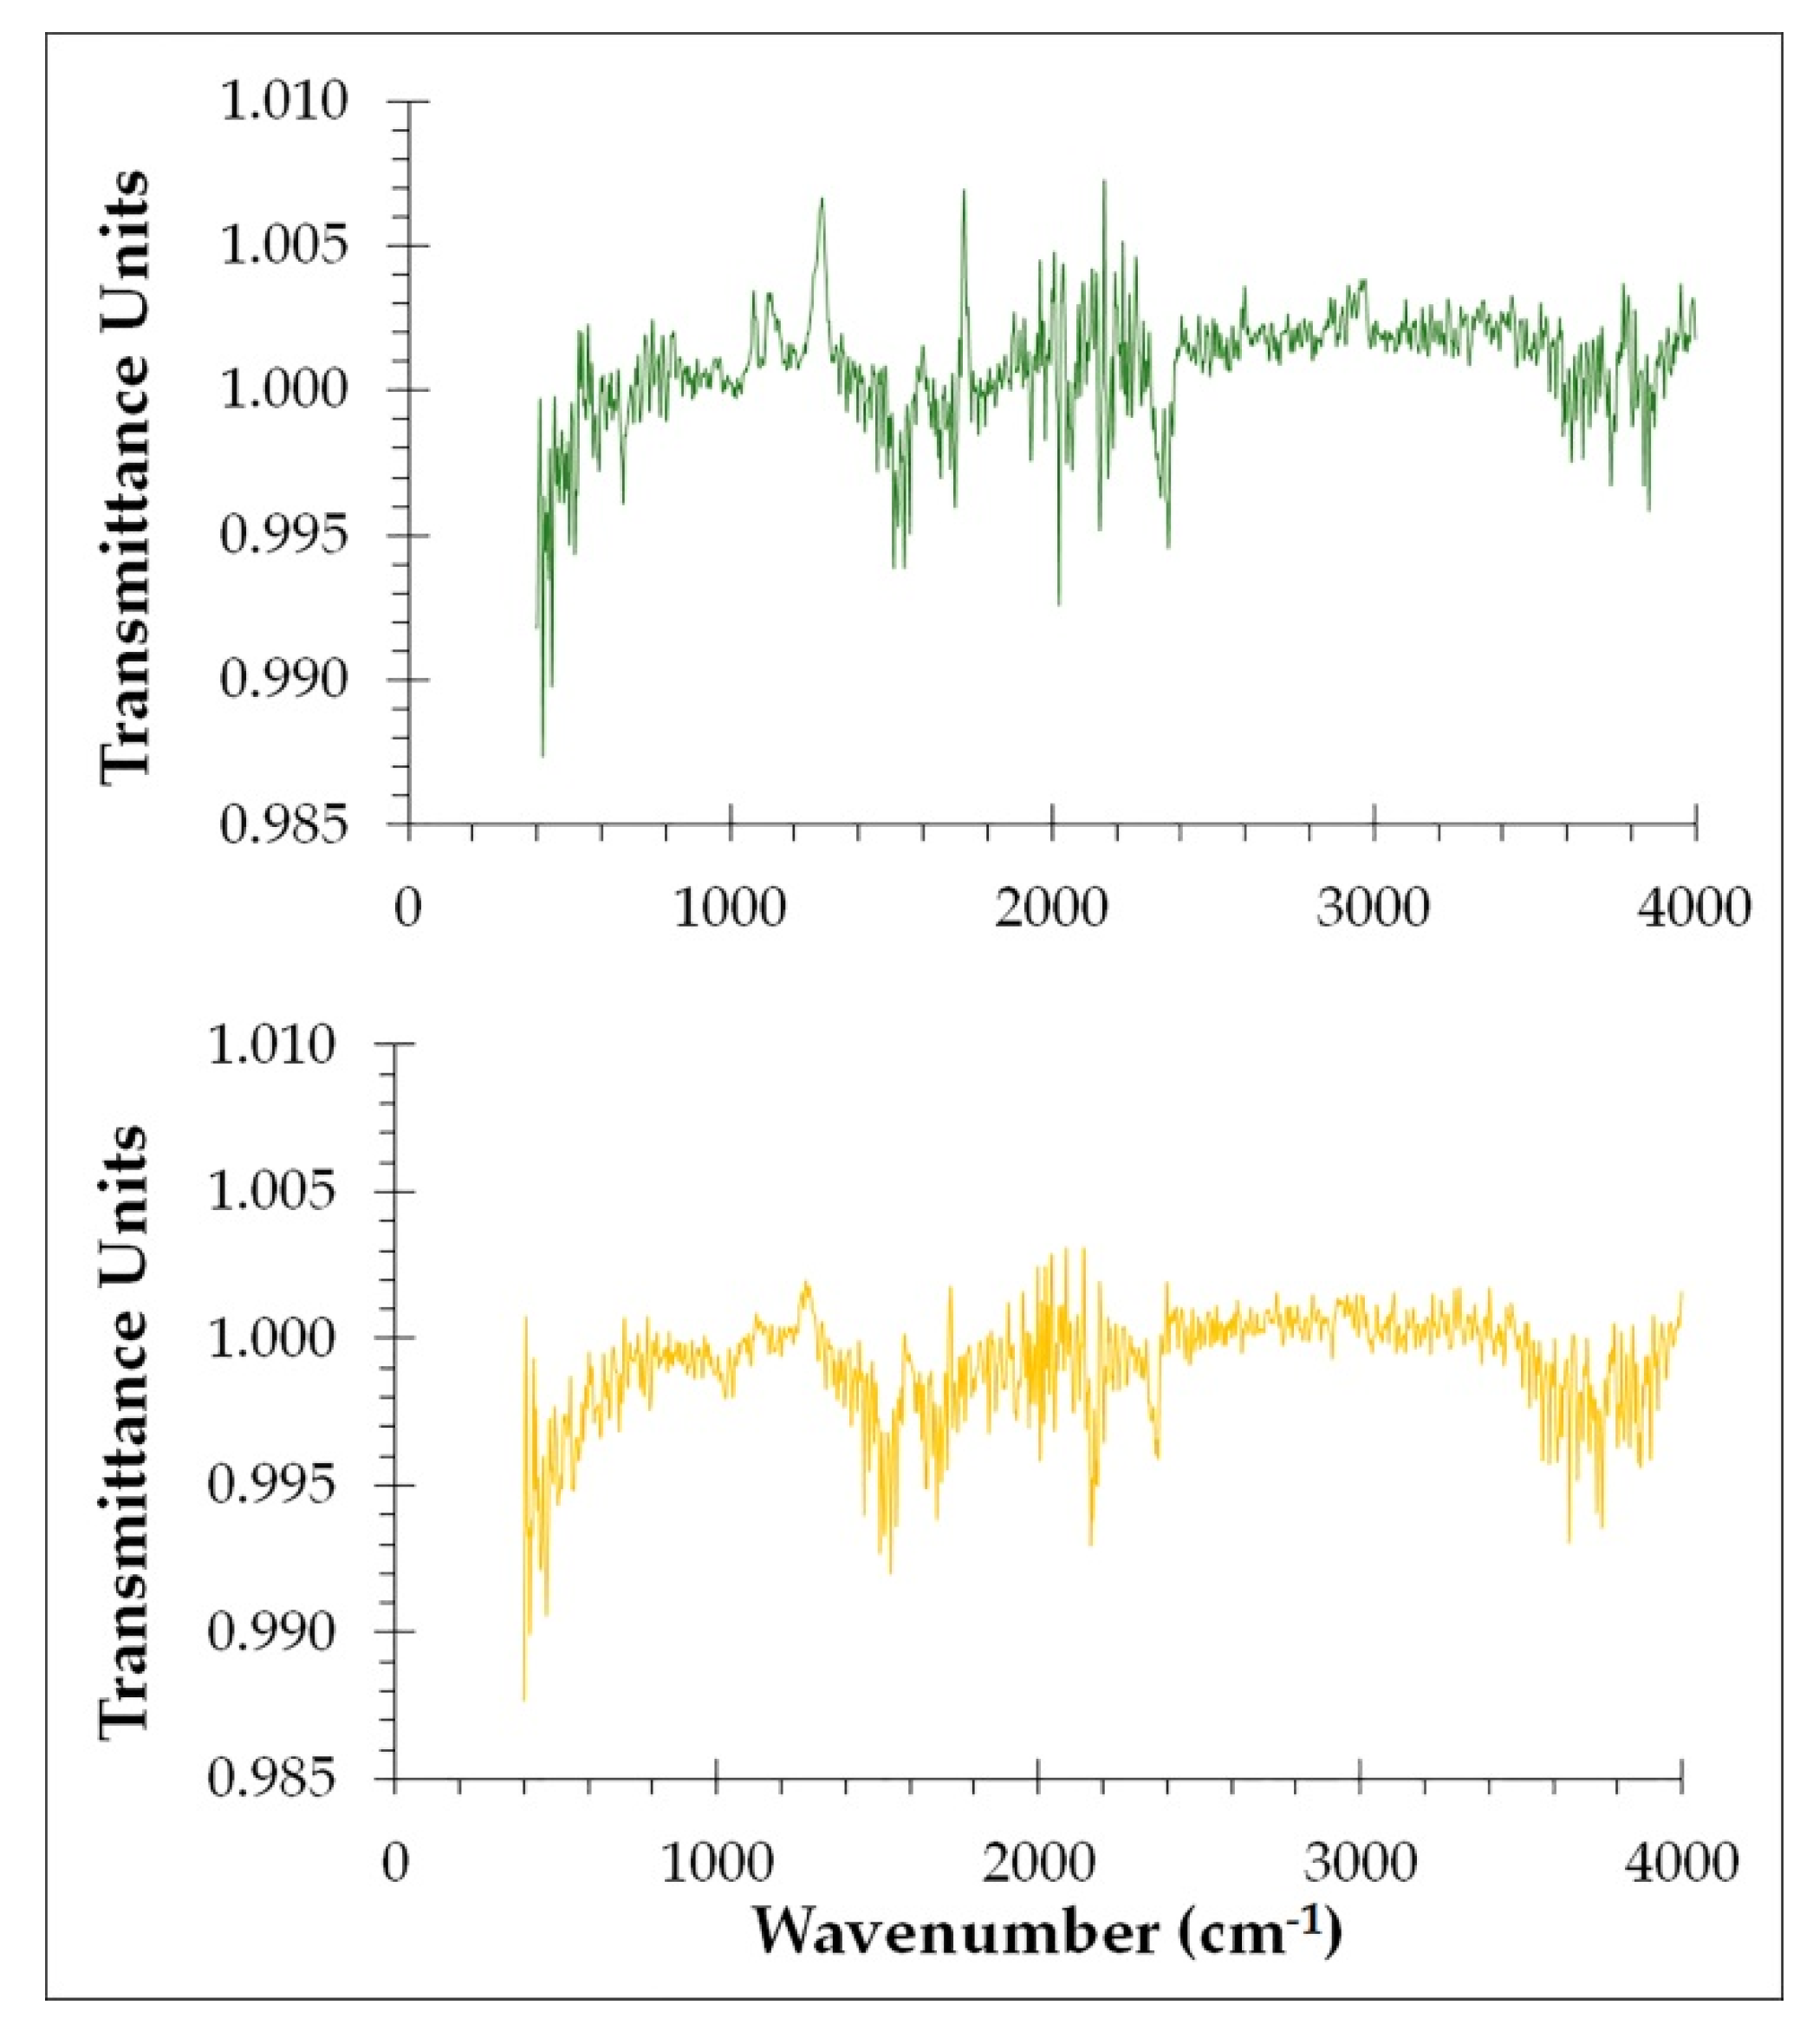
P. dactylifera L.’ ATR-FTIR spectroscopy was employed to explore functional groups and molecular vibration detection (Figure 3). This method has the ability to identify or characterise both the organic and inorganic components of a sample. The idea behind this analysis method is that no two molecules that are structurally different will produce the same infrared spectrum, which is useful in positively identifying samples. Different samples have different compositions, resulting in various infrared absorption band intensities at different wavenumbers, which allows for the characterization and comparison of samples. In base of previous research bibliographic review [21,22,42], band identification was performed.
Many bands were associated with lignin for young cellulosic fibers from date palm (Figure 3, green lines); the bands located in the regions 3518 cm−1 and 3697 cm−1 were assigned to O-H stretching vibration. Indeed, another region at 2970 cm−1 was attributed to C-H stretching vibration of lignin. On the other hand, the presence of extractive compounds in young cellulosic fibers from date palm was proved by stretching vibration bands of the functional groups C-O, C-C or C=C, and C=O observed at 1271 cm−1, 1529 cm−1 and 1730 cm−1, respectively. Furthermore, the functional group associated with the free ester of hemicellulose of young cellulosic fibers from date palm was highlighted through the vibration bands located at 1726 cm−1. Moreover, C-H bending vibration was shown at 1285 cm−1, which was an indicator of the crystalline cellulose presence in young cellulosic fibers.
In relation to the spectrum obtained from old cellulosic fibers (Figure 3, yellow lines), it shows many functional groups of lignin located at different wavenumbers. In fact, bands located at 3578 cm−1, 1665 cm−1, 1583 cm−1, 1513 cm−1, 1467 cm−1, 1280 cm−1 and 835 cm−1 correspond to O-H stretching vibration, C=O stretching vibration (unconjugated), aromatic ring and C=O stretching vibrations, C-C and C=C stretching vibrations, C-H deformation vibration, aromatic ring vibration of guaiacyl lignin, and O-H or C-H deformation of lignin, respectively. Moreover, the functional groups of extractives of old cellulosic fibers from date palm are shown through the vibration bands located at 1730 cm−1, 1510 cm−1 and 1271 cm−1, which were attributed to C=O, C-C+C=C, and C-O stretching vibrations, respectively. Likewise, hemicellulose and crystalline cellulose of old cellulosic fibers from date palm are highlighted through their C=O stretching vibration bands (ketone/aldehyde) and C-H bending vibration bands, respectively, which were shown at 1726 cm−1 and 1280 cm−1, in each case. Thus, the conclusions about chemical structure characterisation obtained from ATR-FTIR spectroscopy confirm the lignocellulose nature of both young and old cellulosic fibers. In fact, these results are similar to those reported from ATR-FTIR spectroscopy for date palm ‘P. dactylifera L.’ leaflets and rachis in a hydrothermal pretreatment of this feedstock studied in order to enhance enzymatic digestibility and bioethanol potential [43].
Similarly, in a previous study to improve bioethanol production from corn stover [44], the results reported from FTIR spectra were similar to those obtained during this study. The same tendency was shown from FTIR spectroscopy when greenhouse residues were used as raw material to improve methane production [45].

3.3. Thermochemical Pretreatment of Cellulosic Fibers from Date Palms

After thermochemical pretreatment, dry solid residues were characterised by the methods described in ‘Characterisation of solid fraction’, determining percentages in residual solids (S), ash (P1), holocelluloses (P2) and insoluble lignin (P3) for both young and old cellulosic fibers from date palms (Table 2 and Table 3, respectively). In relation to hydrolysates obtained (liquid fraction), they were analysed in d-glucose (C1), TRS (C2), and acetic acid (C3) for both types of pretreated cellulosic fibers from date palm (Table 2 and Table 3).
In the case of young cellulosic fibers, higher values of severity factor (Log Ro) were reached due to severe conditions (greater concentrations of sulfuric acid and higher temperatures during pretreatment). Furthermore, as the pretreatment temperature was increased, lower residual solids content (S) values were determined (Table 2); therefore, this implied a higher percentage of solids solubilisation. This fact could be attributed to the hemicelluloses hydrolysis. In relation to the percentage of insoluble lignin (P3), it was higher in severe conditions; in fact, the maximum percentage of AIL, 82.13%, was achieved when log Ro = 6.58 (220 °C, H2SO4 0.05 M). The minimum percentages in holocelluloses were reached at 185 °C and H2SO4 0.0125 M in the central point of experimental design (10.61%, 13.05% and 13.35%), Table 2; however, a minimum in holocelluloses, close to 10.0%, was reached at 220 °C and H2SO
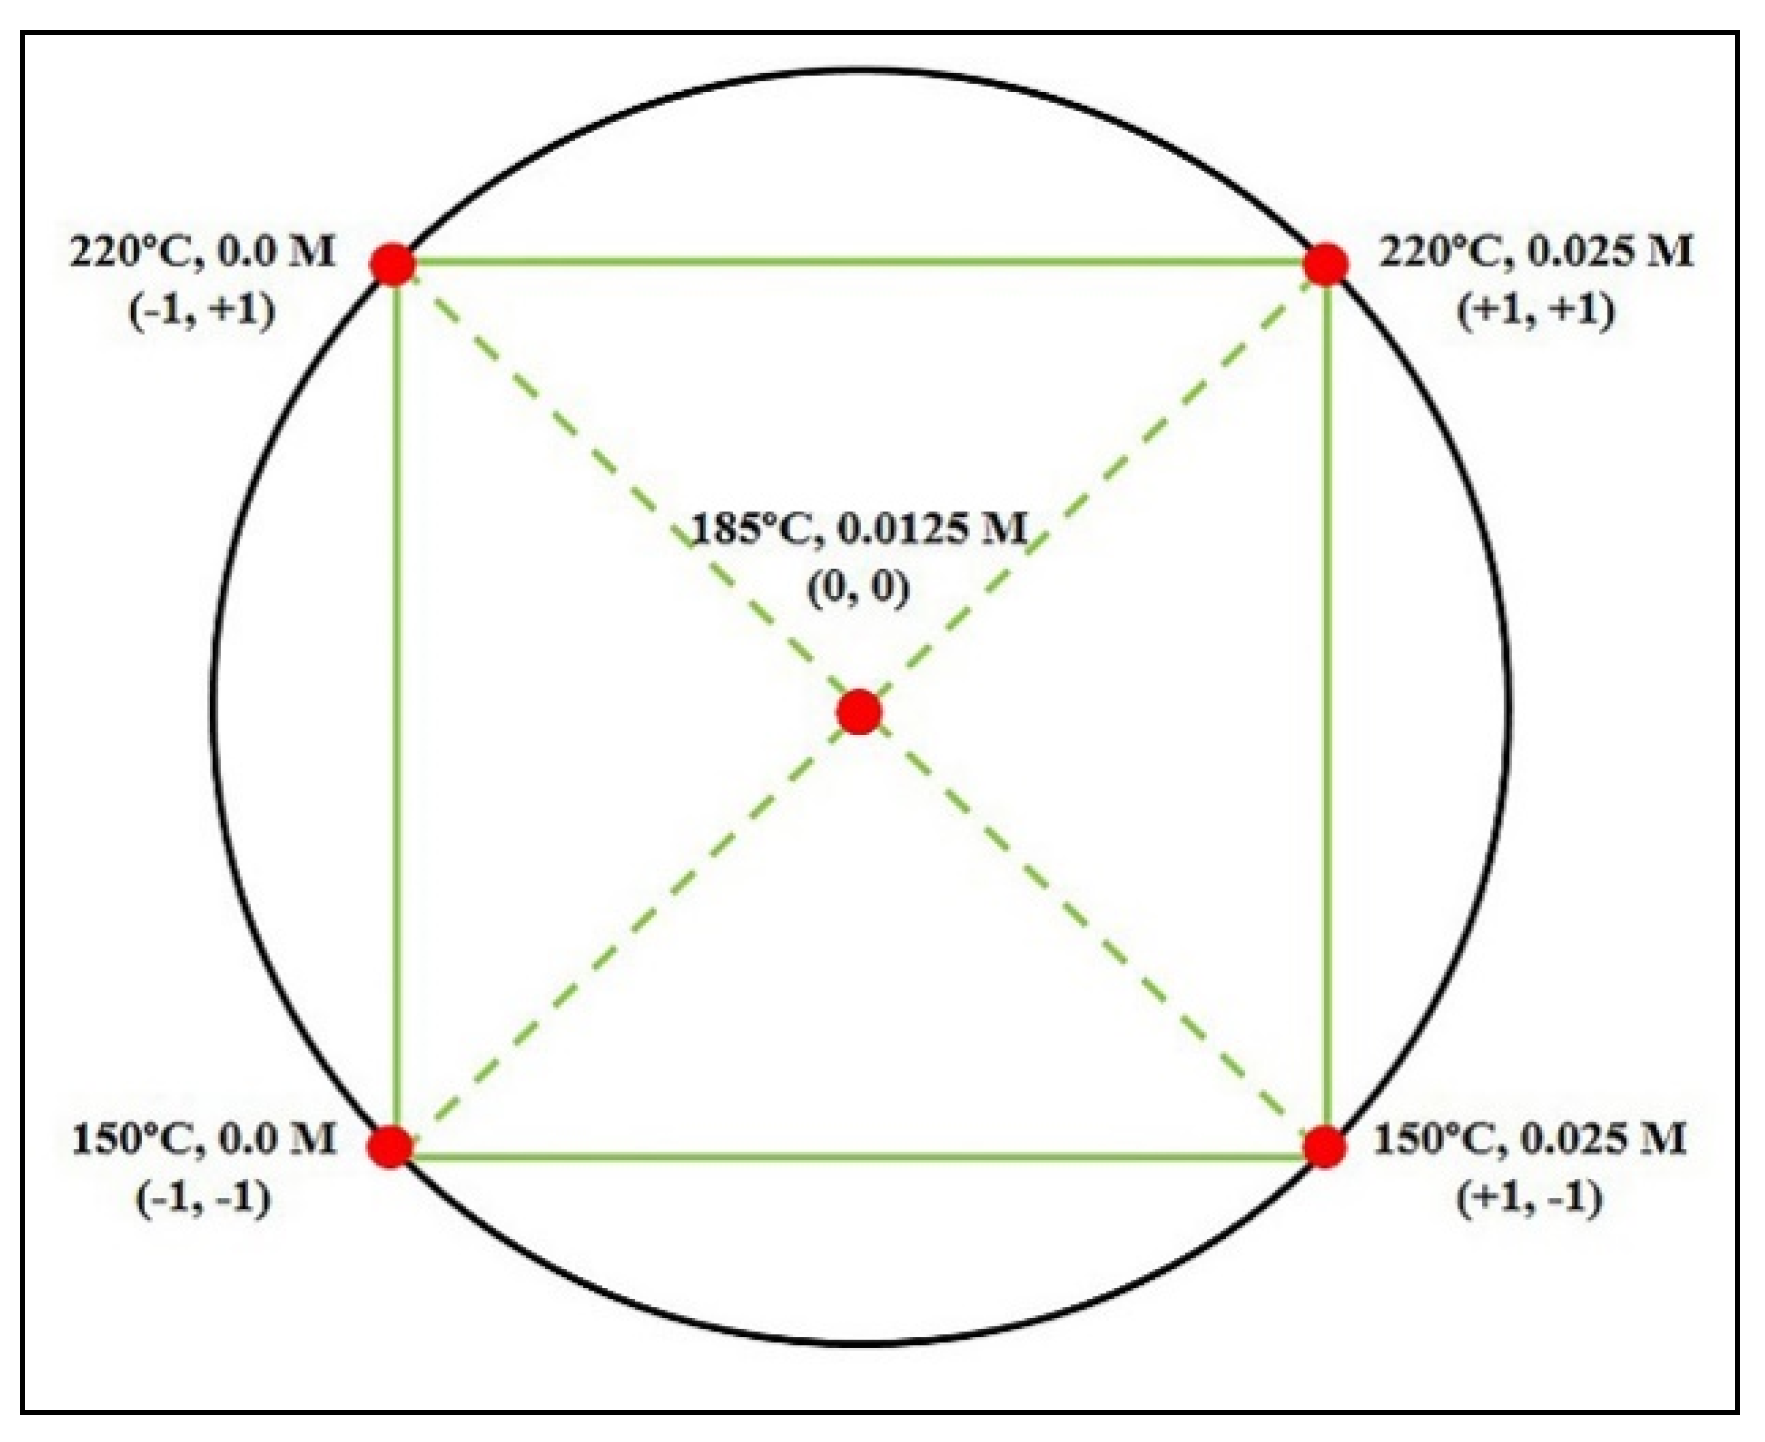
4 0.025 M. According to the full factorial experimental design matrix, Figure 2, the maximum concentrations of TRS, 3.17 g/L and 3.98 g/L, were determined at 220 °C and without sulfuric acid, and 150 °C and H2SO4 0.025 M, respectively, Table 2.
During old cellulosic fibers thermochemical pretreatment, the higher values of residual solids content (95.26%, 94.16% and 94.58%) were achieved at 185 °C and concentration of sulfuric acid 0.0125 M, Table 3; these medium conditions could be considered severe.
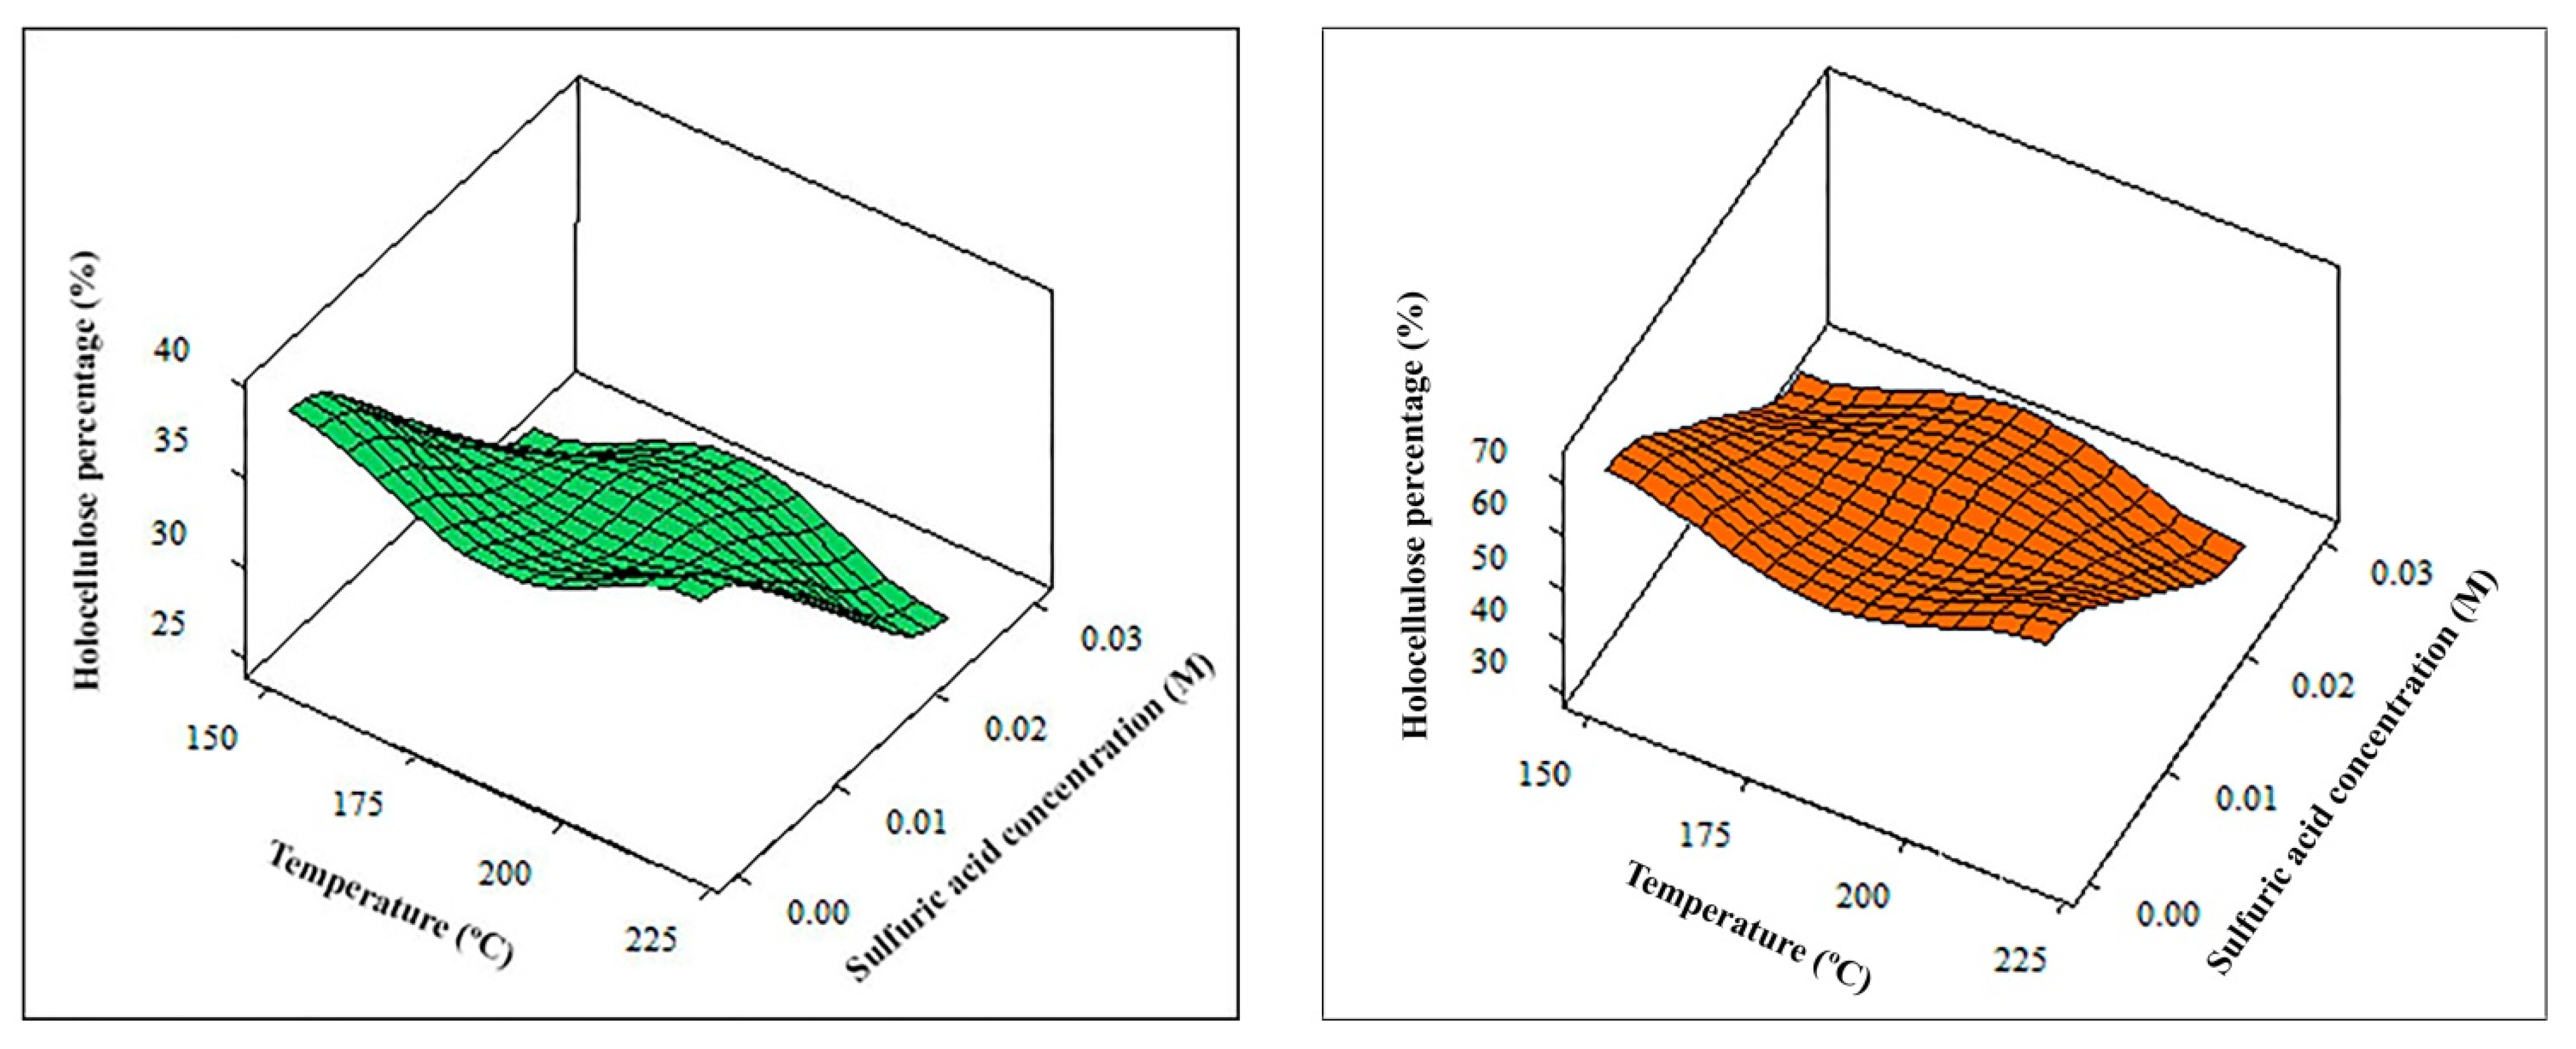
In general, when the pretreatment was carried out at fixed of H2SO4 concentration, the percentage in holocellulose decreased as the temperature was increased; percentages of holocellulose contents were maximum at 185 °C and H2SO4 0.0125 M in the central point (17.80%, 17.52% and 17.35%) (Table 3). On the other hand, logically, contrary behavior was observed respect to insoluble lignin content; in fact, percentage of IAL increased at higher temperatures. Moreover, at 220 °C and hydrothermal conditions (0.0 M H2SO4), the percentage of holocelluloses and lignin was 61.97% and 37.22%, respectively (Table 3). These data proved that severe conditions of thermochemical pretreatment enhanced the digestibility of the complex carbohydrates in order to produce monomeric sugars. In fact, the major concentration of reducing sugars, 2.06 g/L, was achieved in the thermochemical pretreatment carried out at 220 °C and H2SO4 0.0 M (Table 3).
Maximum percentages in holocellulose were reached in hydrothermal conditions, at 220 °C for young pretreated cellulosic fibers (45.18%) and 150 °C for old pretreated cellulosic fibers (67.00%) (Table 2 and Table 3, respectively). The minimum percentages of insoluble lignin were achieved in hydrothermal conditions, at 220 °C for young pretreated (58.30%), and 150 °C in case of old pretreated cellulosic fibers (27.49%). Fang et al., in at hydrothermal pretreatment of the date palm Phoenix dactylifera L. leaflets and rachis, determined at 210 °C the highest lignin content in pretreated leaflets (64.95%) and in pretreated rachis (45.95%) [43].
The maximum concentration of acetic acid, 0.56 g/L, was reached for old fibers at 220 °C and H2SO4 0.0 M (severity factor = 6.65), while d-glucose concentration in these conditions was very small, 0.08 g/L.
The relationship between each response (log Ro, S, P1, P2, P3, C1, C2 and C3) and each factor (temperature and sulfuric acid concentration) was expressed referring to the coded model described in section ‘Experimental methodology’. Table 4 and 
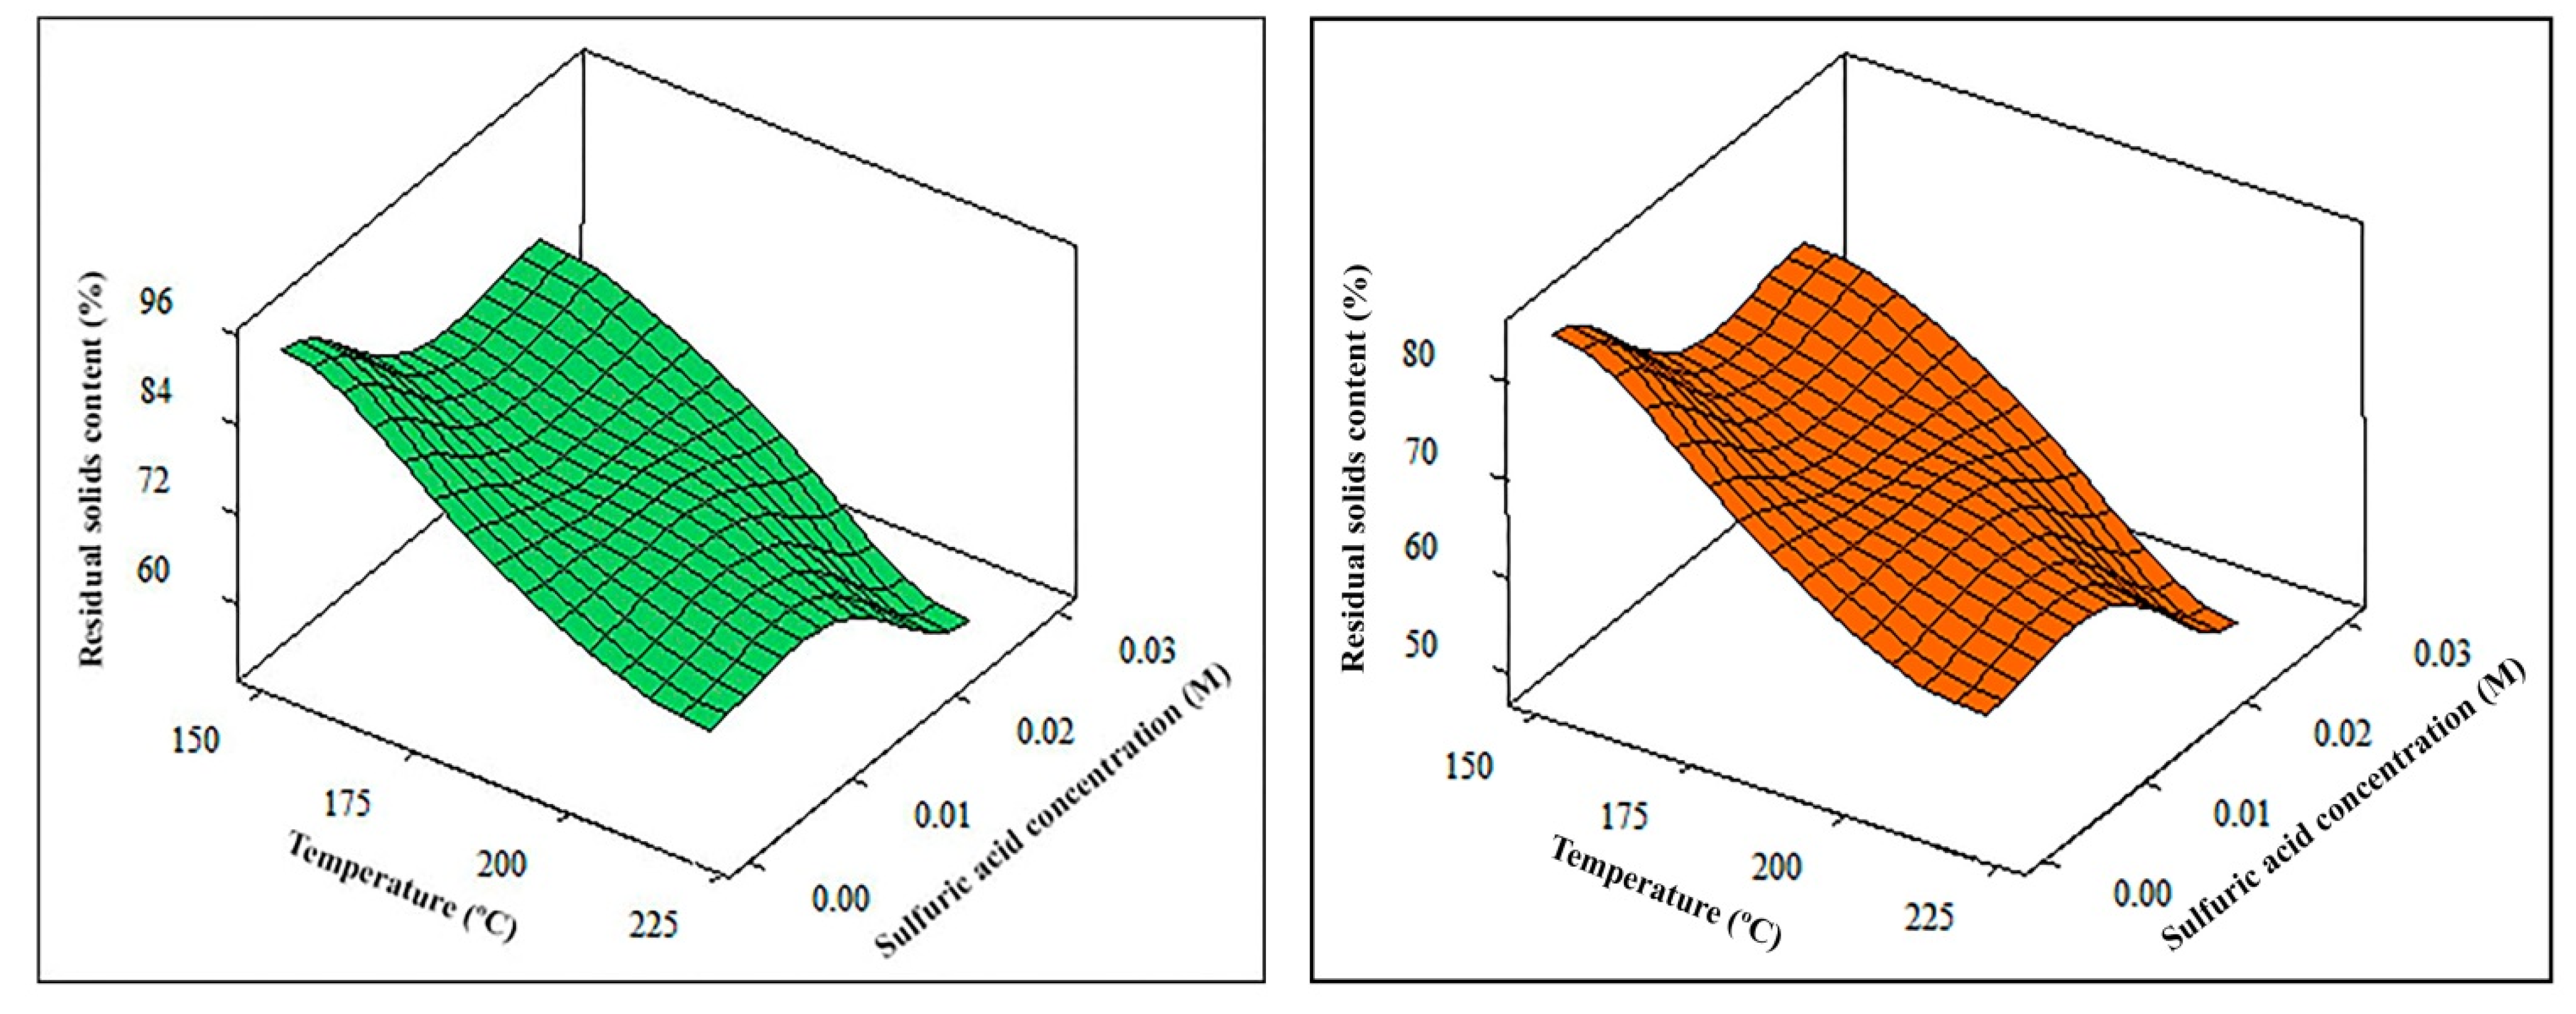
Table 5 show the empirical equations for each response and the adequate optimal conditions for the thermochemical pretreatment of young and old cellulosic fibers. By way of example, the adjustments made for the fraction of residual solids and holocellulose contents are represented in Figure 4 and Figure 5, respectively.
Comparing the results obtained for the pretreatment of young and old cellulosic fibers with other lignocelluloses feedstock, it is possible to conclude that our substrate is the best one to conduct the subsequent enzymatic saccharification. In this sense, the solid fractions of the olive stones pretreated at 220 °C with a solution of sulfuric acid 0.025 M, are composed by 56.8% of lignin and 17.4% of holocelluloses [37]. On the other hand, rosemary fibers, pretreated at 150 °C and with 0.025 M of sulfuric acid, generated 17.0% of lignin and 81.0% of holocelluloses [36].
As a result of the previous experiments of both young and old cellulosic fibers, the optimal pretreatment conditions prior to the enzymatic hydrolysis are 220 °C without acid; it is justified due to the significant amount of holocellulose under operation conditions (Table 2 and Table 3). These results are similar to those obtained in a previous research refereed to hydrothermal pretreatment of date palm Phoenix dactylifera L. leaflets and rachis [42]; in this case, the process was carried out under optimal conditions of hydrothermal pretreatment (210 °C for 10 min), these being the best conditions to enhance enzymatic digestibility and later bioethanol production.

3.4. Enzymatic Hydrolysis

Pretreatment is a step to improve the enzymatic digestibility of highly crystallised lignocellulosic biomass [46]. Thus, in order to produce d-glucose, an enzymatic hydrolysis of the solid fractions from the pretreatment step has been carried out, which was performed under optimal conditions at 220 °C and H2SO4 0.0 M (maximum TRS concentrations). During the enzymatic hydrolysis, liquid samples were taken in order to analyse the concentrations of TRS and d-glucose, for both young and old cellulosic fibers (Figure 6); moreover, acetic acid concentration was determined for each type of cellulosic fibers.
At the beginning of enzymatic hydrolysis TRS concentration increased. After a 48 h process, TRS concentrations decreased for both pretreated young and old cellulosic fibers (Figure 6). In fact, in the case of young cellulosic fibers, initial TRS concentration, 2.7 g/L, increased to 31.2 g/L at 48 h and decreased to 20.1 g/L after 72 h of enzymatic hydrolysis (Figure 6). The same tendency was observed in d-glucose concentration for both young and old cellulosic fibers (Figure 6). During enzymatic hydrolysis of pretreated old cellulosic fibers, initial d-glucose concentration, 1.6 g/L, increased until reaching 24.6 g/L at 48 h; from this point of the process a decrease of d-glucose concentration was observed (18.4 g/L at 72 h), Figure 6.
These diminutions can be due to the inhibitors (among them acetic acid and furfural) released during the pretreatment stage, or could it be due to microbial (contaminant) activity, such as an unwanted fermentation of d-glucose. The inhibitors presence has a negative influence in the process since it reduces the activity of cellulases and, with it, the production of d-glucose [47].
During enzymatic hydrolysis, maximum TRS yields (YTRS) were reached at 48 h for both pretreated cellulosic fibers from date palms, 0.46 g TRS/g dry pretreated young fiber, and 0.49 g TRS/g dry pretreated old fiber. Furthermore, maximum d-glucose yields (YG) were determined at 48 h for both young and old cellulosic fibers (0.31 g d-glucose/g dry pretreated young fiber and 0.35 g d-glucose/g dry pretreated old fiber, respectively).
During enzymatic hydrolysis, acetic acid concentration increased until reaching 2.5 g/L and 2.1 g/L at 72 h for young and old cellulosic fibers, respectively.

3.5. Fermentation Process

Fermentation assays of hydrolysates of pretreated young and old cellulosic fibers, derived from the enzymatic hydrolysis, were carried out by P. tannophilus yeast. The concentrations of d-xylose, l-arabinose, D-mannose and D-galactose were determined at the beginning and end of the fermentation processes. Their concentrations were very small and at the end of the fermentation process it was found that they were completely consumed except for d-xylose and l-arabinose (Table 6).
During the fermentation of the hydrolysates by P. tannophilus yeast, ethanol was produced until reaching a maximum concentration, 12.40 g/L for young fibers and 10.20 g/L for old fibers, after 6 h and 7 h of fermentation. After that, there was a decrease in ethanol concentration, which could be explained by the evaporation of this product as well as its possible consumption by the yeast (metabolic routes).
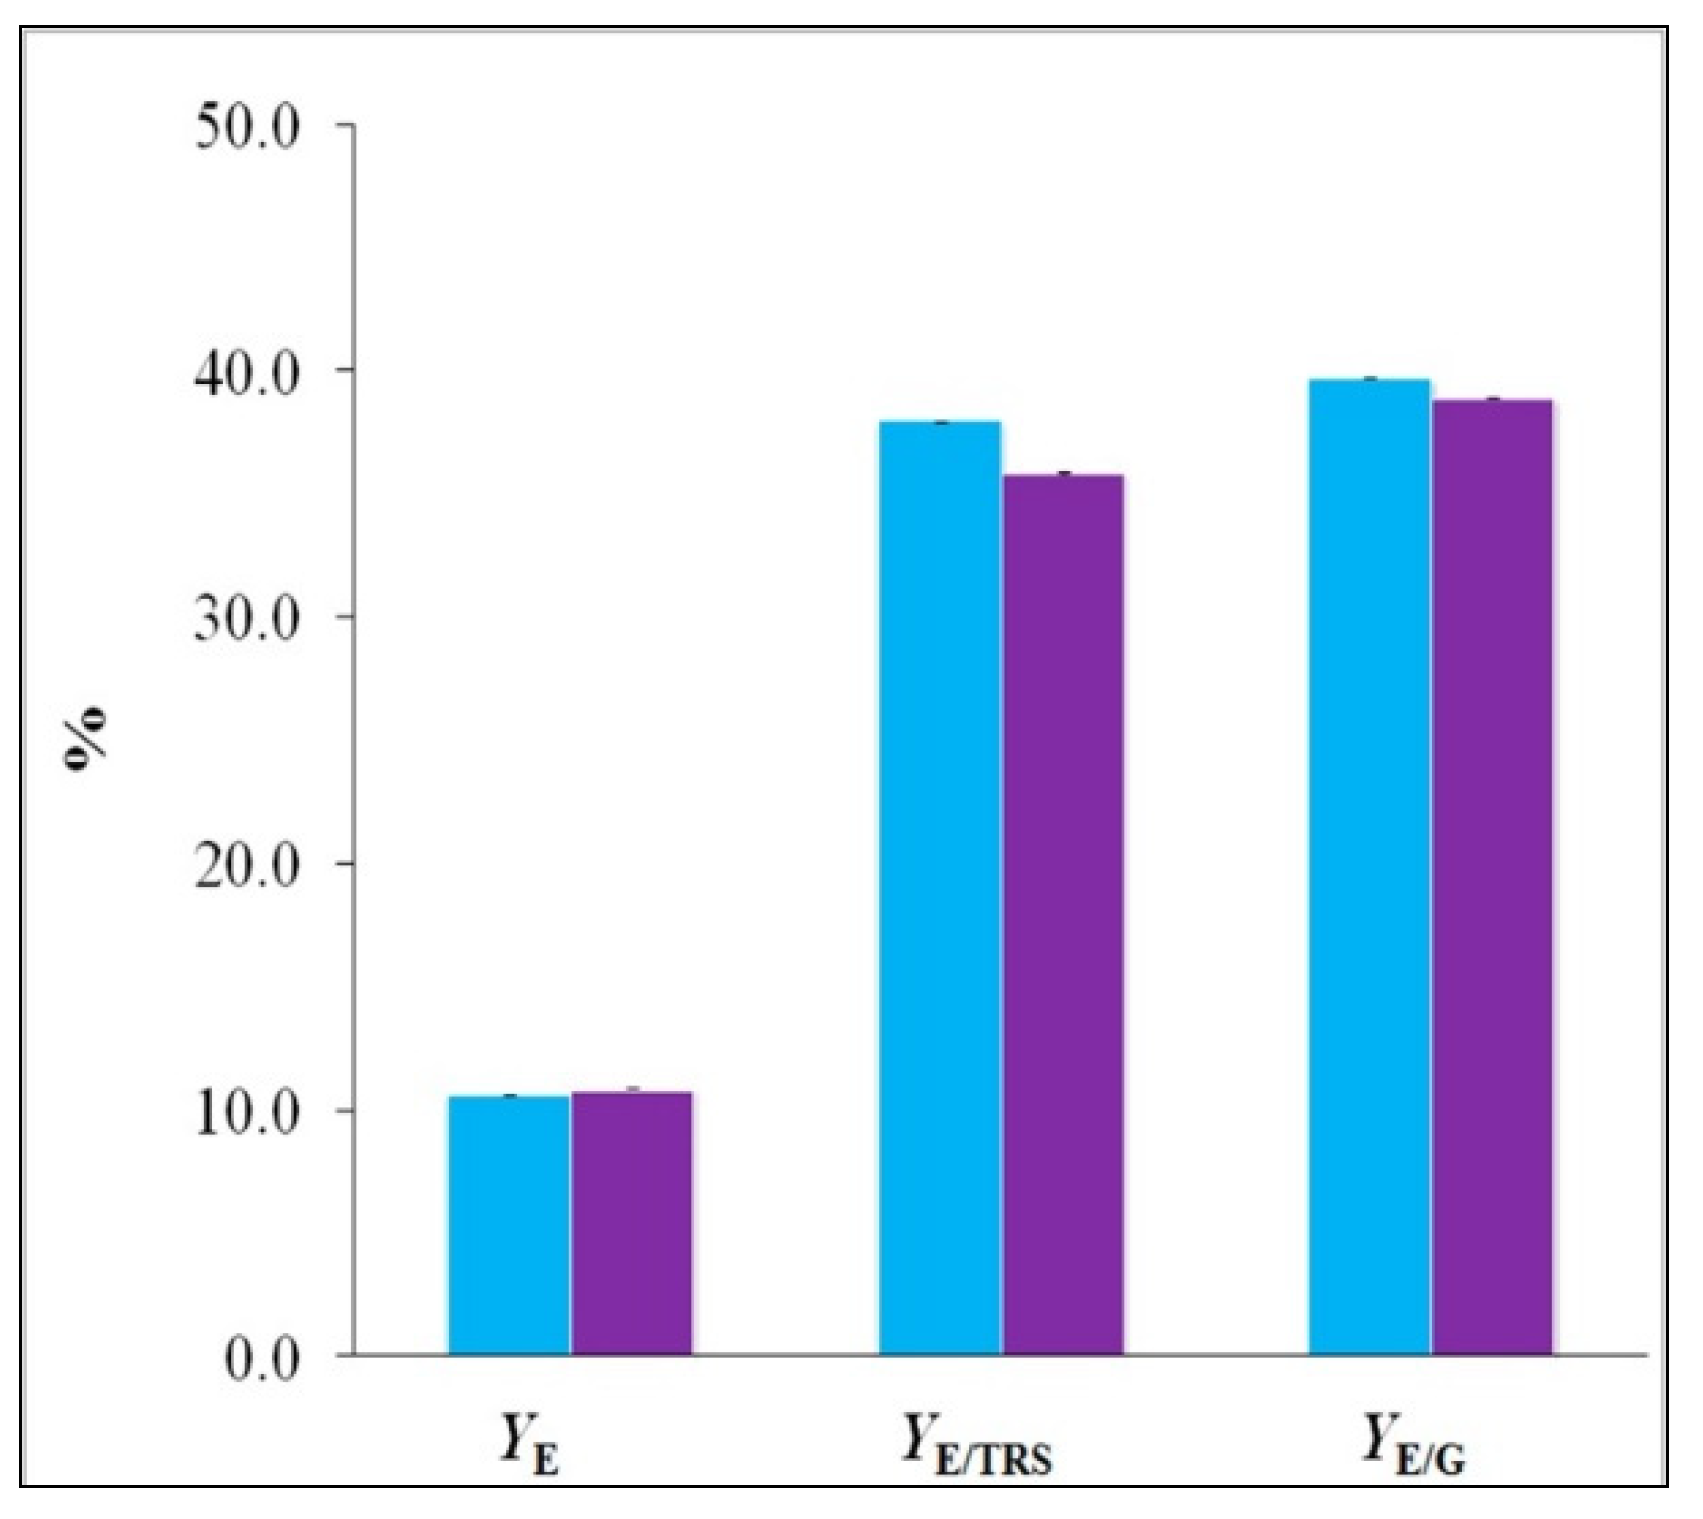
If the complete process is considered, from the initial raw material to the bioproduct production, ethanol yields (YE) were 10.64 g ethanol/100 g of dry fiber for young fibers and 10.88 g ethanol/100 g of dry fiber for old fibers (Figure 7). These values are similar to those obtained for ethanol yields in the fermentation of olive stones by P. tannophilus [37].
Ethanol yields referred to TRS (YE/TRS) and d-glucose consumption (YE/G) were 37.94 g ethanol/100 g TRS and 39.68 g ethanol/100 g d-glucose, respectively, for young cellulosic fibers from date palm; in case of old cellulosic fibers, it was reached 35.84 g ethanol/100 g TRS and 38.90 g ethanol/100 g d-glucose. It should be noted that these obtained yields are high, and considering the theoretical yield (or Gay-Lussac yield) referred to d-glucose (0.511 g ethanol/g d-glucose) the YE/G for young fiber represents 77.7% of the theoretical yield and for old fiber 76.1%. In previous studies that referred to microbial fermentation of juice extracted from sugarcorn plants in order to produce ethanol [48], it was reached similar values in ethanol yield. In fact, sugarcorn juice used in the study contained a maximum of 145 g/L carbohydrates, with sucrose, d-glucose and D-fructose accounting for 80% of the sugars. In the fermentation of this juice by S. cerevisiae it was determined similar values, 45.6 g/L ethanol in 72 h (ethanol yield = 0.41 g ethanol per g carbohydrates).
Nowadays, there are some studies that improve d-xylose assimilation by yeasts which is the more abundant component in plant cells, which can lead to higher bioethanol productivity [49].
This study proves that biofuel yield from date palm waste via fermentation is high, as recent research also shows [50].

4. Conclusions

Lignocellulose fibers have physical and thermal advantages for industrial application in energy production. In fact, this research highlights that waste of date palm tree P. dactylifera L. could be an alternative to produce second-generation bioethanol.
Therefore, this byproduct should be developed for green energy production. The optimal conditions for thermochemical pretreatment were 220 °C without addition of sulfuric acid for both young and old cellulosic fibers. In general, d-glucose generation was easier in young fibers, and under higher severity factors. Maximum concentration of acetic acid generated was 0.56 g/L for the thermochemical pretreatment of old cellulosic fibers carried out at 220 °C and without acid (severity factor = 6.65), while d-glucose concentration in these conditions was very small, 0.08 g/L.
After 48 h of enzymatic hydrolysis, a maximum concentration of TRS, 31.2 g/L and 34.6 g/L for young and old cellulosic fibers was achieved, respectively; maximum TRS yields (YTRS) were reached at 48 h for both pretreated cellulosic fibers: 0.46 g TRS/g dry pretreated young fibers, and 0.49 g TRS/g dry pretreated old fibers.
During the ethanolic fermentation of the hydrolysates by P. tannophilus (ATCC 32691), a yield (YE) of 10.64 g ethanol/100 g of dry fiber for young cellulosic fibers and 10.88 g ethanol/100 g of dry fiber for old cellulosic fibers was reached.
These results obtained in this study show that cellulosic fibers from date palm would be an alternative waste with great potential for ethanol production.

Author Contributions

Conceptualization, S.S.; Data curation, Y.A. and I.O.; Formal analysis, Y.A., I.O., M.H. and S.S.; Funding Acquisition, S.S.; Investigation, Y.A., I.O. and S.S.; Methodology, Y.A., I.O., M.H. and S.S.; Resources, Y.A. and M.H.; Supervision, M.H. and S.S.; Writing–original draft, Y.A. and I.O.; Writing–review & editing, S.S. All authors have read and agreed to the published version of the manuscript.

Funding

This research was funded by Andalusia Regional Government (Spain) (Project Ref. AGR-6509) and the Ministry of Superior Education of Tunisia.

Institutional Review Board Statement

Not applicable.

Informed Consent Statement

Not applicable.

Data Availability Statement

Not applicable.

Acknowledgments

The authors are grateful to all the researchers of ‘Research Group Bioprocesses of the University of Jaen’ and ‘Laboratoire d’Ecologie et de Technologie Microbienne LETMi’ of the ‘National Institute of Applied Sciences and Technology’ of the University of Carthage, as well as the administration of the “National Agronomy Institute of Tunisia INAT”. Moreover, the authors acknowledge the contribution of Professor Adnane Abdelghani and Doctor Atef Thamri from the Nanotechnology Laboratory of the INSAT for their helpful contribution in ATR-FTIR analysis.

Conflicts of Interest

The authors declare no conflict of interest.

Abbreviations

ADFAcid detergent fiber
AFEXAmonia Fibre Explosion
ATCCAmerican Type Culture Collection
ATR-FTIRAttenuated Total Reflectance Fourier Transform Infrared Spectroscopy
DNS3,5-Dinitrosalicylic acid
FPUFilter Paper Cellulase Units
AILAcid-Insoluble Lignin
NDFNeutral detergent fiber
TAPPITechnical Association of Pulp and Paper Industry
TRSTotal Reducting Sugars
Variables
AiMeans either high (+) or low (−) level in experimental run i
C1d-glucose concentration [g/L]
C2Total reducing sugars content [g/L]
C3Acetic acid concentration [g/L]
CrRegression coefficient
EaApparent activation energy (78.4 kJ/mol)
kNumber of factors (k = 2)
Log RoSeverity factor
P1Ash measurement [%]
P2Holocellulose content [%]
P3Lignin content [%]
RUniversal gas constant [0.008314 kJ/(mol K)]
RoSeverity
SResidual solids content [%]
TrReference temperature for an initial process time t = 0 (100 °C)
T(t)Function that relates temperature to residence time [°C]
XiFactor in Equation (2)
YPredicted response value
YEEthanol yield respect initial substrate [g/g]
YE/GEthanol yield respect d-glucose consumption [g/g]
YE/TRSEthanol yield respect TRS consumption [g/g]
YGd-glucose yield [g/g]
YjResponse value for which Crj is determined (where j varies from 1 to 7) [%, g/L]
YTRSTotal reducing sugar yield [g/g]
boConstant coefficient
biLinear coefficients
tResidence time in reactor [min]
wWeigh [g]
wgFixed parameter (14.75)
ØParticle diameter [mm]

References

  1. Chao, C.T.; Krueger, R.R. The date palm (Phoenix dactylifera L.): Overview of biology, uses and cultivation. HortScience 2007, 42, 1077–1082. [Google Scholar] [CrossRef] [Green Version]
  2. Munier, P. Le palmier Dattier Techniques Agricoles et Productions Tropicales; Maison Neuve et Larose: Paris, France, 1973; p. 217. [Google Scholar]
  3. Kaddami, H.; Dufresne, A.; Khelifi, B.; Bendahou, A.; Taourirte, M.; Raihaneet, M.; Issartelal, N.; Sautereau, H.; Gerard, J.F.; Sami, N. Short palm tree fibers-Thermoset matrices composites. Compos. Part A Appl. Sci. Manuf. 2006, 37, 1413–1422. [Google Scholar] [CrossRef]
  4. Sghairoun, M.; Ferchichi, A. Composting heap palm tree’s products in Southern Tunisia. J. Environ. Sci. Eng. 2011, 5, 886–889. [Google Scholar]
  5. Alawar, A.; Hamed, A.M.; Al-kaabi, K. Characterization of treated date palm tree fiber as composite reinforcement. Compos. Part B Eng. 2009, 40, 601–606. [Google Scholar] [CrossRef]
  6. Elmay, Y.; Jeguirim, M.; Dorge, S.; Trouvé, G.; Said, R. Evaluation of date palm residues combustion in fixed bed laboratory reactor: A comparison with sawdust behavior. Renew. Energy 2014, 62, 209–215. [Google Scholar] [CrossRef]
  7. Antit, Y.; Zaafouri, K.; Olivares, M.I.; Hamdi, M.; Sánchez, S. Biochemical conversion of Tunisian lif of date palm Phoenix dactylifera L. to bioethanol production. In Proceedings of the 23rd European Biomass Conference and Exhibition (EUBCE 2015), Vienna, Austria, 1–4 June 2015; pp. 1336–1340. [Google Scholar]
  8. Antit, Y.; Zaafouri, K.; Olivares, M.I.; Hamdi, M.; Sánchez, S. Cellulosic ethanol production from Tunisian lif of date palm Phoenix dactylifera L. In Proceedings of the 26th European Biomass Conference and Exhibition (EUBCE 2018), Copenhagen, Denmark, 14–17 May 2018; pp. 1198–1201. [Google Scholar]
  9. Guerriero, G.; Hausman, J.F.; Strauss, J.; Ertan, H.; Siddiqui, K.S. Lignocellulosic biomass: Biosynthesis, degradation and industrial utilization. Eng. Life Sci. 2016, 16, 1–16. [Google Scholar] [CrossRef]
  10. Harun, M.Y.; Dayang Radiah, A.B.; Zain Abidin, Z.; Yunus, R. Effect of physical pretreatment on dilute acid hydrolysis of water hyacinth (Eichhornia crassipes). Bioresour. Technol. 2011, 102, 5193–5199. [Google Scholar] [CrossRef]
  11. Ogier, J.C.; Ballerini, D.; Leygue, J.P.; Rigal, L.; Pourquie, J. Production d’éthanol à partir d’une biomasse lignocellulosique. Oil Gas Sci. Technol. 1999, 54, 67–94. [Google Scholar] [CrossRef] [Green Version]
  12. Druzhinina, L.S.; Kubicek, C.P. Genetic engineering of Trichoderma reesei cellulases and their production. Microb. Biotechnol. 2017, 10, 1485–1499. [Google Scholar] [CrossRef]
  13. Kiss, A.; Ignat, R.M. Innovative single step bioethanol dehydration in an extractive dividing-wall column. Sep. Purif. Technol. 2012, 98, 290–297. [Google Scholar] [CrossRef]
  14. Brethauer, S.; Wyman, C.E. Review: Continuous hydrolysis and fermentation for cellulosic ethanol production. Bioresour. Technol. 2010, 101, 4862–4874. [Google Scholar] [CrossRef]
  15. Palmqvist, E.; Grage, H.; Meinander, N.Q.; Hahn-Hägerdal, B. Main and interaction effects of acetic acid, furfural, and p-hydroxybenzoic acid on growth and ethanol productivity of yeasts. Biotechnol. Bioeng. 1999, 63, 46–55. [Google Scholar] [CrossRef]
  16. García, J.F.; Cuevas, M.; Feng, C.-H.; Álvarez, P.; Torres, M.; Sánchez, S. Review: Energetic valorisation of olive biomass: Olive-tree pruning, olive stones and pomaces. Processes 2020, 8, 511. [Google Scholar] [CrossRef]
  17. Sánchez, S.; Bravo, V.; Moya, A.J.; Castro, E.; Camacho, F. Influence of temperature on the fermentation of d-xylose by Pachysolen tannophilus to produce ethanol and xylitol. Process Biochem. 2004, 39, 673–679. [Google Scholar] [CrossRef]
  18. Cuevas, M.; Saleh, M.; García, J.F.; Sánchez, S. Acid and enzymatic fractionation of olive stones for ethanol production using Pachysolen tannophilus. Processes 2020, 8, 195. [Google Scholar] [CrossRef] [Green Version]
  19. Cuevas, M.; García, J.F.; Bravo, V.; Sánchez, S. Ethanol production from olive stones through liquid hot water pre-treatment, enzymatic hydrolysis and fermentation. Influence of enzyme loading, and pre-treatment temperature and time. Fermentation 2021, 7, 25. [Google Scholar] [CrossRef]
  20. Van Soest, P.J.; Wine, R.H. Use of detergents in the analysis of fibrous feed: The determination of plant cell wall constituents. J. Assn. Offic. Anal. Chem. 1967, 50, 50–55. [Google Scholar]
  21. Xu, F.; Wang, D. Analysis of lignocellulosic biomass using infrared methodology. In the Pretreatment of Biomass: Processes and Technologies; Pandey, A., Negi, S., Binod, P., Larroche, C., Eds.; Elsevier: Amsterdam, The Netherlands, 2015; pp. 7–25. [Google Scholar]
  22. Xu, F.; Yu, J.; Tesso, T.; Dowell, F.; Wanga, D. Qualitative and quantitative analysis of lignocellulosic biomass using infrared techniques: A mini-review. Appl. Energy 2013, 104, 801–809. [Google Scholar] [CrossRef] [Green Version]
  23. Trinder, P. Determination of glucose in blood using glucose oxidase with an alternative oxygen acceptor. Ann. Clin. Biochem. 1969, 6, 24–27. [Google Scholar] [CrossRef]
  24. Bergmeyer, H.U.; Möllering, H. Acetic acid. In Methods of Enzymatic Analysis, 2nd ed.; Bergmeyer, H.U., Ed.; Verlag Chemie: Weinheim/Bergstr, Germany, 1974; Volume 3, pp. 1520–1528. [Google Scholar]
  25. Miller, G.L. Use of dinitrosalicylic acid reagent for determination of reducing sugar. Anal. Chem. 1959, 31, 426–428. [Google Scholar] [CrossRef]
  26. Beutler, H.O.; Michal, G. Neue methode zur enzymatischen bestimmnung von ethanol in lebensmitteln. Fresenius Z. Anal. Chem. 1977, 284, 113–117. [Google Scholar] [CrossRef]
  27. Giwa, A.; Adeyi, A.A.; Giwa, S.O. Empirical modelling and optimization of PAME reactive distillation process using MINITAB. Int. J. Sci. Eng. Res. 2015, 6, 1–12. [Google Scholar]
  28. Montgomery, D.C. Design and Analysis of Experiments, 5th ed.; John Wiley & Sons, Inc: New York, NY, USA, 2001. [Google Scholar]
  29. Saleh, M.; Cuevas, M.; García, J.F.; Sánchez, S. Valorization of olive stones for xylitol and ethanol production from dilute acid pretreatment via enzymatic hydrolysis and fermentation by Pachysolen tannophilus. Biochem. Eng. J. 2014, 90, 286–293. [Google Scholar] [CrossRef]
  30. Overend, R.P.; Chornet, E.; Gascoigne, J.A. Fractionation of lignocellulosics by steam-aqueous pretreatments. Philos. Trans. R. Soc. Lond. A 1987, 321, 523–536. [Google Scholar] [CrossRef]
  31. Ghose, T.K. Measurement of cellulase activities. Pure Appl. Chem. 1987, 59, 257–268. [Google Scholar] [CrossRef]
  32. Sánchez, S.; Bravo, V.; Castro, E.; Moya, A.J.; Camacho, F. The fermentation of mixtures of d-glucose and d-xylose by Candida shehatae, Pichia stipitis or Pachysolen tannophilus to produce ethanol. J. Chem. Technol. Biotechnol. 2002, 77, 641–648. [Google Scholar] [CrossRef]
  33. Lindegren, C.C.; Nagai, S.; Nagai, H. Induction of respiratory deficiency in yeast by manganese, copper, cobalt and nickel. Nature 1958, 182, 446–448. [Google Scholar] [CrossRef]
  34. Saadaoui, N.; Rouilly, A.; Fares, K.; Rigal, L. Characterization of date palm lignocellulosic by-products and self-bonded composite materials obtained thereof. Mater. Des. 2013, 50, 302–308. [Google Scholar] [CrossRef]
  35. Dashtban, M.; Schraft, H.; Syed, T.A.; Qin, W. Fungal biodegradation and enzymatic modification of lignin. Int. J. Biochem. Mol. Biol. 2010, 1, 36–50. [Google Scholar] [PubMed]
  36. Eloutassi, N.; Louaste, B.; Boudine, L.; Remmal, A. Hydrolyse physico-chimique et biologique de la biomasse lignocellulosique pour la production de bio-éthanol de deuxième génération. Nat. Technol. 2014, 10, 10–14. [Google Scholar]
  37. Cuevas, M.; Sánchez, S.; Bravo, V.; Cruz, N.; García, J.F. Fermentation of enzymatic hydrolysates from olive stones by Pachysolen tannophilus. J. Chem. Technol. Biotechnol. 2009, 84, 461–467. [Google Scholar] [CrossRef]
  38. El Asli, A.; Qatibi, A.I. Ethanol production from olive cake biomass substrate. Biotechnol. Bioprocess Eng. 2009, 14, 118–122. [Google Scholar] [CrossRef]
  39. Han, M.; Moon, S.K.; Kim, Y.; Kim, Y.; Chung, B.; Choi, G.W. Bioethanol production from ammonia percolated wheat straw. Biotechnol. Bioprocess Eng. 2009, 14, 606–611. [Google Scholar] [CrossRef]
  40. Brienzo, M.; Siqueira, A.F.; Milagres, A.M.F. Search for optimum conditions of sugarcane bagasse hemicellulose extraction. Biochem. Eng. J. 2009, 46, 199–204. [Google Scholar] [CrossRef]
  41. Sun, Y.; Cheng, J. Hydrolysis of lignocellulosic materials for ethanol production: A review. Bioresour. Technol. 2002, 83, 1–11. [Google Scholar] [CrossRef]
  42. Zhou, C.; Jiang, W.; Via, B.K.; Fasina, O.; Han, G. Prediction of mixed hardwood lignin and carbohydrate content using ATR-FTIR and FT-NIR. Carbohydr. Polym. 2015, 121, 336–341. [Google Scholar] [CrossRef] [PubMed] [Green Version]
  43. Fang, C.; Schmidt, J.E.; Cybulska, I.; Brudecki, G.; Frankaer, C.G.; Thomsen, M.H. Hydrothermal pretreatment of date palm (Phoenix dactylifera L.) leaflets and rachis to enhance enzymatic digestibility and bioethanol potential. BioMed Res. Int. 2015, 1–13. [Google Scholar] [CrossRef] [Green Version]
  44. Peng, H.; Luo, H.; Jin, S.; Li, H.; Xu, J. Improved bioethanol production from corn stover by alkali pretreatment with a novel pilot-scale continuous microwave irradiation reactor. Biotechnol. Bioprocess Eng. 2014, 19, 493–502. [Google Scholar] [CrossRef]
  45. Us, E.; Perendeci, N. Improvement of methane production from greenhouse residues: Optimization of thermal and H2SO4 pretreatment process by experimental design. Chem. Eng. J. 2012, 181–182, 120–131. [Google Scholar] [CrossRef]
  46. Byun, J.; Cha, Y.L.; Park, S.M.; Kim, K.S.; Lee, J.E.; Kang, Y.G. Lignocellulose pretreatment combining continuous alkaline single-screw extrusion and ultrasonication to enhance biosugar production. Energies 2020, 13, 5636. [Google Scholar] [CrossRef]
  47. Chen, H.; Jin, S. Effect of ethanol and yeast on cellulase activity and hydrolysis of crystalline cellulose. Enzyme Microb. Technol. 2006, 39, 1430–1432. [Google Scholar] [CrossRef]
  48. Gómez Flores, R.; Thiruvengadathan, T.N.; Nicol, R.W.; Gilroyed, B.H.; Morrison, M.J.; Reid, L.M.; Margaritis, A. Bioethanol and biobutanol production from sugarcorn juice. Biomass Bioenergy 2018, 108, 455–463. [Google Scholar] [CrossRef]
  49. Selim, K.A.; Esa, S.M.; El Diwany, A.I. The xylose metabolizing yeast Spathaspora passalidarum is a promising genetic treasure for improving bioethanol production. Fermentation 2020, 6, 33. [Google Scholar] [CrossRef] [Green Version]
  50. Martis, R.; Al othamn, A.; Tawalbeh, M.; Al Kasrawi, M. Energy and economic analysis of date palm biomass feedstock for biofuel production in UAE: Pyrolysis, gasification and fermentation. Energies 2020, 13, 5877. [Google Scholar] [CrossRef]
Figure 1. Lignocellulose material from Phoenix dactylifera L. young (A) and old (B), called in Tunisia ‘lifs’.
Energies 14 01887 g001
Figure 2. Factorial experimental design (square domain) and star points (circular domain). Each black dot represents a dilute acid pretreatment performed at the variable values indicated. The coded values are bracketed (−1 is the lowest value of a variable and +1 is its highest value) and the star points are distributed at a distance of 1.5 from central point.
Energies 14 01887 g002
Figure 3. Attenuated Total Reflectance (ATR)-Fourier transform infrared spectroscopy (FTIR) spectrums of young () and old () lif fibers.
Energies 14 01887 g003
Figure 4. Response superficial for the solid recovery percentage in function of sulfuric acid concentration and temperature for young () and old () lifs during thermochemical process.
Energies 14 01887 g004
Figure 5. Holocellulose content in function of sulfuric acid concentration and temperature for young () and old () cellulosic fibers from date palm during thermochemical process.
Energies 14 01887 g005
Figure 6. Total reducing sugar concentration (non-striped shape) and d-glucose concentration (striped shape) during enzymatic hydrolysis of young () and old () lifs, at 50 °C, and 72 h under stirring conditions of 450 rpm.
Energies 14 01887 g006
Figure 7. Ethanol yields in relation to initial raw material (YE) and overall ethanol yields respect TRS and d-glucose consumption (YE/TRS, YE/G), for young () and old () fibers during fermentation process.
Energies 14 01887 g007
Table 1. Physicochemical characterisation of young and old cellulosic fibers.
CompoundsYoung FibersOld Fibers
Moisture (%)10.60 ± 0.198.19 ± 0.11
Cellulose (%) *57.42 ± 1.0962.31 ± 0.98
Hemicellulose (%) *19.63 ± 1.595.80 ± 0.44
Lignin (%) *13.44 ± 0.4821.12 ± 1.13
Ash (%) *3.32 ± 0.144.06 ± 0.30
* Percentages on dry basis.
Table 2. Full factorial design matrix in the optimisation of thermochemical pretreatment conditions for young cellulosic fibers. Experimental responses (S, P1, P2, P3, C1, C2, C3) and Log Ro.
RunsT (°C)[H2SO4] (M)Log RoS (%)P1 (%)P2 (%)P3 (%)C1 (g/L)C2 (g/L)C3 (g/L)
1150.00.00002.6993.002.9231.8161.530.260.940.00
2220.00.00004.8256.513.3430.8370.080.673.170.21
3150.00.02504.8769.832.1829.4459.050.343.980.03
4220.00.02506.5858.771.909.9682.130.311.030.02
5150.00.00003.6499.232.6629.7060.430.161.440.00
6220.00.00003.6364.573.3145.1858.300.231.610.02
7150.00.02505.9477.383.9025.6858.720.291.560.18
8220.00.02506.0454.822.6018.4778.140.340.880.03
9185.00.01256.0789.651.4310.6182.170.221.00-
10185.00.01255.5491.481.8713.0579.320.300.77-
11185.00.01256.0796.361.9813.3581.150.210.88-
Log Ro (Severity factor), S (Residual solids content), P1 (Ash percentage), P2 (Holocellulose content), P3 (AIL), C1 (d-glucose concentration), C2 (TRS concentration), C3 (Acetic acid concentration).
Table 3. Full factorial design matrix in the optimisation of thermochemical pretreatment conditions for old cellulosic fibers. Experimental responses (S, P1, P2, P3, C1, C2, C3) and Log Ro.
RunsT (°C)[H2SO4] (M)Log RoS (%)P1 (%)P2 (%)P3 (%)C1 (g/L)C2 (g/L)C3 (g/L)
1150.00.00006.5392.124.6149.6128.450.020.680.25
2220.00.00006.8062.461.7061.9737.220.102.060.39
3150.00.02504.3073.492.0423.9464.660.260.740.27
4220.00.02505.5859.374.9819.6874.650.621.870.27
5150.00.00005.1090.927.2867.0027.490.021.610.23
6220.00.00006.6562.573.7458.0839.080.081.890.56
7150.00.02507.2470.344.7339.1854.260.550.980.28
8220.00.02506.5961.504.7113.2377.580.061.170.31
9185.00.01256.2395.261.2517.8078.090.030.830.30
10185.00.01256.1194.162.6617.5275.460.040.750.32
11185.00.01256.9794.582.2217.3570.070.030.740.25
Log Ro (Severity factor), S (Residual solids content), P1 (Ash percentage), P2 (Holocellulose content), P3 (AIL), C1 (d-glucose concentration), C2 (TRS concentration), C3 (Acetic acid concentration).
Table 4. Empirical equations for each response and adequate optimal conditions for the thermochemical pretreatment of young cellulosic fibers (°C, M).
ResponseEmpirical EquationsOptimal Conditions (T, [H2SO4])
Percentage of residual solidsS = 153.2 − 0.4T − 525.1[H2SO4]150 °C, 0 M
Ash contentP1 = 3.1 − 0.0T − 16.5[H2SO4]150 °C, 0 M
Holocellulose contentP2 = 38.3 − 0.0T − 539.7[H2SO4]220 °C, 0 M
Acid-insoluble lignin contentP3 = 34.308 + 0.175T + 277.0[H2SO4]220 °C, 0.025 M
d-glucose concentrationC1 = −0.0226 + 0.0018T − 0.4[H2SO4]220 °C, 0 M
Total reducing sugarsC2 = 2.3455 − 0.004395T + 2.9[H2SO4]150 °C, 0.025 M
Acetic acid concentrationC3 = 0.01125 + 0.00025T + 0.3[H2SO4]220 °C, 0.025 M
Table 5. Empirical equations for each response and adequate optimal conditions for thermochemical pretreatment of old cellulosic fibers (°C, M).
ResponseEmpirical EquationsOptimal Conditions (T, [H2SO4])
Percentage of residual solidsS = 136.8 − 0.35T − 433.7[H2SO4]150 °C, 0 M
Ash contentP1= 6.07 − 0.013T − 8.7[H2SO4]150 °C, 0 M
Holocellulose contentP2 = 70.0 − 0.0T − 1406.0[H2SO4]220 °C, 0 M
Acid-insoluble lignin contentP3 = 4.18 + 0.19T + 1389.1[H2SO4]220 °C, 0.025 M
d-glucose concentrationC1 = −0.0008 + 0.0T + 12.7[H2SO4]220 °C, 0.025 M
Total reducing sugarsC2 = −0.57 + 0.01T − 14.8[H2SO4]220 °C, 0 M
Acetic acid concentrationC3= 0.019 + 0.002T − 3.0[H2SO4]220 °C, 0 M
Table 6. Sugar concentrations during the fermentation processes of young and old hydrolysed fibers.
Hydrolysed FibersTime (h)d-Glucose (g/L)l-Arabinose (g/L)d-Xylose (g/L)d-Galactose (g/L)d-Manose (g/L)
Young 038.100.410.620.130
710.32
96 0.400.560.130
Old 033.610.410.610.130
712.05
96 0.410.560.140
Publisher’s Note: MDPI stays neutral with regard to jurisdictional claims in published maps and institutional affiliations.

