
A Data-Mining Approach for Wind Turbine Fault Detection Based on SCADA Data Analysis Using Artificial Neural Networks


Abstract
1. Introduction
2. Background
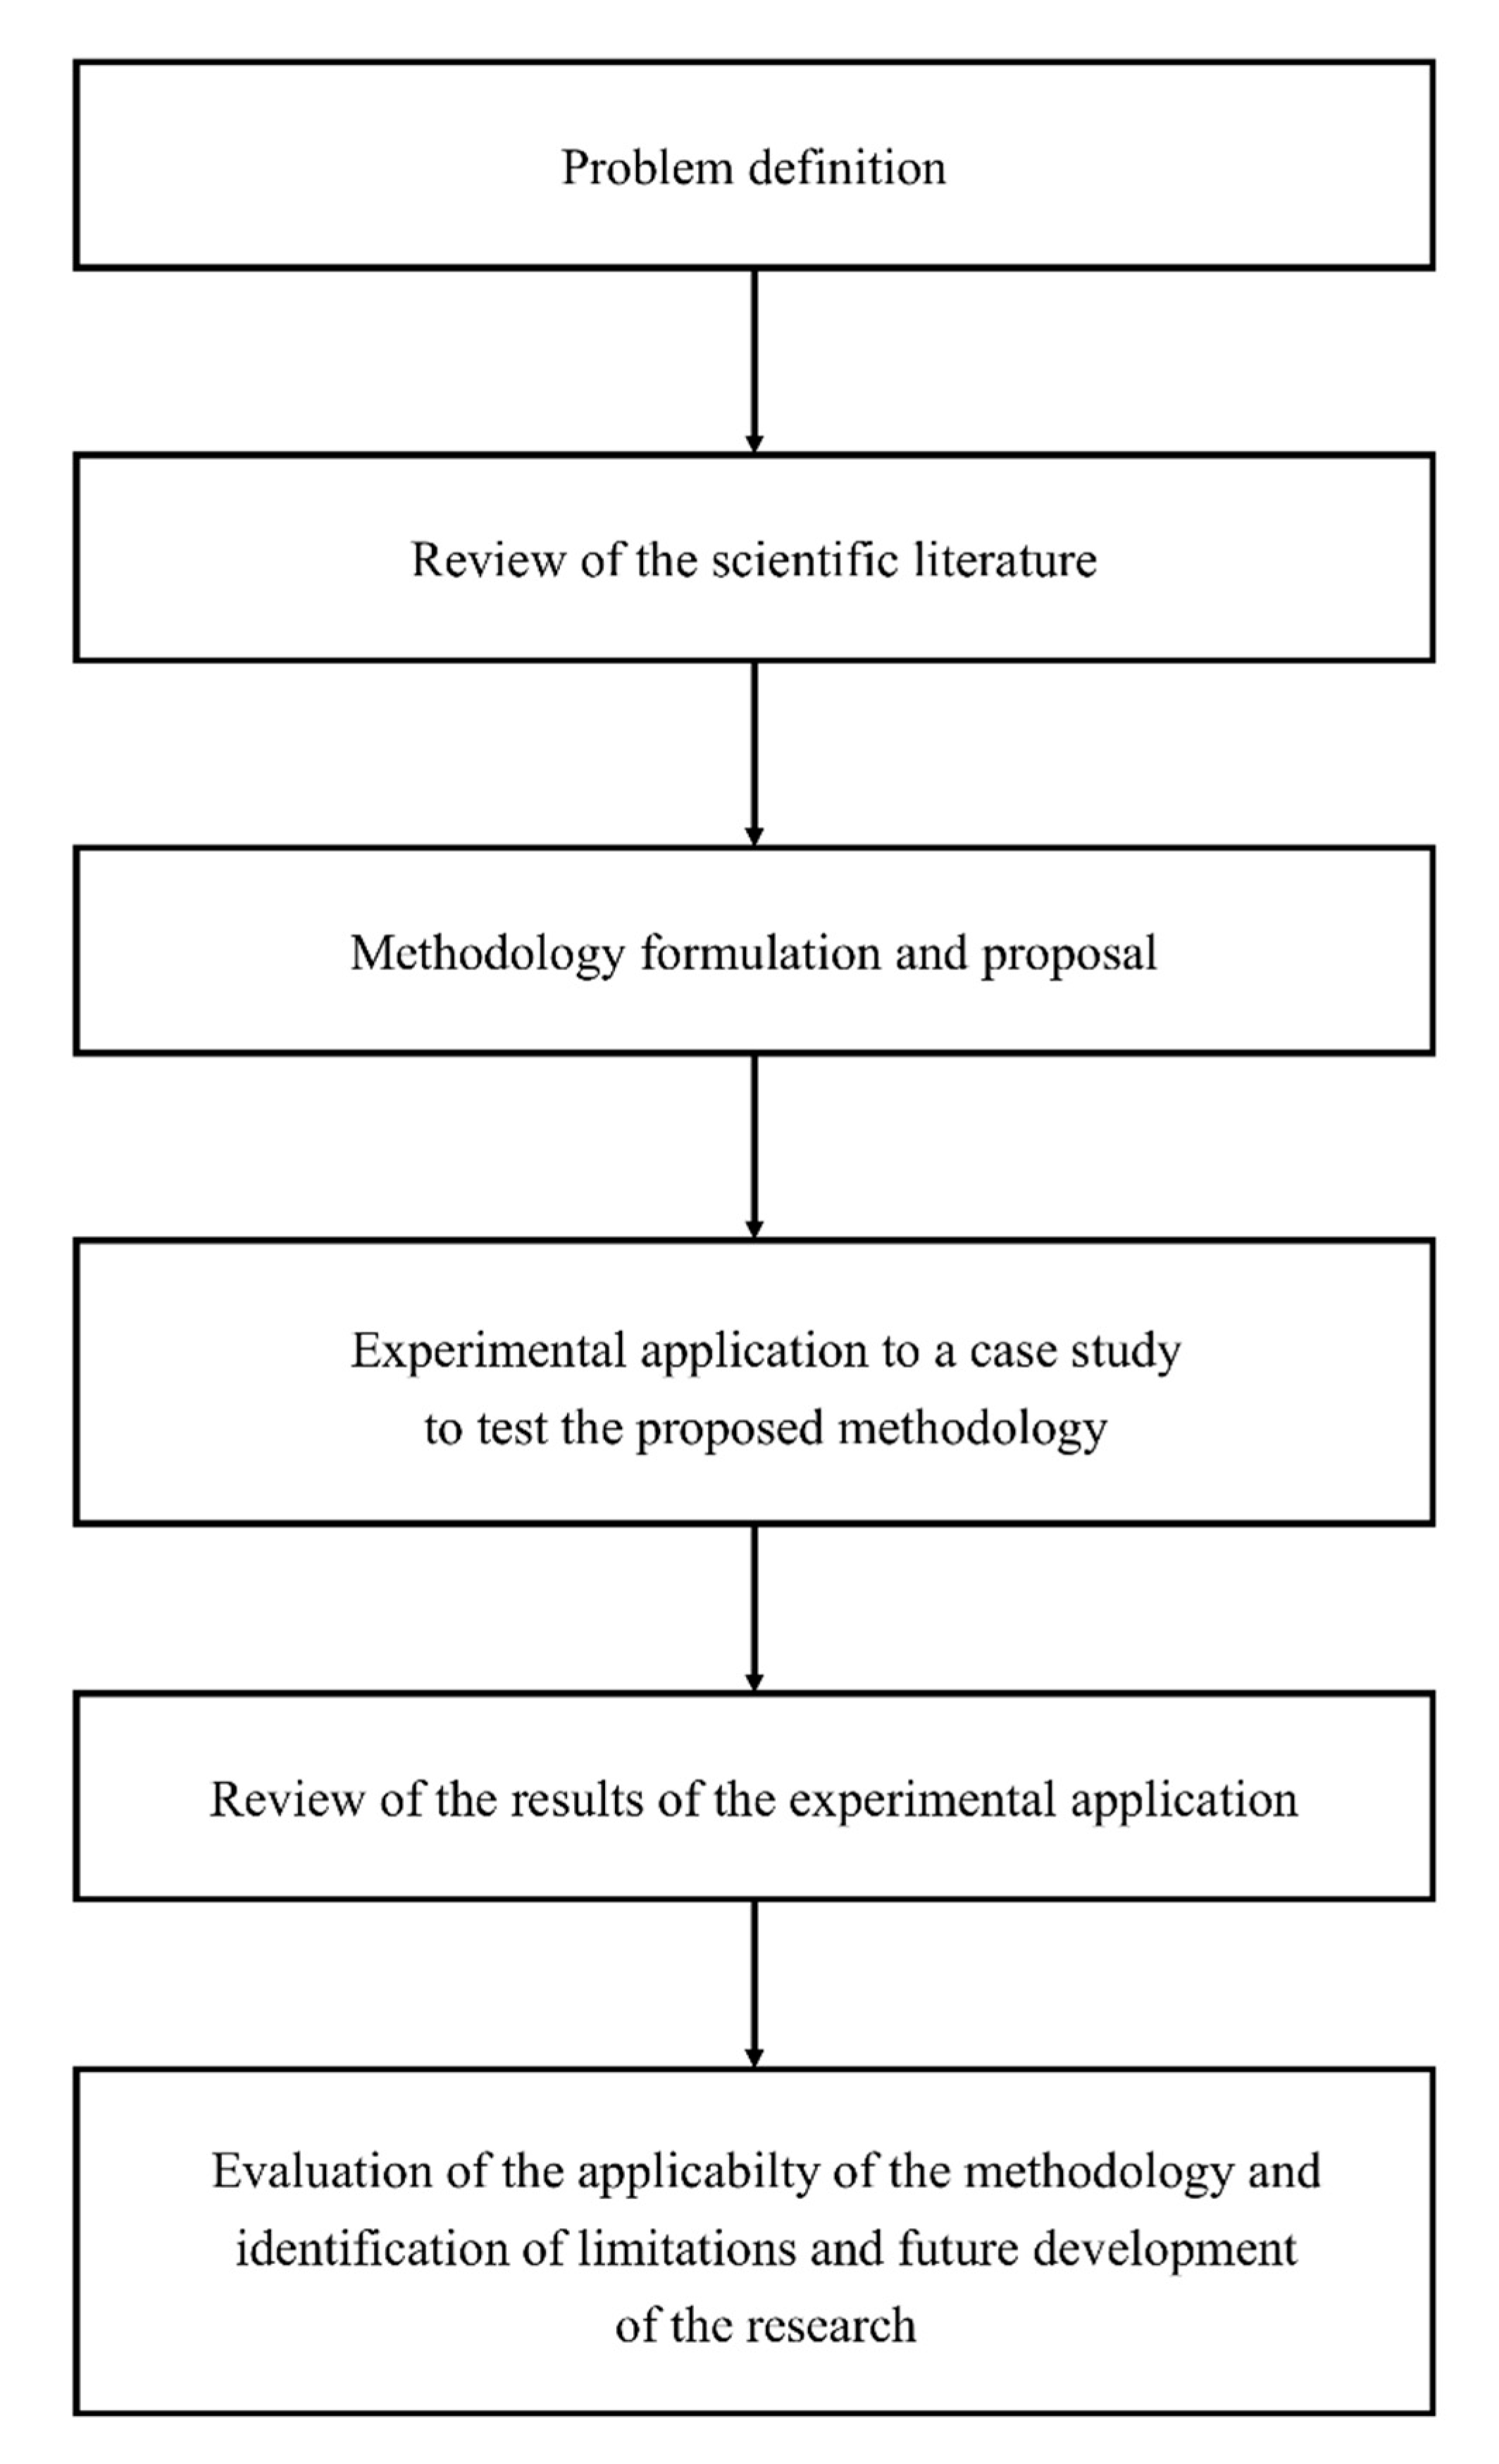
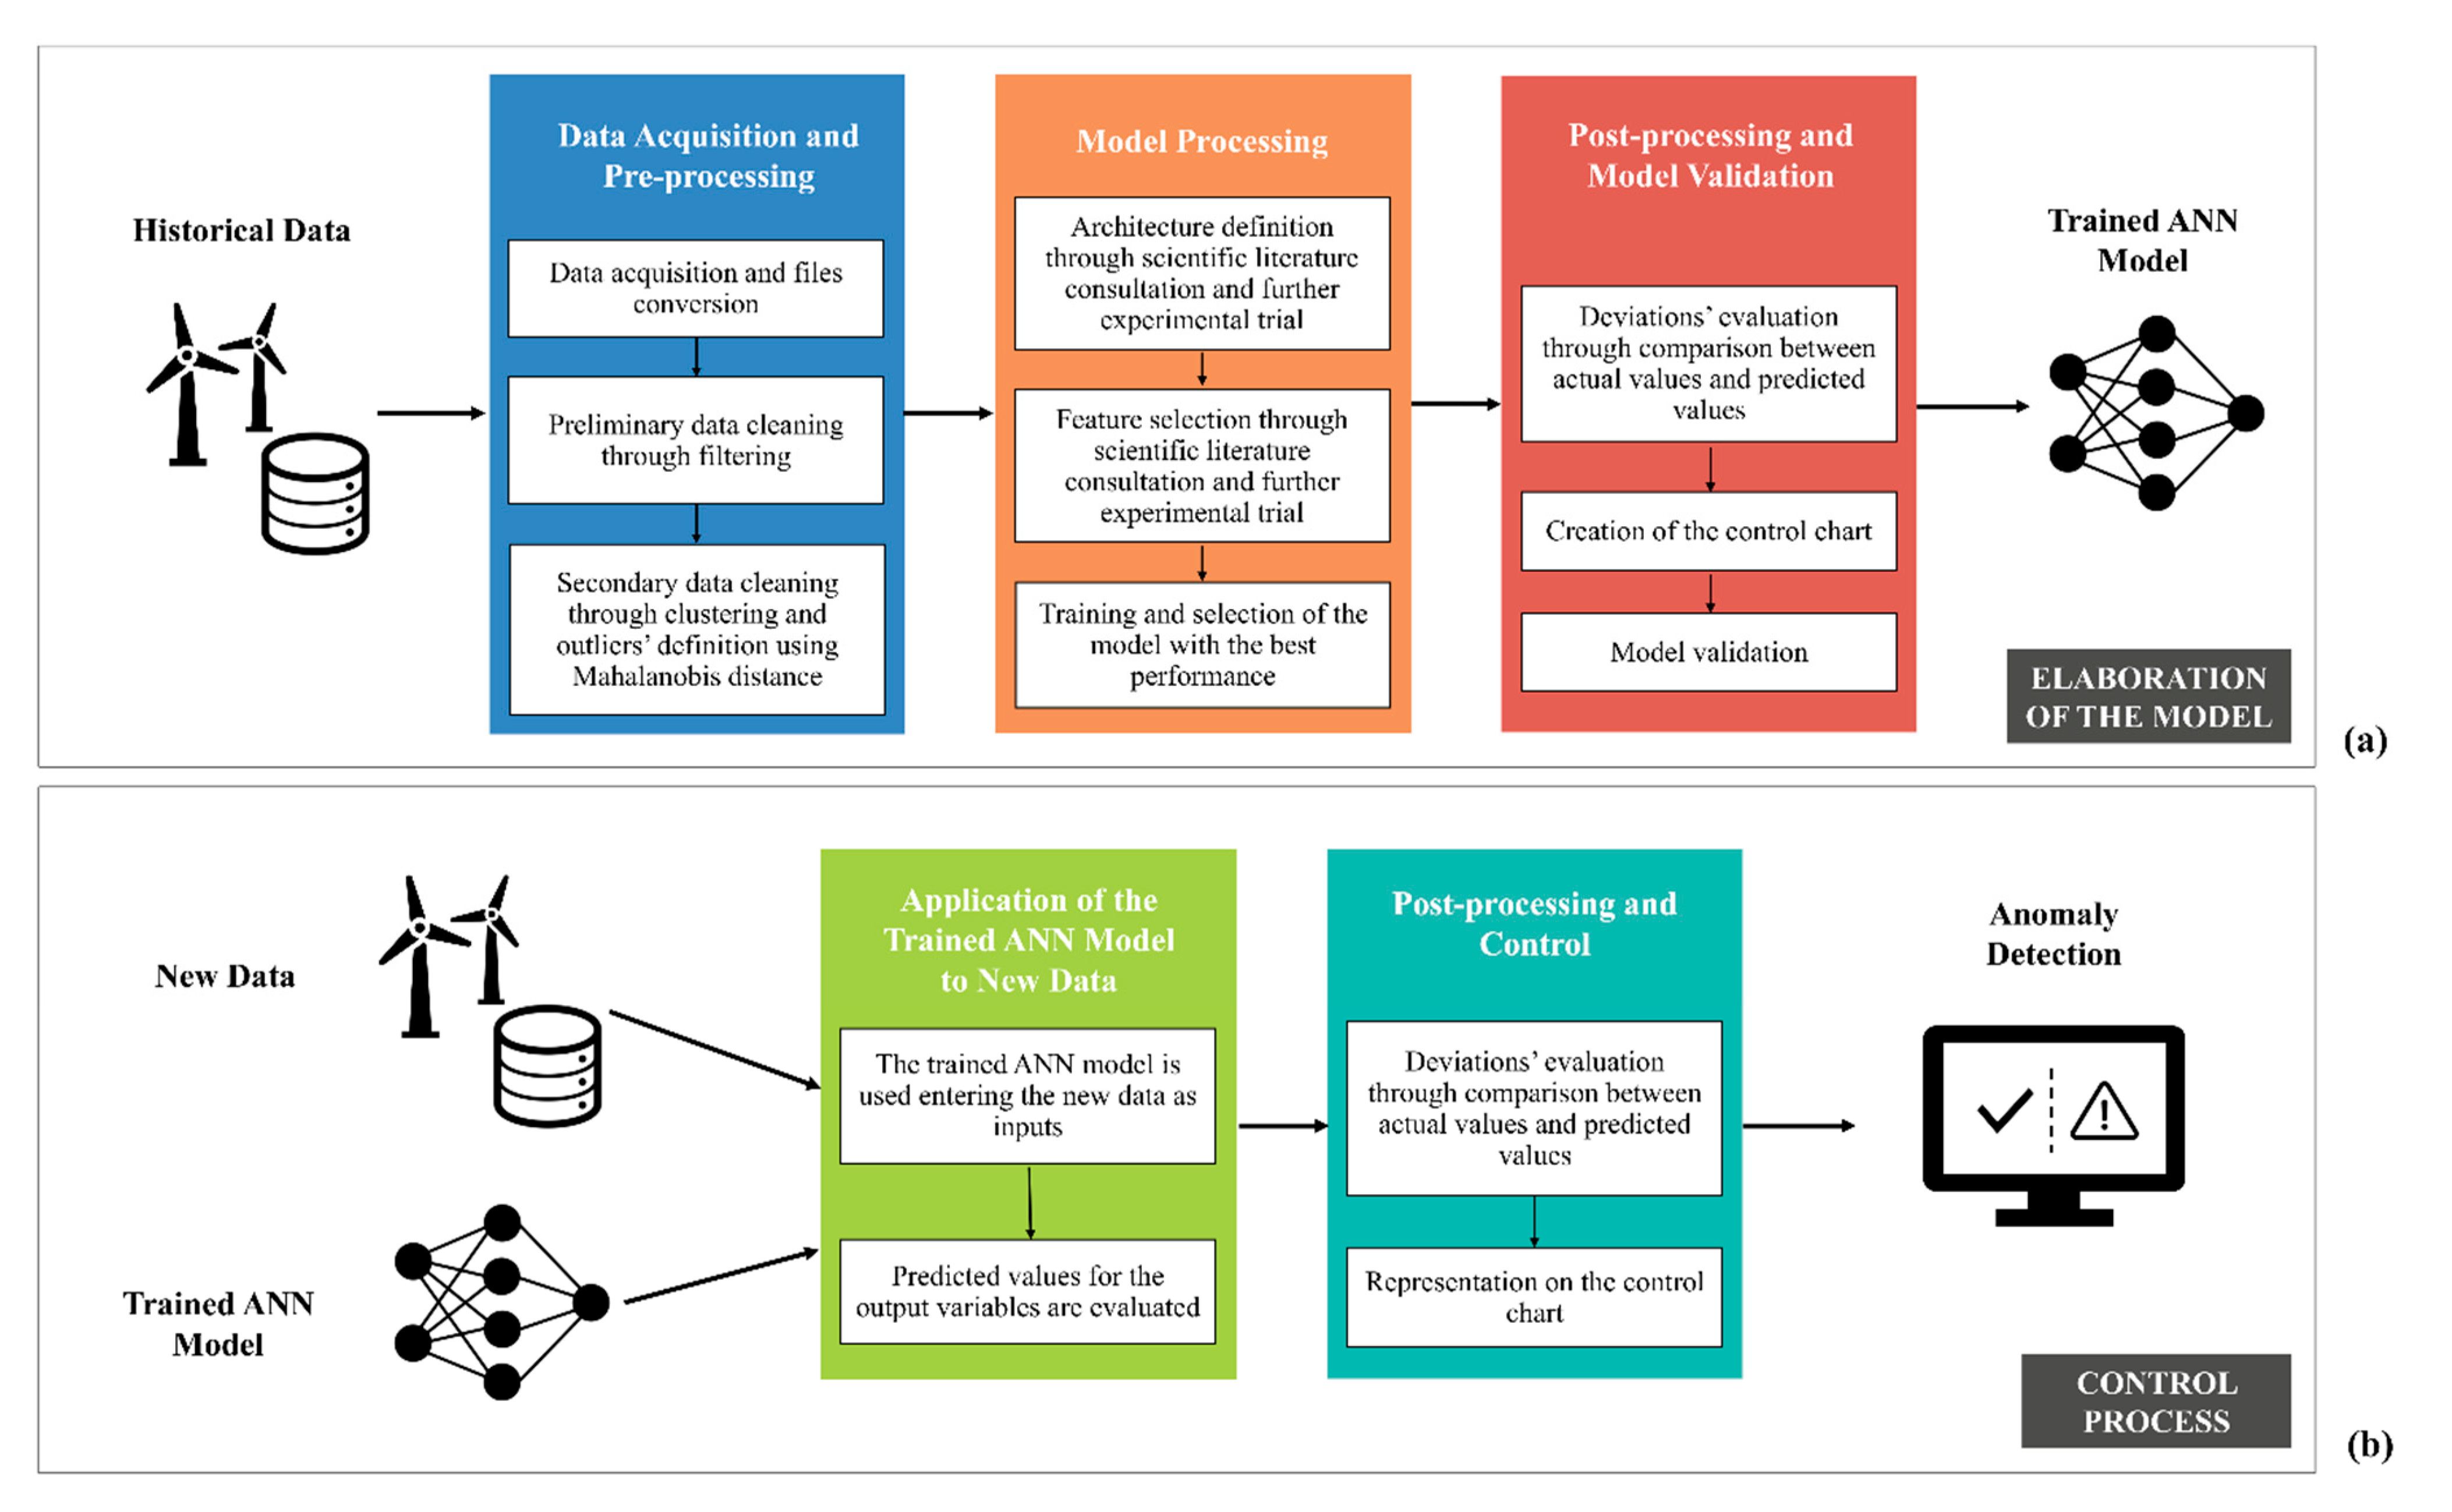
3. Methodology
- Data acquisition and data pre-processing: the data are acquired, cleaned and prepared to be suitable for subsequent processing;
- Model processing: the different models of the turbine and its components are developed and configured;
- Post-processing: the deviations are evaluated using the control chart.
3.1. Data Acquisition and Data Pre-Processing
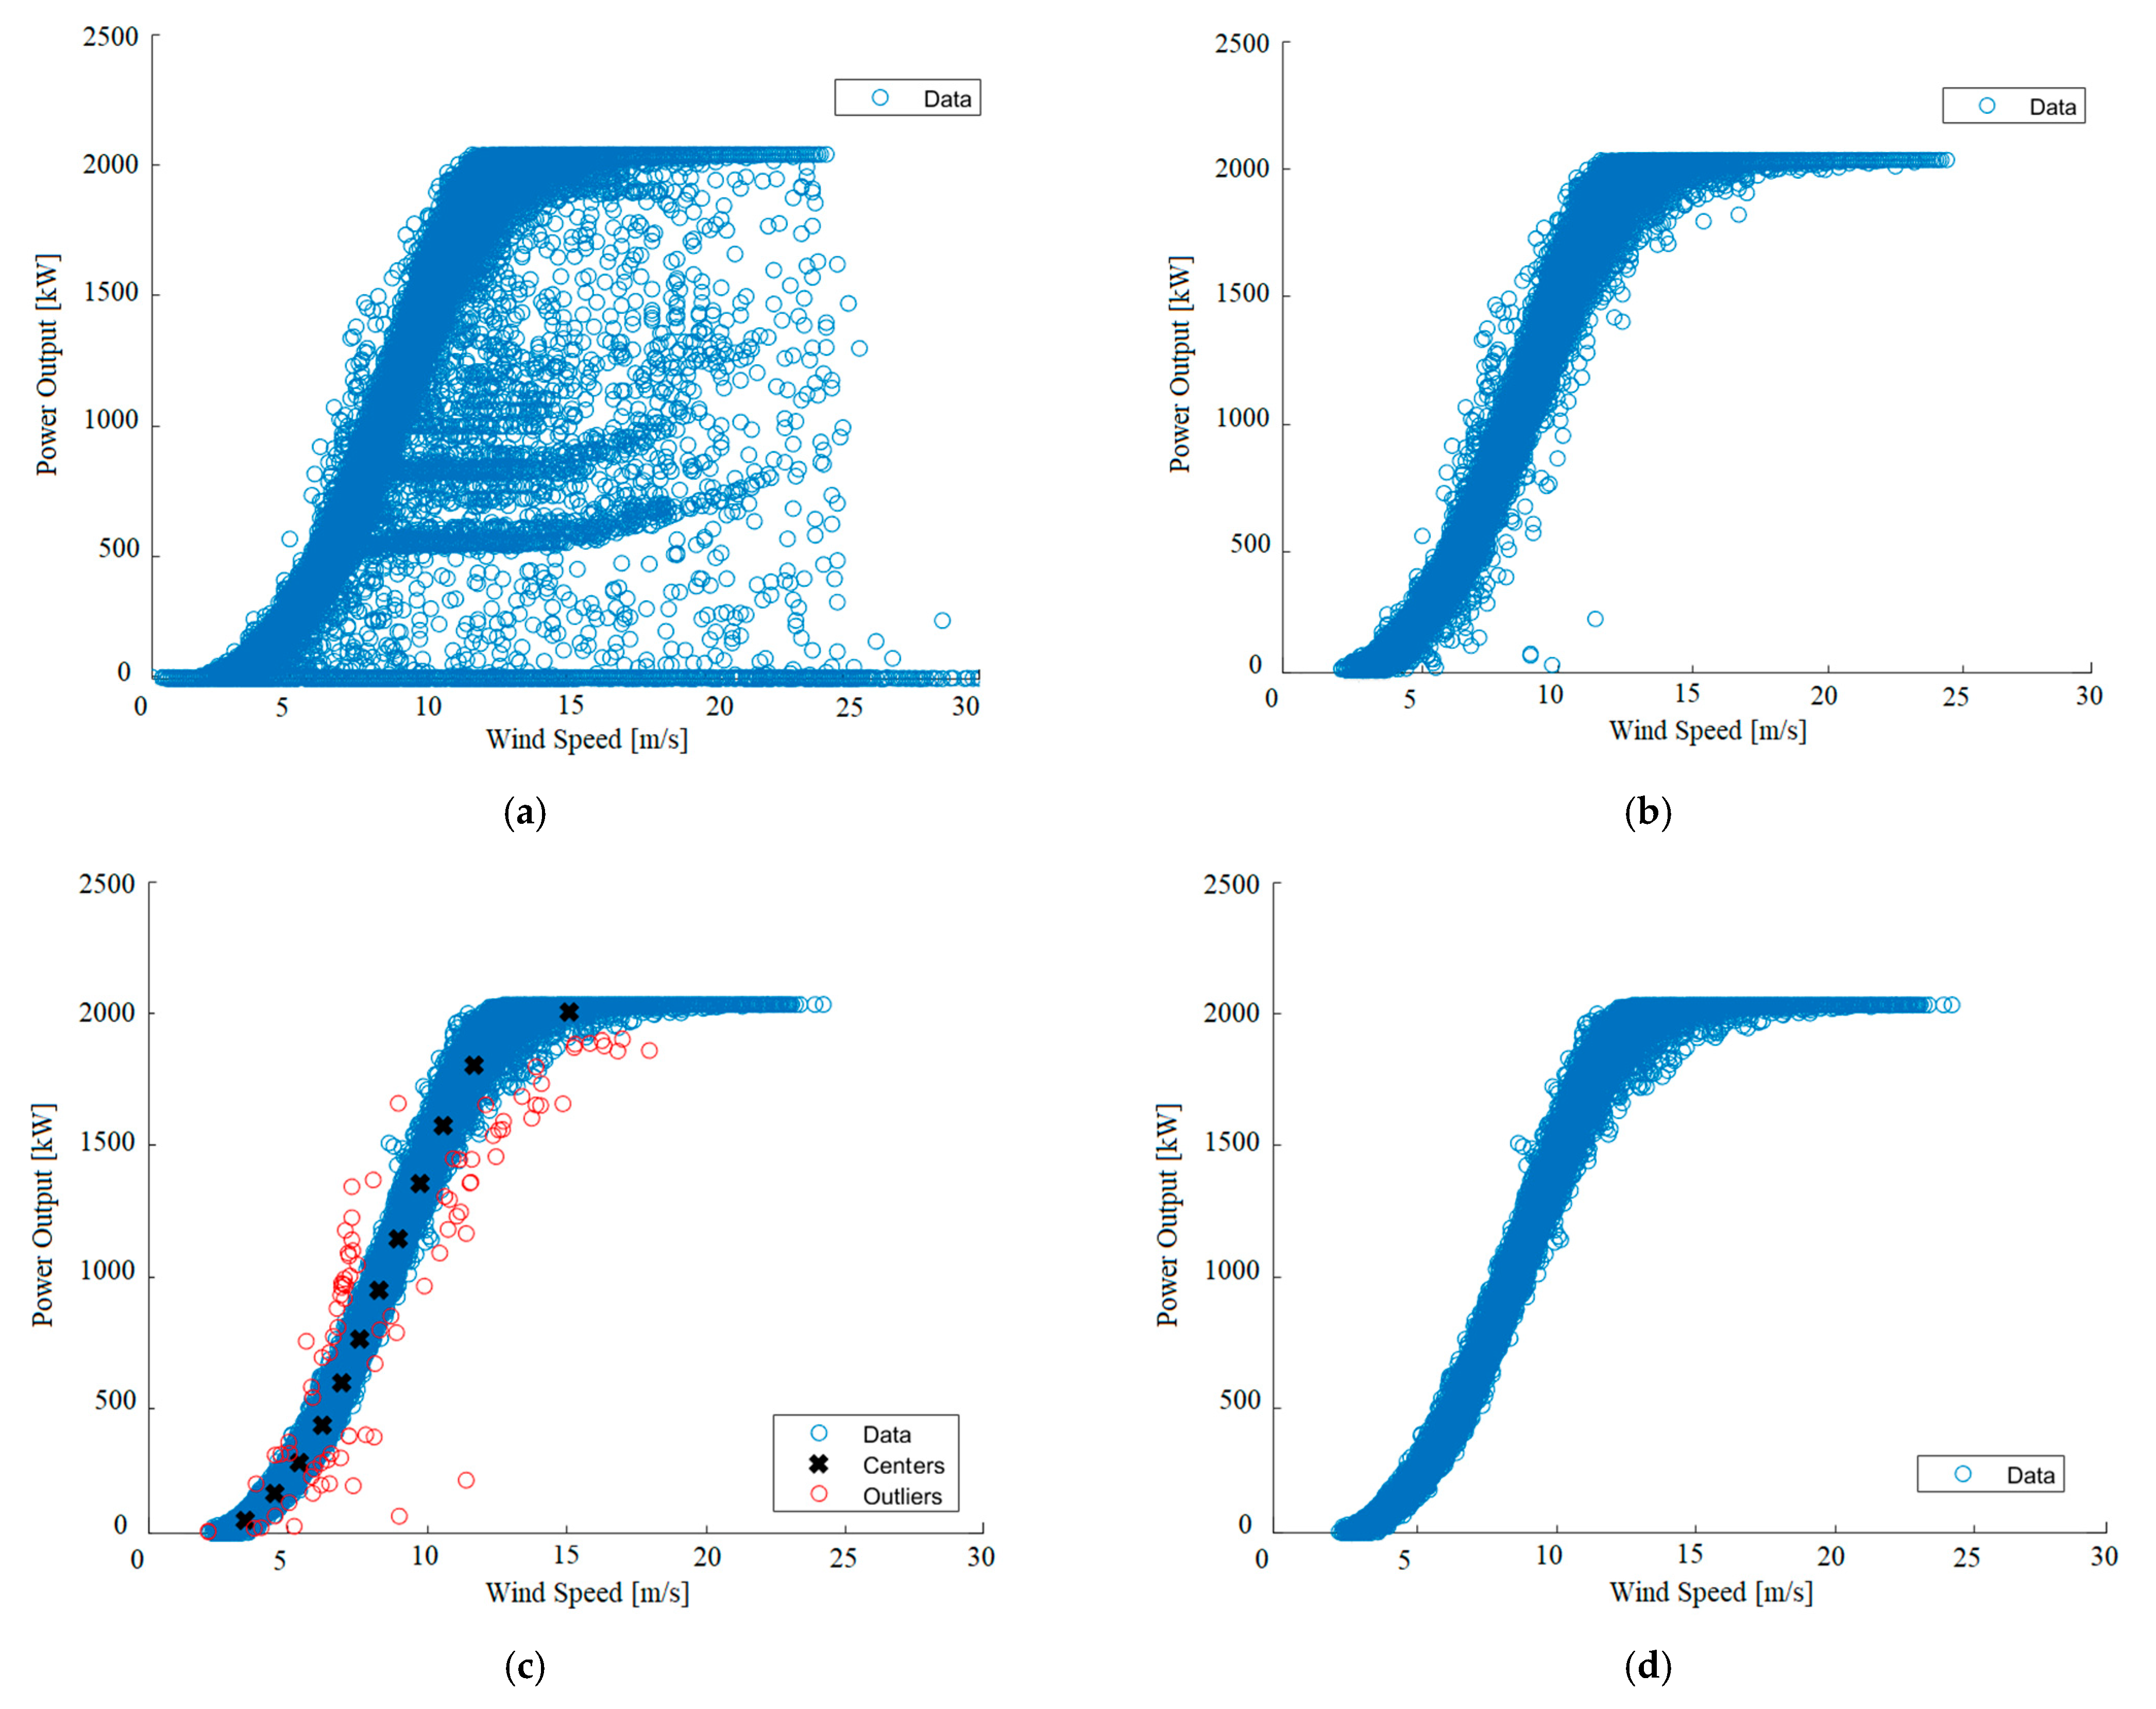
3.1.1. Data Cleaning
- Removal of samples in which at least one input or output signal is missing;
- Removal of samples in which the wind turbine output power is zero;
- Removal of samples where one or more variables are out of the range of normal variation (is also essential to identify the cause of such an occurrence).
3.1.2. Clustering and Mahalanobis Distance
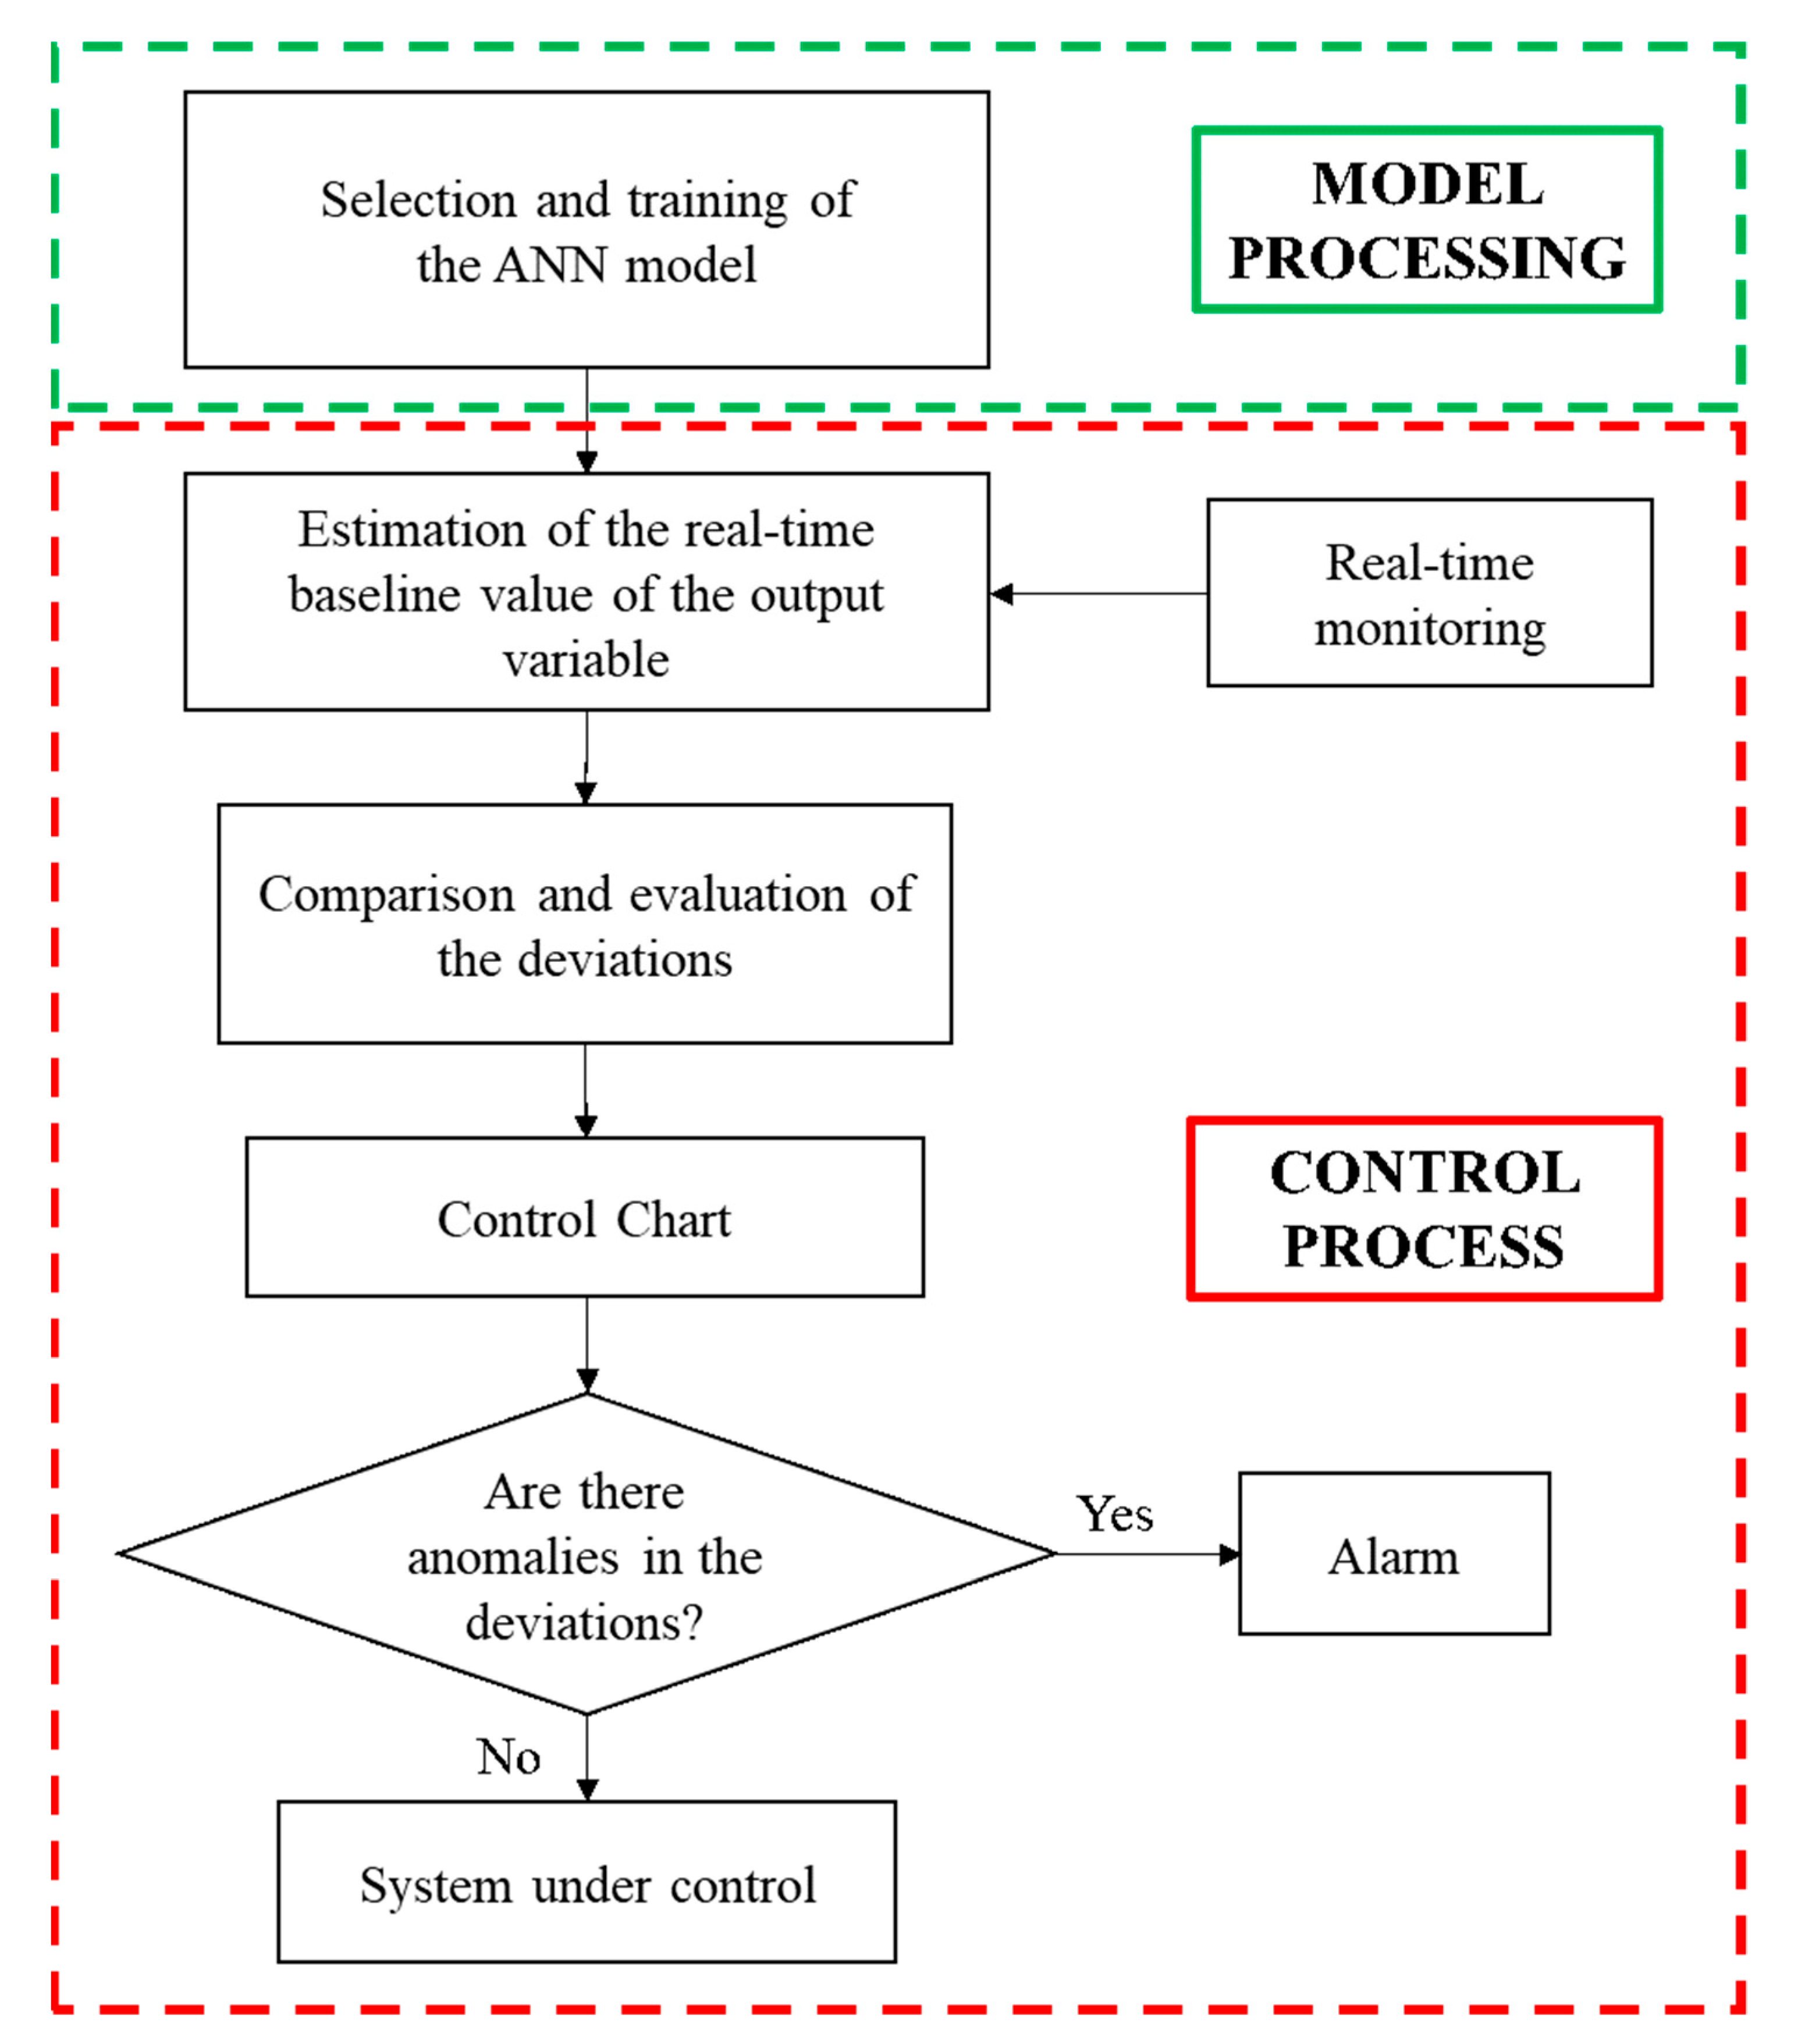
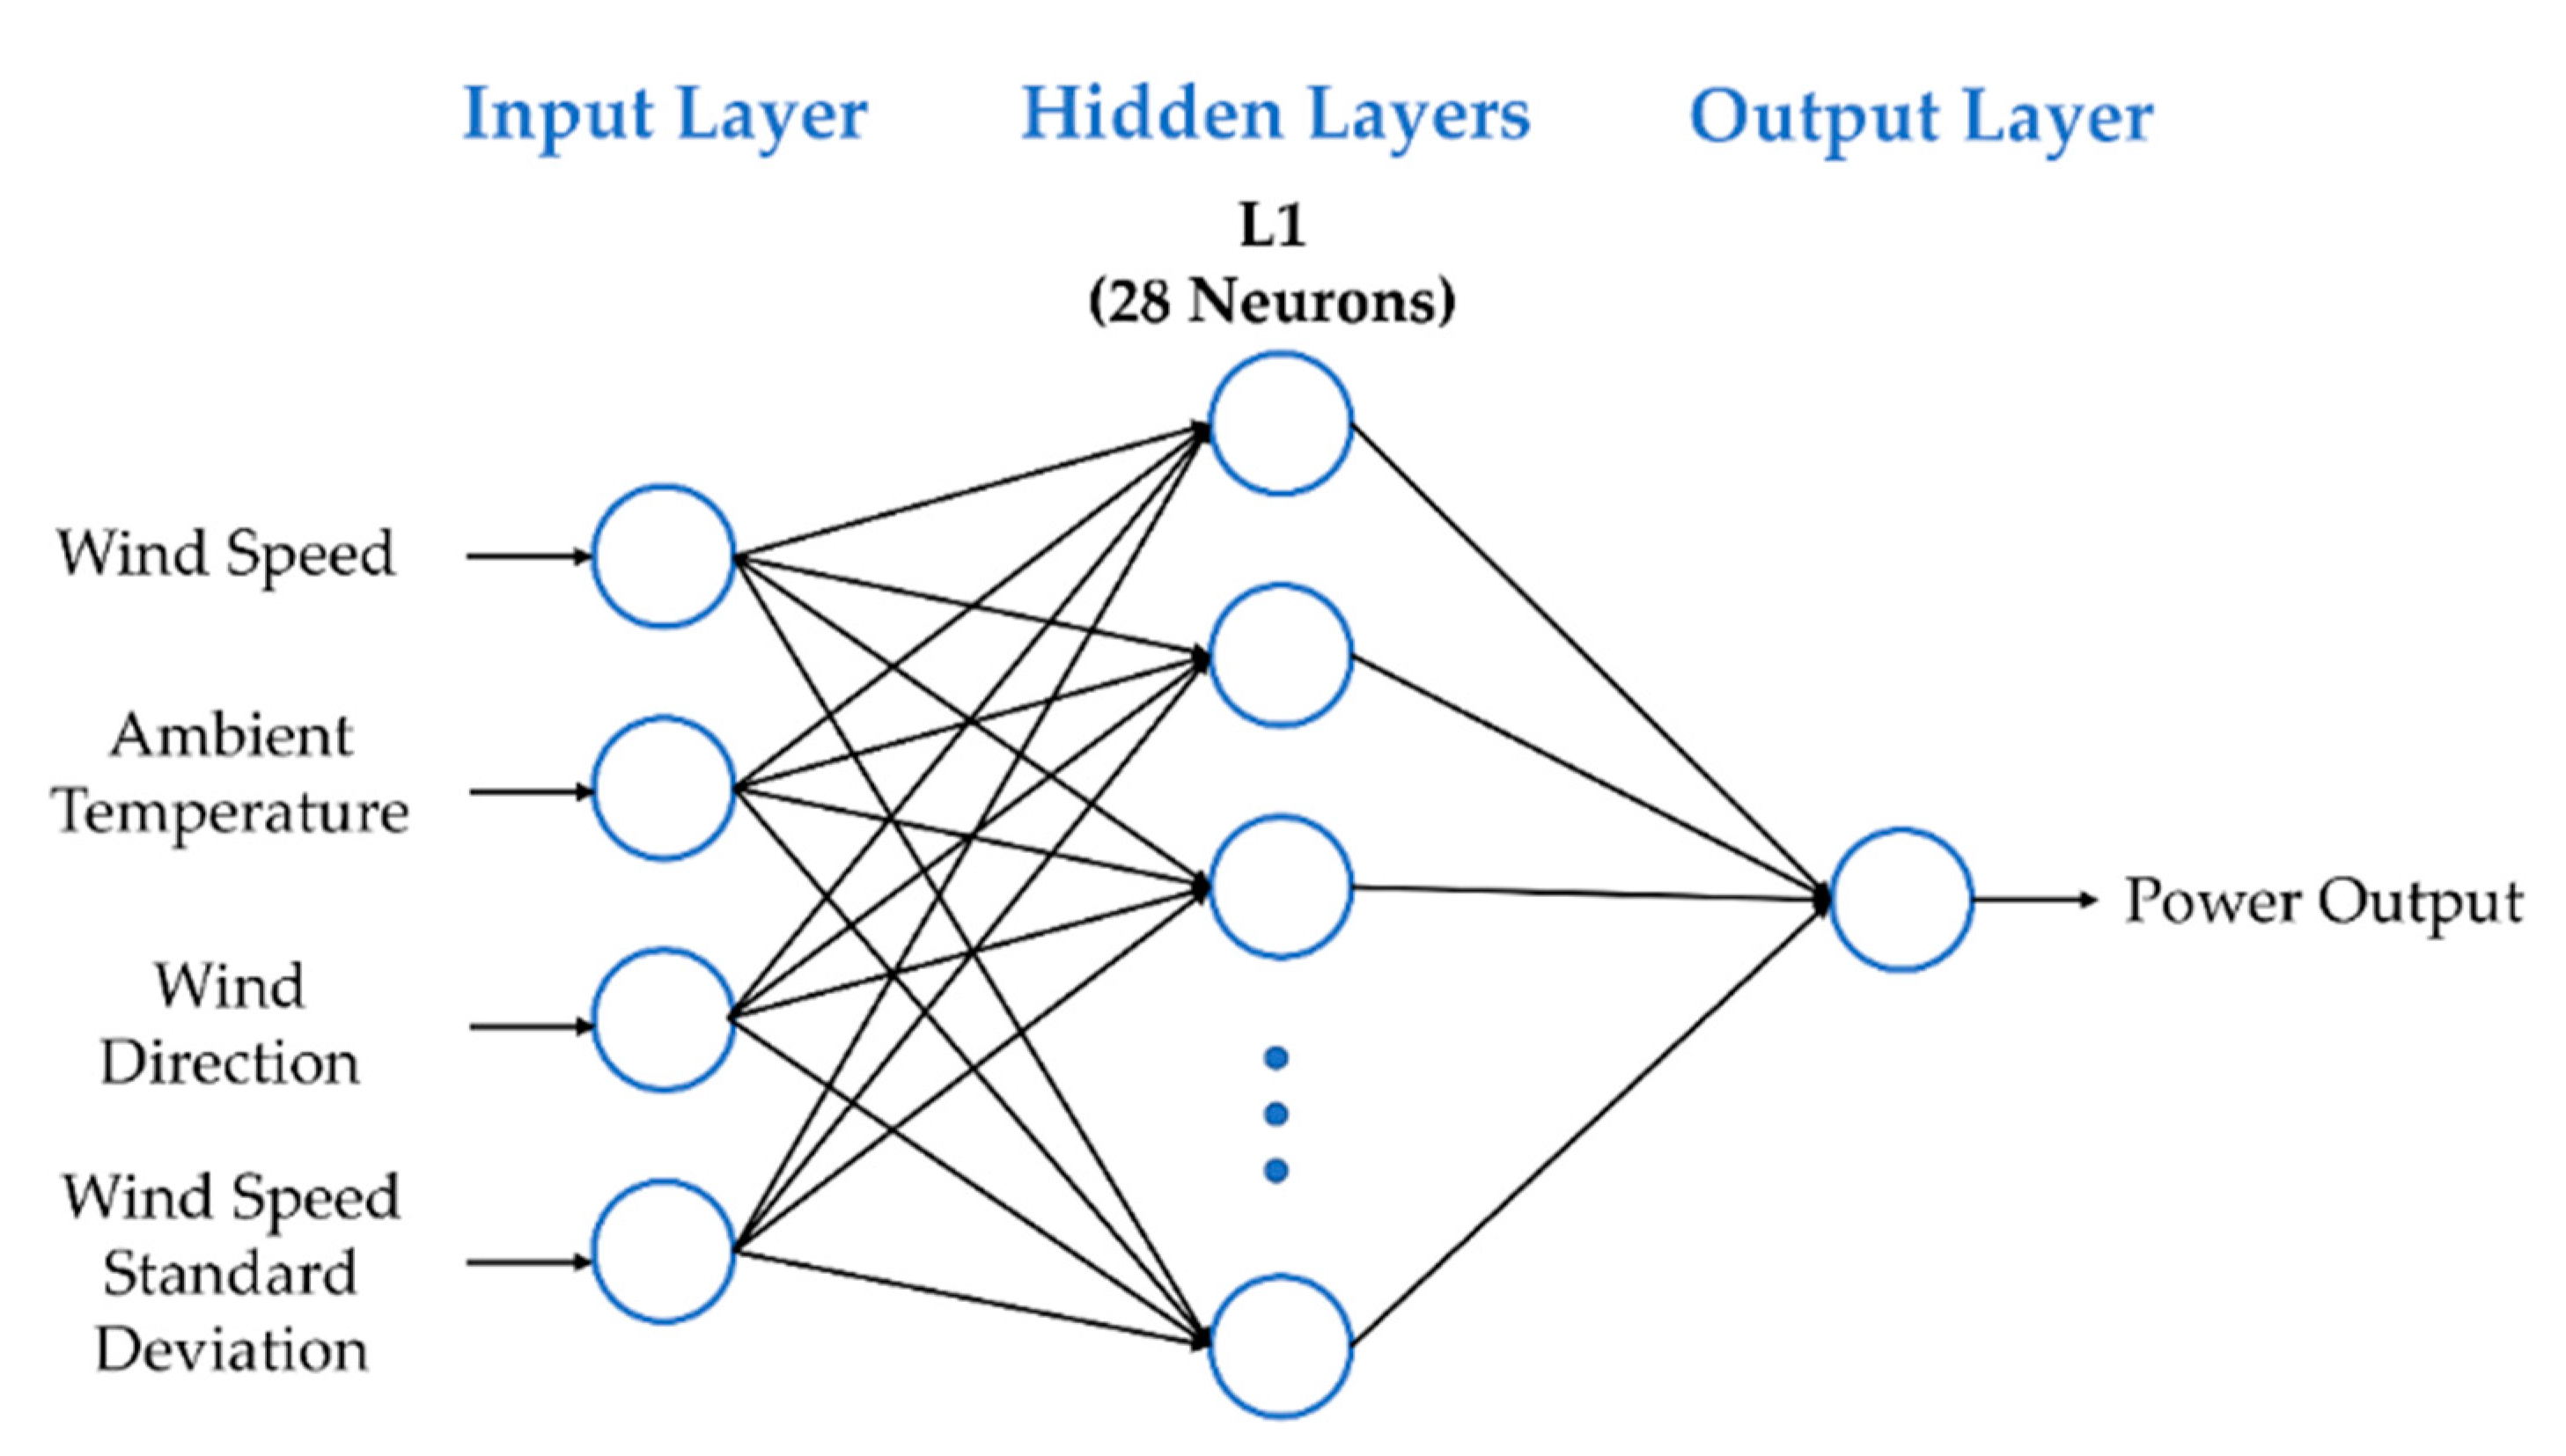
3.2. Model Processing
- Training set (used to effectively train the model, defining the hyperparameters of the ANN);
- Validation set (necessary to overcome the overfitting problem);
- Test set (final set, never seen by the trained model, used instead to assess its real performance).
Feature Selection
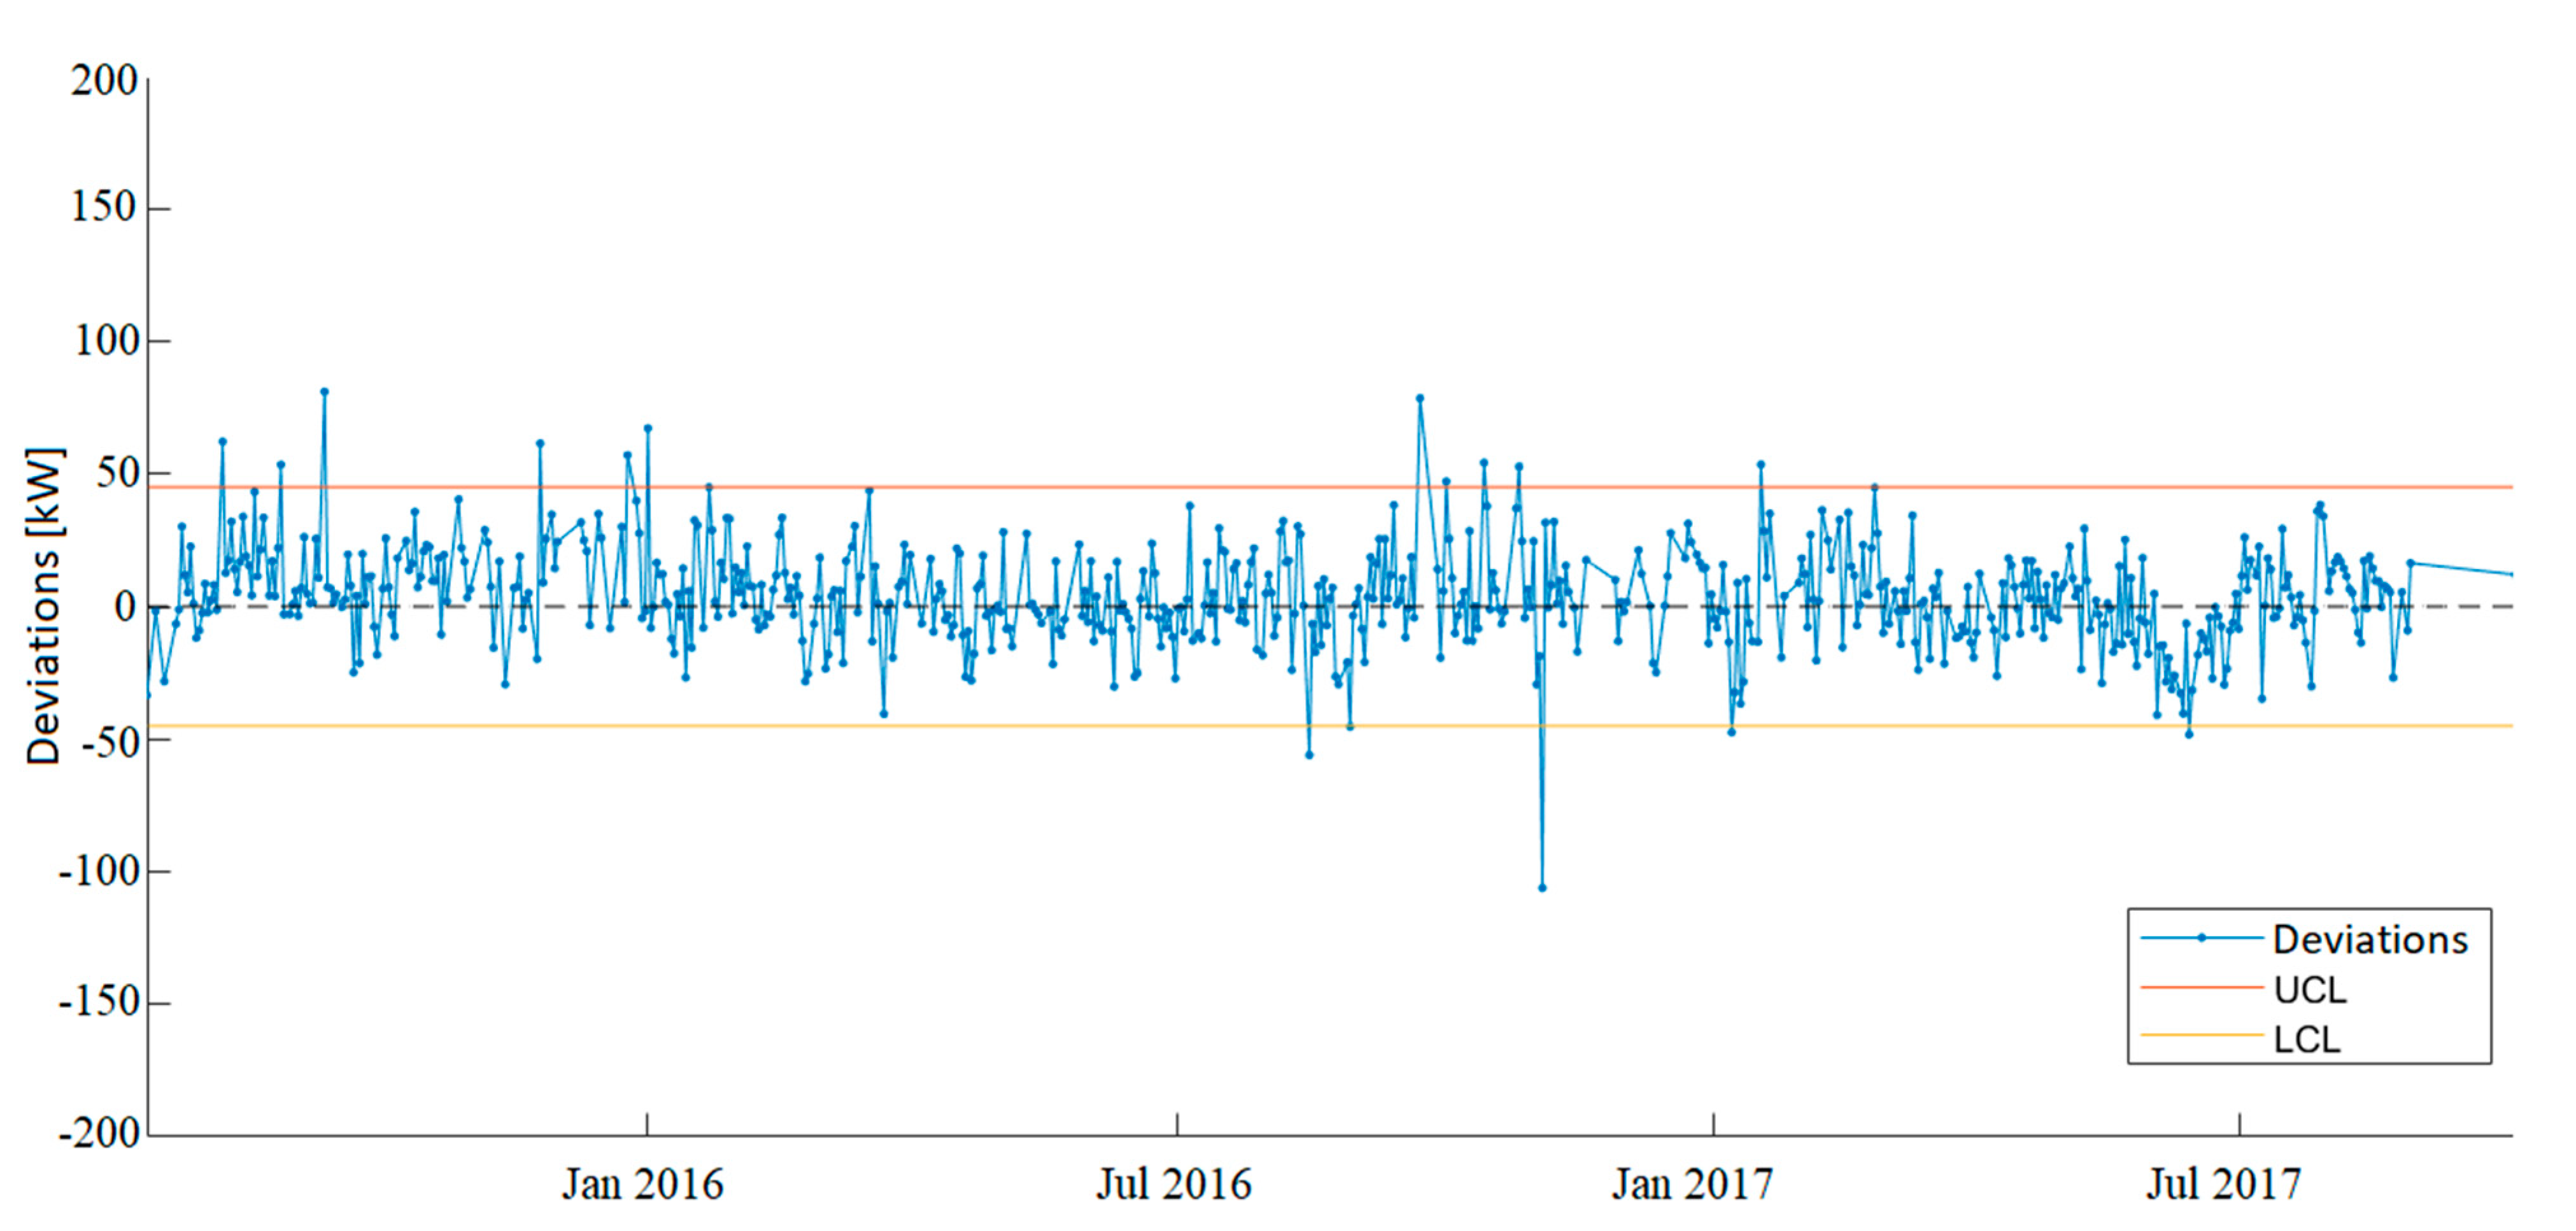
3.3. Post-Processing
- The Upper Control Limit (UCL);
- The Lower Control Limit (LCL).
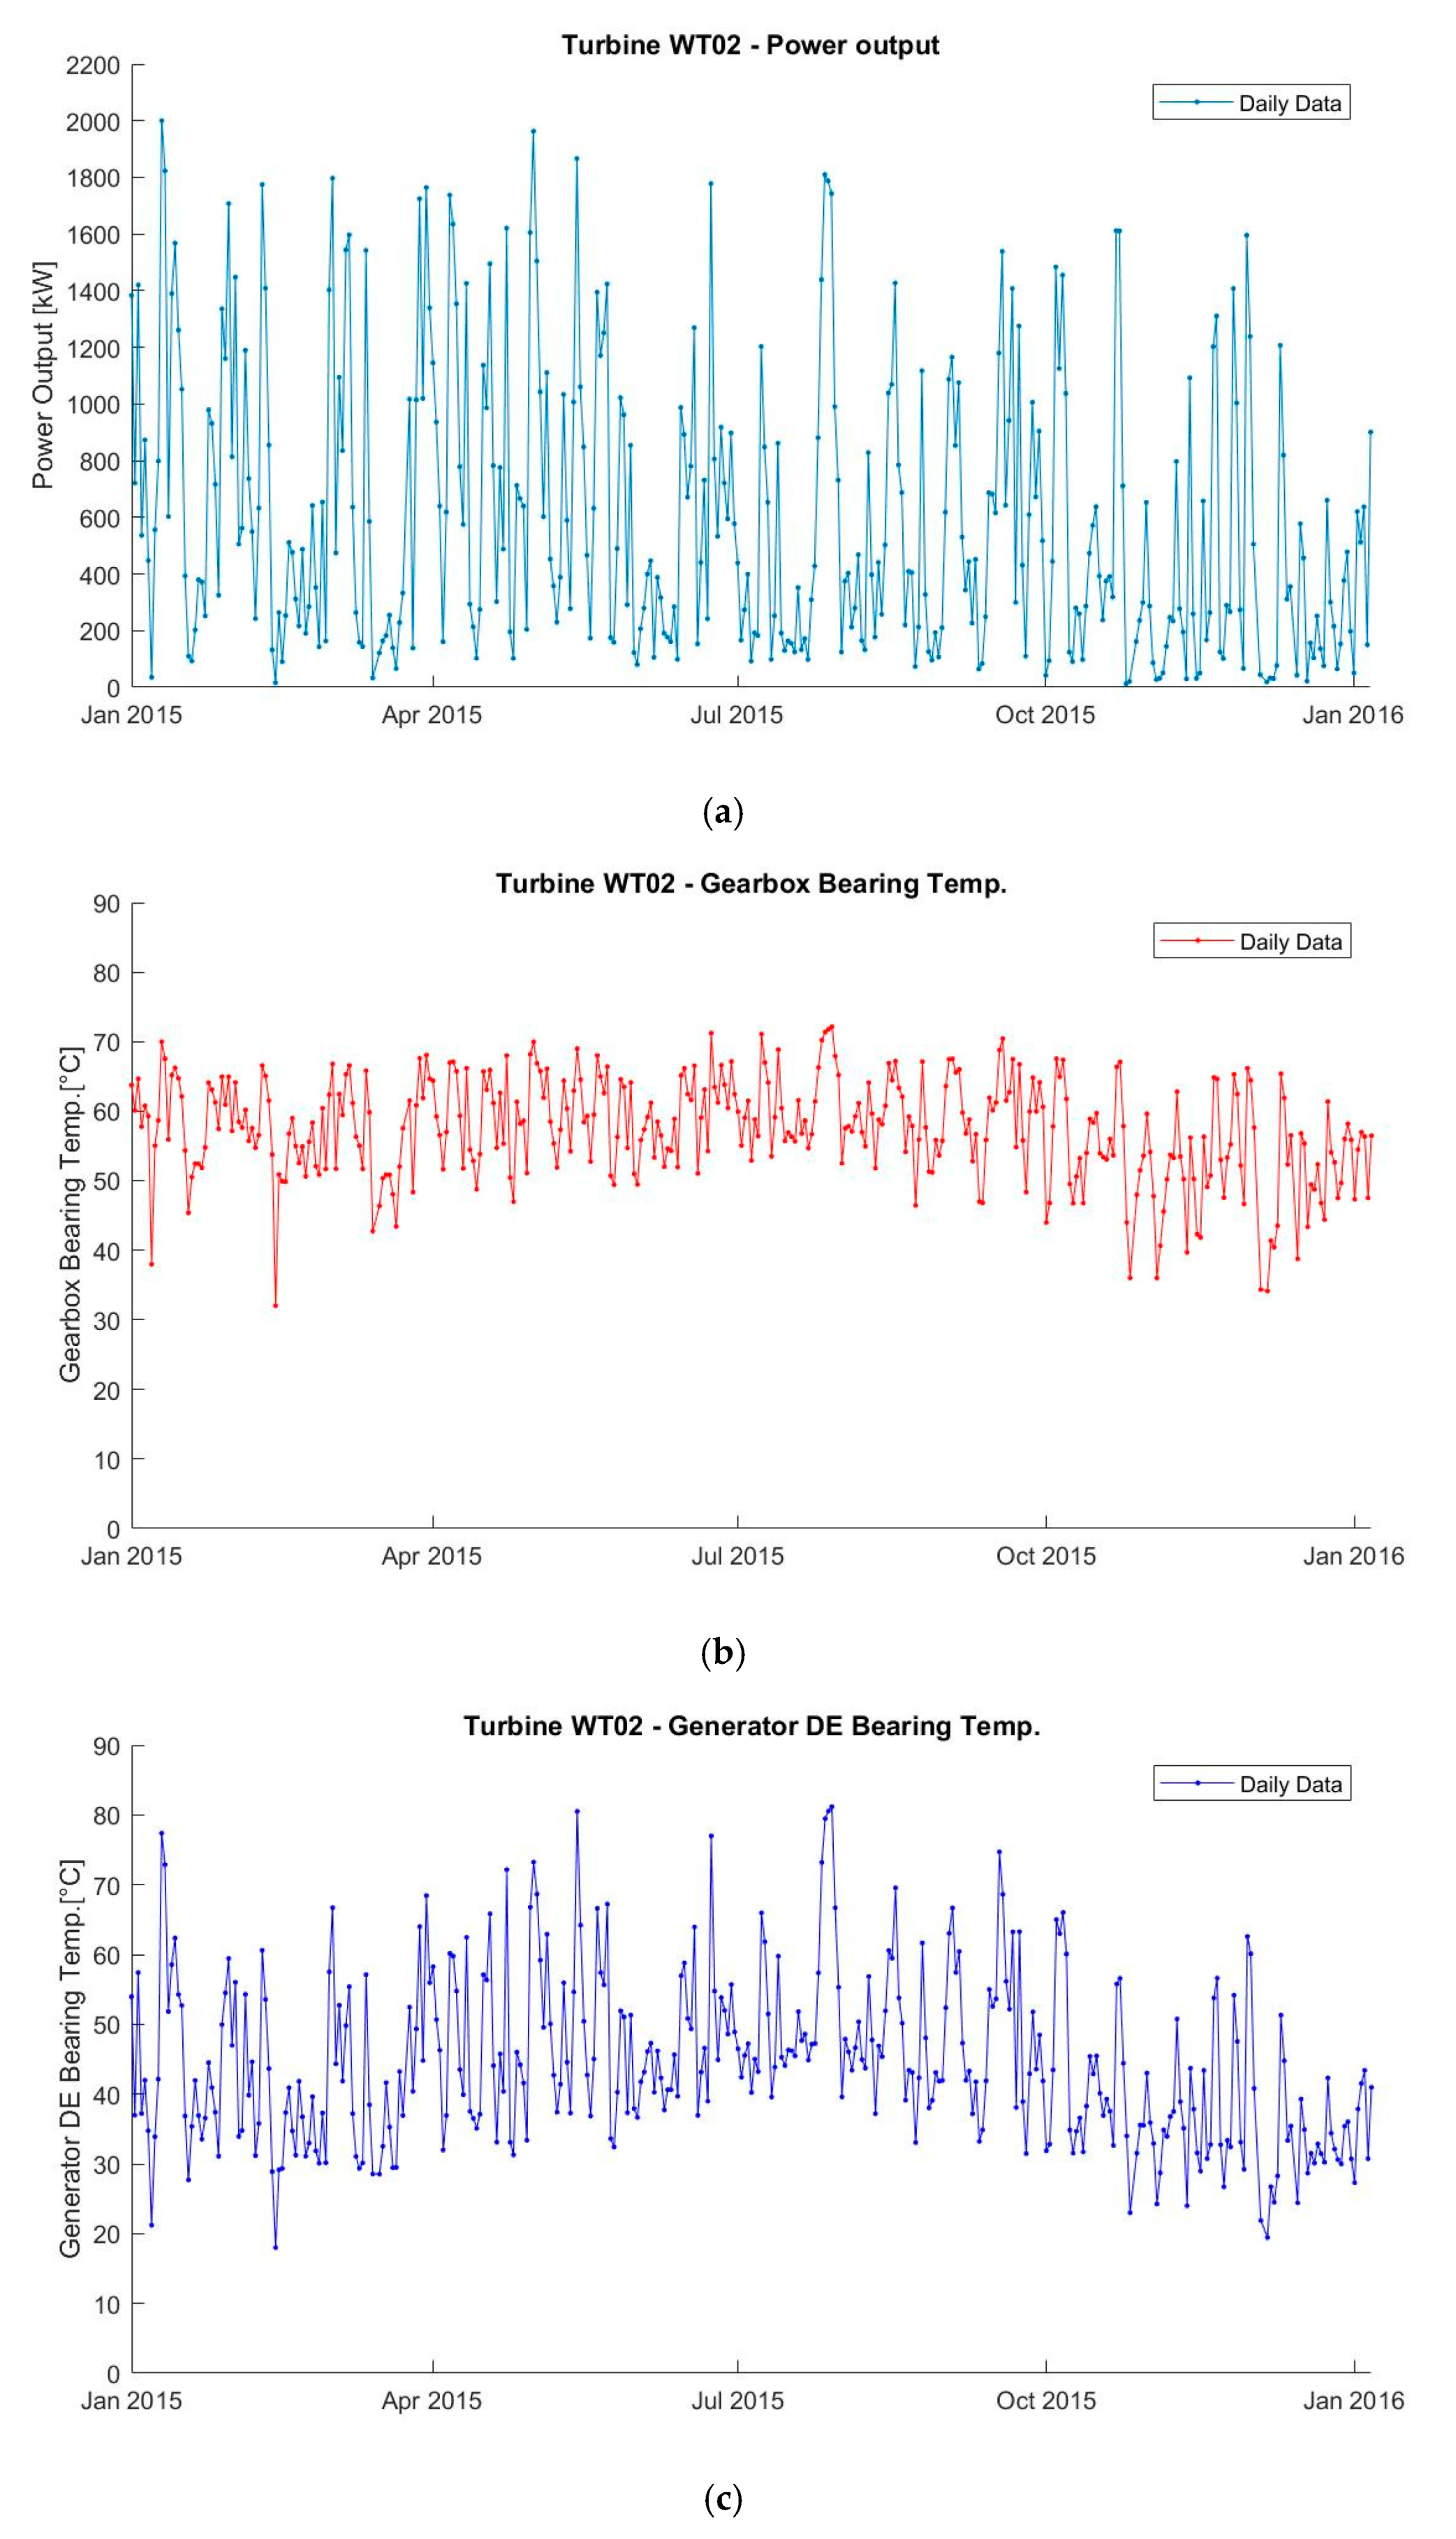
4. Case Study Application
- SCADA data recorded every 10 min, from 1 January 2015 to 9 January 2018, for a total of 192 sampled variables;
- Service report, in which for each month from January 2015 to October 2016, the records of the maintenance interventions carried out are collected.
4.1. Data Pre-Processing
- Output power is zero;
- Instances in which at least one of the measures of the relevant variables is missing;
- Instances in which the turbine is working under a regime of limited power.
4.2. Model Processing
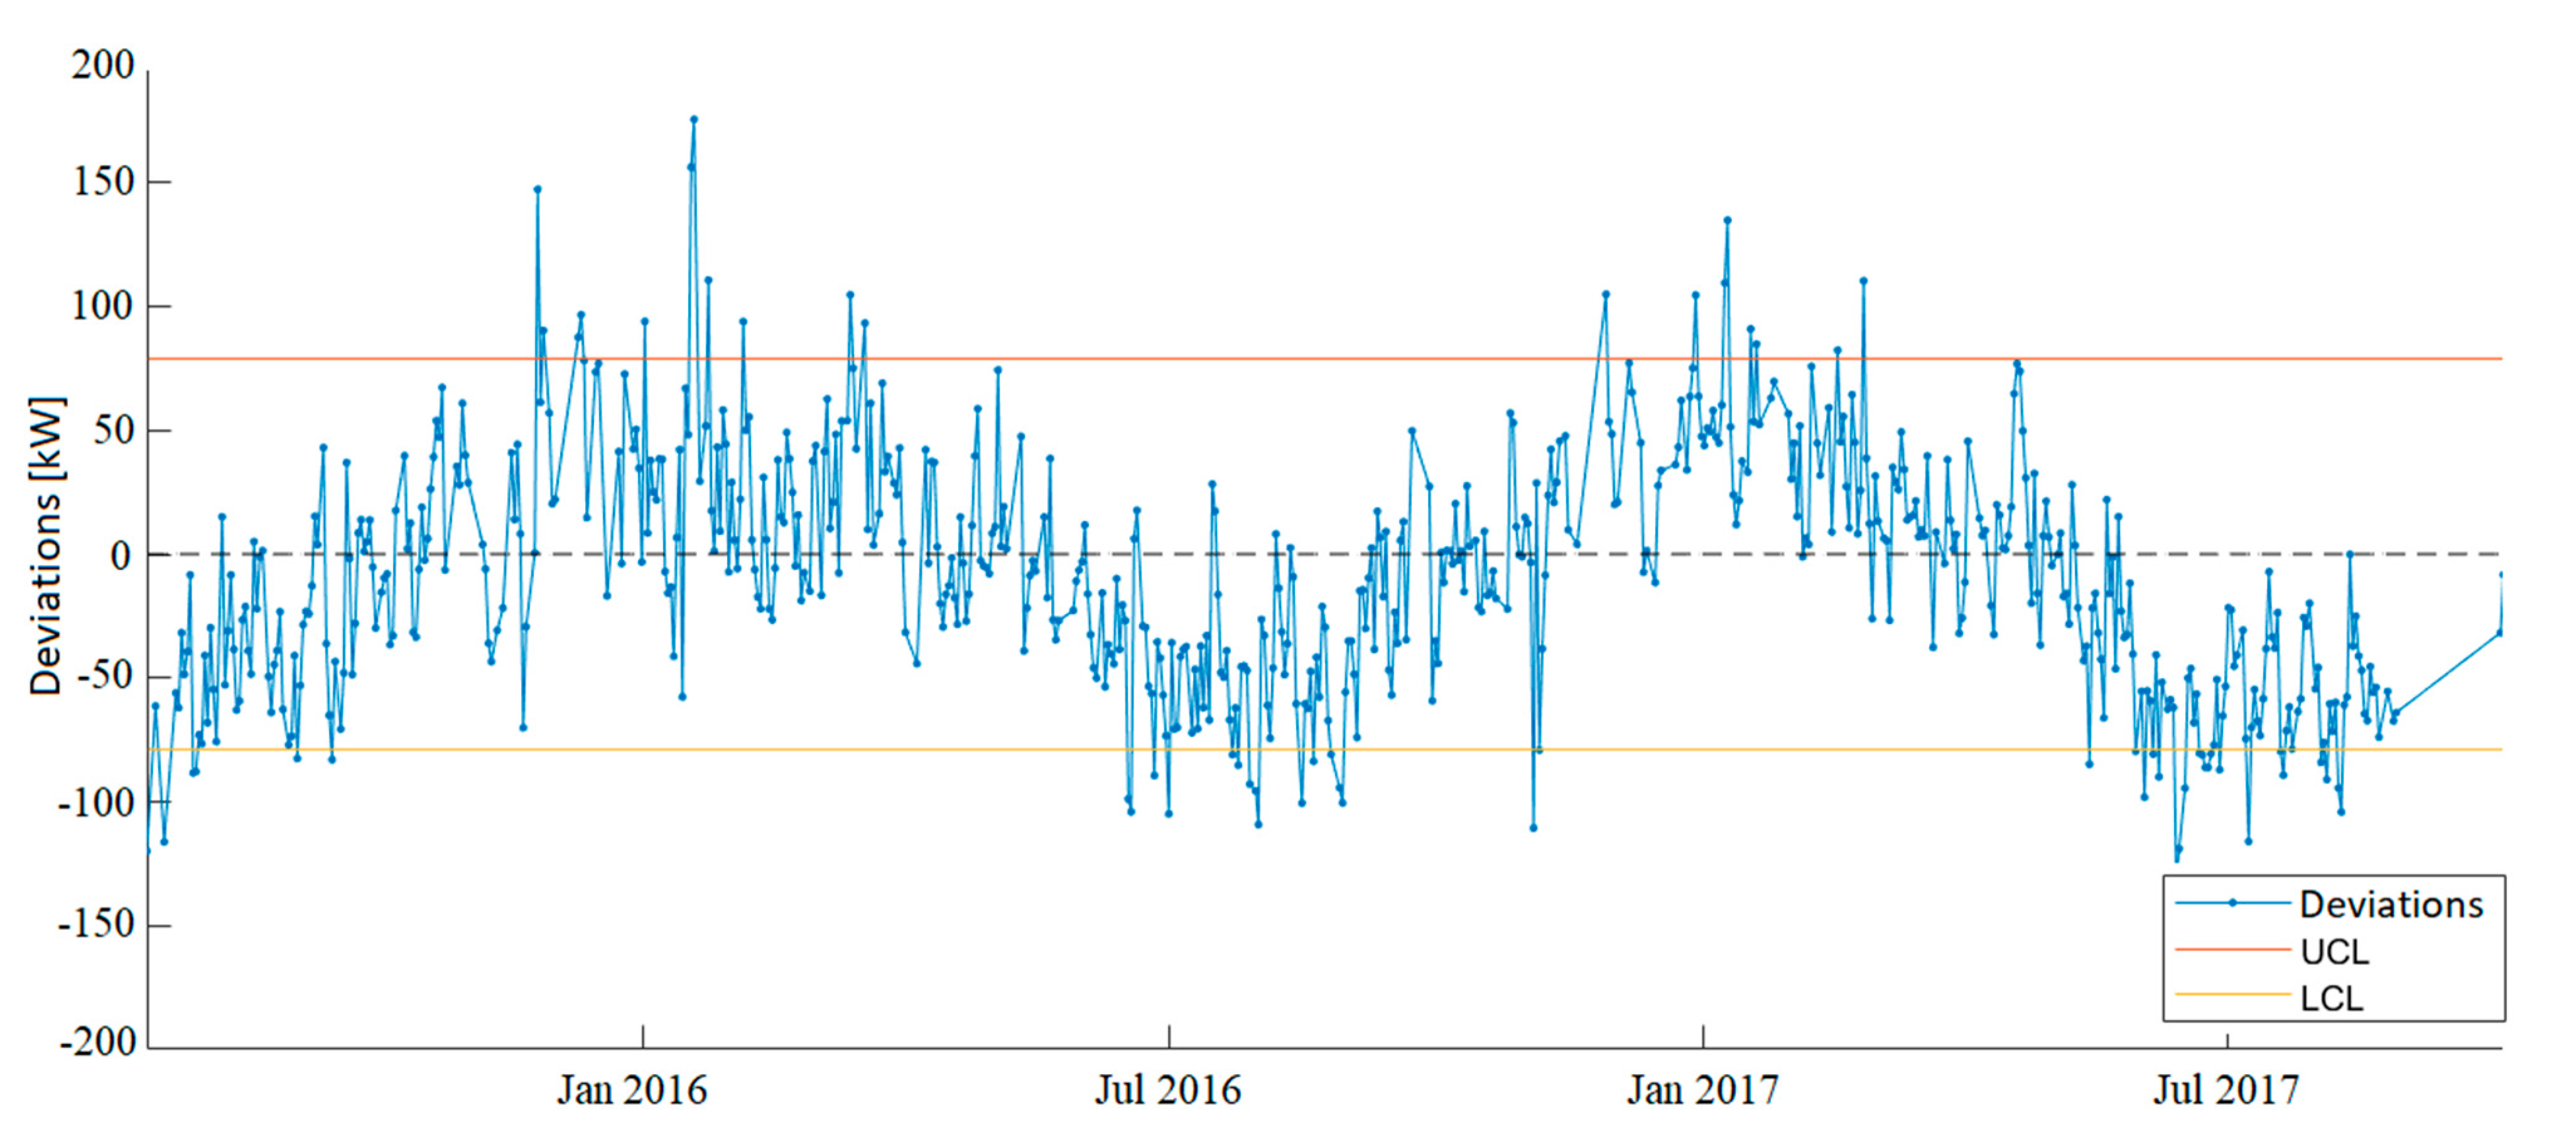
4.3. Wind Turbine Model
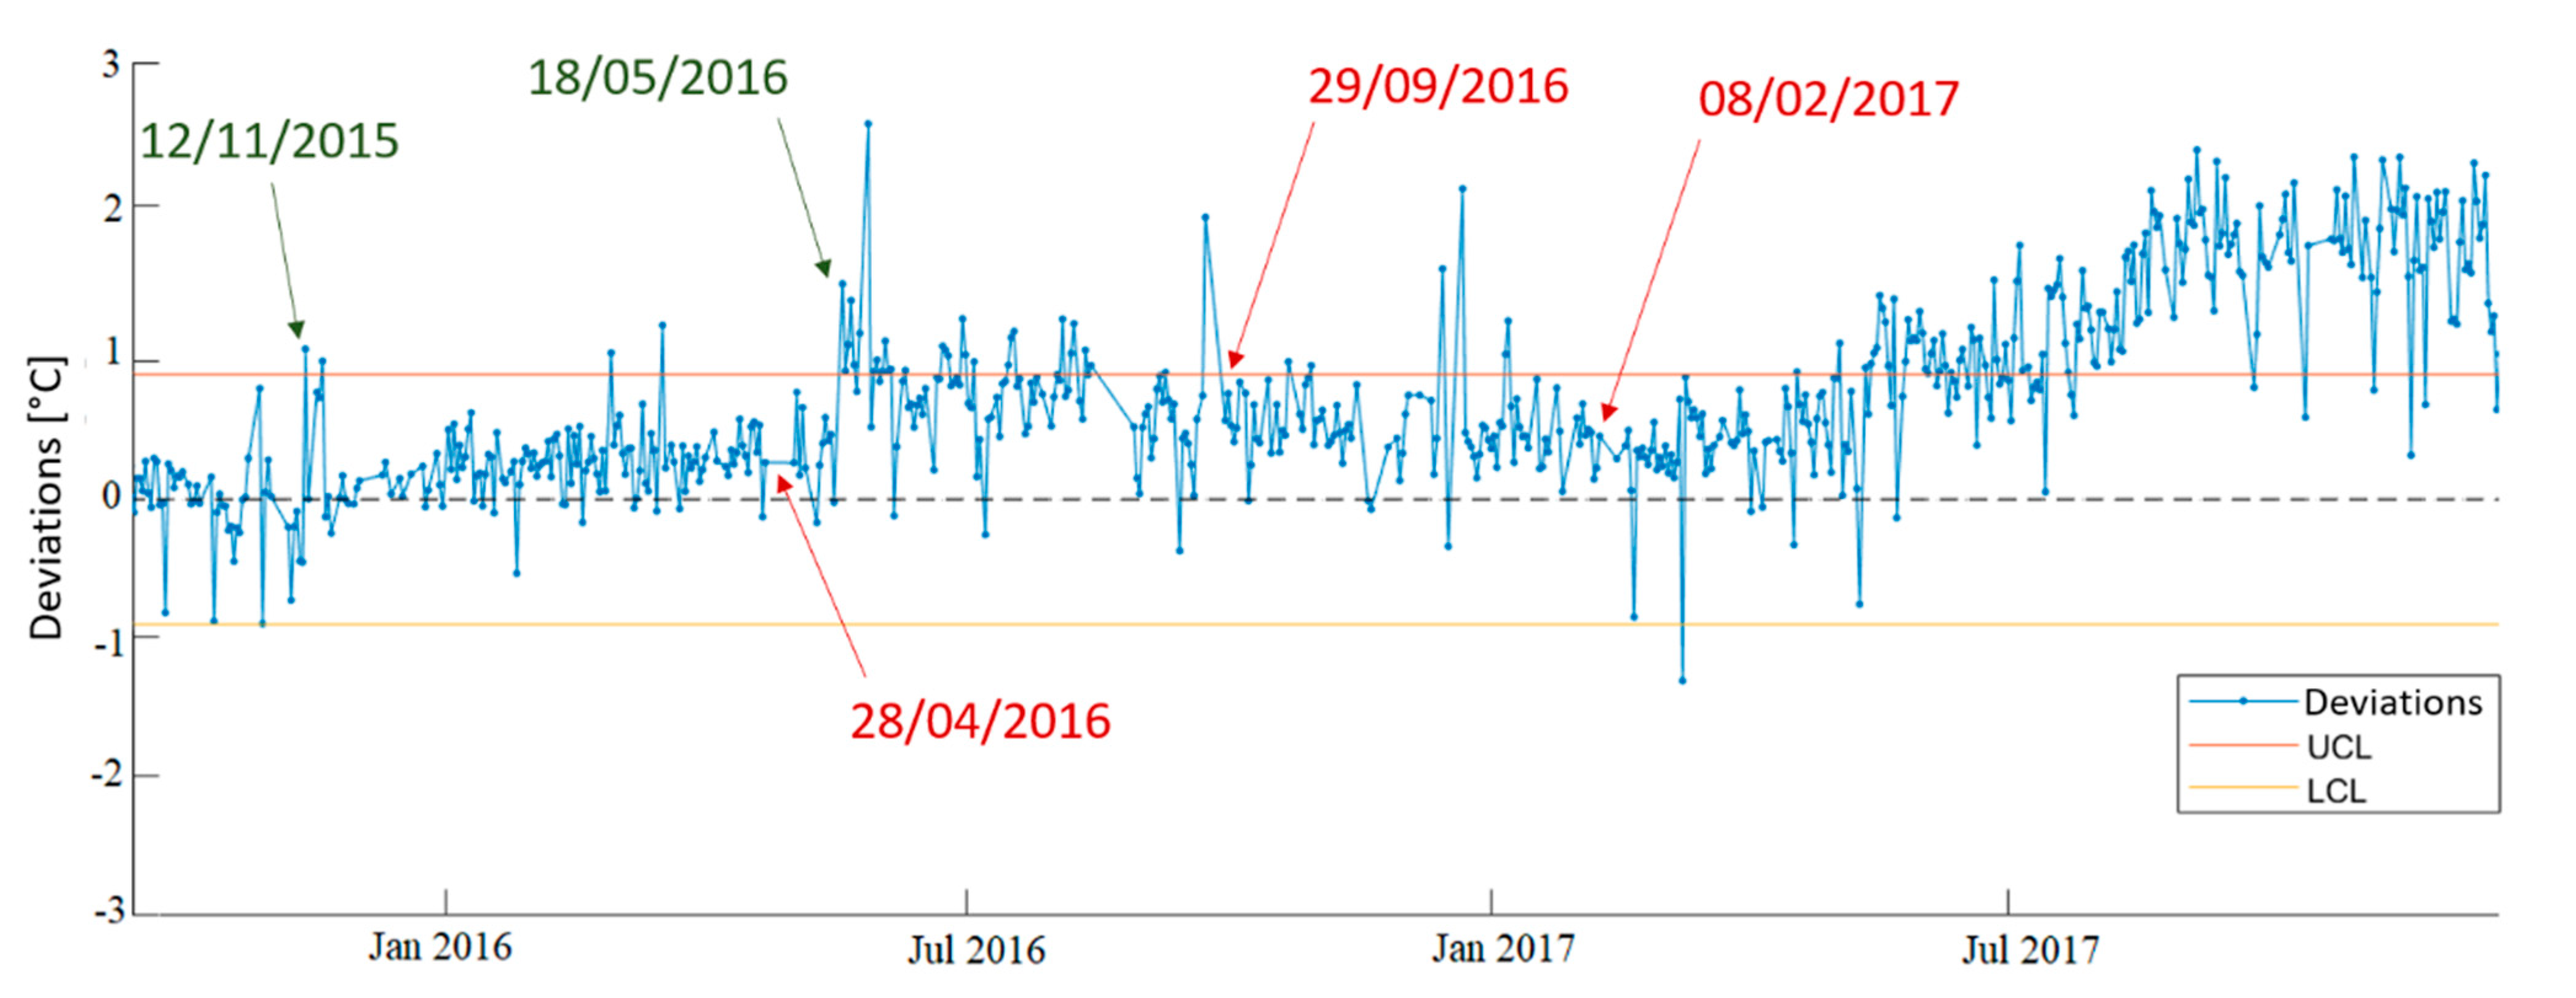
4.4. Gearbox Model
- Repair gearbox from 26 April 2016 to 30 April 2016;
- IMS bearings Replacing from 27 September 2016 to 28 September 2016;
- Repair gearbox from 8 February 2017 to 11 February 2017.
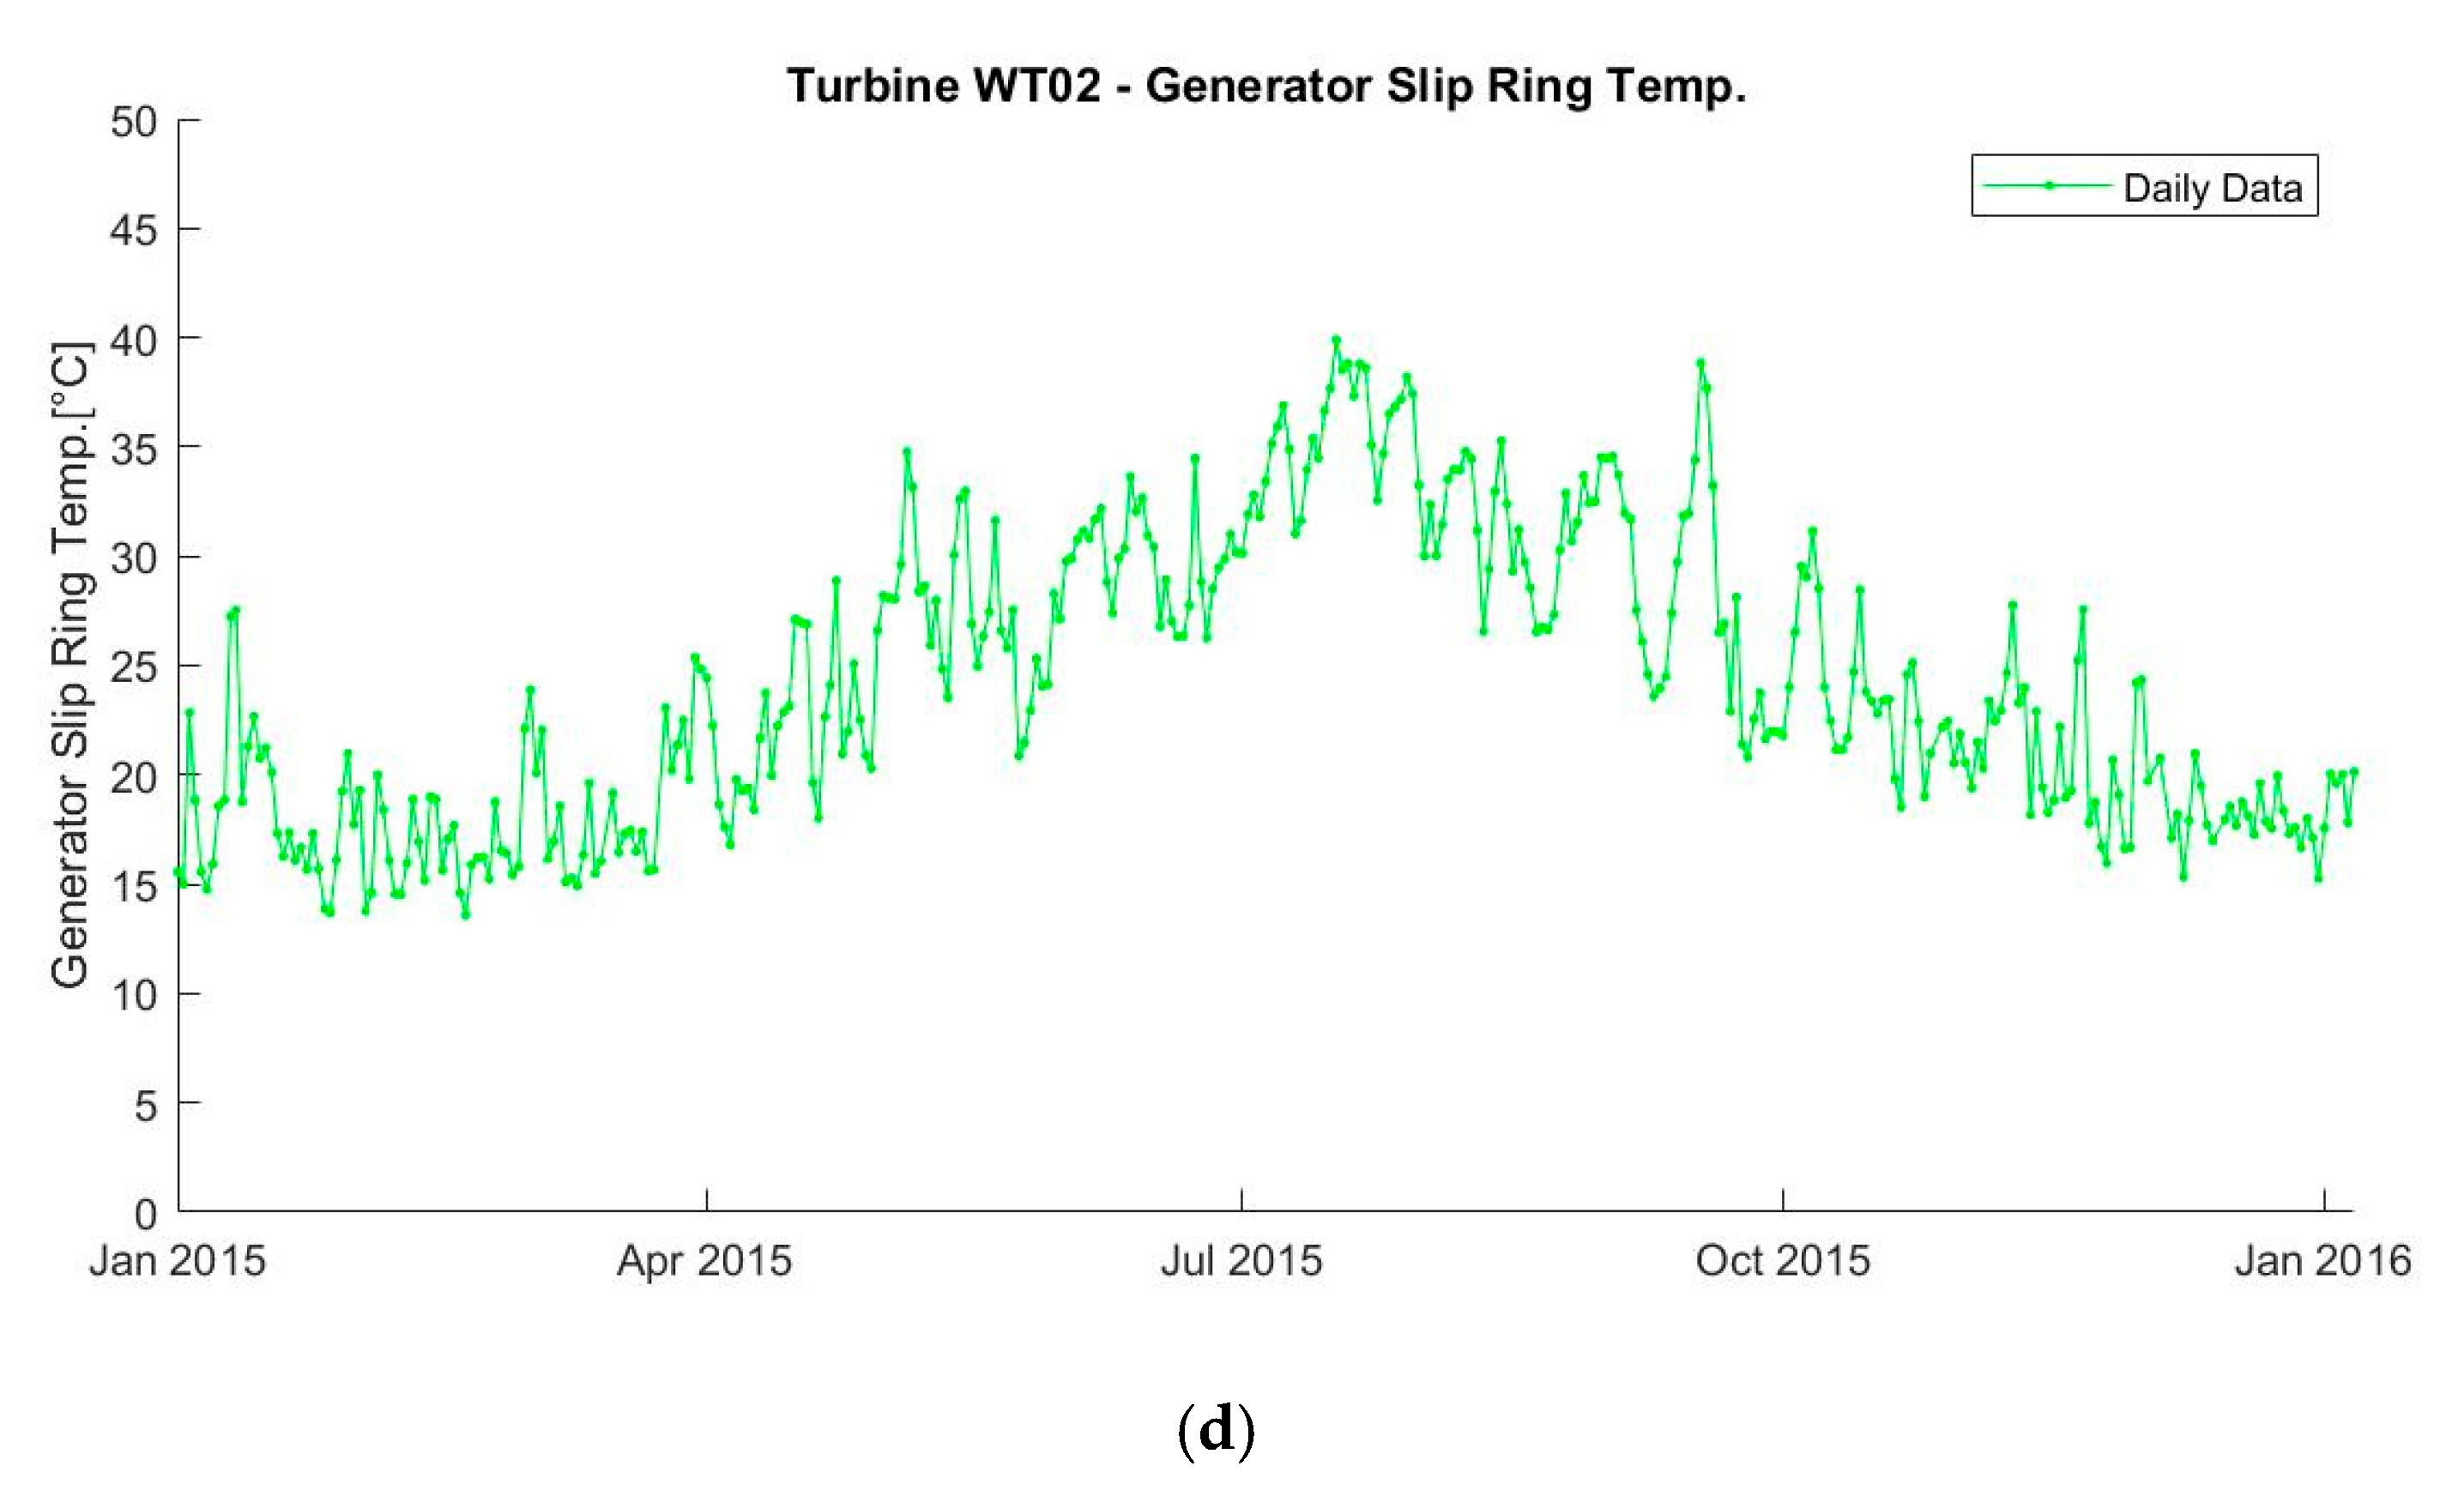
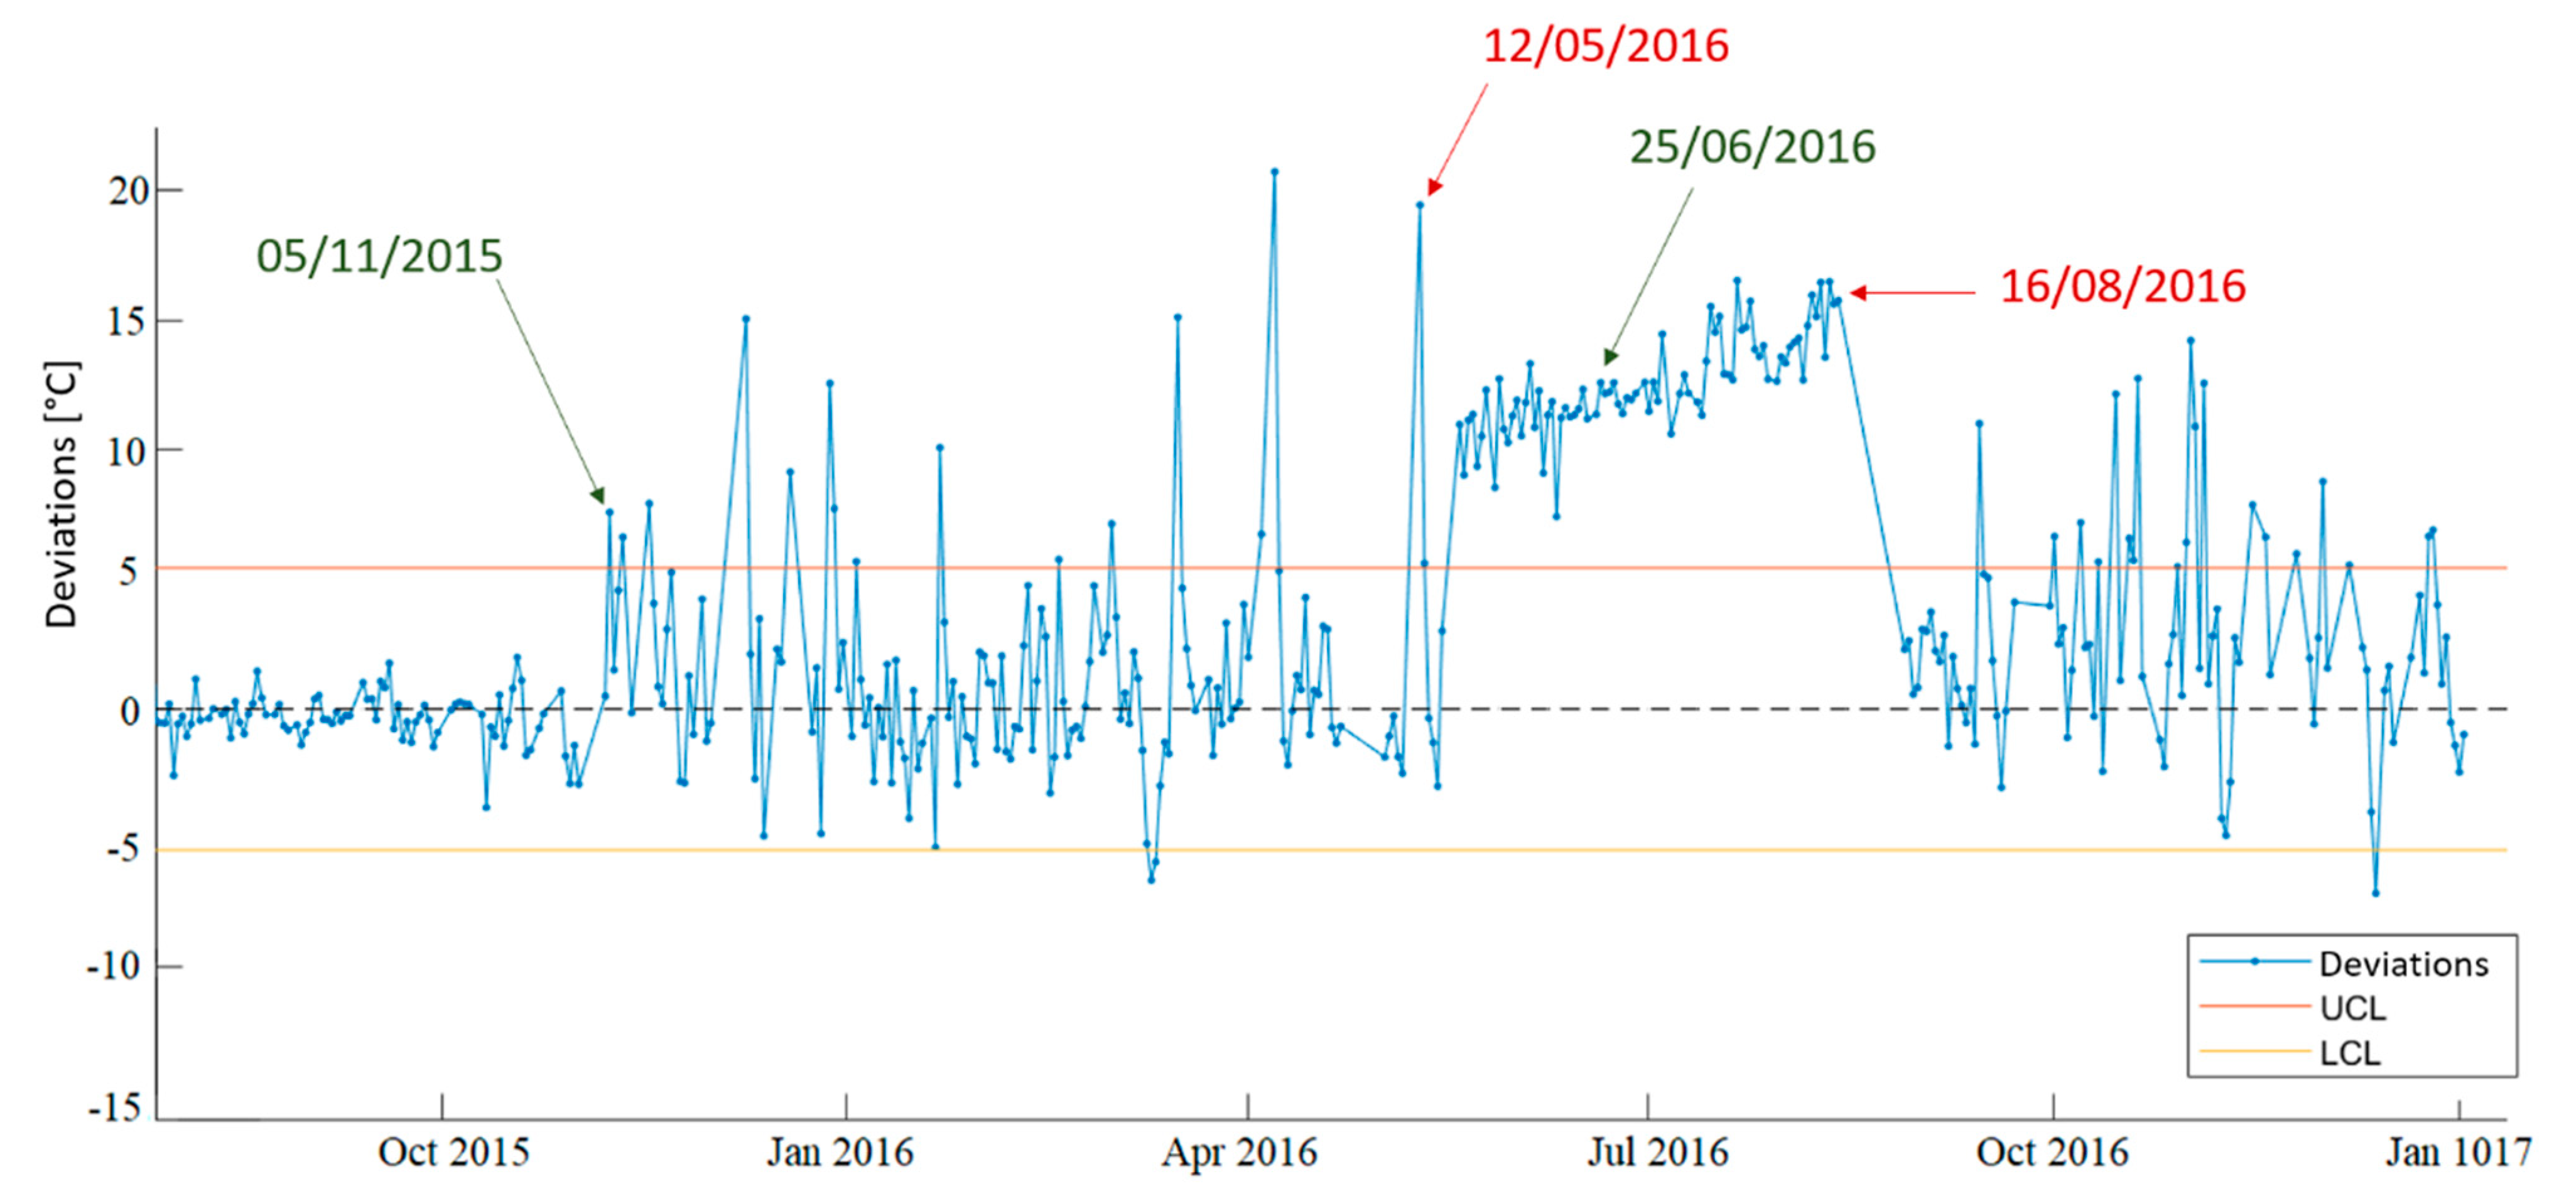
4.5. Generator Model
4.5.1. Wind Turbine WT01
- Non-Drive End (NDE) and Drive End (DE) bearings replacement from 16 May 2016 to 19 May 2016;
- Replacement of the generator from 16 August 2016 to 28 August 2016.
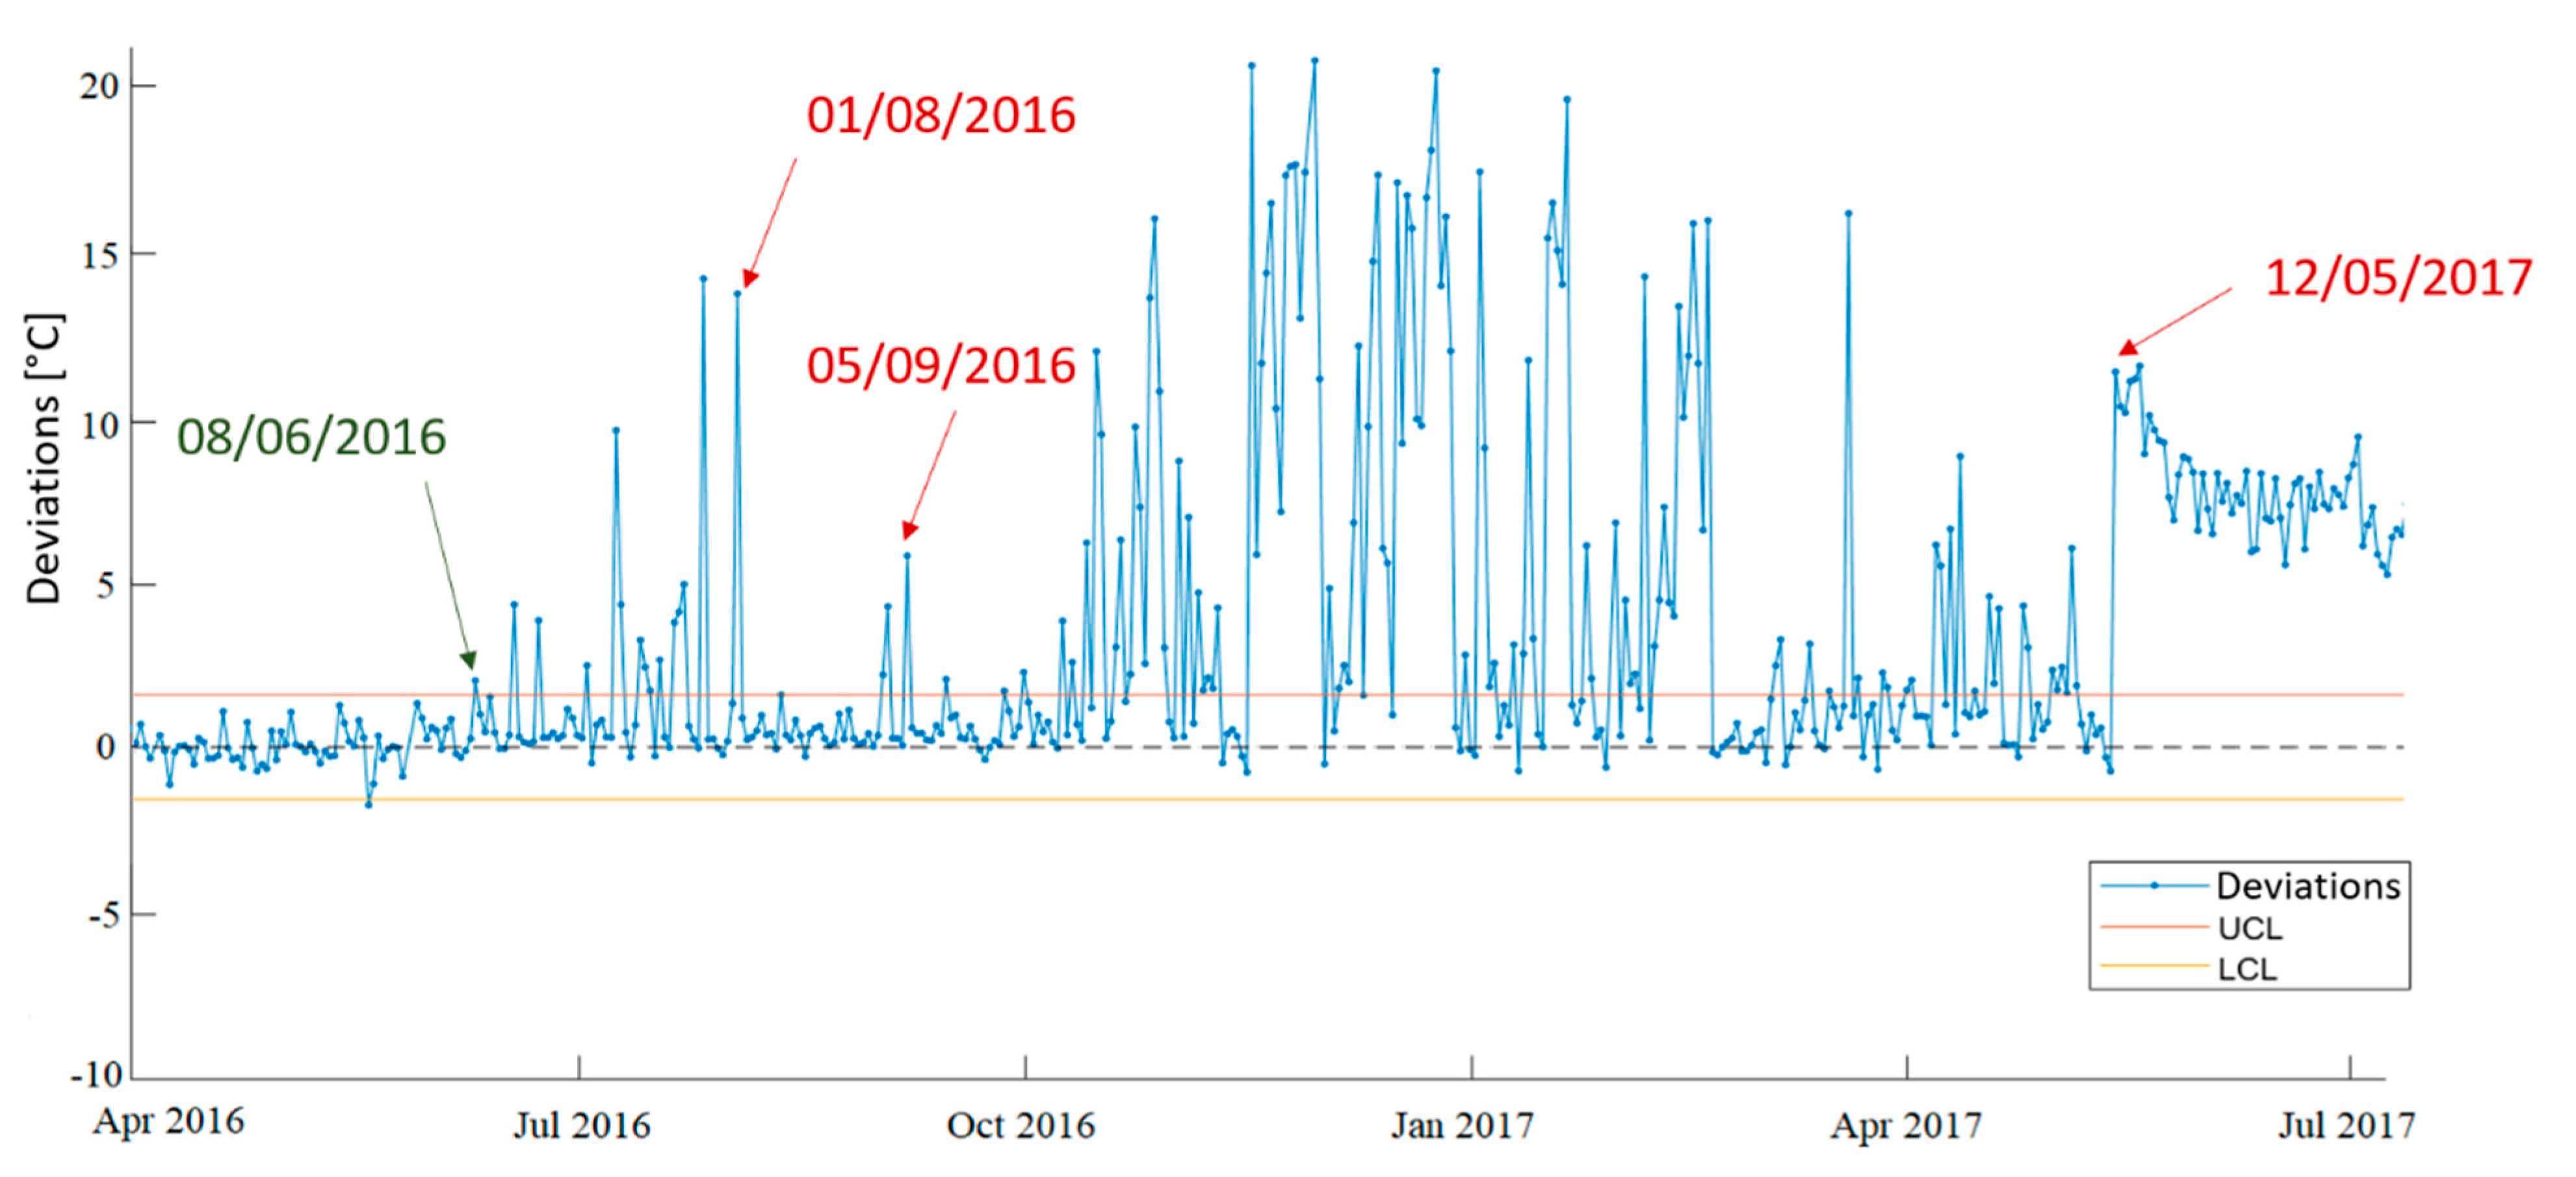
4.5.2. Wind Turbine WT02
- Purging of exhausted grease channel of the generator bearings 1 August 2016;
- NDE and DE bearings replacement from 11 May 2017 to 12 May 2017.
5. Discussion
6. Conclusions
Author Contributions
Funding
Conflicts of Interest
Appendix A

| Ref. | Components | Tools/Methods | Real Case Study | Approach Type | |
|---|---|---|---|---|---|
| [33] | Kusiak et al., 2009 | Wind turbine | k-NN 1 | Yes | SCADA data |
| [39] | Zaher et al., 2009 | Gearbox, generator | Multilayer auto regressive FFNN | Yes | SCADA data |
| [40] | Schlechtingen and Santos, 2011 | Gearbox, generator | Auto-regressive FFNN, Linear regression | Yes | SCADA data |
| [61] | Simani et al., 2011 | Sensors/Actuators | Fuzzy Logic | No | Not specified |
| [41] | Kusiak and Verma, 2012 | Gearbox, generator | Multilayer FFNN | Yes | SCADA data |
| [7] | Zhang et al., 2012 | Gearbox | Fast Fourier Transformation | No | Vibration Analysis |
| [52] | Schlechtingen et al., 2013 | Wind turbine | ANFIS 2, K-NN 1, FFNN, CCFL 3 | Yes | SCADA data |
| [34] | Kusiak and Verma, 2013 | Wind turbine | K-means clustering | Yes | SCADA data |
| [22] | Feng et al., 2013 | Gearbox | Mathematical model | Yes | SCADA data |
| [22] | Feng et al., 2013 | Gearbox | Spectral Analysis | Yes | Vibration signal and oil debris count |
| [8] | Liu, 2013 | Tower | Mathematical model | No | Vibration Analysis |
| [17] | Ling and Cai, 2013 | Generator | Mathematical model | No | MCSA |
| [57] | Schlechtingen and Santos, 2014 | Gearbox, generator | ANFIS 2 | Yes | SCADA data |
| [42] | Zhang and Wang, 2014 | Main bearing | Multilayer FFNN | Yes | SCADA data |
| [43] | Karlsson, 2015 | Wind turbine | NARX | Yes | SCADA data |
| [18] | Merabet et al., 2015 | Generator | Fuzzy Logic | No | MCSA |
| [19] | El Bouchikhi et al., 2015 | Generator | Maximum likelihood estimator | No | MCSA |
| [35] | Leahy et al., 2016 | Wind turbine | SVM 4 | Yes | SCADA data |
| [62] | Zhang and Ma, 2016 | Wind turbine | Parallel factor analysis, K-means | Yes | SCADA data |
| [14] | Gómez Muñoz and García Márquez, 2016 | Blades | Graphical method | No | Acoustic Emission Analysis |
| [44] | Sun et al., 2016 | Gearbox, generator | FFNN 2, Fuzzy synthetic evaluation | Yes | SCADA data |
| [63] | Pozo and Vidal, 2016 | Sensors/Actuators | PCA 5, Statistical hypothesis testing | No | SCADA data |
| [64] | Bi et al., 2017 | Pitch system | Mathematical model | Yes | SCADA data |
| [36] | Ouyang et al., 2017 | Wind turbine | SVM 4 | Yes | SCADA data |
| [65] | Wang et al., 2017 | Gearbox | Deep Neural Network | Yes | SCADA data |
| [66] | Nazir et al., 2017 | Sensors/Actuators | Mathematical model | No | Not specified |
| [45] | Bangalore et al., 2017 | Gearbox | NARX | Yes | SCADA data |
| [59] | Marčiukaitis et al., 2017 | Wind turbine | Non-linear regression | Yes | SCADA data |
| [46] | Nithya et al., 2017 | Rotor | FFNN 2 | No | SCADA data |
| [53] | Zhao et al., 2017 | Generator | SVM 4, ANN, K-NN 1, Naive Bayesian | Yes | SCADA data |
| [67] | Yu et al., 2018 | Sensors/Actuators | Deep Belief Network | No | Not specified |
| [68] | Alvarez and Ribaric, 2018 | Gearbox | Mathematical model | Yes | SCADA data |
| [69] | González-González et al., 2018 | Pitch system | Mathematical model | Yes | Not specified |
| [20] | Artigao et al., 2018 | Generator | Fast Fourier Transformation | Yes | MCSA |
| [70] | Dao et al., 2018 | Wind turbine | Cointegration analysis | Yes | SCADA data |
| [47] | Manobel et al., 2018 | Wind turbine | Gaussian Processes, ANN | Yes | SCADA data |
| [48] | Bangalore and Patriksson, 2018 | Gearbox | ANN | Yes | SCADA data |
| [37] | Vidal et al., 2018 | Sensors/Actuators | SVM 4 | No | SCADA data |
| [71] | Zhao, 2018 | Gearbox, generator | Deep auto-encoder network | Yes | SCADA data |
| [72] | Yang et al., 2018 | Wind turbine | Multivariate EWMA 6 | Yes | SCADA data |
| [73] | Wen et al., 2018 | Various components | CNN 7 | No | SCADA data |
| [49] | Wang et al., 2018 | Gearbox, generator | PCA 5, ANN | Yes | SCADA data |
| [74] | Zhang e Lang, 2018 | Bearings | Wavelet energy transmissibility functions | Yes | Vibration analysis |
| [11] | Li et al., 2019 | Gearbox bearing | Stochastic resonance | Yes | Vibration analysis |
| [12] | Gu e Chen, 2019 | Gearbox bearing | Stochastic resonance | Yes | Vibration analysis |
| [13] | Li et al., 2019 | Gearbox bearing | Hidden-Markov model | Yes | Vibration analysis |
| [75] | Qian et al., 2019 | Gearbox | HELM 8 algorithm, cloud computing | Yes | SCADA data |
| [50] | Fu et al., 2019 | Gearbox | CNN 7, LSTM 9 networks | Yes | SCADA data |
| [76] | Lei et al., 2019 | Various components | LSTM 9 networks | No | Not specified |
| [77] | Saari et al., 2019 | Bearings | SVM 4 | Yes | Vibration analysis |
| [9] | Jiang et al., 2019 | Gearbox | Multiscale CNN 7 | No | Vibration analysis |
| [78] | Bakdi et al., 2019 | Wind turbine | PCA 5, EWMA 6 | No | Not specified |
| [79] | Rizk et al., 2020 | Blades | Hyperspectral imaging technique | No | Image Analysis |
| [80] | Dong et al., 2020 | Wind turbine | Mathematical model | Yes | SCADA data |
| [38] | Liu et al., 2020 | Generator, converter, pitch system | Convolutional Neural Network, SVM 4 | Yes | SCADA data |
| [81] | Chang et al., 2020 | Gearbox | Concurrent CNN 7 | No | Vibration analysis |
| [82] | Pujol-Vazquez et al., 2020 | Pitch actuator | Mathematical model | No | Not specified |
| [83] | Stetco et al., 2020 | Generator | CNN 7 | No | Data-driven using current signals |
| [84] | Zhang and Lang, 2020 | Wind turbine, generator | Dynamic model sensor | Yes | SCADA data |
| [85] | Chen et al., 2020 | Generator | Modulation signal bispectrum | Yes | Current signals analysis |
| [86] | Yang et al., 2021 | Blades | Deep learning model | Yes | Image Analysis |
| [10] | Chen et al., 2021 | Generator bearings | DCGAN 10 | Yes | Data-driven using vibration data |
| [29] | Wang and Liu, 2021 | Gearbox, Generator | CMI 11, K-NN 1 | Yes | SCADA data |
References
- Digital Science & Research Solutions, Inc. Renewable Energy Sources and Climate Change Mitigation: Special Report of the Intergovernmental Panel on Climate Change. Choice Rev. Online 2012, 49, 49-6309. [Google Scholar] [CrossRef]
- Wind Europe: Wind Energy in Europe in 2019—Trends and Statistics. Available online: https://windeurope.org/data-and-analysis/product/wind-energy-in-europe-in-2019-trends-and-statistics/ (accessed on 15 October 2020).
- Blanco, M.I. The Economics of Wind Energy. Renew. Sustain. Energy Rev. 2009, 13, 1372–1382. [Google Scholar] [CrossRef]
- Hahn, B.; Durstewitz, M.; Rohrig, K. Reliability of Wind Turbines. In Wind Energy; Springer: Berlin/Heidelberg, Germany, 2007; pp. 329–333. [Google Scholar]
- Tautz-Weinert, J.; Watson, S.J. Using SCADA Data for Wind Turbine Condition Monitoring—A Review. IET Renew. Power Gener. 2017, 11, 382–394. [Google Scholar] [CrossRef]
- Liu, Z.; Zhang, L.; Carrasco, J. Vibration Analysis for Large-Scale Wind Turbine Blade Bearing Fault Detection with an Empirical Wavelet Thresholding Method. Renew. Energy 2020, 146, 99–110. [Google Scholar] [CrossRef]
- Zhang, Z.; Verma, A.; Kusiak, A. Fault Analysis and Condition Monitoring of the Wind Turbine Gearbox. IEEE Trans. Energy Convers. 2012, 27, 526–535. [Google Scholar] [CrossRef]
- Liu, W.Y. The Vibration Analysis of Wind Turbine Blade–Cabin–Tower Coupling System. Eng. Struct. 2013, 56, 954–957. [Google Scholar] [CrossRef]
- Jiang, G.; He, H.; Yan, J.; Xie, P. Multiscale Convolutional Neural Networks for Fault Diagnosis of Wind Turbine Gearbox. IEEE Trans. Ind. Electron. 2019, 66, 3196–3207. [Google Scholar] [CrossRef]
- Chen, P.; Li, Y.; Wang, K.; Zuo, M.J.; Heyns, P.S.; Baggeröhr, S. A Threshold Self-Setting Condition Monitoring Scheme for Wind Turbine Generator Bearings Based on Deep Convolutional Generative Adversarial Networks. Measurement 2021, 167, 108234. [Google Scholar] [CrossRef]
- Li, J.; Li, M.; Zhang, J.; Jiang, G. Frequency-Shift Multiscale Noise Tuning Stochastic Resonance Method for Fault Diagnosis of Generator Bearing in Wind Turbine. Measurement 2019, 133, 421–432. [Google Scholar] [CrossRef]
- Gu, X.; Chen, C. Adaptive Parameter-Matching Method of SR Algorithm for Fault Diagnosis of Wind Turbine Bearing. J. Mech. Sci. Technol. 2019, 33, 1007–1018. [Google Scholar] [CrossRef]
- Li, J.; Zhang, X.; Zhou, X.; Lu, L. Reliability Assessment of Wind Turbine Bearing Based on the Degradation-Hidden-Markov Model. Renew. Energy 2019, 132, 1076–1087. [Google Scholar] [CrossRef]
- Gómez Muñoz, C.; García Márquez, F. A New Fault Location Approach for Acoustic Emission Techniques in Wind Turbines. Energies 2016, 9, 40. [Google Scholar] [CrossRef]
- Caso, E.; Fernandez-del-Rincon, A.; Garcia, P.; Iglesias, M.; Viadero, F. Monitoring of Misalignment in Low Speed Geared Shafts with Acoustic Emission Sensors. Appl. Acoust. 2020, 159, 107092. [Google Scholar] [CrossRef]
- Faiz, J.; Moosavi, S.M.M. Eccentricity Fault Detection—From Induction Machines to DFIG—A Review. Renew. Sustain. Energy Rev. 2016, 55, 169–179. [Google Scholar] [CrossRef]
- Ling, Y.; Cai, X. Rotor Current Dynamics of Doubly Fed Induction Generators during Grid Voltage Dip and Rise. Int. J. Electr. Power Energy Syst. 2013, 44, 17–24. [Google Scholar] [CrossRef]
- Merabet, H.; Bahi, T.; Halem, N. Condition Monitoring and Fault Detection in Wind Turbine Based on DFIG by the Fuzzy Logic. Energy Procedia 2015, 74, 518–528. [Google Scholar] [CrossRef]
- El Bouchikhi, E.H.; Choqueuse, V.; Benbouzid, M. Induction Machine Faults Detection Using Stator Current Parametric Spectral Estimation. Mech. Syst. Signal. Process. 2015, 52–53, 447–464. [Google Scholar] [CrossRef]
- Artigao, E.; Honrubia-Escribano, A.; Gomez-Lazaro, E. Current Signature Analysis to Monitor DFIG Wind Turbine Generators: A Case Study. Renew. Energy 2018, 116, 5–14. [Google Scholar] [CrossRef]
- Hamilton, A.; Quail, F. Detailed State of the Art Review for the Different Online/Inline Oil Analysis Techniques in Context of Wind Turbine Gearboxes. J. Tribol. 2011, 133, 044001. [Google Scholar] [CrossRef]
- Feng, Y.; Qiu, Y.; Crabtree, C.J.; Long, H.; Tavner, P.J. Monitoring Wind Turbine Gearboxes: Monitoring Wind Turbine Gearboxes. Wind Energ. 2013, 16, 728–740. [Google Scholar] [CrossRef]
- Lu, B.; Li, Y.; Wu, X.; Yang, Z. A Review of Recent Advances in Wind Turbine Condition Monitoring and Fault Diagnosis. In Proceedings of the 2009 IEEE Power Electronics and Machines in Wind Applications, Lincoln, NE, USA, 24–26 June 2009; pp. 1–7. [Google Scholar]
- Salameh, J.P.; Cauet, S.; Etien, E.; Sakout, A.; Rambault, L. Gearbox Condition Monitoring in Wind Turbines: A Review. Mech. Syst. Signal. Process. 2018, 111, 251–264. [Google Scholar] [CrossRef]
- Liu, Z.; Zhang, L. A Review of Failure Modes, Condition Monitoring and Fault Diagnosis Methods for Large-Scale Wind Turbine Bearings. Measurement 2020, 149, 107002. [Google Scholar] [CrossRef]
- Glowacz, A. Fault Diagnosis of Electric Impact Drills Using Thermal Imaging. Measurement 2021, 171, 108815. [Google Scholar] [CrossRef]
- Gong, Y.; Fei, J.-L.; Tang, J.; Yang, Z.-G.; Han, Y.-M.; Li, X. Failure Analysis on Abnormal Wear of Roller Bearings in Gearbox for Wind Turbine. Eng. Fail. Anal. 2017, 82, 26–38. [Google Scholar] [CrossRef]
- AlShorman, O.; Masadeh, M.; Alkahtani, F.; AlShorman, A. A Review of Condition Monitoring and Fault Diagnosis and Detection of Rotating Machinery Based on Image Aspects. In Proceedings of the 2020 International Conference on Data Analytics for Business and Industry: Way Towards a Sustainable Economy (ICDABI), Sakheer, Bahrain, 26–27 October 2020; pp. 1–5. [Google Scholar]
- Wang, Z.; Liu, C. Wind Turbine Condition Monitoring Based on a Novel Multivariate State Estimation Technique. Measurement 2021, 168, 108388. [Google Scholar] [CrossRef]
- Stetco, A.; Dinmohammadi, F.; Zhao, X.; Robu, V.; Flynn, D.; Barnes, M.; Keane, J.; Nenadic, G. Machine Learning Methods for Wind Turbine Condition Monitoring: A Review. Renew. Energy 2019, 133, 620–635. [Google Scholar] [CrossRef]
- Benedetti, M.; Cesarotti, V.; Introna, V.; Serranti, J. Energy Consumption Control Automation Using Artificial Neural Networks and Adaptive Algorithms: Proposal of a New Methodology and Case Study. Appl. Energy 2016, 165, 60–71. [Google Scholar] [CrossRef]
- Carvalho, T.P.; Soares, F.A.A.M.N.; Vita, R.; Francisco, R.D.P.; Basto, J.P.; Alcalá, S.G.S. A Systematic Literature Review of Machine Learning Methods Applied to Predictive Maintenance. Comput. Ind. Eng. 2019, 137, 106024. [Google Scholar] [CrossRef]
- Kusiak, A.; Zheng, H.; Song, Z. Models for Monitoring Wind Farm Power. Renew. Energy 2009, 34, 583–590. [Google Scholar] [CrossRef]
- Kusiak, A.; Verma, A. Monitoring Wind Farms With Performance Curves. IEEE Trans. Sustain. Energy 2013, 4, 192–199. [Google Scholar] [CrossRef]
- Leahy, K.; Hu, R.L.; Konstantakopoulos, I.C.; Spanos, C.J.; Agogino, A.M. Diagnosing Wind Turbine Faults Using Machine Learning Techniques Applied to Operational Data. In Proceedings of the 2016 IEEE International Conference on Prognostics and Health Management (ICPHM), Ottawa, ON, Canada, 20–22 June 2016; pp. 1–8. [Google Scholar]
- Ouyang, T.; Kusiak, A.; He, Y. Modeling Wind-Turbine Power Curve: A Data Partitioning and Mining Approach. Renew. Energy 2017, 102, 1–8. [Google Scholar] [CrossRef]
- Vidal, Y.; Pozo, F.; Tutivén, C. Wind Turbine Multi-Fault Detection and Classification Based on SCADA Data. Energies 2018, 11, 3018. [Google Scholar] [CrossRef]
- Liu, Z.; Xiao, C.; Zhang, T.; Zhang, X. Research on Fault Detection for Three Types of Wind Turbine Subsystems Using Machine Learning. Energies 2020, 13, 460. [Google Scholar] [CrossRef]
- Zaher, A.; McArthur, S.D.J.; Infield, D.G.; Patel, Y. Online Wind Turbine Fault Detection through Automated SCADA Data Analysis. Wind Energ. 2009, 12, 574–593. [Google Scholar] [CrossRef]
- Schlechtingen, M.; Ferreira Santos, I. Comparative Analysis of Neural Network and Regression Based Condition Monitoring Approaches for Wind Turbine Fault Detection. Mech. Syst. Signal. Process. 2011, 25, 1849–1875. [Google Scholar] [CrossRef]
- Kusiak, A.; Verma, A. Analyzing Bearing Faults in Wind Turbines: A Data-Mining Approach. Renew. Energy 2012, 48, 110–116. [Google Scholar] [CrossRef]
- Zhang, Z.-Y.; Wang, K.-S. Wind Turbine Fault Detection Based on SCADA Data Analysis Using ANN. Adv. Manuf. 2014, 2, 70–78. [Google Scholar] [CrossRef]
- Karlsson, D. Wind Turbine Performance Monitoring Using Artificial Neural Networks. Master’s Thesis, Chalmers University of Technology, Göteborg, Sweden, 2015. [Google Scholar]
- Sun, P.; Li, J.; Wang, C.; Lei, X. A Generalized Model for Wind Turbine Anomaly Identification Based on SCADA Data. Appl. Energy 2016, 168, 550–567. [Google Scholar] [CrossRef]
- Bangalore, P.; Letzgus, S.; Karlsson, D.; Patriksson, M. An Artificial Neural Network-Based Condition Monitoring Method for Wind Turbines, with Application to the Monitoring of the Gearbox: ANN-Based CMS for Wind Turbine Gearbox Monitoring. Wind Energ. 2017, 20, 1421–1438. [Google Scholar] [CrossRef]
- Nithya, M.; Nagarajan, S.; Navaseelan, P. Fault Detection of Wind Turbine System Using Neural Networks. In Proceedings of the 2017 IEEE Technological Innovations in ICT for Agriculture and Rural Development (TIAR), Chennai, India, 7–8 April 2017; pp. 103–108. [Google Scholar]
- Manobel, B.; Sehnke, F.; Lazzús, J.A.; Salfate, I.; Felder, M.; Montecinos, S. Wind Turbine Power Curve Modeling Based on Gaussian Processes and Artificial Neural Networks. Renew. Energy 2018, 125, 1015–1020. [Google Scholar] [CrossRef]
- Bangalore, P.; Patriksson, M. Analysis of SCADA Data for Early Fault Detection, with Application to the Maintenance Management of Wind Turbines. Renew. Energy 2018, 115, 521–532. [Google Scholar] [CrossRef]
- Wang, Y.; Ma, X.; Qian, P. Wind Turbine Fault Detection and Identification Through PCA-Based Optimal Variable Selection. IEEE Trans. Sustain. Energy 2018, 9, 1627–1635. [Google Scholar] [CrossRef]
- Fu, J.; Chu, J.; Guo, P.; Chen, Z. Condition Monitoring of Wind Turbine Gearbox Bearing Based on Deep Learning Model. IEEE Access 2019, 7, 57078–57087. [Google Scholar] [CrossRef]
- Helbing, G. Deep Learning for Fault Detection in Wind Turbines. Renew. Sustain. Energy Rev. 2018, 98, 189–198. [Google Scholar] [CrossRef]
- Schlechtingen, M.; Santos, I.F.; Achiche, S. Using Data-Mining Approaches for Wind Turbine Power Curve Monitoring: A Comparative Study. IEEE Trans. Sustain. Energy 2013, 4, 671–679. [Google Scholar] [CrossRef]
- Zhao, Y.; Li, D.; Dong, A.; Kang, D.; Lv, Q.; Shang, L. Fault Prediction and Diagnosis of Wind Turbine Generators Using SCADA Data. Energies 2017, 10, 1210. [Google Scholar] [CrossRef]
- De Maesschalck, R.; Jouan-Rimbaud, D.; Massart, D.L. The Mahalanobis Distance. Chemom. Intell. Lab. Syst. 2000, 50, 1–18. [Google Scholar] [CrossRef]
- Haykin, S.S.; Haykin, S.S. Neural Networks and Learning Machines, 3rd ed.; Prentice Hall: New York, NY, USA, 2009; ISBN 978-0-13-147139-9. [Google Scholar]
- Hagan, M.T.; Menhaj, M.B. Training Feedforward Networks with the Marquardt Algorithm. IEEE Trans. Neural Netw. 1994, 5, 989–993. [Google Scholar] [CrossRef] [PubMed]
- Schlechtingen, M.; Santos, I.F. Wind Turbine Condition Monitoring Based on SCADA Data Using Normal Behavior Models. Part 2: Application Examples. Appl. Soft Comput. 2014, 14, 447–460. [Google Scholar] [CrossRef]
- Benedetti, M.; Bonfà, F.; Introna, V.; Santolamazza, A.; Ubertini, S. Real Time Energy Performance Control for Industrial Compressed Air Systems: Methodology and Applications. Energies 2019, 12, 3935. [Google Scholar] [CrossRef]
- Marčiukaitis, M.; Žutautaitė, I.; Martišauskas, L.; Jokšas, B.; Gecevičius, G.; Sfetsos, A. Non-Linear Regression Model for Wind Turbine Power Curve. Renew. Energy 2017, 113, 732–741. [Google Scholar] [CrossRef]
- Wang, J.; Song, Y.; Liu, F.; Hou, R. Analysis and Application of Forecasting Models in Wind Power Integration: A Review of Multi-Step-Ahead Wind Speed Forecasting Models. Renew. Sustain. Energy Rev. 2016, 60, 960–981. [Google Scholar] [CrossRef]
- Simani, S.; Castaldi, P.; Tilli, A. Data—Driven Approach for Wind Turbine Actuator and Sensor Fault Detection and Isolation. IFAC Proc. Vol. 2011, 44, 8301–8306. [Google Scholar] [CrossRef]
- Zhang, W.; Ma, X. Simultaneous Fault Detection and Sensor Selection for Condition Monitoring of Wind Turbines. Energies 2016, 9, 280. [Google Scholar] [CrossRef]
- Pozo, F.; Vidal, Y. Wind Turbine Fault Detection through Principal Component Analysis and Statistical Hypothesis Testing. AST 2016, 101, 45–54. [Google Scholar] [CrossRef]
- Bi, R.; Zhou, C.; Hepburn, D.M. Detection and Classification of Faults in Pitch-Regulated Wind Turbine Generators Using Normal Behaviour Models Based on Performance Curves. Renew. Energy 2017, 105, 674–688. [Google Scholar] [CrossRef]
- Wang, L.; Zhang, Z.; Long, H.; Xu, J.; Liu, R. Wind Turbine Gearbox Failure Identification With Deep Neural Networks. IEEE Trans. Ind. Inf. 2017, 13, 1360–1368. [Google Scholar] [CrossRef]
- Nazir, M.; Khan, A.Q.; Mustafa, G.; Abid, M. Robust Fault Detection for Wind Turbines Using Reference Model-Based Approach. J. King Saud Univ.Eng. Sci. 2017, 29, 244–252. [Google Scholar] [CrossRef]
- Yu, D.; Chen, Z.M.; Xiahou, K.S.; Li, M.S.; Ji, T.Y.; Wu, Q.H. A Radically Data-Driven Method for Fault Detection and Diagnosis in Wind Turbines. Int. J. Electr. Power Energy Syst. 2018, 99, 577–584. [Google Scholar] [CrossRef]
- Alvarez, E.J.; Ribaric, A.P. An Improved-Accuracy Method for Fatigue Load Analysis of Wind Turbine Gearbox Based on SCADA. Renew. Energy 2018, 115, 391–399. [Google Scholar] [CrossRef]
- González-González, A.; Cortadi, A.J.; Galar, D.; Ciani, L. Condition Monitoring of Wind Turbine Pitch Controller: A Maintenance Approach. Measurement 2018, 123, 80–93. [Google Scholar] [CrossRef]
- Dao, P.B.; Staszewski, W.J.; Barszcz, T.; Uhl, T. Condition Monitoring and Fault Detection in Wind Turbines Based on Cointegration Analysis of SCADA Data. Renew. Energy 2018, 116, 107–122. [Google Scholar] [CrossRef]
- Zhao, H. Anomaly Detection and Fault Analysis of Wind Turbine Components Based on Deep Learning Network. Renew. Energy 2018, 127, 825–834. [Google Scholar] [CrossRef]
- Yang, H.-H.; Huang, M.-L.; Lai, C.-M.; Jin, J.-R. An Approach Combining Data Mining and Control Charts-Based Model for Fault Detection in Wind Turbines. Renew. Energy 2018, 115, 808–816. [Google Scholar] [CrossRef]
- Wen, L.; Li, X.; Gao, L.; Zhang, Y. A New Convolutional Neural Network-Based Data-Driven Fault Diagnosis Method. IEEE Trans. Ind. Electron. 2018, 65, 5990–5998. [Google Scholar] [CrossRef]
- Zhang, L.; Lang, Z.-Q. Wavelet Energy Transmissibility Function and Its Application to Wind Turbine Bearing Condition Monitoring. IEEE Trans. Sustain. Energy 2018, 9, 1833–1843. [Google Scholar] [CrossRef]
- Qian, P.; Zhang, D.; Tian, X.; Si, Y.; Li, L. A Novel Wind Turbine Condition Monitoring Method Based on Cloud Computing. Renew. Energy 2019, 135, 390–398. [Google Scholar] [CrossRef]
- Lei, J.; Liu, C.; Jiang, D. Fault Diagnosis of Wind Turbine Based on Long Short-Term Memory Networks. Renew. Energy 2019, 133, 422–432. [Google Scholar] [CrossRef]
- Saari, J.; Strömbergsson, D.; Lundberg, J.; Thomson, A. Detection and Identification of Windmill Bearing Faults Using a One-Class Support Vector Machine (SVM). Measurement 2019, 137, 287–301. [Google Scholar] [CrossRef]
- Bakdi, A.; Kouadri, A.; Mekhilef, S. A Data-Driven Algorithm for Online Detection of Component and System Faults in Modern Wind Turbines at Different Operating Zones. Renew. Sustain. Energy Rev. 2019, 103, 546–555. [Google Scholar] [CrossRef]
- Rizk, P.; Al Saleh, N.; Younes, R.; Ilinca, A.; Khoder, J. Hyperspectral Imaging Applied for the Detection of Wind Turbine Blade Damage and Icing. Remote Sens. Appl. Soc. Environ. 2020, 18, 100291. [Google Scholar] [CrossRef]
- Dong, X.; Gao, D.; Li, J.; Jincao, Z.; Zheng, K. Blades Icing Identification Model of Wind Turbines Based on SCADA Data. Renew. Energy 2020, 162, 575–586. [Google Scholar] [CrossRef]
- Chang, Y.; Chen, J.; Qu, C.; Pan, T. Intelligent Fault Diagnosis of Wind Turbines via a Deep Learning Network Using Parallel Convolution Layers with Multi-Scale Kernels. Renew. Energy 2020, 153, 205–213. [Google Scholar] [CrossRef]
- Pujol-Vazquez, G.; Acho, L.; Gibergans-Báguena, J. Fault Detection Algorithm for Wind Turbines’ Pitch Actuator Systems. Energies 2020, 13, 2861. [Google Scholar] [CrossRef]
- Stetco, A.; Ramirez, J.M.; Mohammed, A.; Djurović, S.; Nenadic, G.; Keane, J. An End-to-End, Real-Time Solution for Condition Monitoring of Wind Turbine Generators. Energies 2020, 13, 4817. [Google Scholar] [CrossRef]
- Zhang, S.; Lang, Z.-Q. SCADA-Data-Based Wind Turbine Fault Detection: A Dynamic Model Sensor Method. Control. Eng. Pract. 2020, 102, 104546. [Google Scholar] [CrossRef]
- Chen, X.; Xu, W.; Liu, Y.; Islam, M.R. Bearing Corrosion Failure Diagnosis of Doubly Fed Induction Generator in Wind Turbines Based on Stator Current Analysis. IEEE Trans. Ind. Electron. 2020, 67, 3419–3430. [Google Scholar] [CrossRef]
- Yang, X.; Zhang, Y.; Lv, W.; Wang, D. Image Recognition of Wind Turbine Blade Damage Based on a Deep Learning Model with Transfer Learning and an Ensemble Learning Classifier. Renew. Energy 2021, 163, 386–397. [Google Scholar] [CrossRef]


| Component | Inputs | Output | Ref. |
|---|---|---|---|
| Wind turbine | Wind Speed Ambient Temperature Wind Direction Wind Speed Standard Deviation | Power Output | [43] |
| Gearbox | Nacelle Temperature Rotor Speed Power Output Ambient Temperature Gearbox Oil Temperature | Gearbox Bearing Temperature | [40,45] |
| Generator | Nacelle Temperature Power Output Generator Speed Generator Stator Temperature | Generator DE 1 Bearing Temperature | [40] |
| Generator Speed Power Output Rotor Grid Inverter Temp. (Ph.1) Nacelle Temperature | Generator Slip Ring Temperature | [57] |
| Component | Turbine | Maintenance Work | Start | End |
|---|---|---|---|---|
| Gearbox | WT01 | Gearbox repair | 26 April 2016 | 30 April 2016 |
| IMS 1 bearings Replacing | 27 September 2016 | 28 September 2016 | ||
| Gearbox repair | 08 February 2017 | 11 February 2017 | ||
| Generator | WT01 | NDE 2 and DE 3 bearings replacement | 16 May 2016 | 19 May 2016 |
| Generator replacement | 16 August 2016 | 26 August 2016 | ||
| WT02 | NDE 2 and DE 3 bearings replacement | 11 May 2017 | 12 May 2017 |
| Model | RMSE 1 | MAE 2 | MAPE 3 | Control Limits |
|---|---|---|---|---|
| FFNN | 36.08 kW | 26.72 kW | 2.78% | 46.54 kW |
| Non-linear Regression | 65.54 kW | 48.24 kW | 4.67% | 79.74 kW |
Publisher’s Note: MDPI stays neutral with regard to jurisdictional claims in published maps and institutional affiliations. |
© 2021 by the authors. Licensee MDPI, Basel, Switzerland. This article is an open access article distributed under the terms and conditions of the Creative Commons Attribution (CC BY) license (http://creativecommons.org/licenses/by/4.0/).
Share and Cite
Santolamazza, A.; Dadi, D.; Introna, V. A Data-Mining Approach for Wind Turbine Fault Detection Based on SCADA Data Analysis Using Artificial Neural Networks. Energies 2021, 14, 1845. https://doi.org/10.3390/en14071845
Santolamazza A, Dadi D, Introna V. A Data-Mining Approach for Wind Turbine Fault Detection Based on SCADA Data Analysis Using Artificial Neural Networks. Energies. 2021; 14(7):1845. https://doi.org/10.3390/en14071845
Chicago/Turabian StyleSantolamazza, Annalisa, Daniele Dadi, and Vito Introna. 2021. "A Data-Mining Approach for Wind Turbine Fault Detection Based on SCADA Data Analysis Using Artificial Neural Networks" Energies 14, no. 7: 1845. https://doi.org/10.3390/en14071845
APA StyleSantolamazza, A., Dadi, D., & Introna, V. (2021). A Data-Mining Approach for Wind Turbine Fault Detection Based on SCADA Data Analysis Using Artificial Neural Networks. Energies, 14(7), 1845. https://doi.org/10.3390/en14071845