An Unsupervised Learning Approach to Condition Assessment on a Wound-Rotor Induction Generator


Abstract
:1. Introduction
2. Background
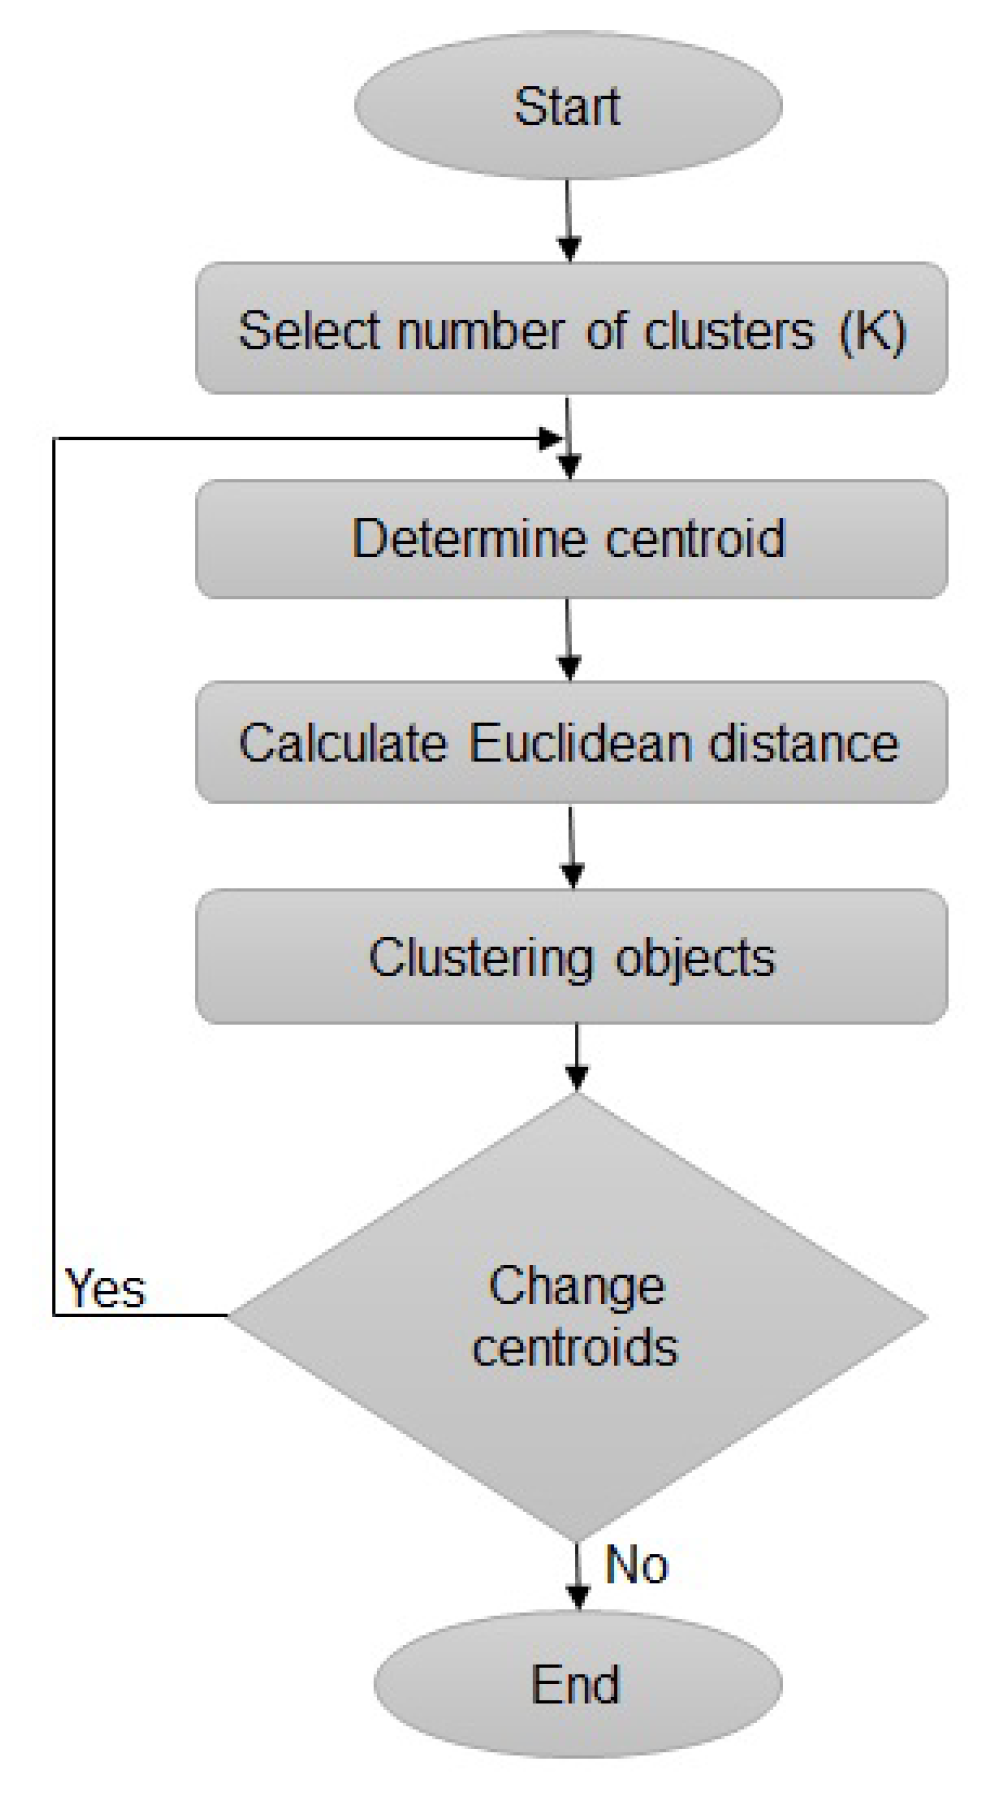
3. Methodology
3.1. Overview
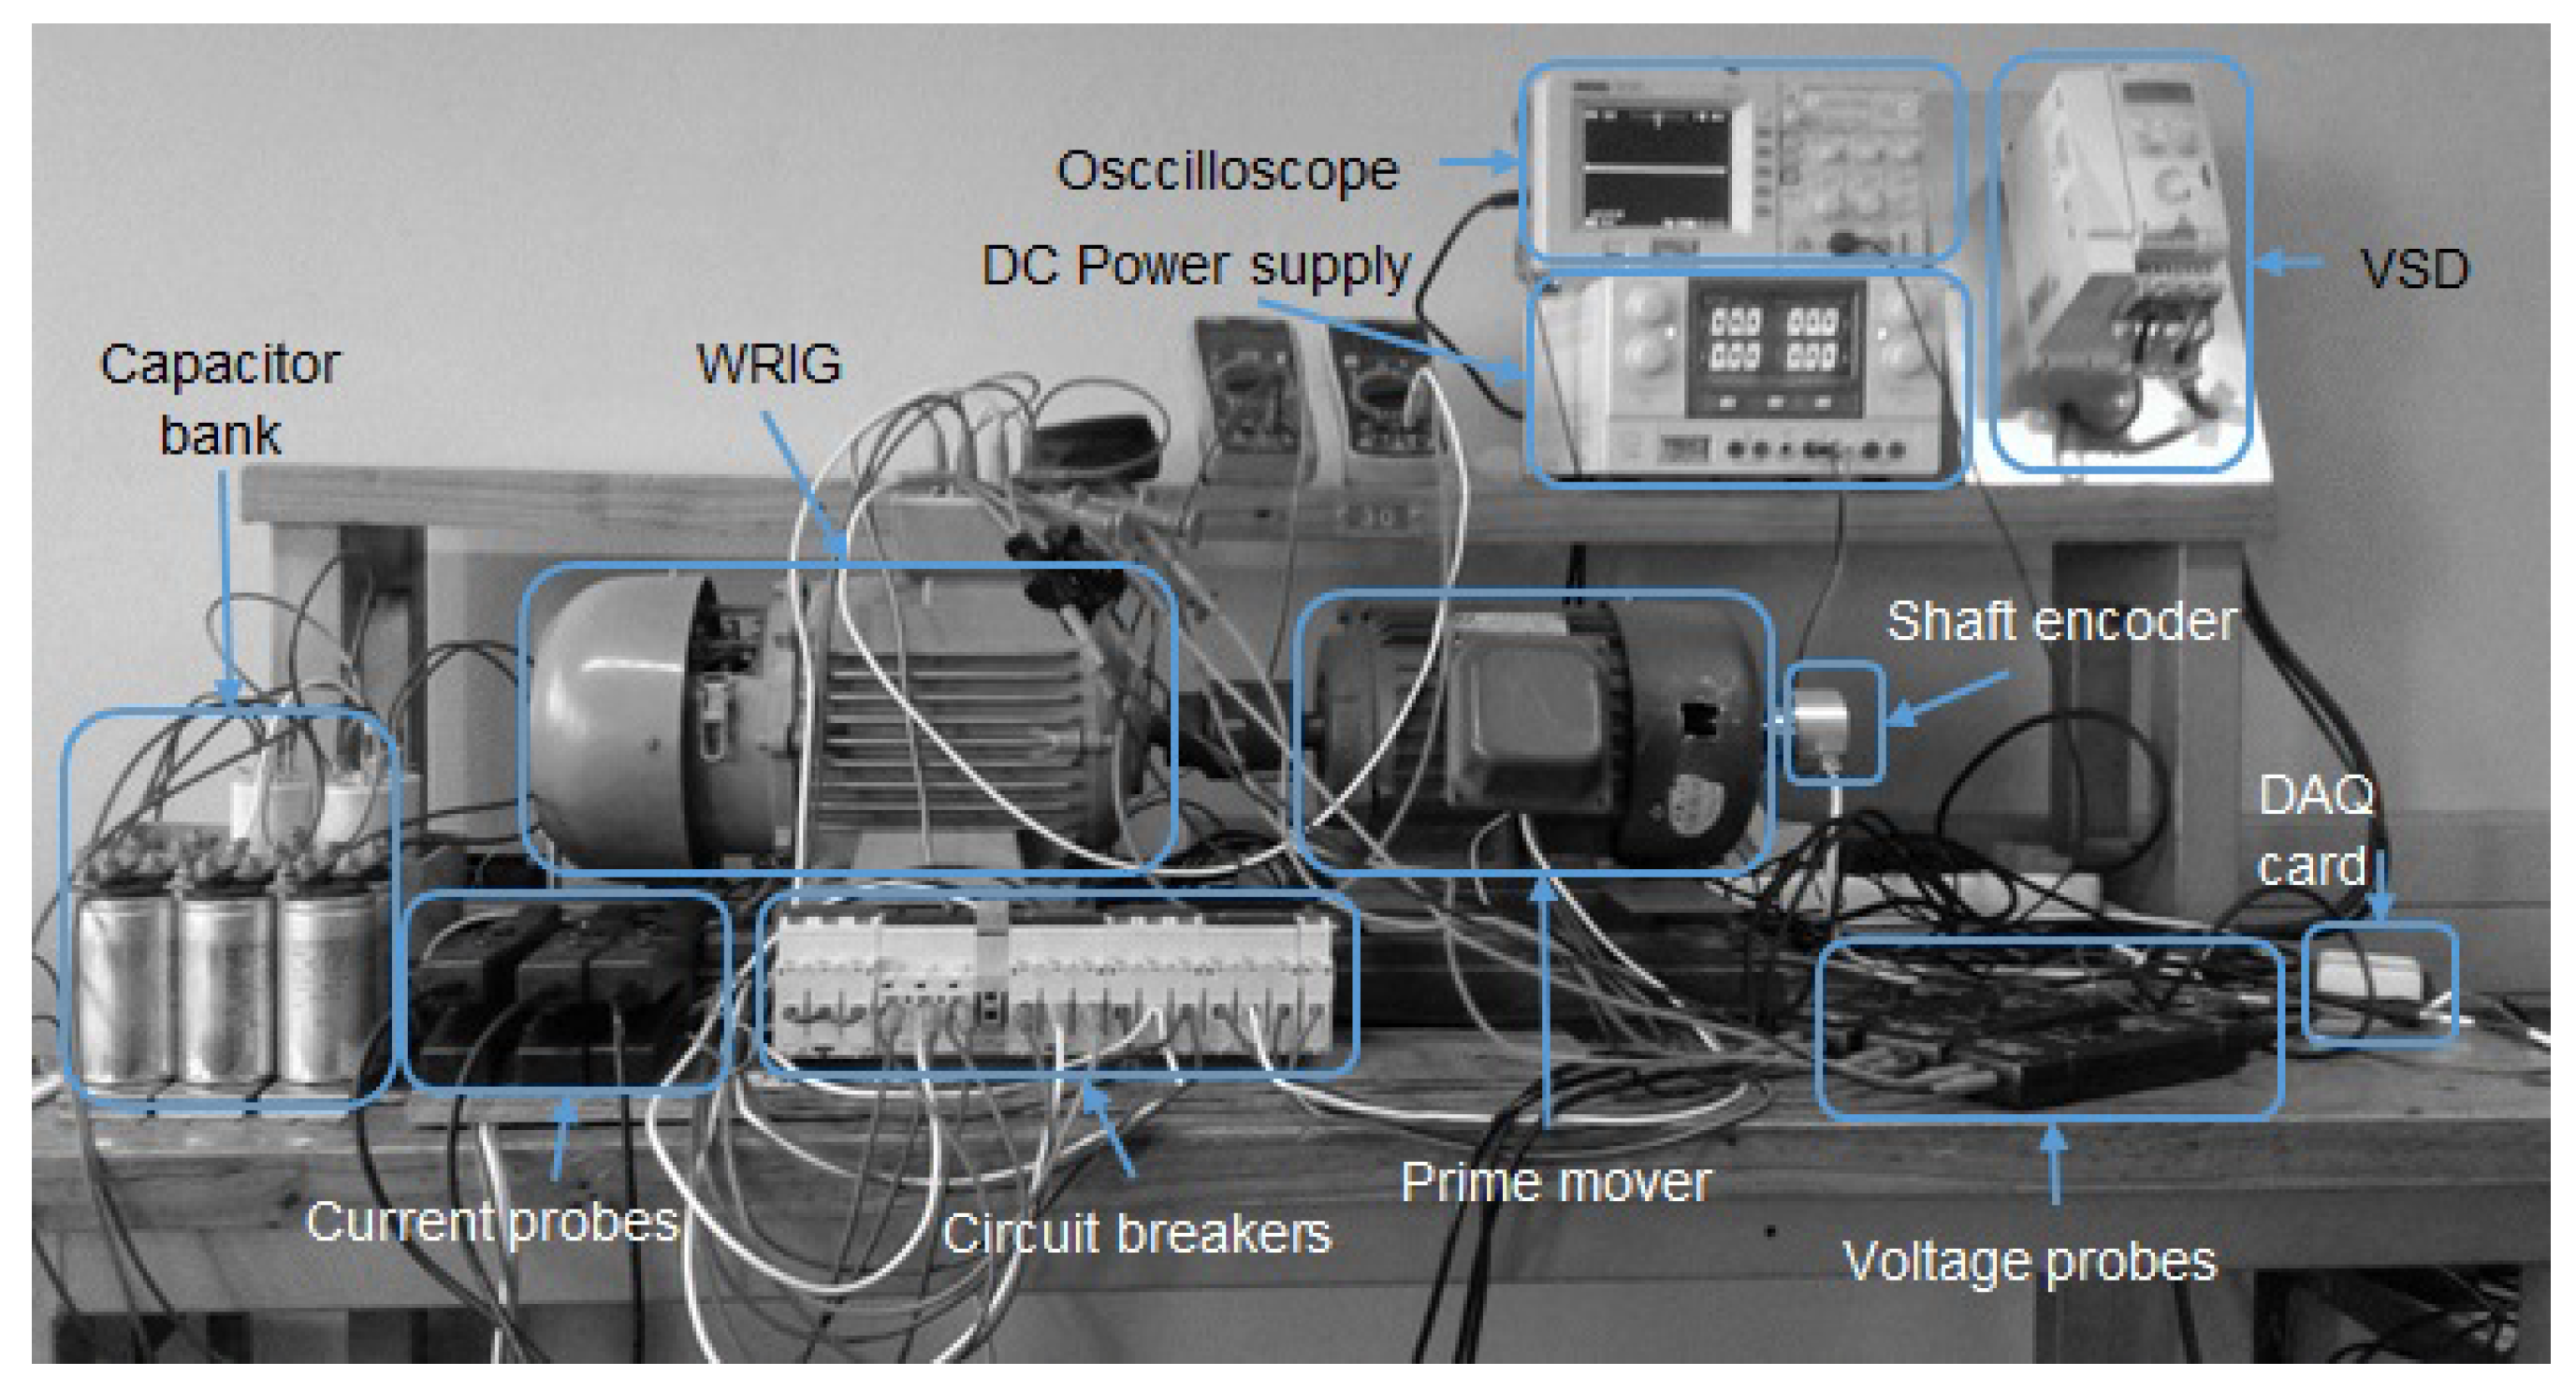
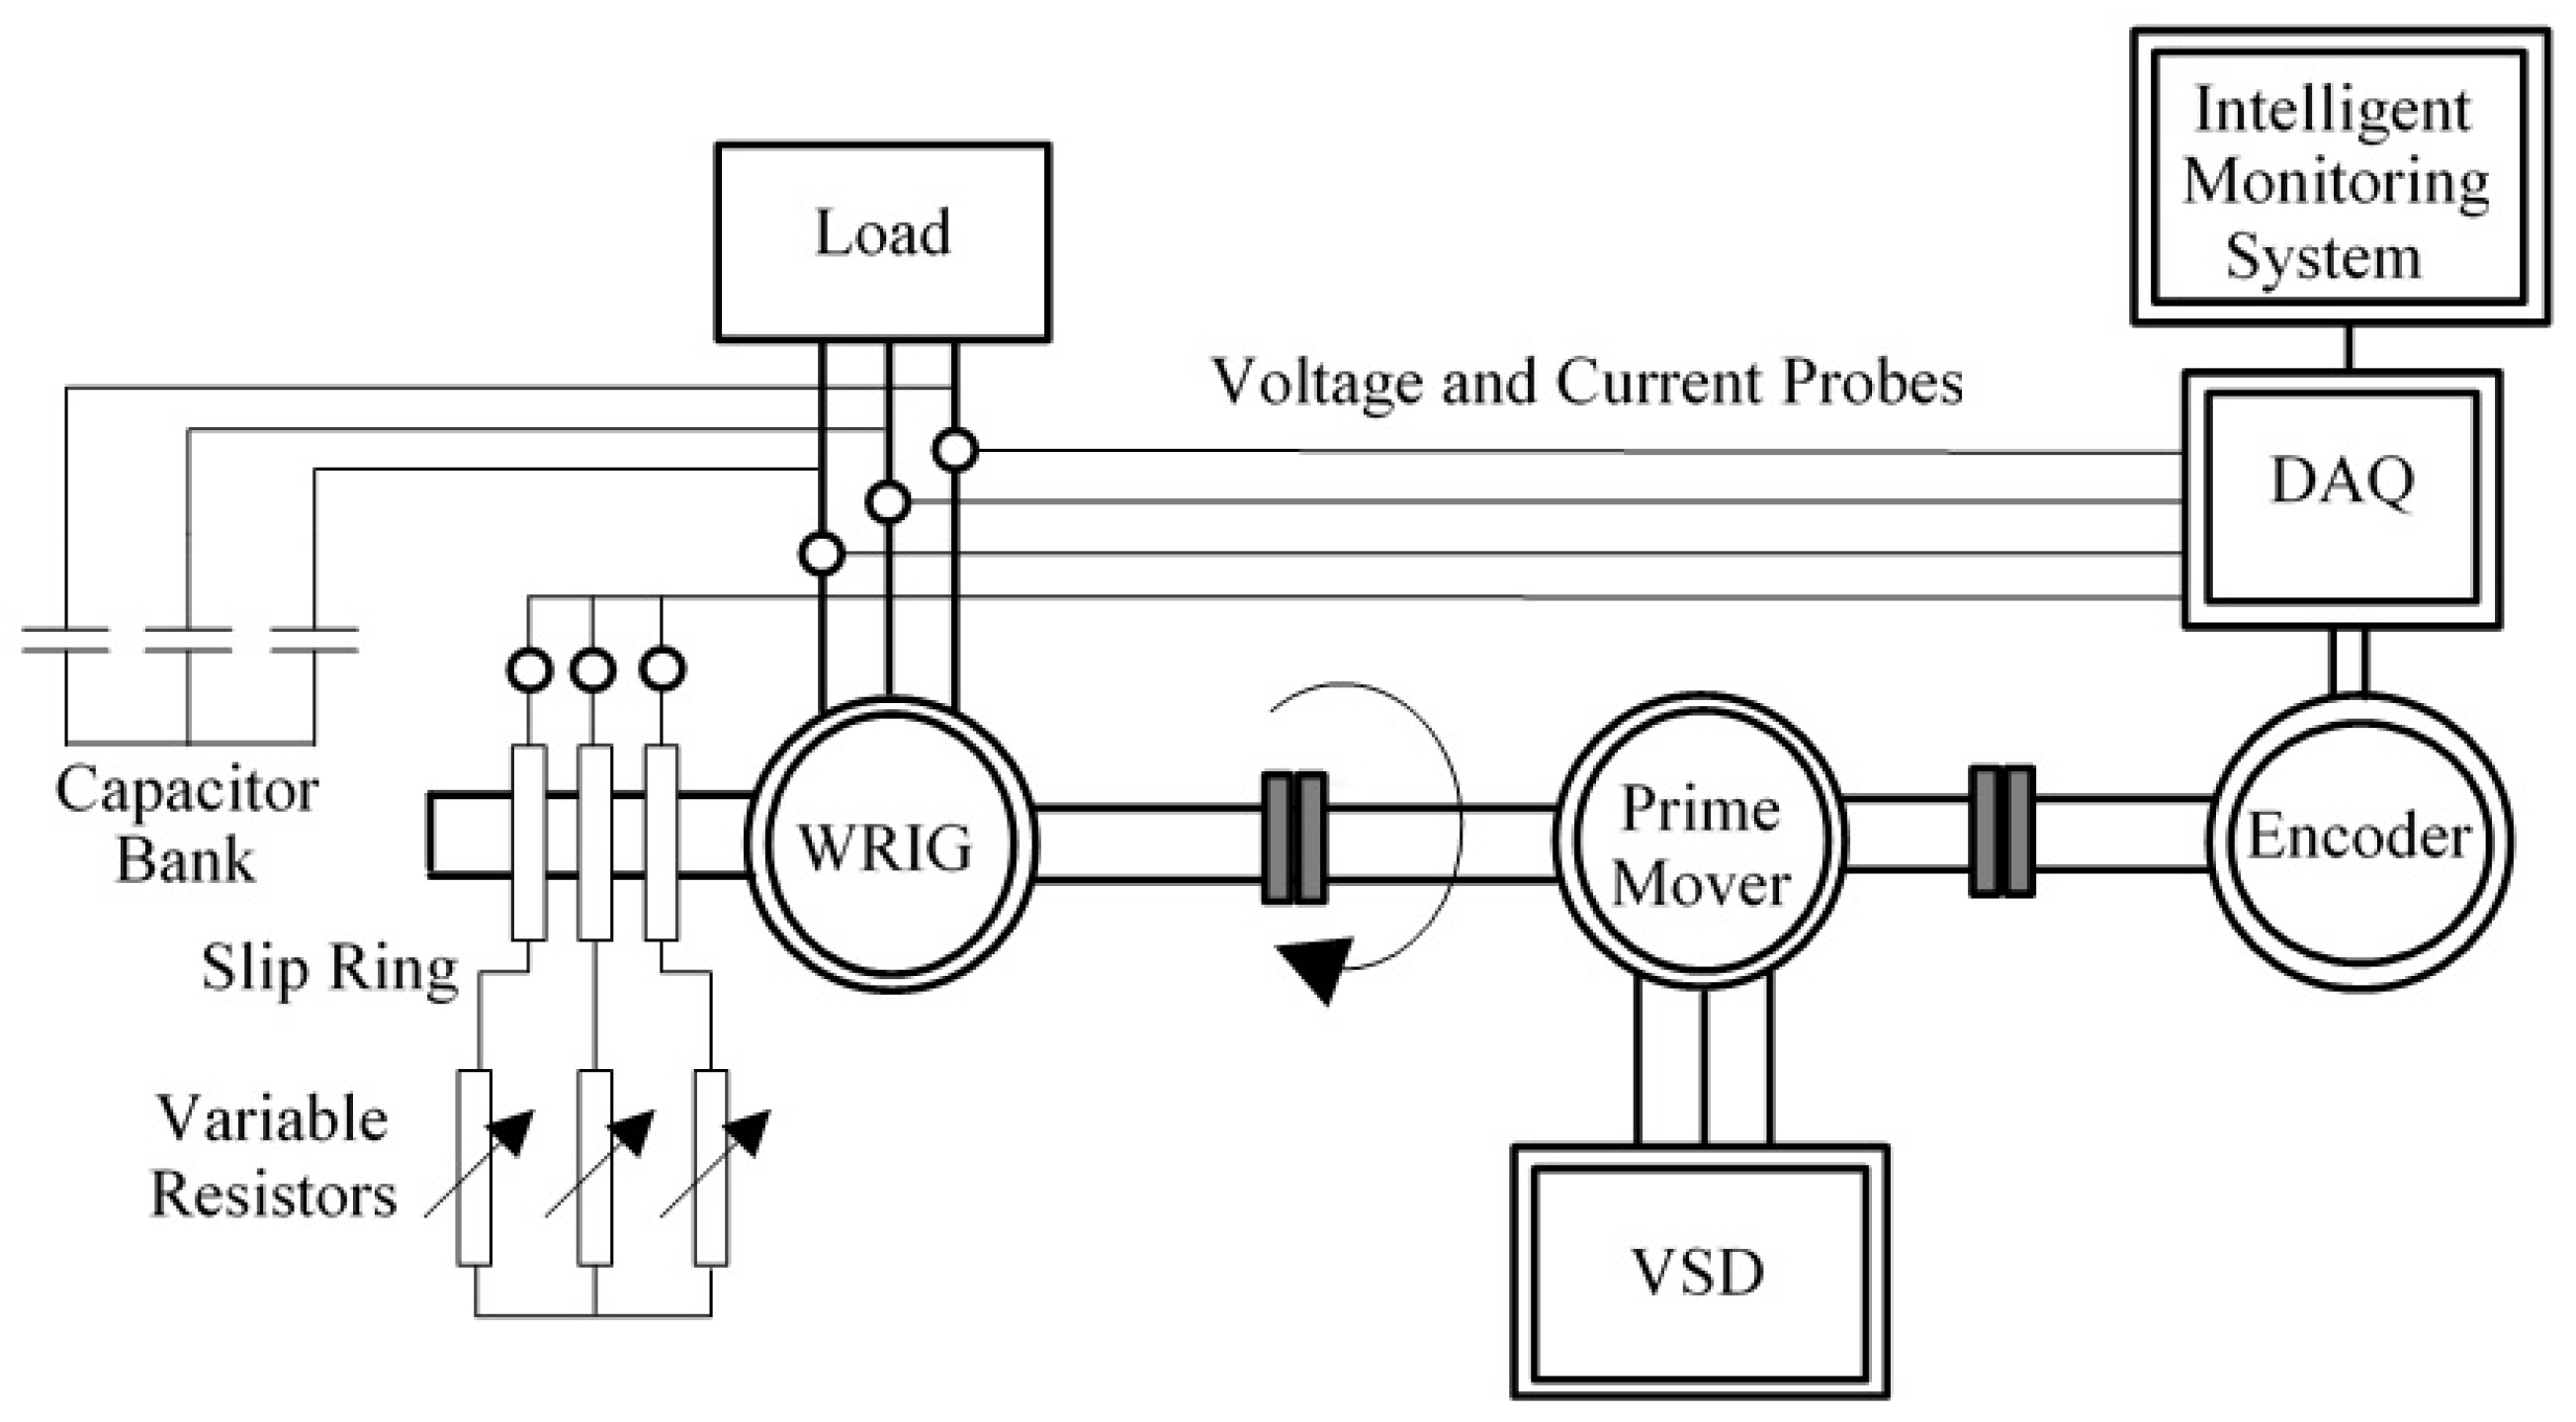
3.2. Experimental Configuration
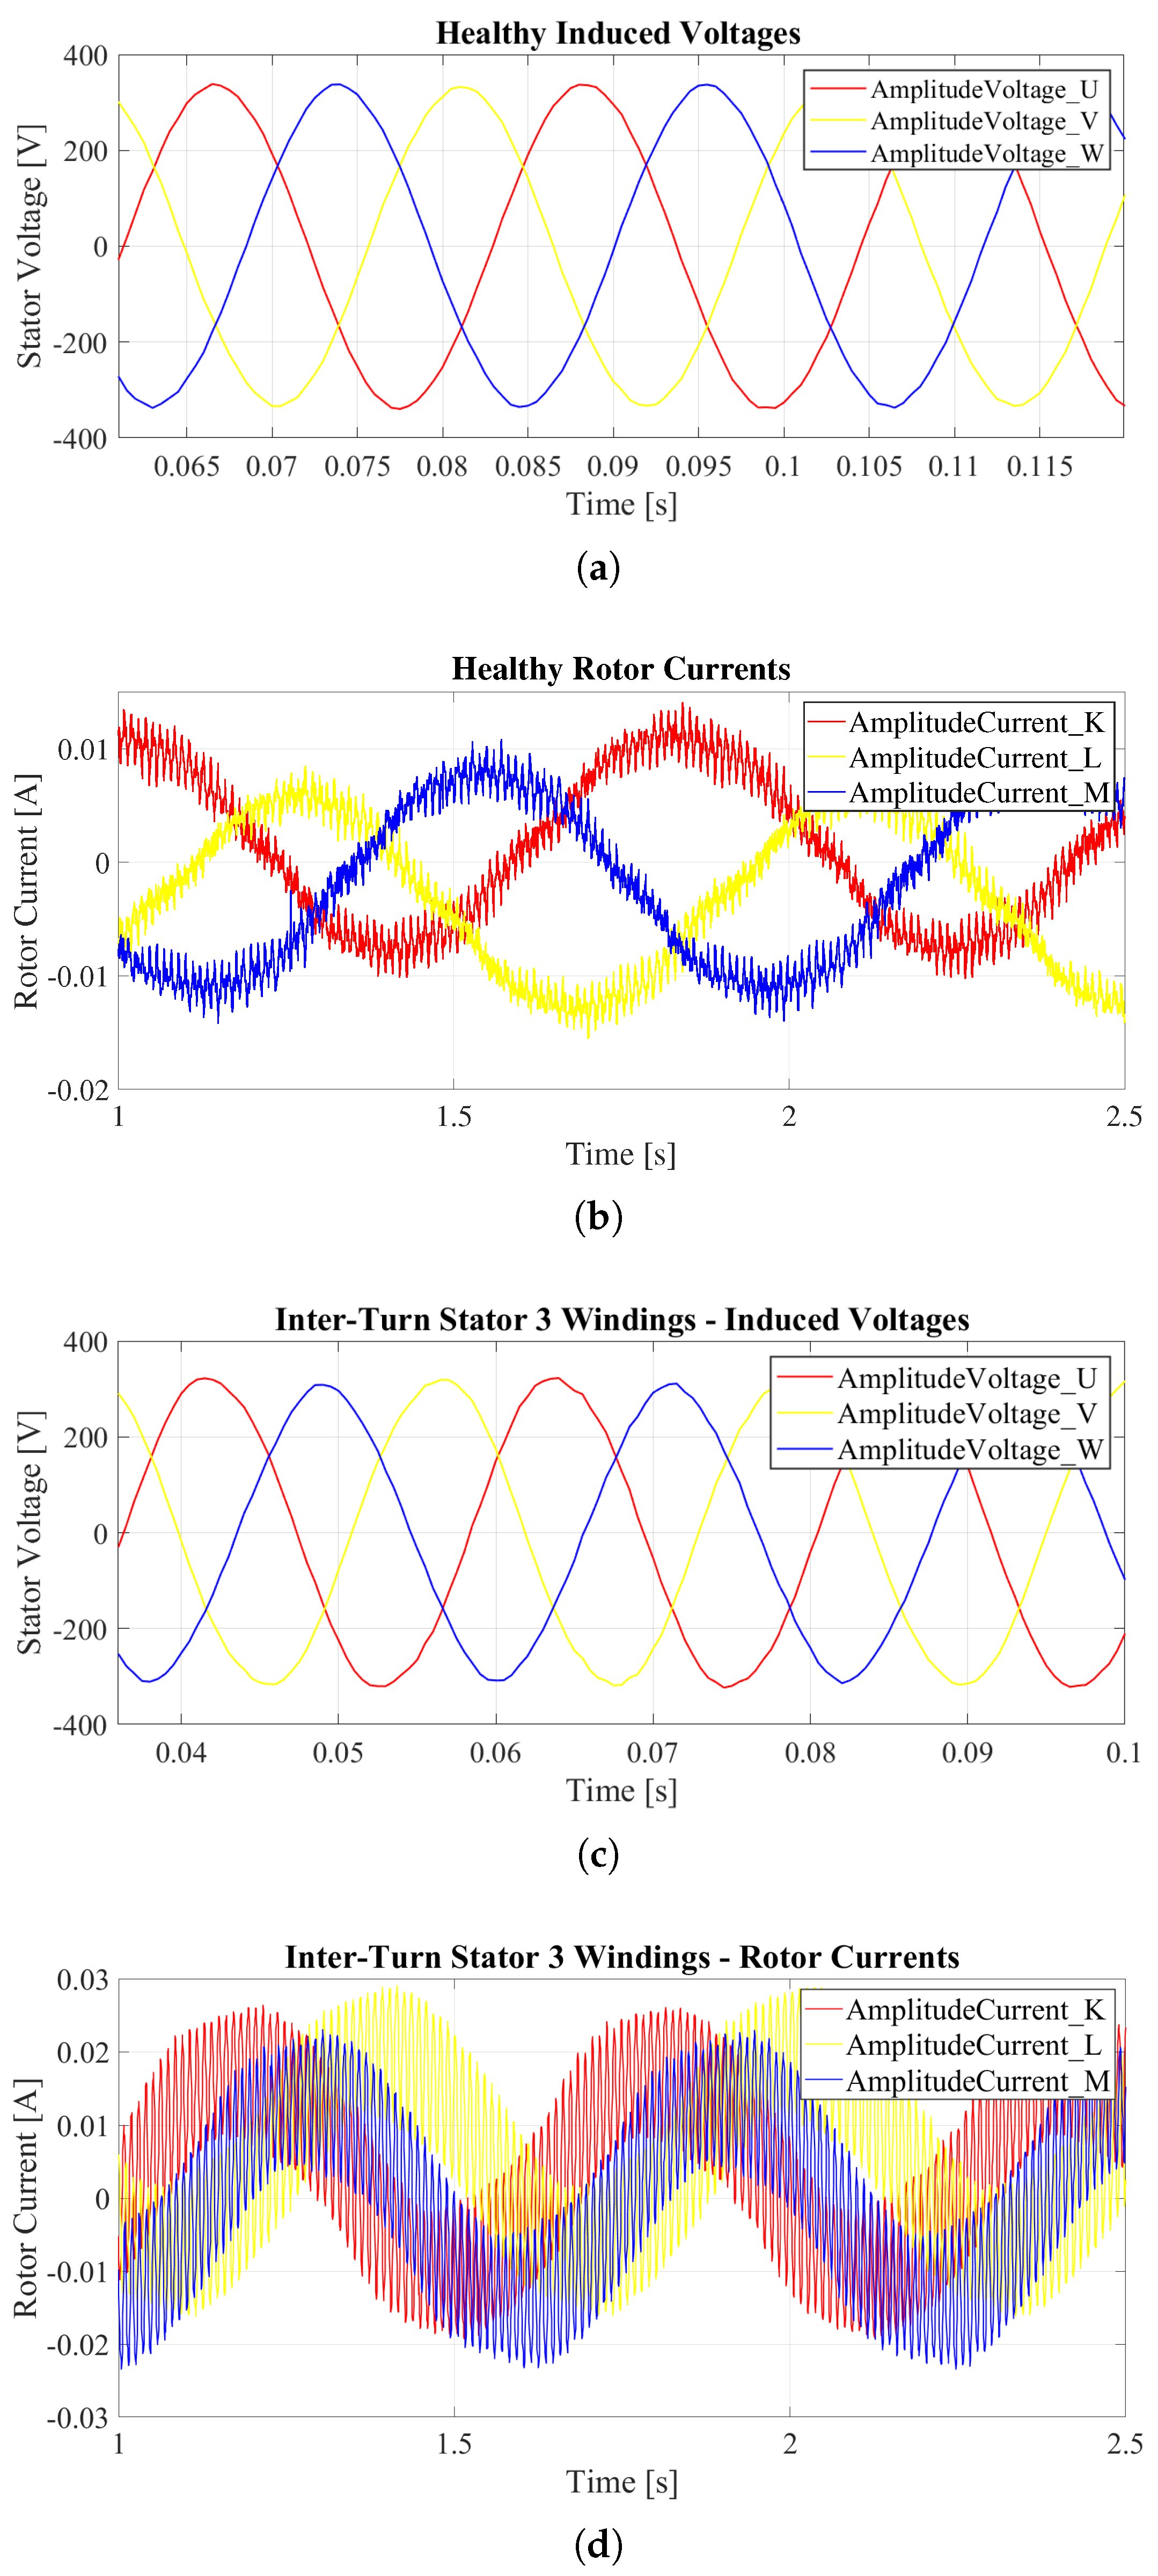
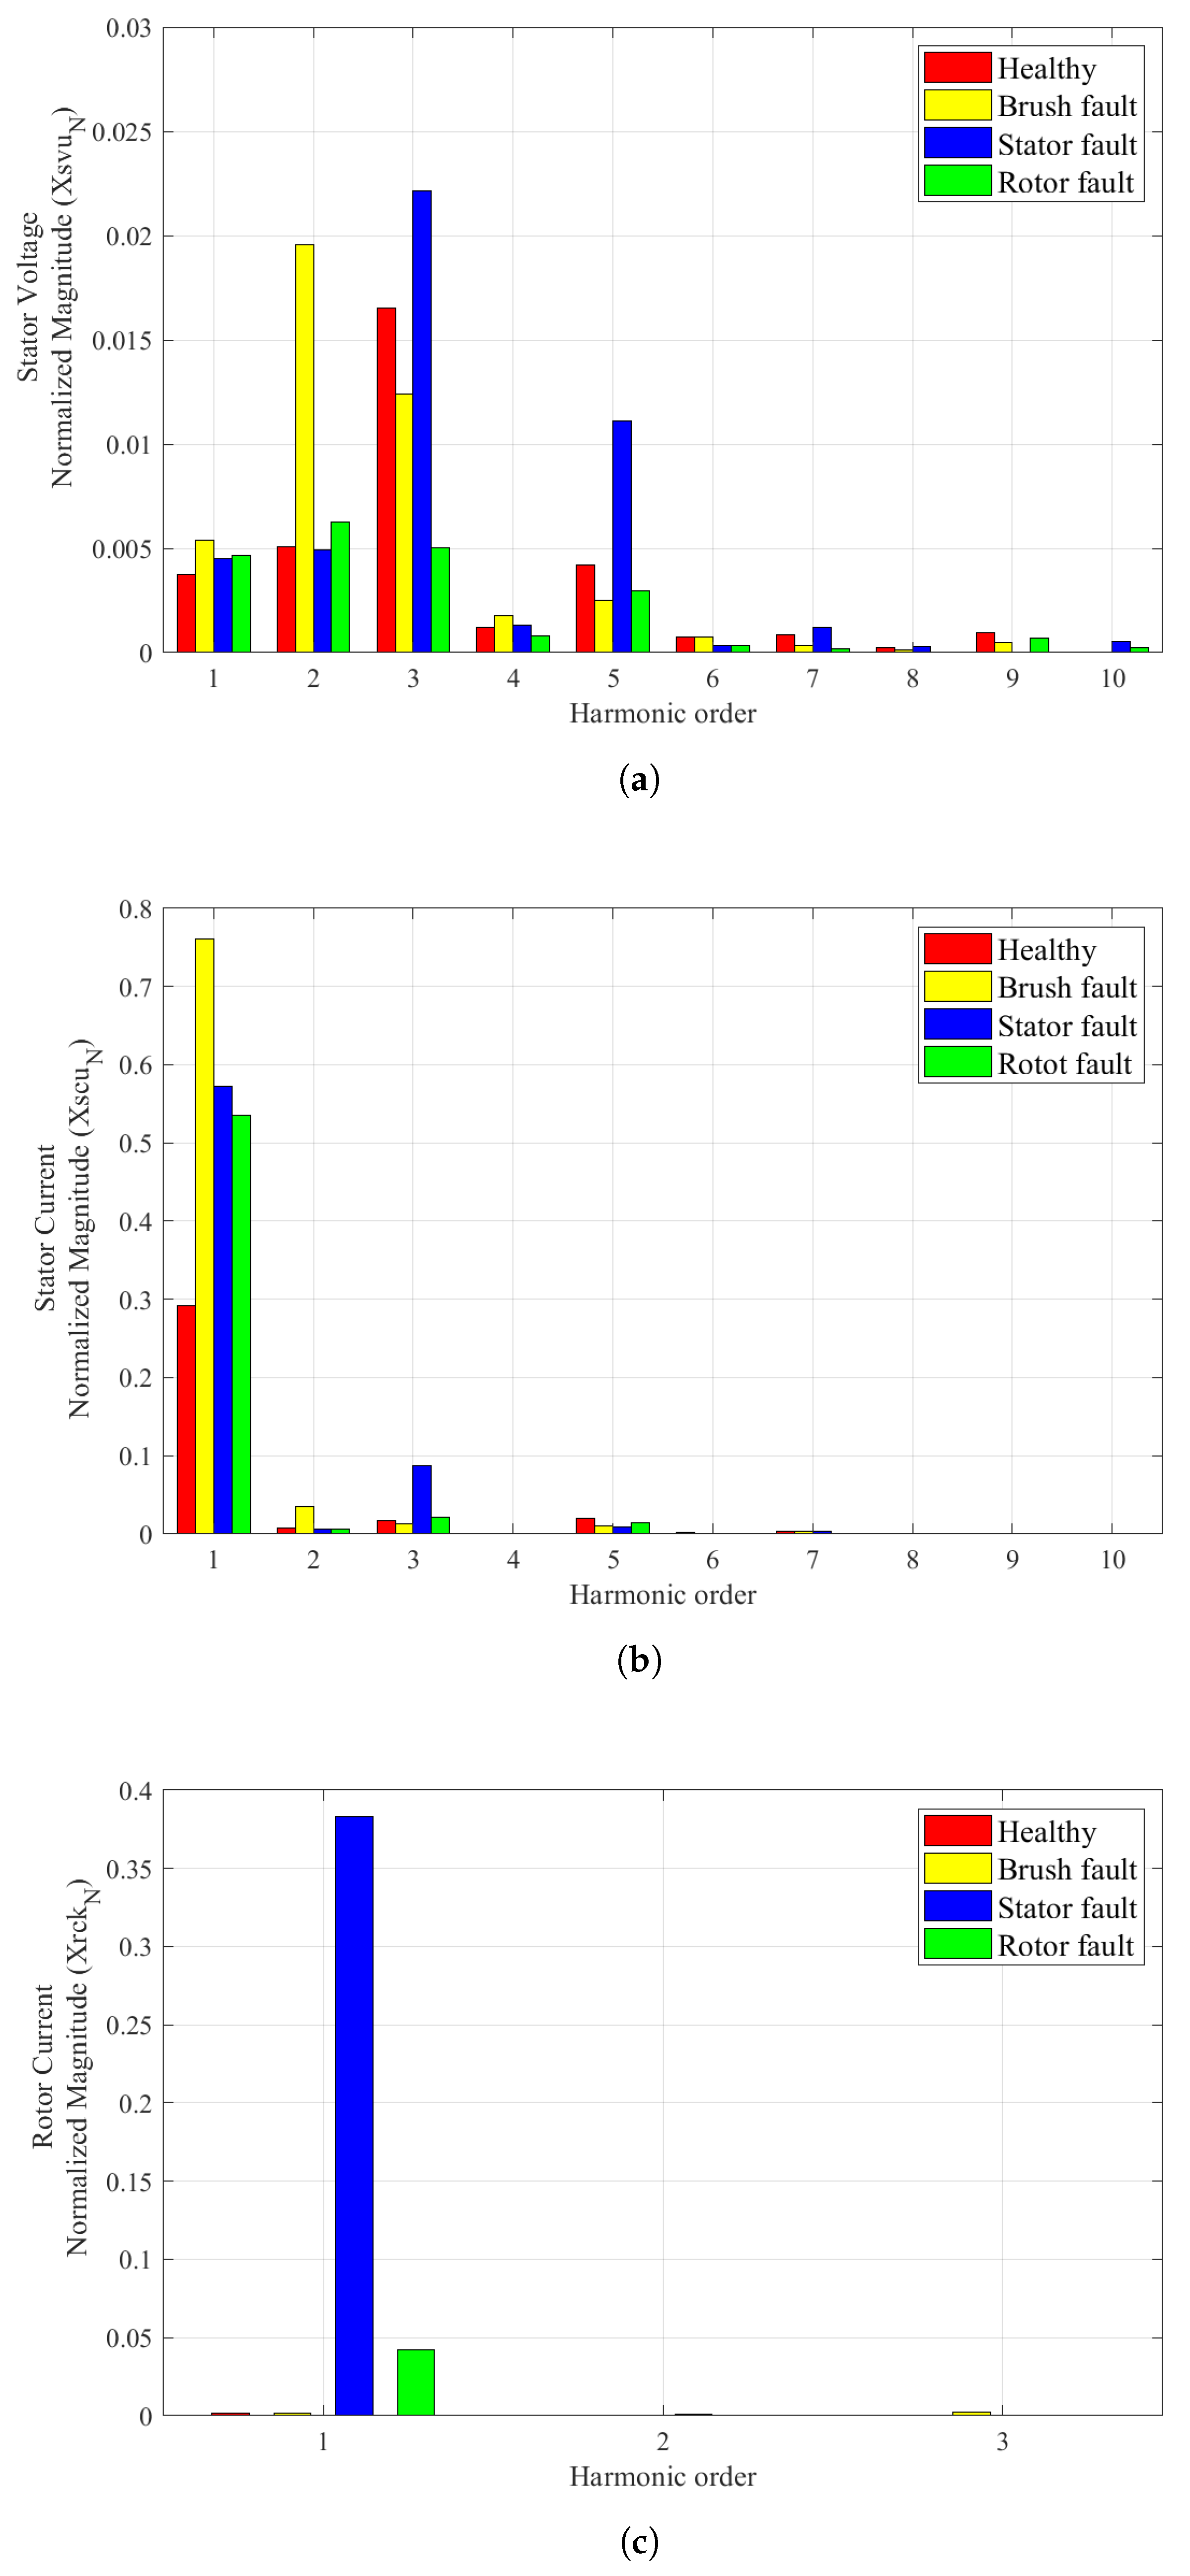
3.3. Signal Processing and Feature Extraction
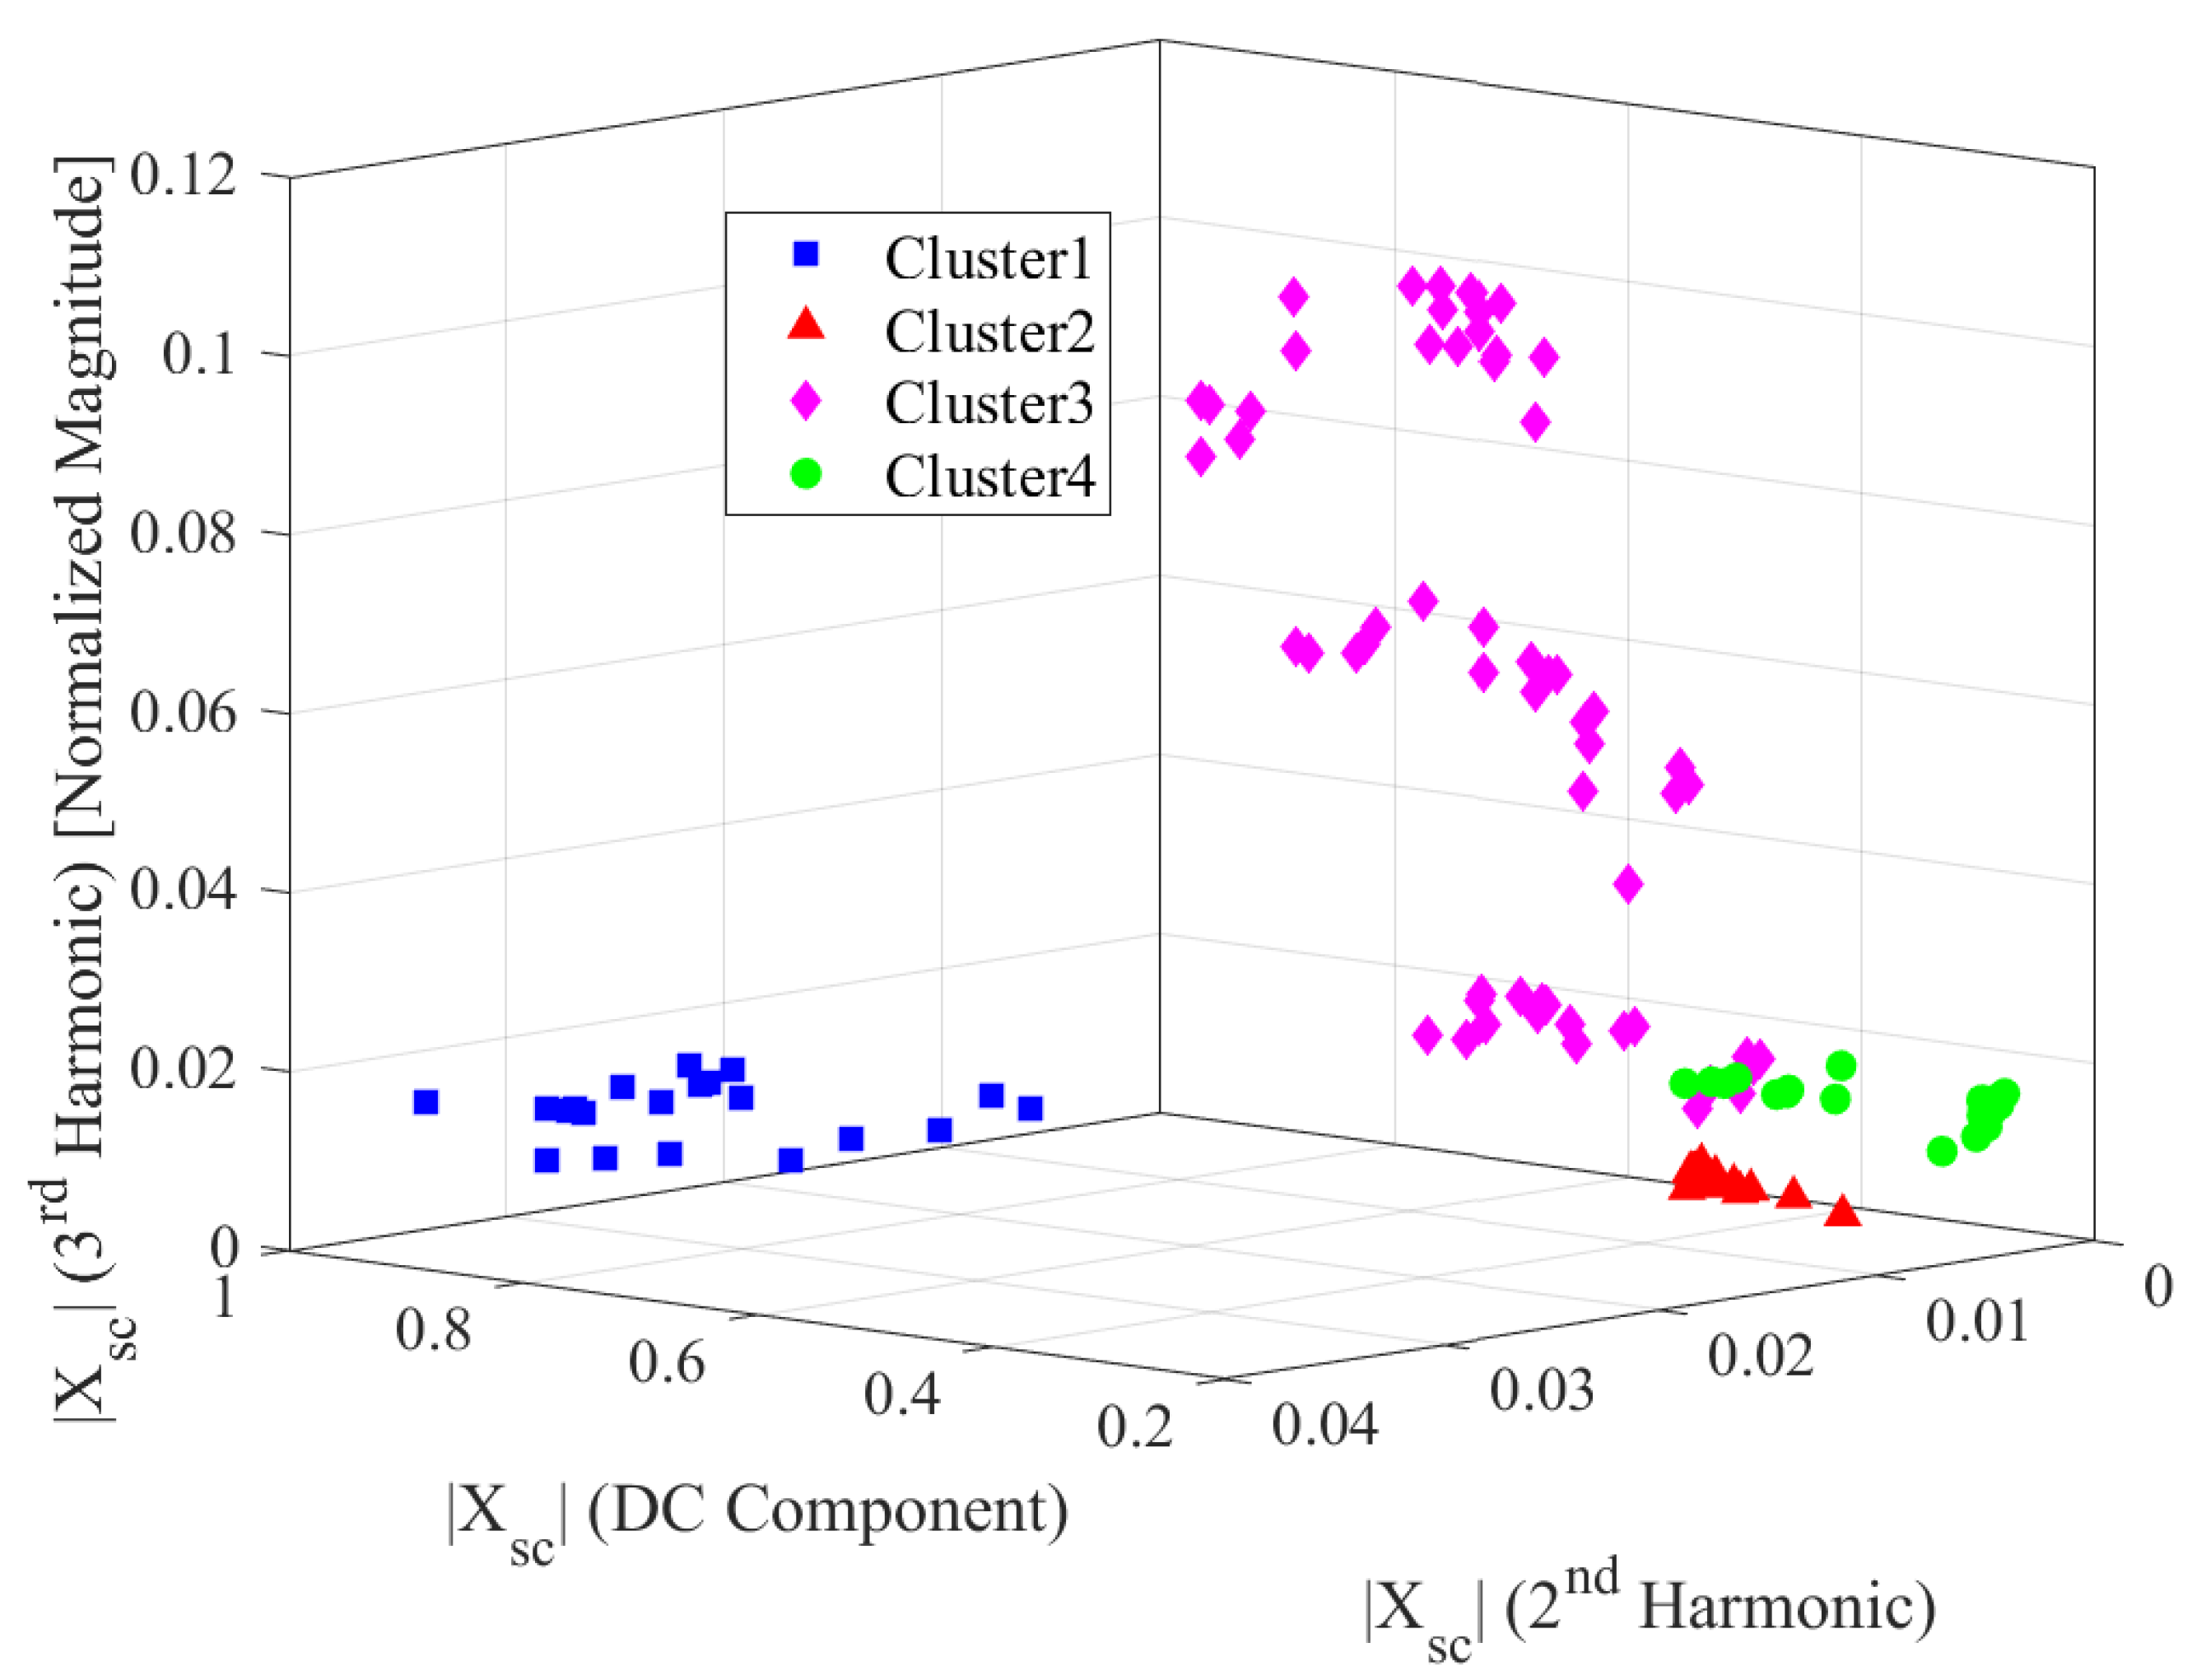
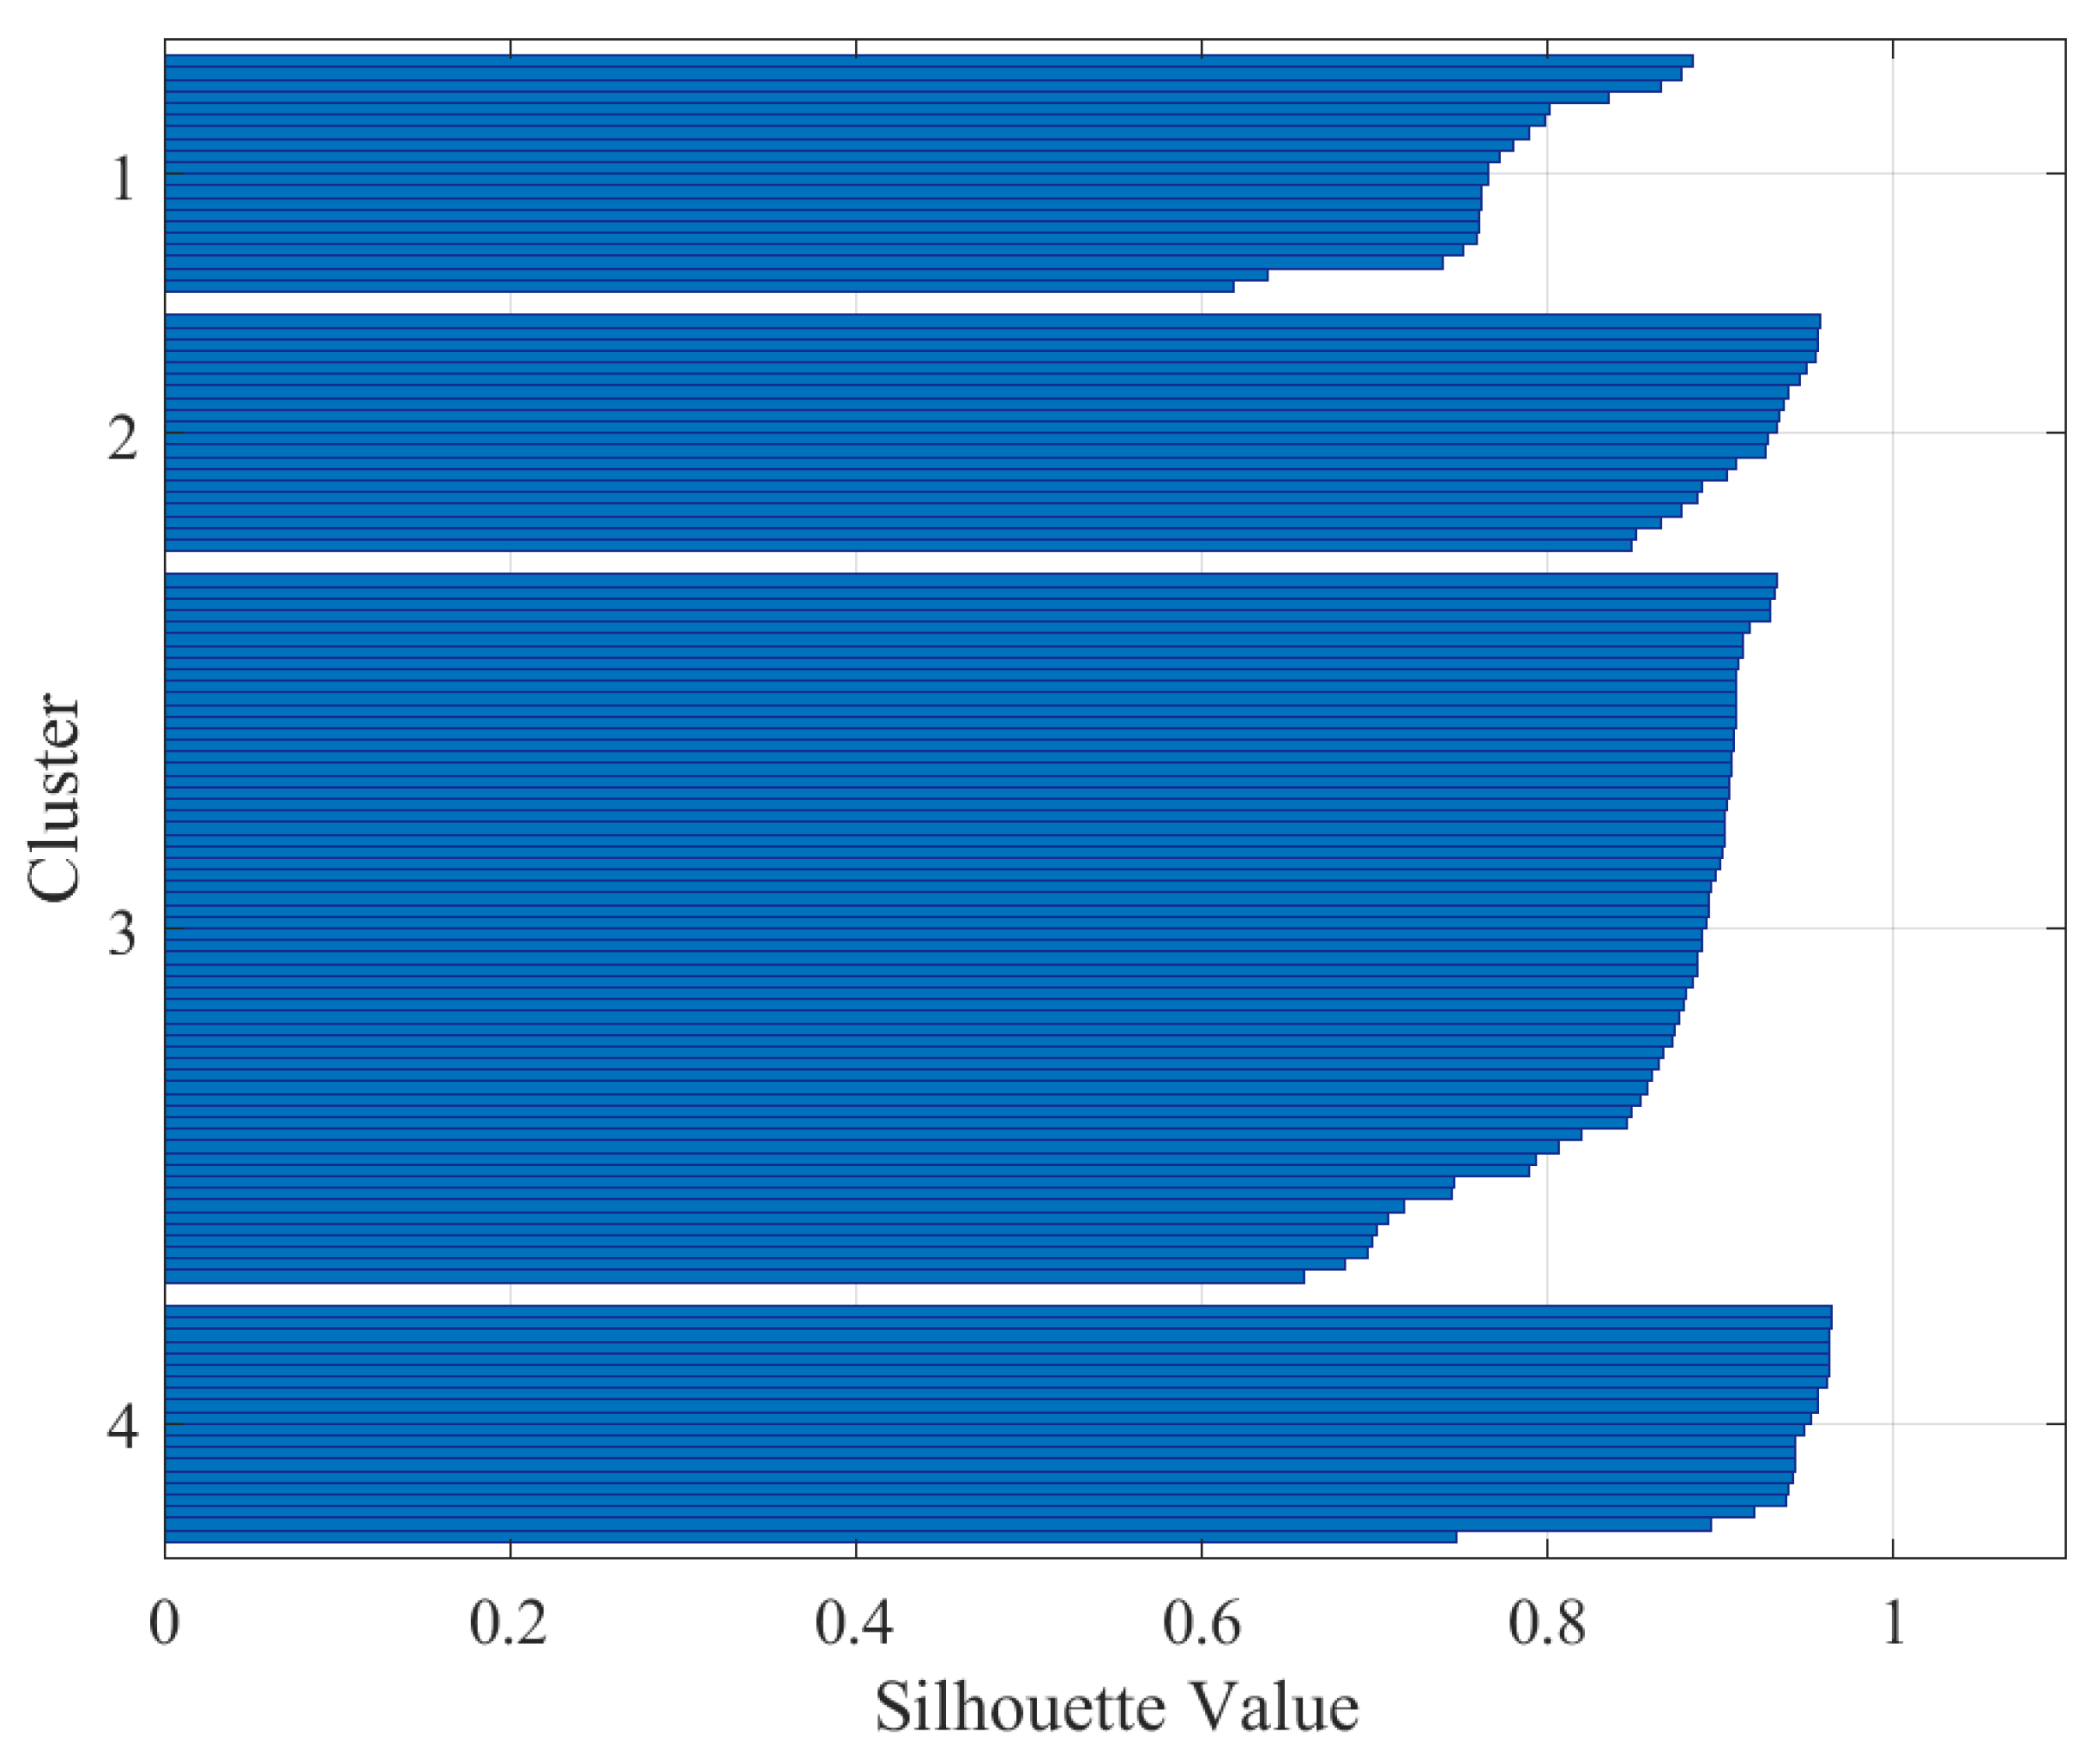
4. Results and Analysis
5. Conclusions
Author Contributions
Funding
Acknowledgments
Conflicts of Interest
References
- Shah, D.; Nandi, S.; Neti, P. Stator inter-turn fault detection of a doubly-fed induction generator using rotor current and search coil voltage signature analysis. IEEE Trans. Ind. Appl. 2009, 45, 1831–1842. [Google Scholar]
- Faiz, J.; Moosavi, S.M.M. Detection of mixed eccentricity fault in doubly-fed induction generator based on reactive power spectrum. IET Electr. Power Appl. 2017, 11, 1076–1084. [Google Scholar]
- Eini, B.J.; Saghaei, A.; Hosseini, S.H.; Hamedanian, A. Defect detection and preventive maintenance prioritization of distribution cubicles by infrared statistical image processing. In Proceedings of the IEEE 22nd International Conference on Electricity Distribution, Stockholm, Sweden, 10–13 June 2013. [Google Scholar]
- Rehman, A.U.; Chen, Y.; Wang, L.; Zhao, Y.; Yin, Y.; Cheng, Y.; Tanaka, T. Experimental research and analysis on rotor winding inter-turn circuit fault in DFIG. In Proceedings of the IEEE International Conference on Condition Monitoring and Diagnosis, Xi’an, China, 25–28 September 2016; pp. 164–167. [Google Scholar]
- Sun, W.; Zhao, R.; Yan, R.; Shao, S.; Chen, X. Convolutional discriminative feature learning for induction motor fault diagnosis. IEEE Trans. Ind. Inform. 2017, 13, 1350–1359. [Google Scholar]
- Palácios, R.H.C.; da Silva, I.N.; Goedtel, A.; Godoy, W.F.; Lopes, T.D. Diagnosis of stator faults severity in induction motors using two intelligent approaches. IEEE Trans. Ind. Inform. 2017, 13, 1681–1691. [Google Scholar]
- Wang, L.; Zhang, Z.; Long, H.; Xu, J.; Liu, R. Wind turbine gearbox failure identification with deep neural networks. IEEE Trans. Ind. Inform. 2017, 13, 1360–1368. [Google Scholar]
- de Sousa, P.H.F.; e Nascimento, N.M.M.; Rebouças Filho, P.P.; de Medeiros, C.M.S. Detection and classification of faults in induction generator applied into wind turbines through a machine learning approach. In Proceedings of the IEEE International Joint Conference on Neural Networks (IJCNN), Rio de Janeiro, Brazil, 8–13 July 2018; pp. 1–7. [Google Scholar]
- Hoang, D.T.; Kang, H.J. A Motor Current Signal-Based Bearing Fault Diagnosis Using Deep Learning and Information Fusion. IEEE Trans. Instrum. Meas. 2019, 69, 3325–3333. [Google Scholar]
- Zhao, X.; Jia, M.; Liu, Z. Semi-Supervised Graph Convolution Deep Belief Network for Fault Diagnosis of Electormechanical System with Limited Labeled Data. IEEE Trans. Ind. Inform. 2020. [Google Scholar] [CrossRef]
- Zhao, X.; Jia, M.; Lin, M. Deep Laplacian Auto-encoder and its application into imbalanced fault diagnosis of rotating machinery. Measurement 2020, 152, 107320. [Google Scholar]
- Jia, F.; Lei, Y.; Lu, N.; Xing, S. Deep normalized convolutional neural network for imbalanced fault classification of machinery and its understanding via visualization. Mech. Syst. Signal Process. 2018, 110, 349–367. [Google Scholar]
- Mojallal, A.; Lotfifard, S. DFIG wind generators fault diagnosis considering parameter and measurement uncertainties. IEEE Trans. Sustain. Energy 2017, 9, 792–804. [Google Scholar]
- Frutos-Pascual, M.; Zapirain, B.G. Review of the use of AI techniques in serious games: Decision making and machine learning. IEEE Trans. Comput. Intell. AI Games 2015, 9, 131–152. [Google Scholar]
- Wang, Z.; Chen, C.; Li, H.X.; Dong, D.; Tarn, T.J. Incremental reinforcement learning with prioritized sweeping for dynamic environments. IEEE/ASME Trans. Mechatronics 2019, 24, 621–632. [Google Scholar]
- Das, S.; Dey, A.; Pal, A.; Roy, N. Application of artificial intelligence in machine learning: Review and prospect. Int. J. Comput. Appl. 2015, 115, 31–41. [Google Scholar]
- Boutaba, R.; Salahuddin, M.A.; Limam, N.; Ayoubi, S.; Shahriar, N.; Estrada-Solano, F.; Caicedo, O.M. A comprehensive survey on machine learning for networking: Evolution, applications and research opportunities. J. Internet Serv. Appl. 2018, 9, 16. [Google Scholar]
- Caragea, C.; Honavar, V. Machine Learning in Computational Biology. In Encyclopedia of Database Systems; Liu, L., Özsu, M., Eds.; Springer: New York, NY, USA, 2017; pp. 1663–1667. [Google Scholar]
- Cho, S.B.; Won, H.H. Machine learning in DNA microarray analysis for cancer classification. In Proceedings of the First Pacific Bioinformatics Conference, Adelaide, Australia, 4–7 February 2003; Volume 19, pp. 189–198. [Google Scholar]
- Hou, T.; Huang, H. Statistical physics of unsupervised learning with prior knowledge in neural networks. Phys. Rev. Lett. 2020, 124, 248302. [Google Scholar] [PubMed]
- Gao, J.; Zhong, C.; Chen, X.; Lin, H.; Zhang, Z. Unsupervised learning for passive beamforming. IEEE Commun. Lett. 2020, 24, 1052–1056. [Google Scholar]
- Yan, K.; Huang, J.; Shen, W.; Ji, Z. Unsupervised learning for fault detection and diagnosis of air handling units. Energy Build. 2020, 210, 109689. [Google Scholar]
- Ali, H.H.; Kadhum, L.E. K-means clustering algorithm applications in data mining and pattern recognition. Int. J. Sci. Res. 2017, 6, 1577–1584. [Google Scholar]
- Khan, S.S.; Ahmad, A. Cluster center initialization algorithm for K-means clustering. Pattern Recognit. Lett. 2004, 25, 1293–1302. [Google Scholar]
- Lei, B.; Xu, G.; Feng, M.; Zou, Y.; Van der Heijden, F.; De Ridder, D.; Tax, D. Classification, Parameter Estimation and State Estimation; John Wiley and Sons Ltd.: Chichester, UK, 2004; pp. 228–234. [Google Scholar]
- Curtis, D.; Kubushyn, V.; Yfantis, E.A.; Rogers, M. A Hierarchical feature decomposition clustering algorithm for unsupervised classification of document image types. In Proceedings of the IEEE Sixth International Conference on Machine Learning and Application, Cincinnati, OH, USA, 13–15 December 2007; pp. 423–428. [Google Scholar]
- Rousseeuw, P.J. Silhouettes: A graphical aid to the interpretation and validation of cluster analysis. J. Comput. Appl. Math. 1987, 20, 53–65. [Google Scholar]
- Burney, S.M.A.; Tariq, H. K-means cluster analysis for image segmentation. Int. J. Comput. Appl. 2014, 96, 1–8. [Google Scholar]
- Sapena-Bano, A.; Riera-Guasp, M.; Puche-Panadero, R.; Martinez-Roman, J.; Perez-Cruz, J.; Pineda-Sanchez, M. Harmonic order tracking analysis: A speed-sensorless method for condition monitoring of wound rotor induction generators. IEEE Trans. Ind. Appl. 2016, 52, 4719–4729. [Google Scholar] [CrossRef]
- Garg, H.; Dahiya, R. Wind Turbine Condition Monitoring for Rotor Faults using MCSA. In Proceedings of the IEEE 8th Power India International Conference (PIICON), Kurukshetra, India, 10–12 December 2018; pp. 1–5. [Google Scholar]
- Swana, E.F.; Doorsamy, W. Investigation of combined electrical modalities for fault diagnosis on a wound-rotor induction generator. IEEE Access 2019, 7, 32333–32342. [Google Scholar] [CrossRef]
- Rehman, A.U.; Chen, Y.; Zhang, M.; Zhao, Y.; Wang, L.; Liu, Y.; Zhao, Y.; Cheng, Y.; Tanaka, T. Fault detection and fault severity calculation for rotor windings based on spectral, wavelet and ratio computation analyses of rotor current signals for a doubly fed induction generator in wind turbines. Electr. Eng. 2020, 102, 1091–1102. [Google Scholar] [CrossRef]
- Sabir, H.; Ouassaid, M.; Ngote, N. Diagnosis of Rotor Winding Inter-Turn Short Circuit Fault in Wind Turbine Based on DFIG Using the TSA-CSA Method. In Proceedings of the IEEE International Symposium on Advanced Electrical and Communication Technologies (ISAECT), Rabat, Morocco, 21–23 November 2018; pp. 1–5. [Google Scholar]


| Silhouette Value | Interpretation |
|---|---|
| 0.71–1 | Strong structure |
| 0.51–0.7 | Reasonable structure |
| Table 0.26–0.5 | Weak structure |
| ≤0.25 | Bad structure |
| Condition | No-Load | With-Load | |||||
|---|---|---|---|---|---|---|---|
| Speed | Rotor Current | Stator Voltage | Speed | Rotor Current | Stator Current | Stator Voltage | |
| Healthy | x | x | x | x | x | x | x |
| Stator-winding short (3 turns) | x | x | x | x | x | x | x |
| Stator-winding short (6 turns) | x | x | x | x | x | x | x |
| Rotor-winding short (3 turns) | x | x | x | x | x | x | x |
| Rotor-winding short (6 turns) | x | x | x | x | x | x | x |
| Brush Fault | x | x | x | x | x | x | x |
| Detail | Value |
|---|---|
| Rated power | 1 kW |
| Frequency | 50 Hz |
| Power factor | 0.8 |
| Synchronous speed | 1500 rpm |
| Rated voltage | 380 V |
| Number of poles | 4 |
| Number of phases | 3 |
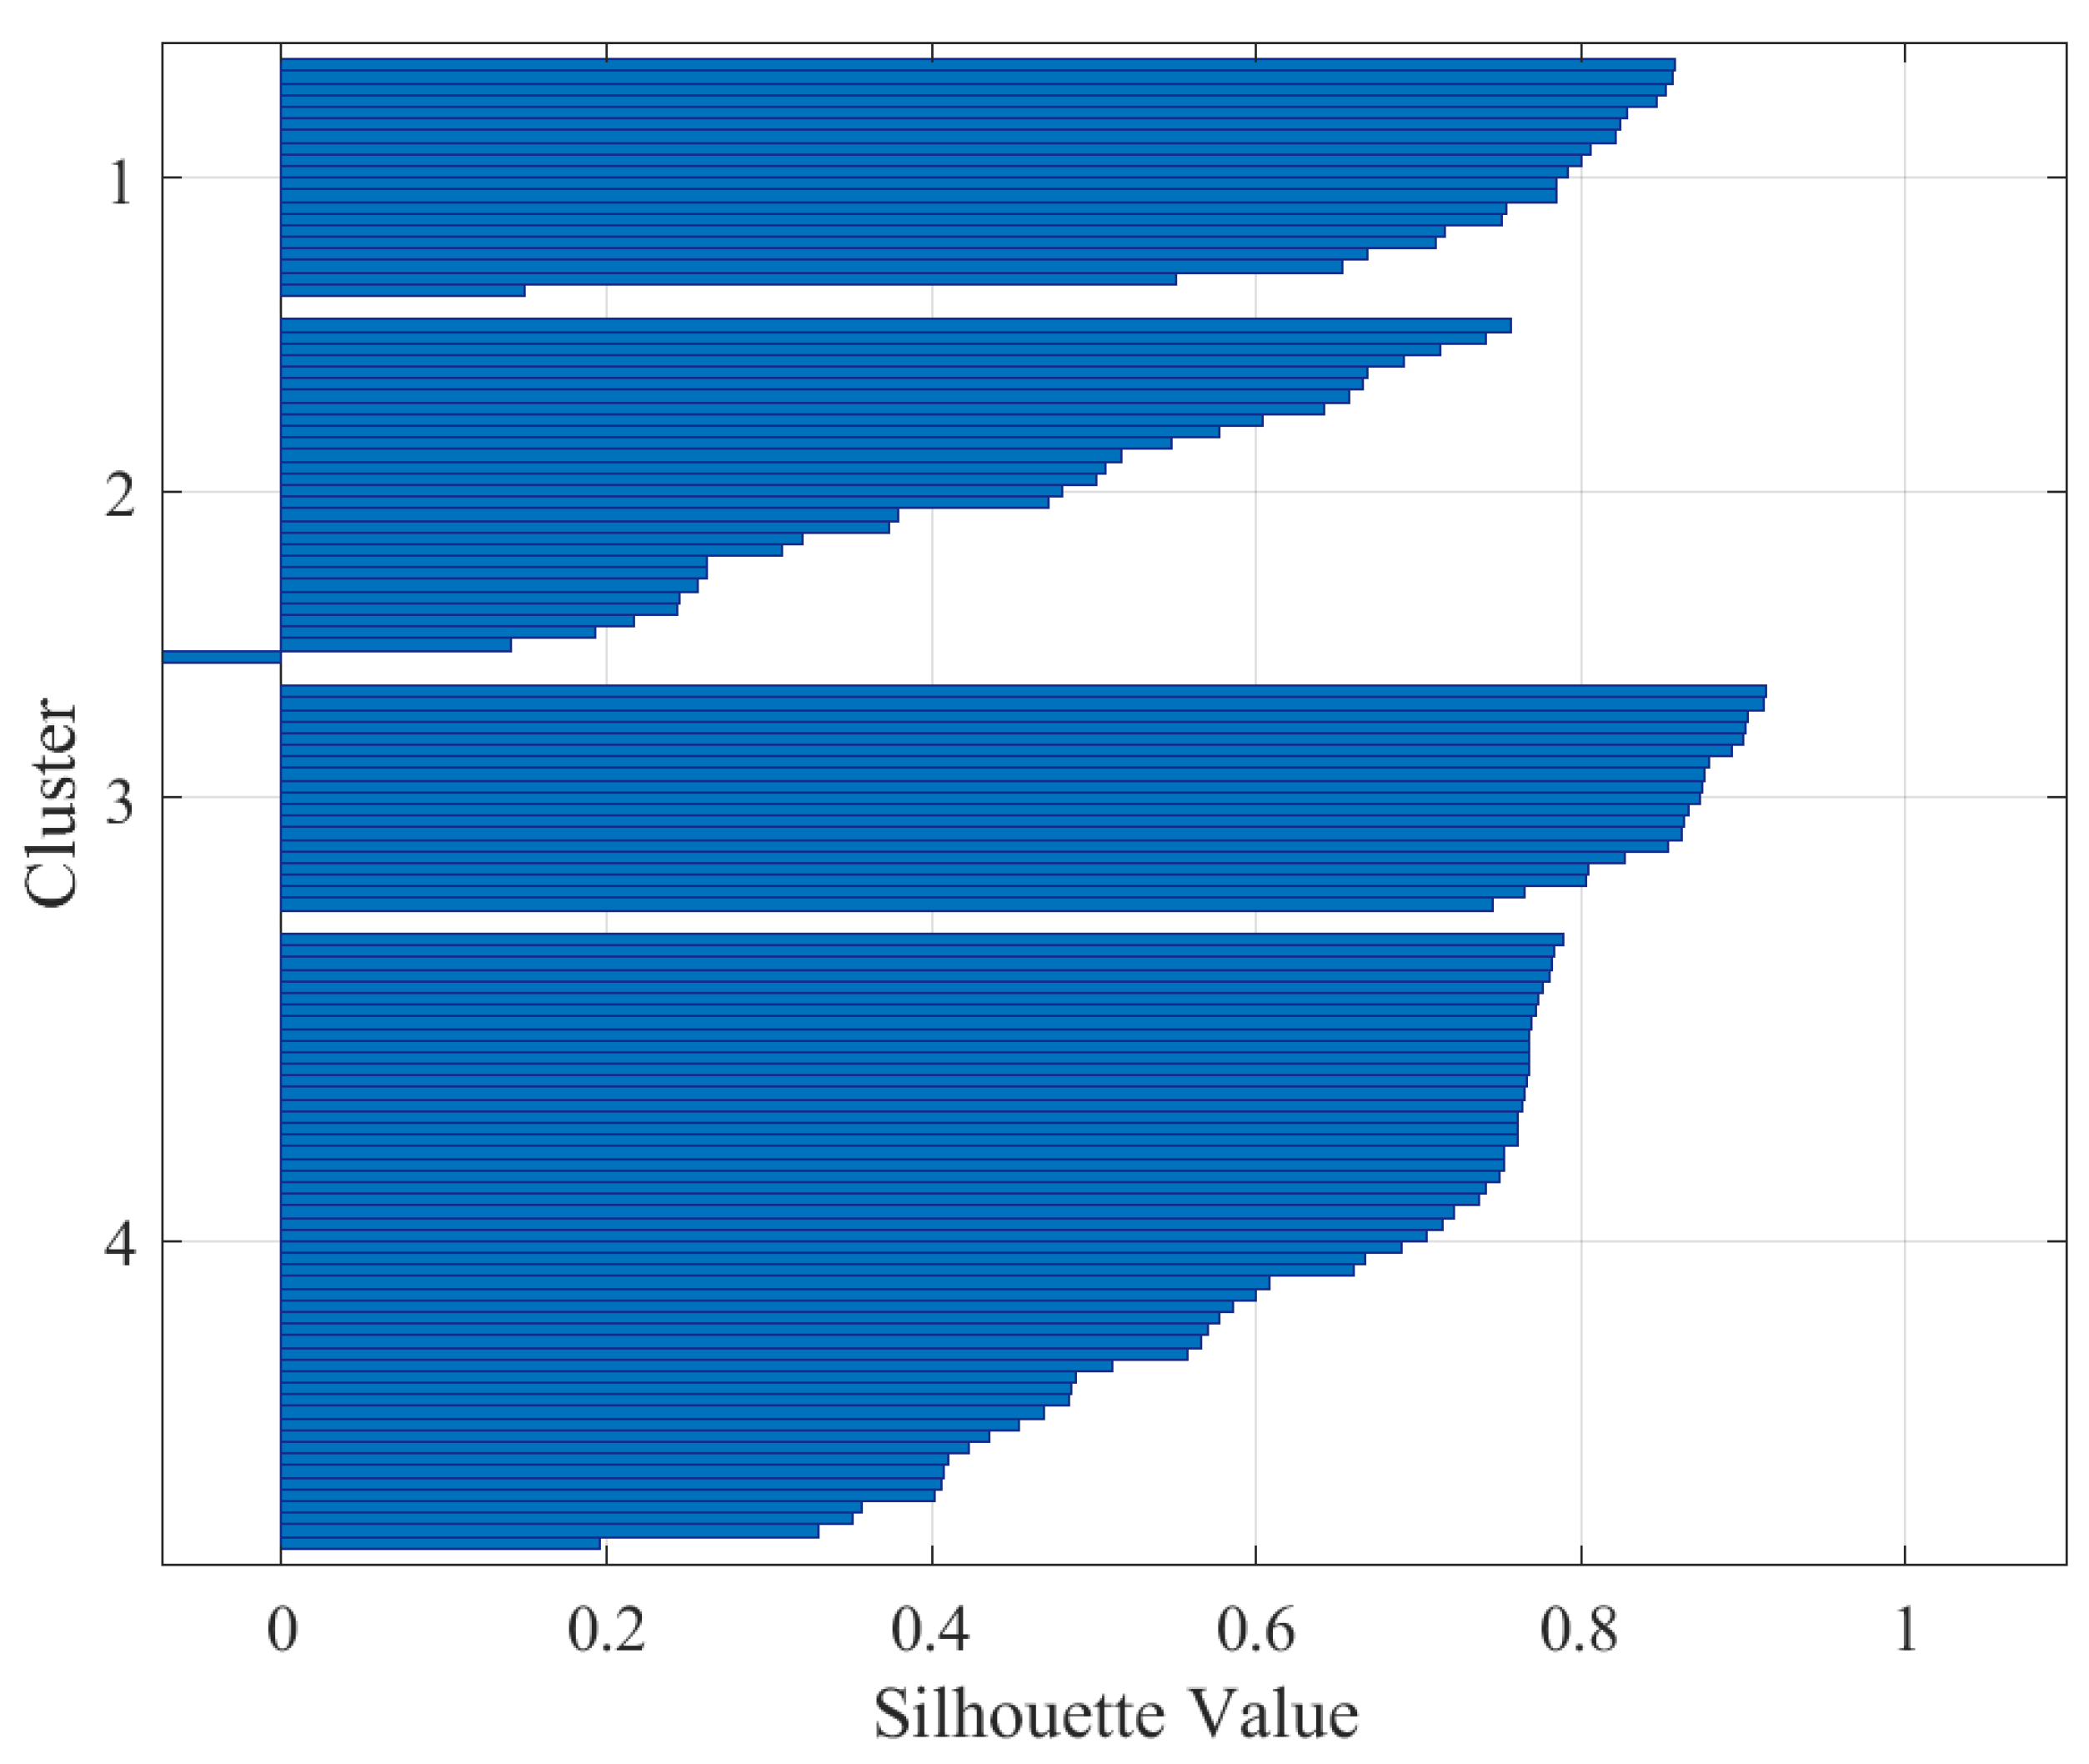
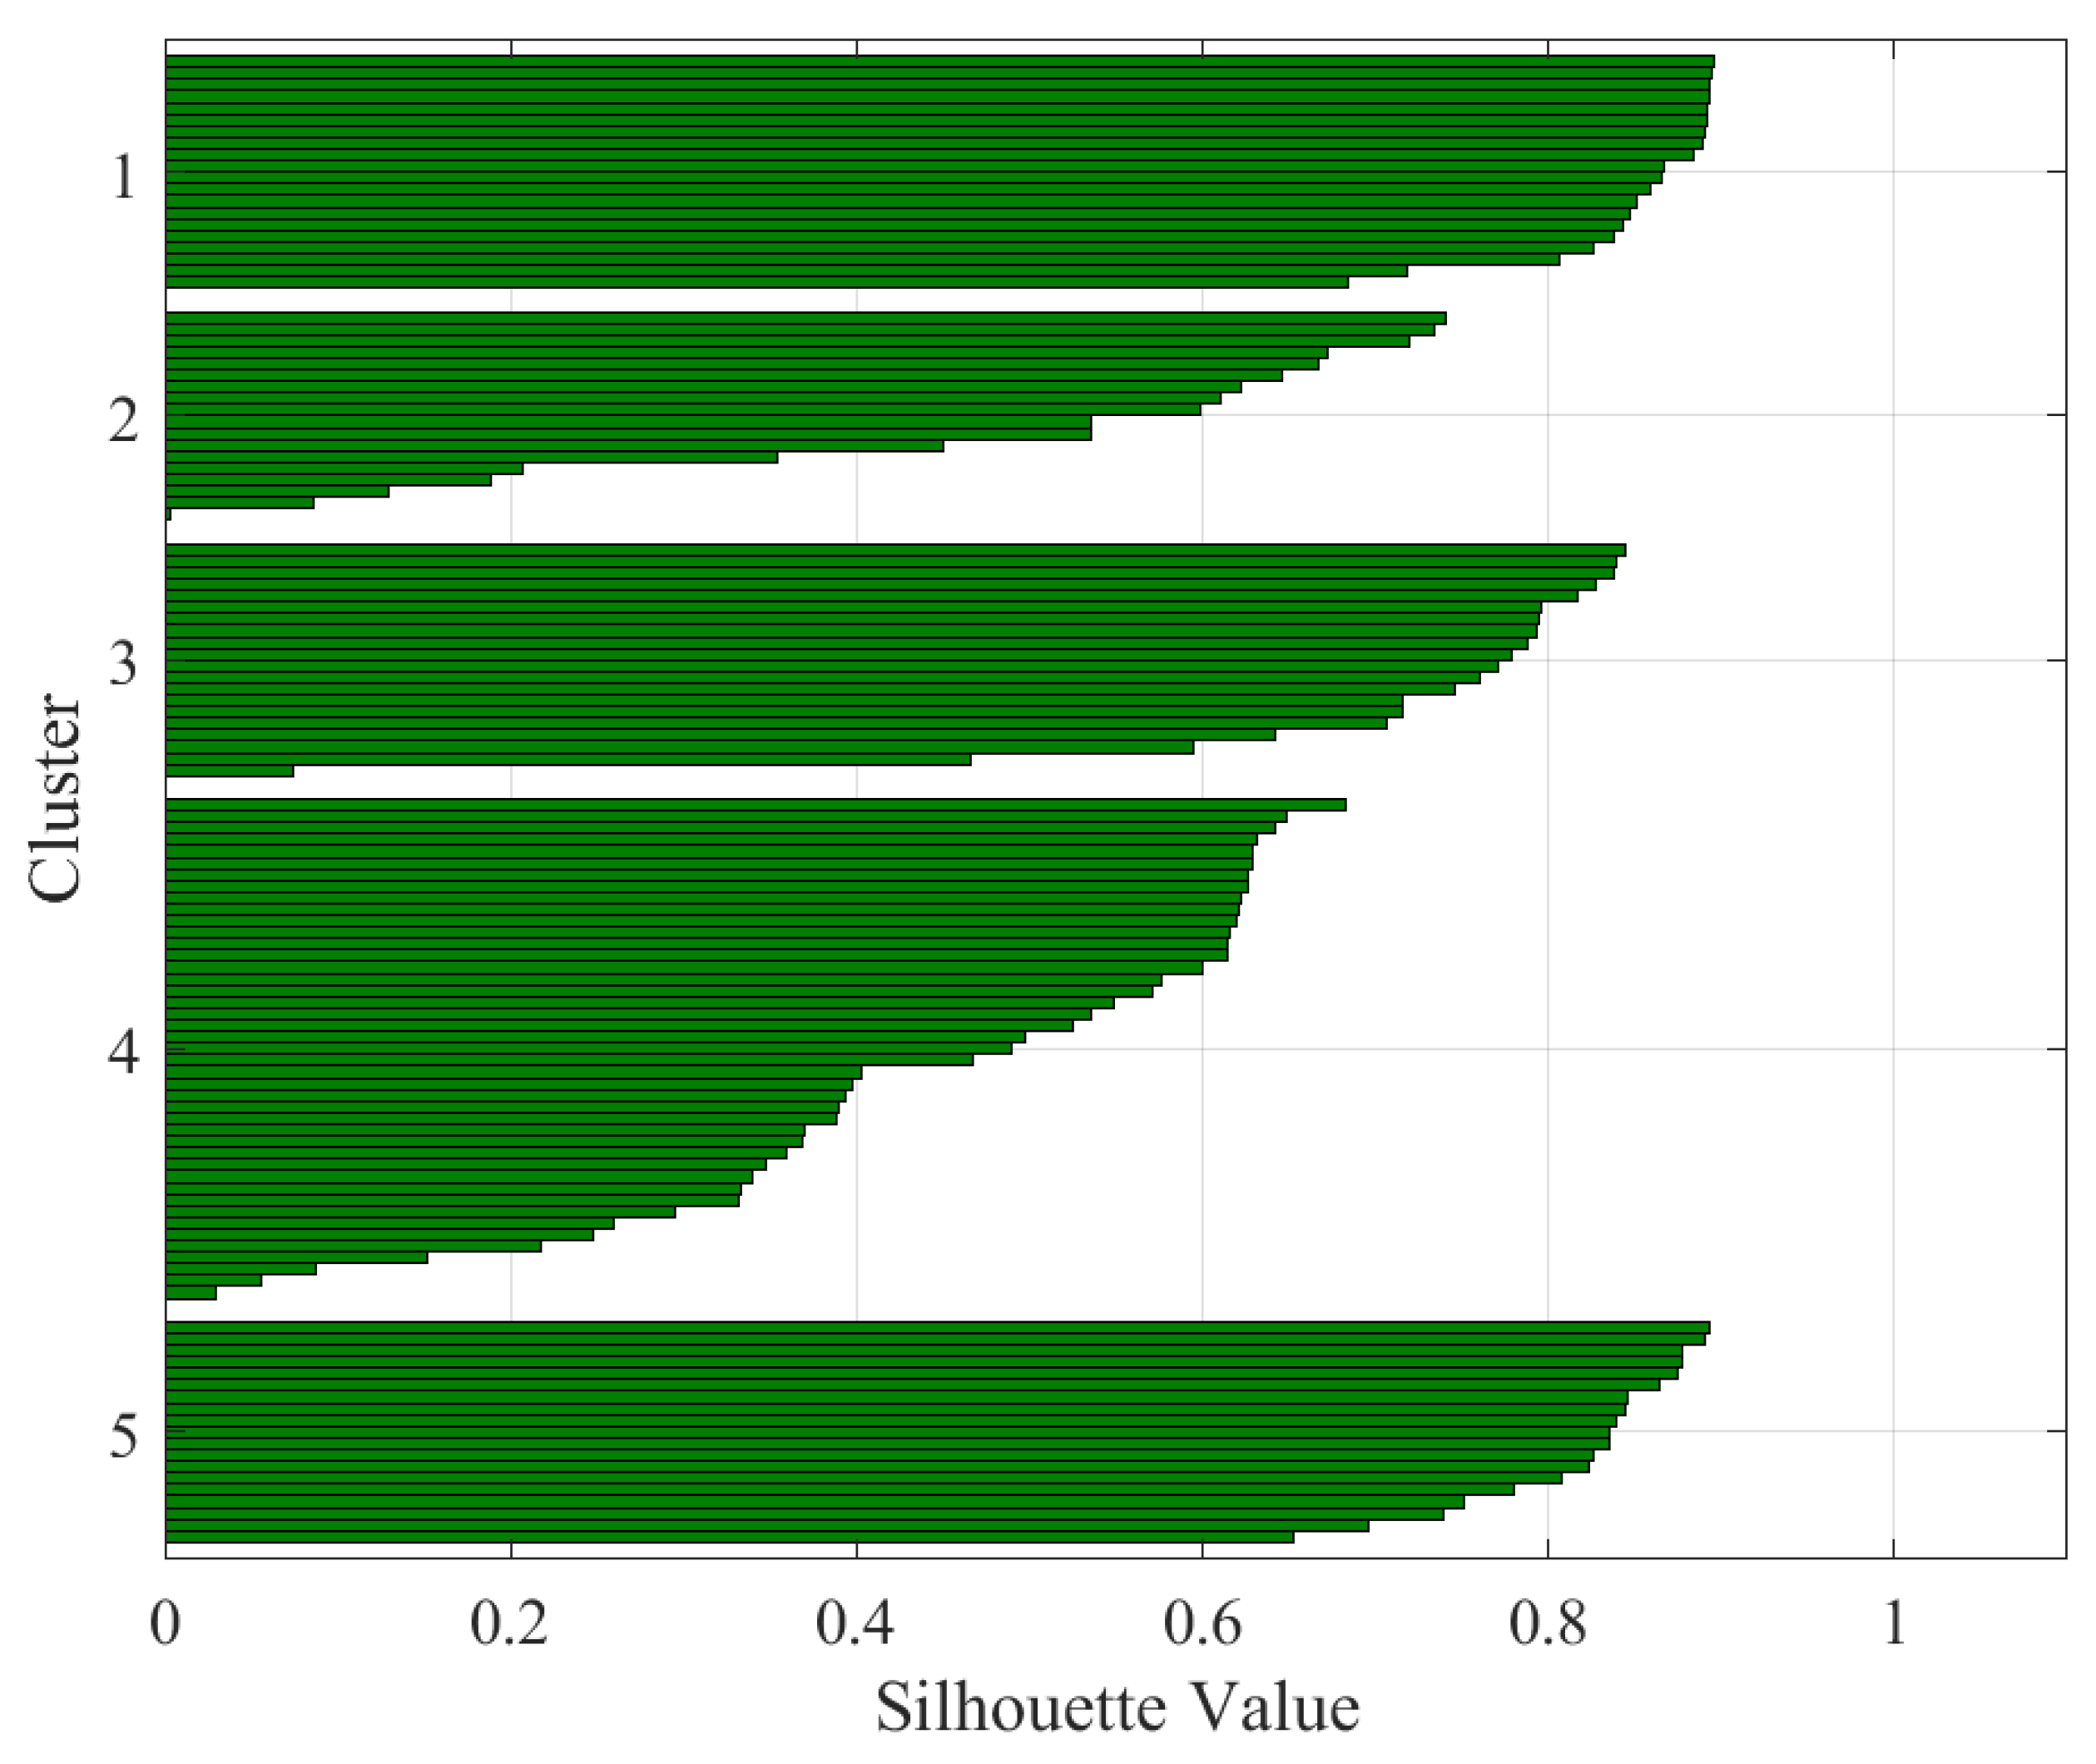
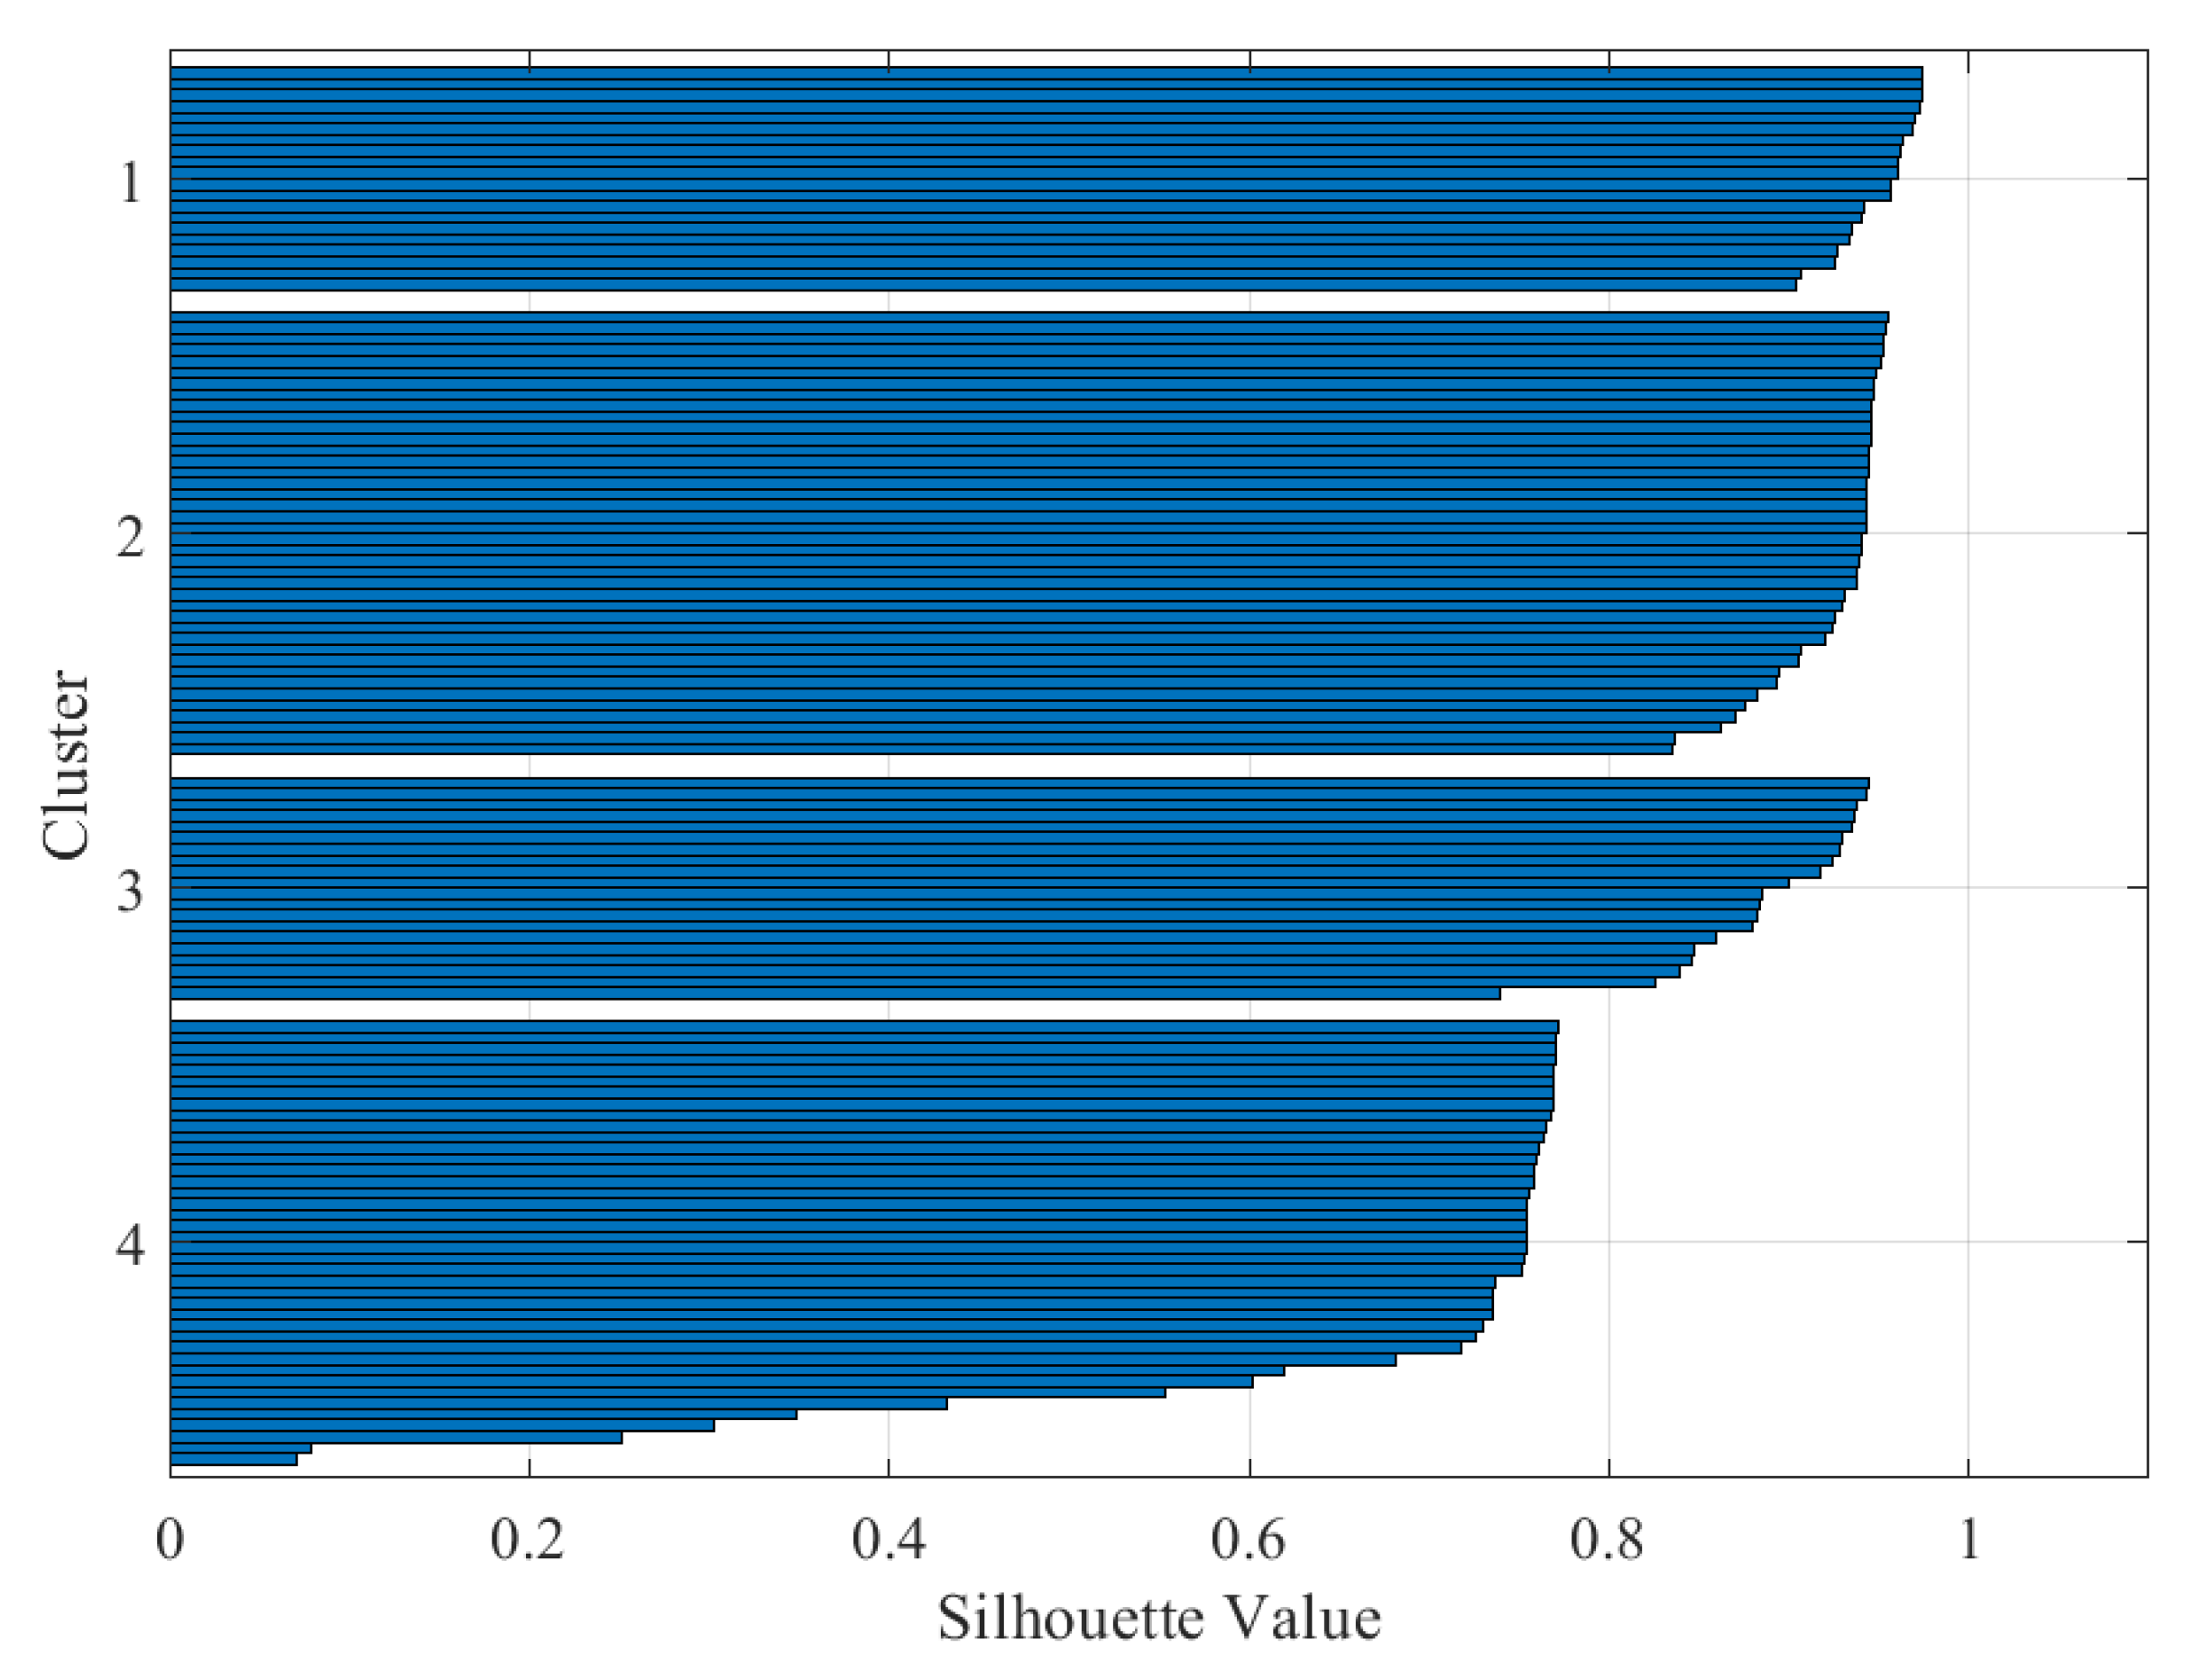
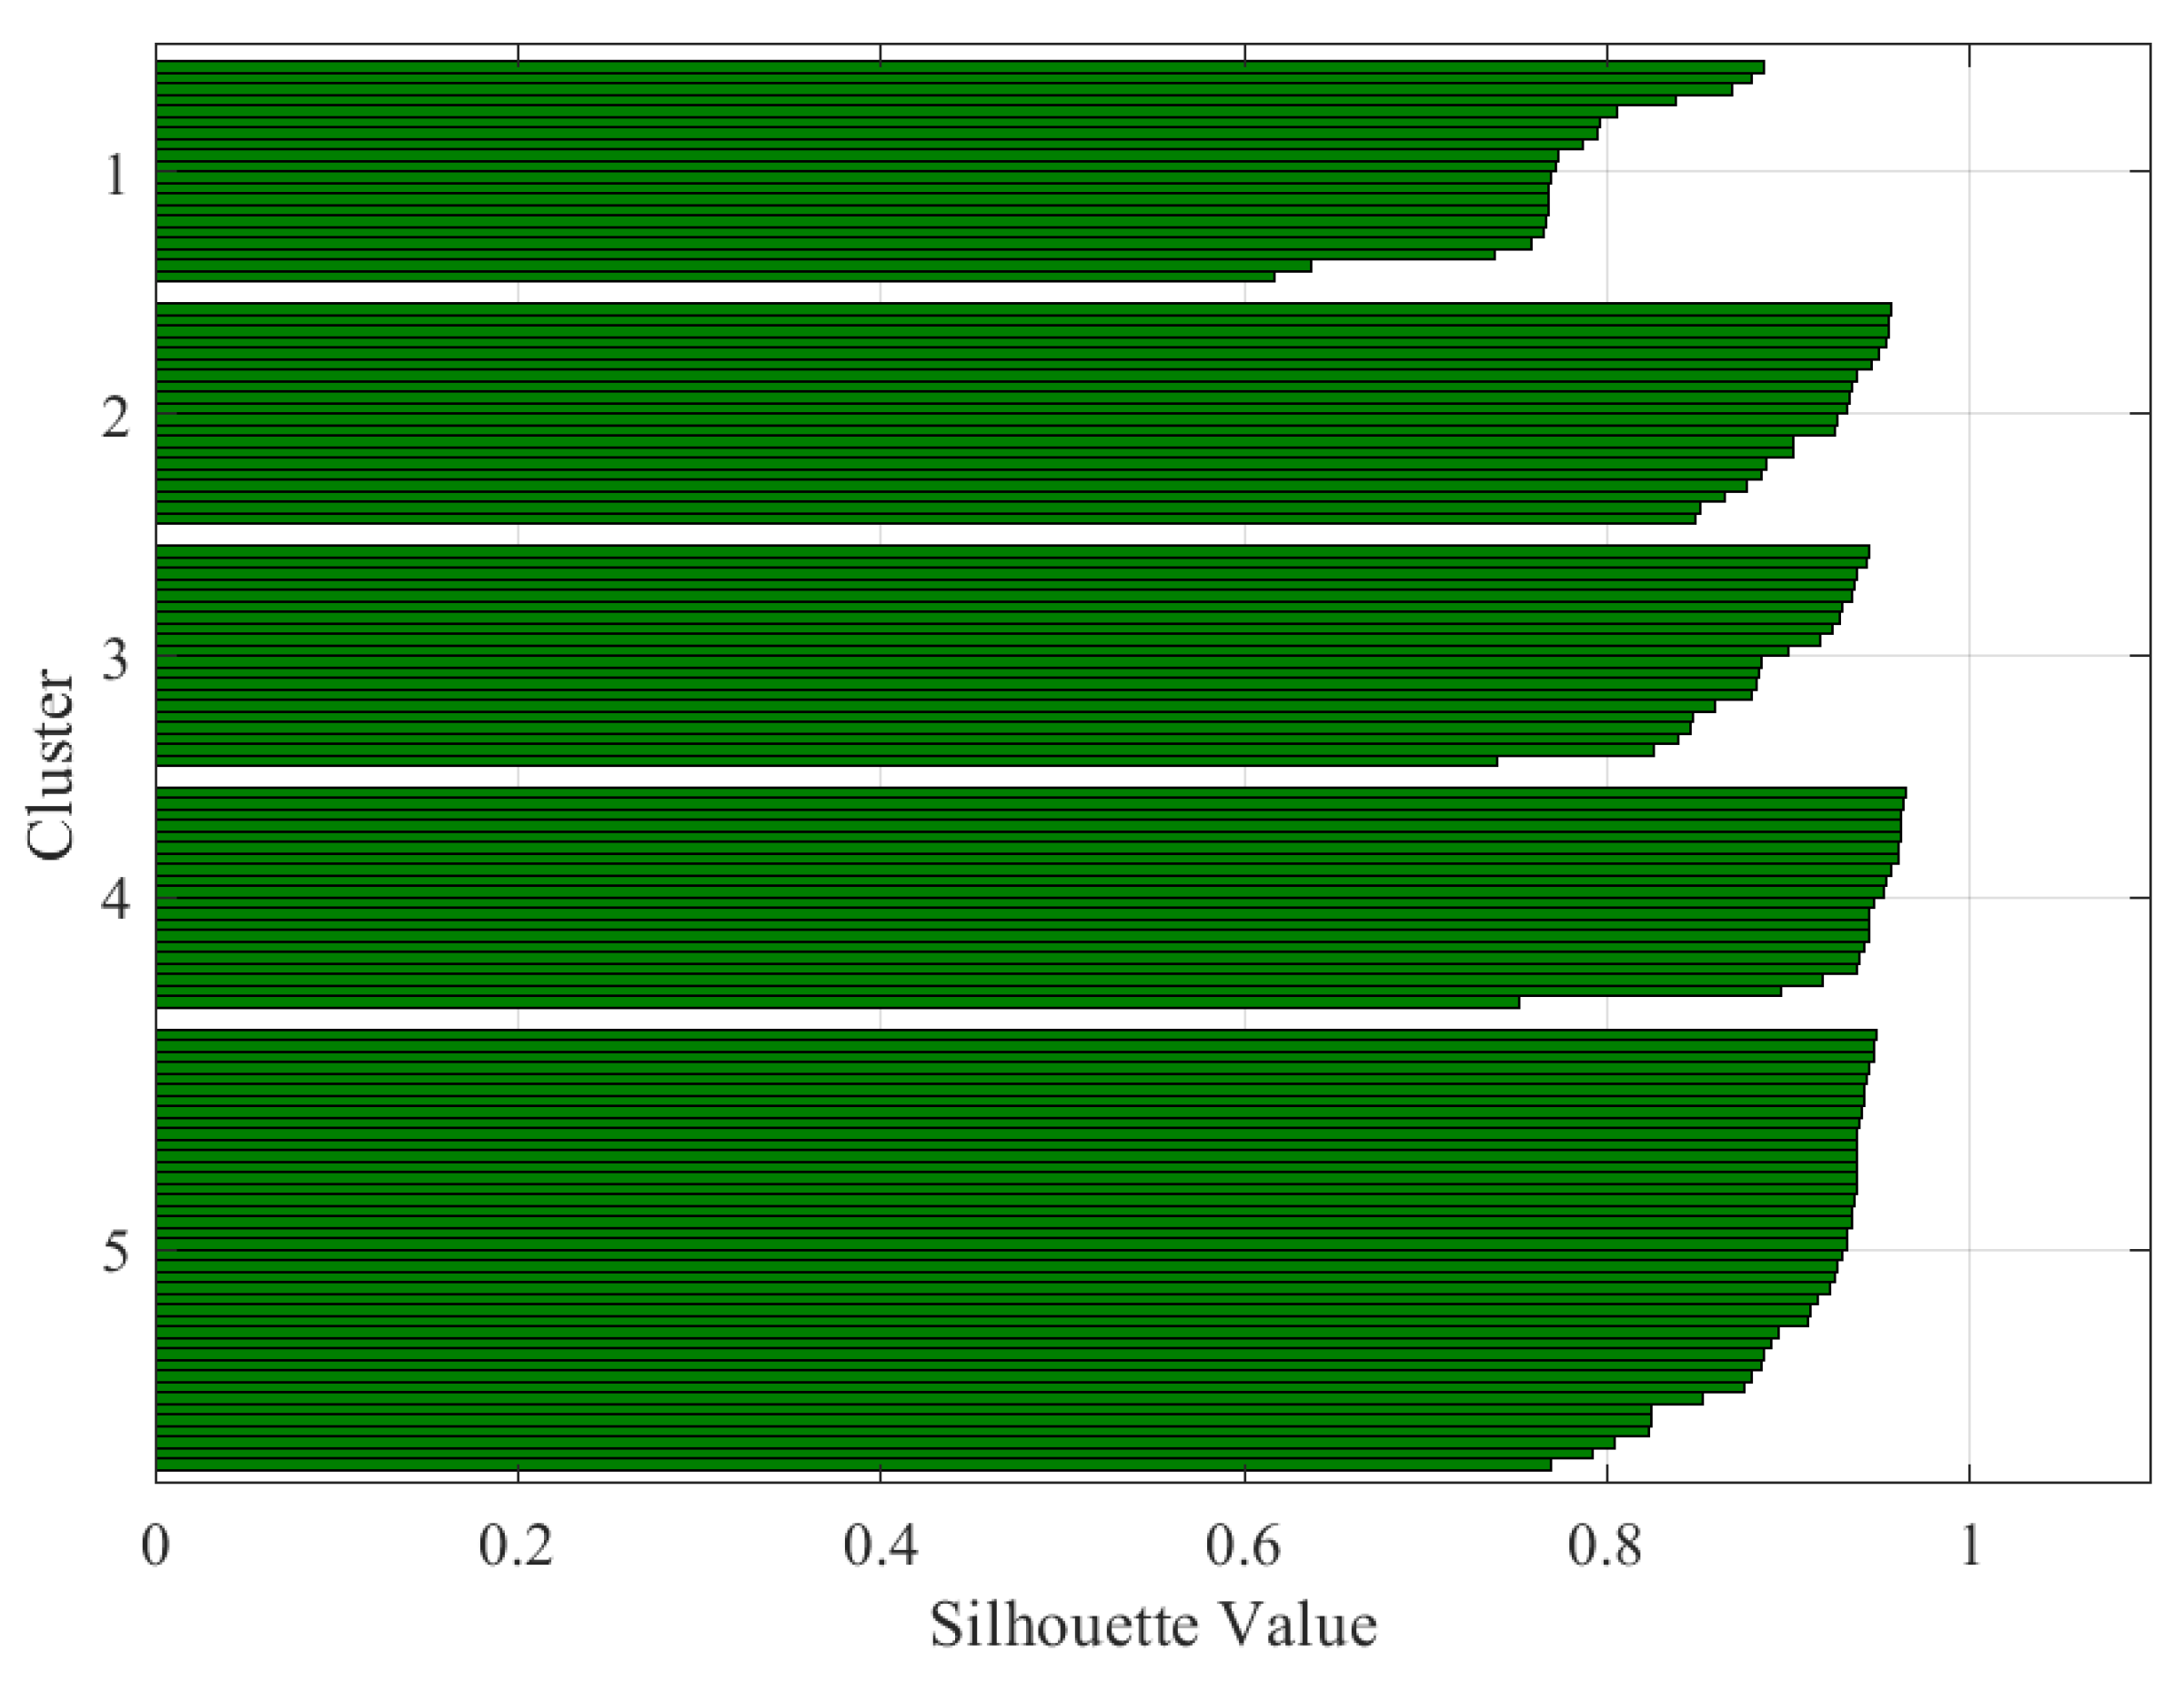
| Data | K | Silhouette Average Value | Interpretation |
|---|---|---|---|
| Stator current | 4 | 0.87 | Excellent split |
| Stator current | 5 | 0.75 | Excellent split |
| Stator voltage | 4 | 0.64 | Reasonable split |
| Stator voltage | 5 | 0.62 | Reasonable split |
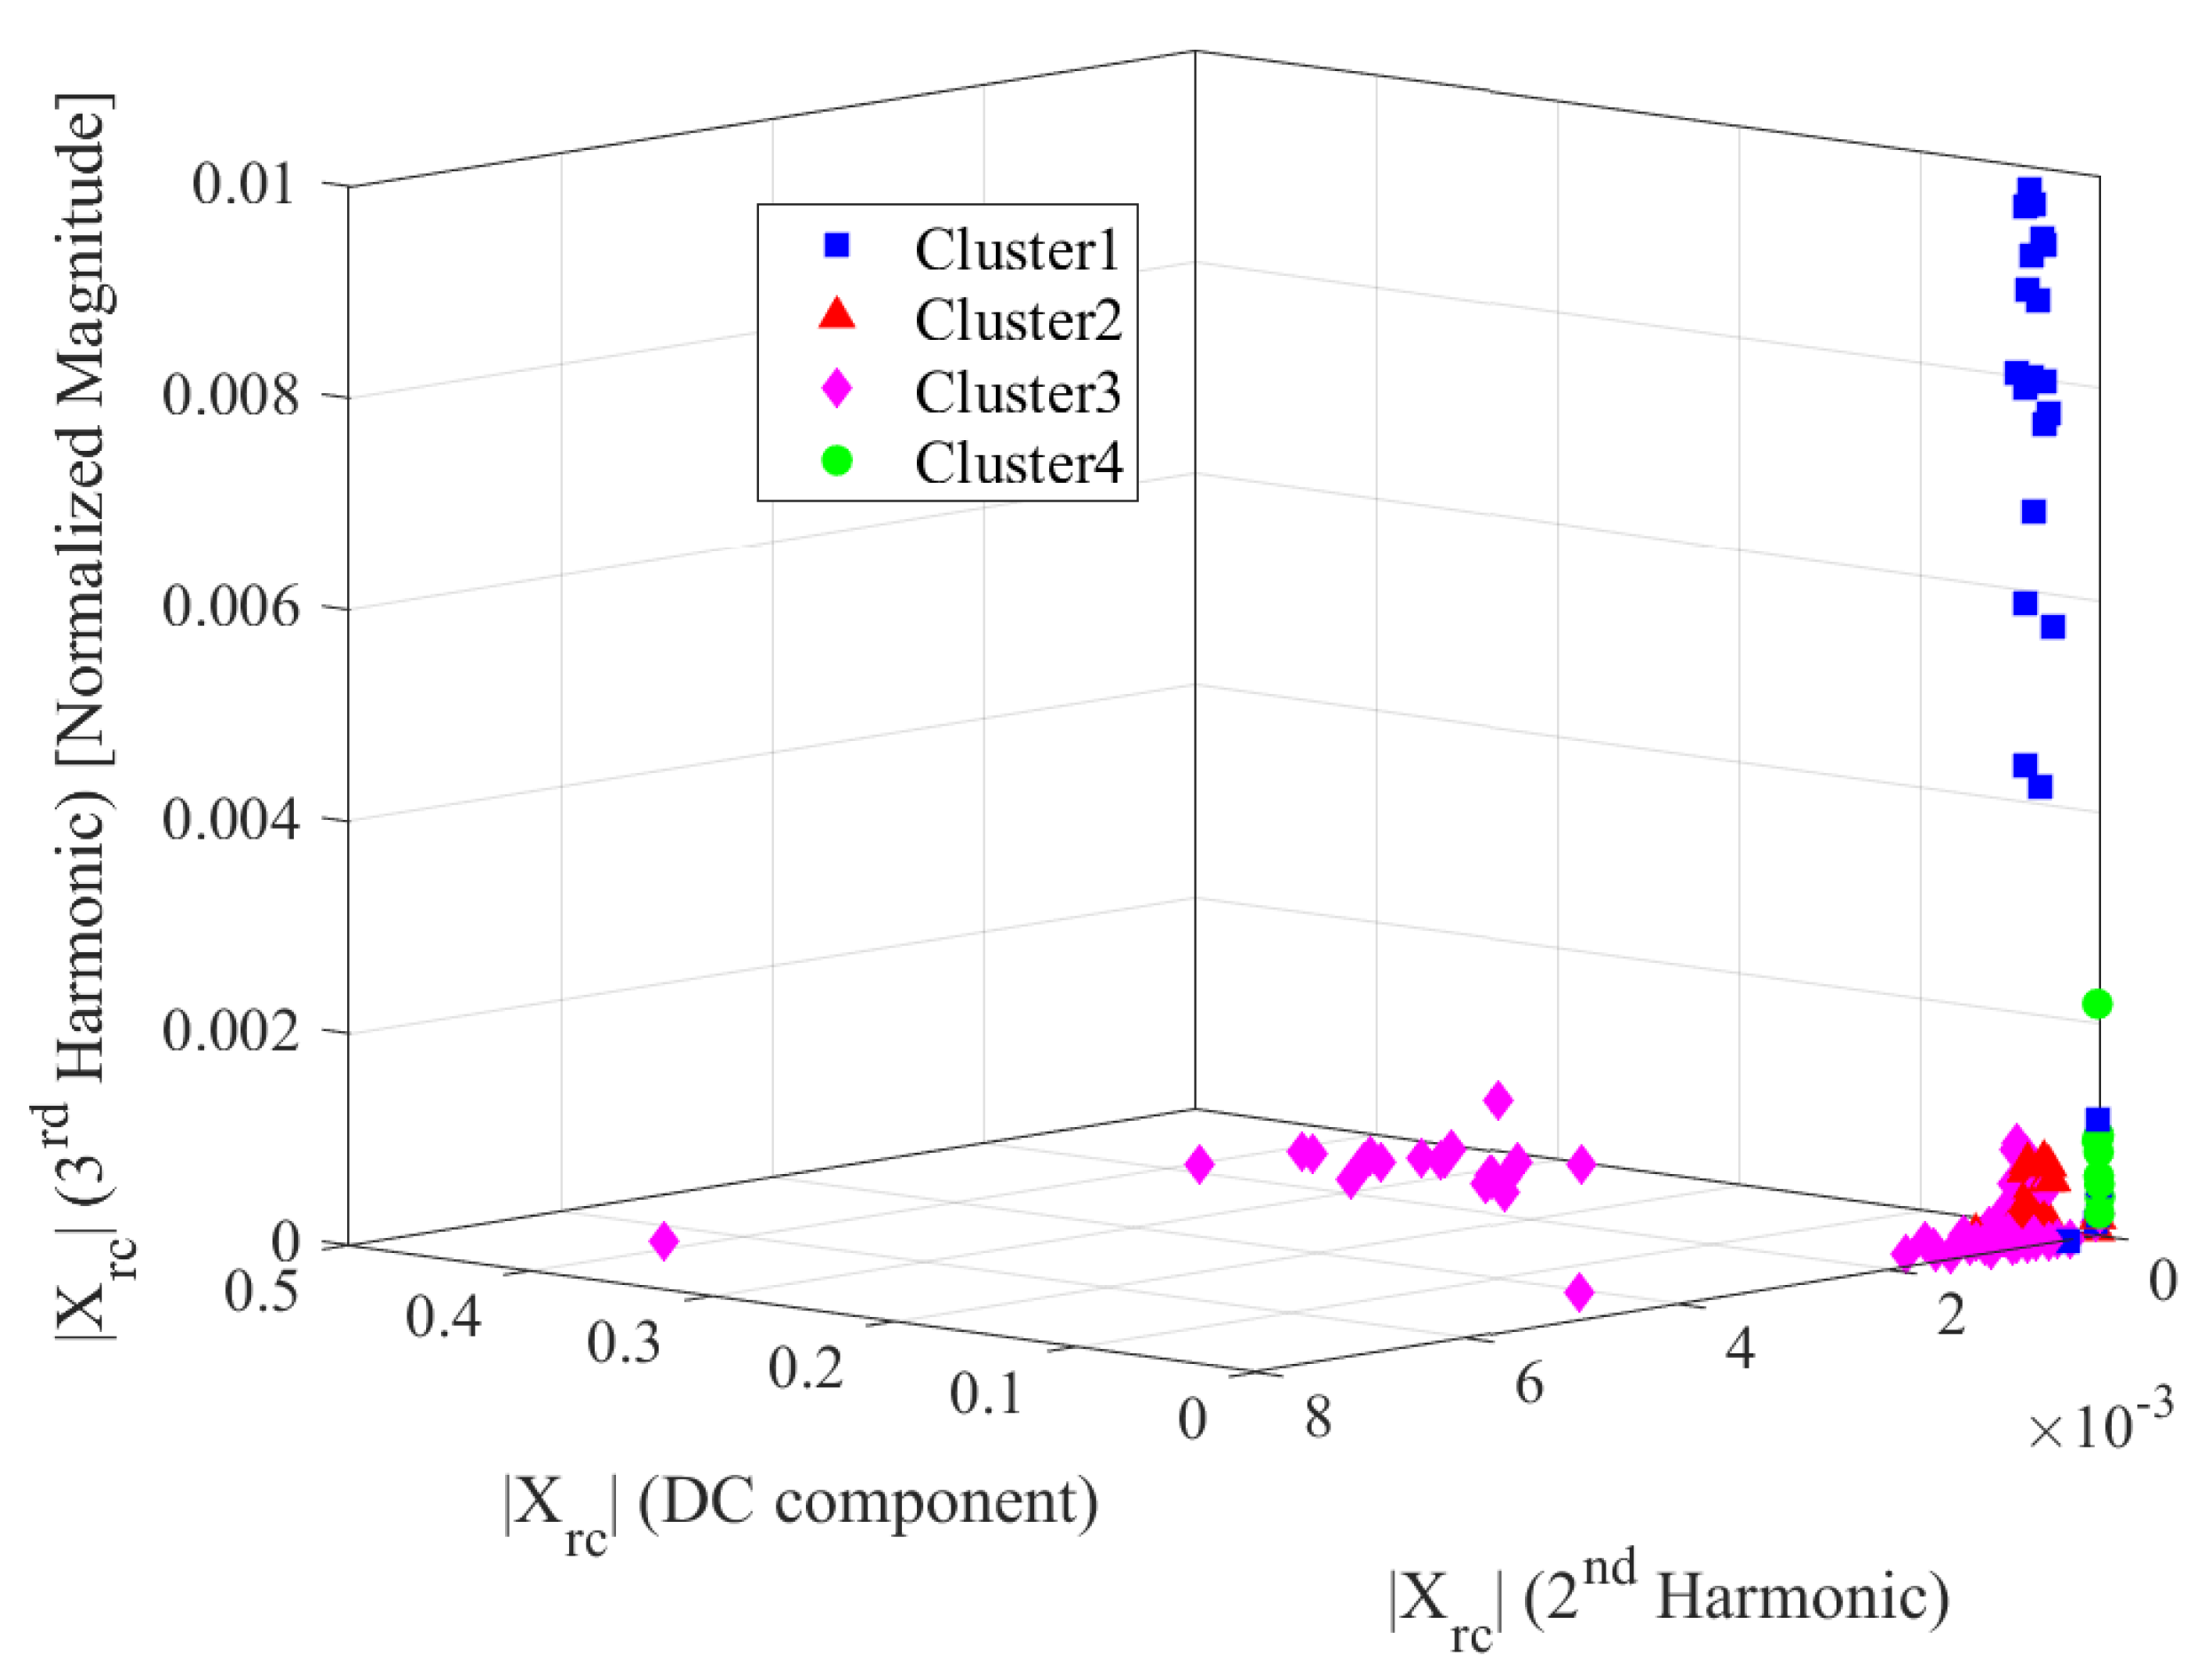
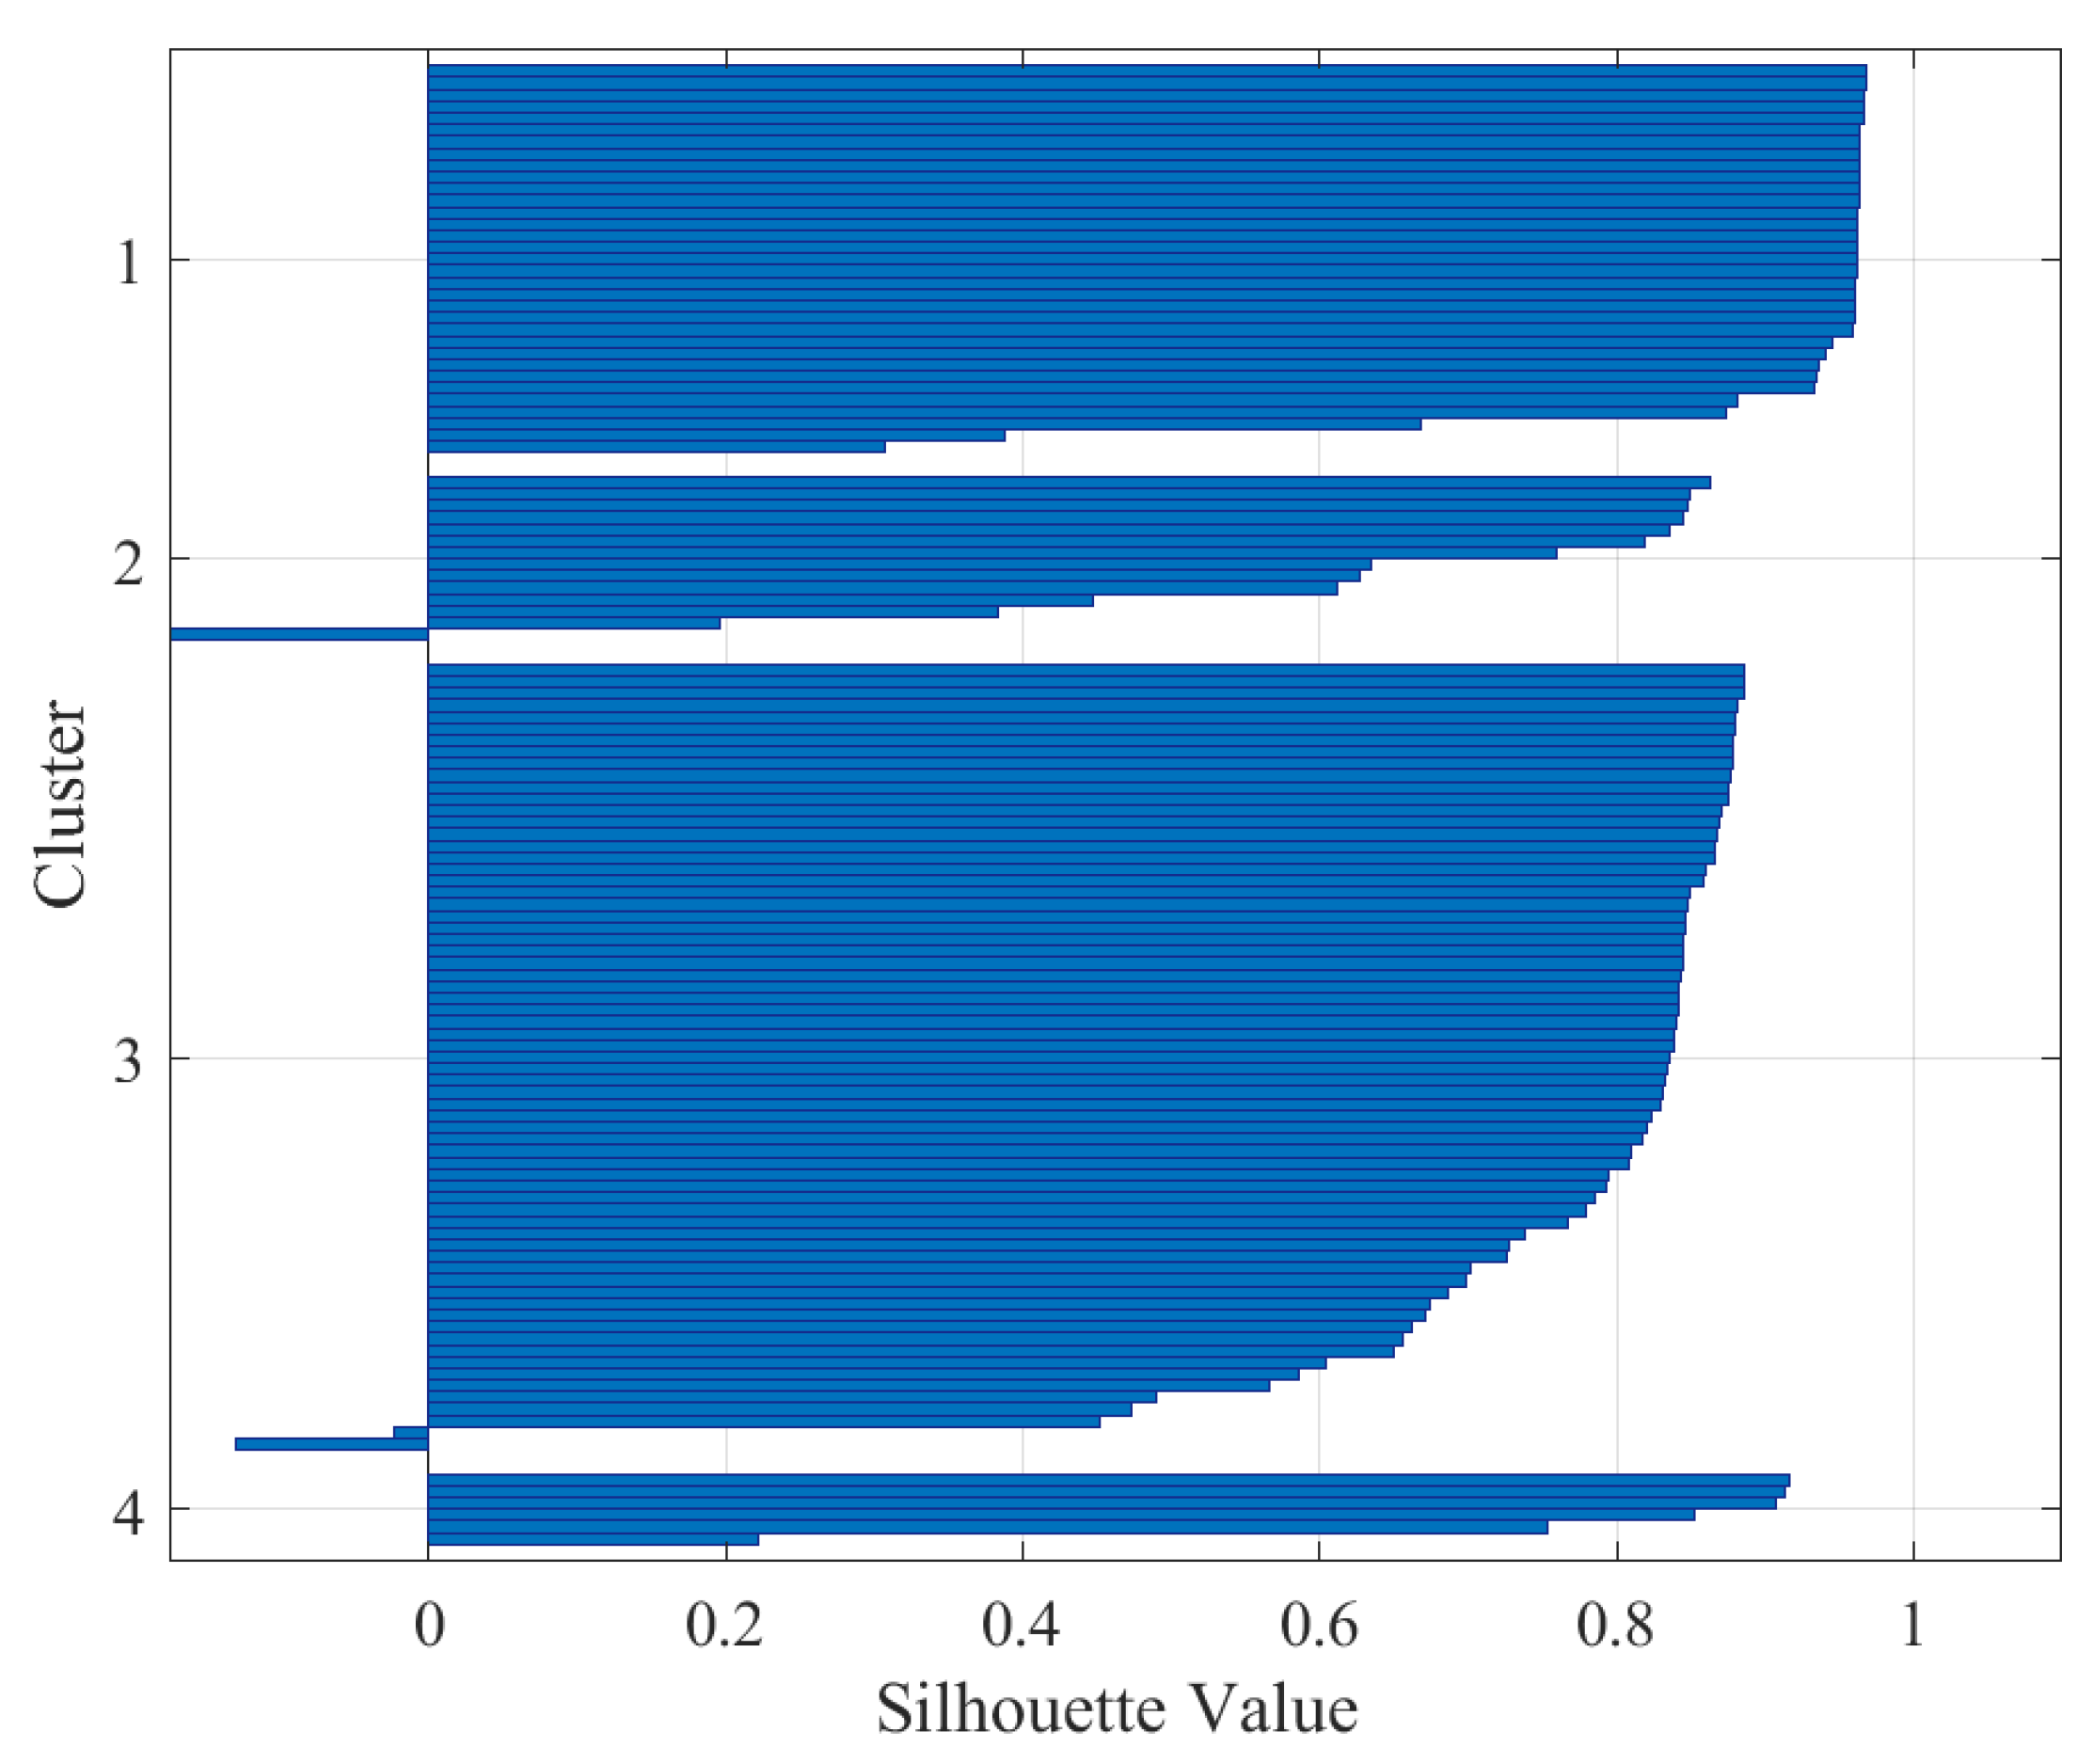
| Rotor current | 4 | 0.79 | Excellent split |
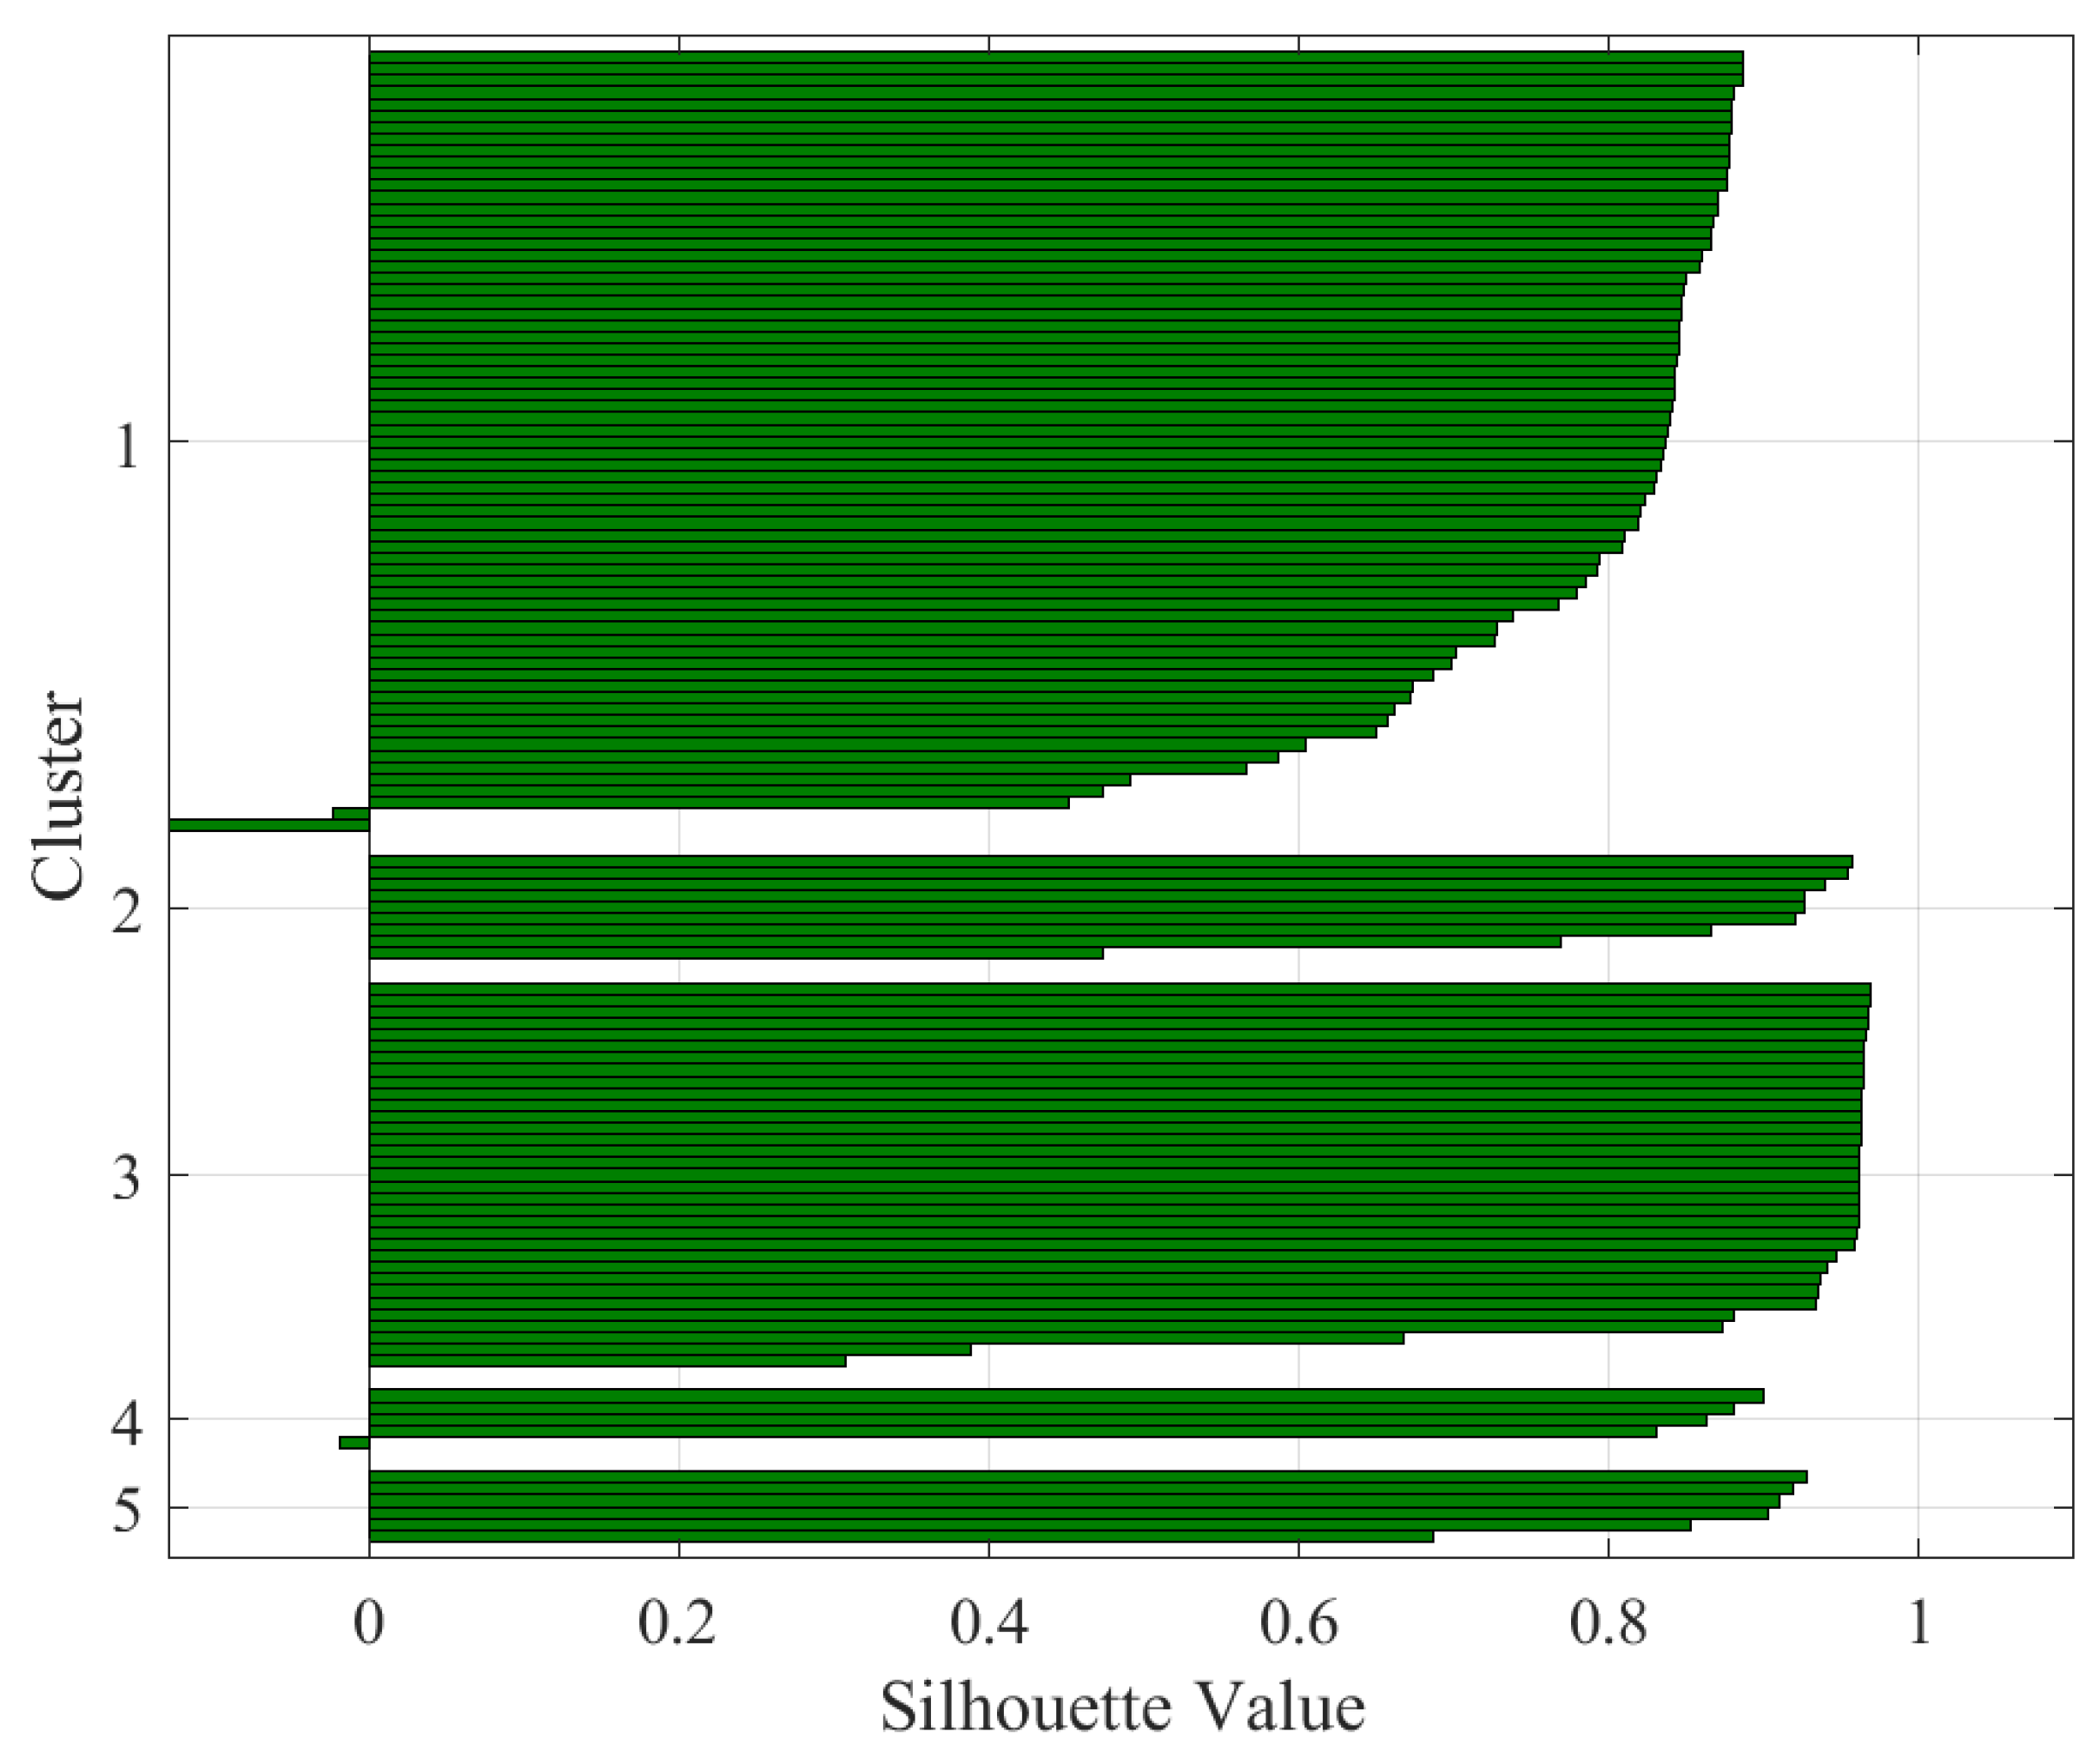
| Rotor current | 5 | 0.81 | Excellent split |
| Combined data | 4 | 0.84 | Excellent split |
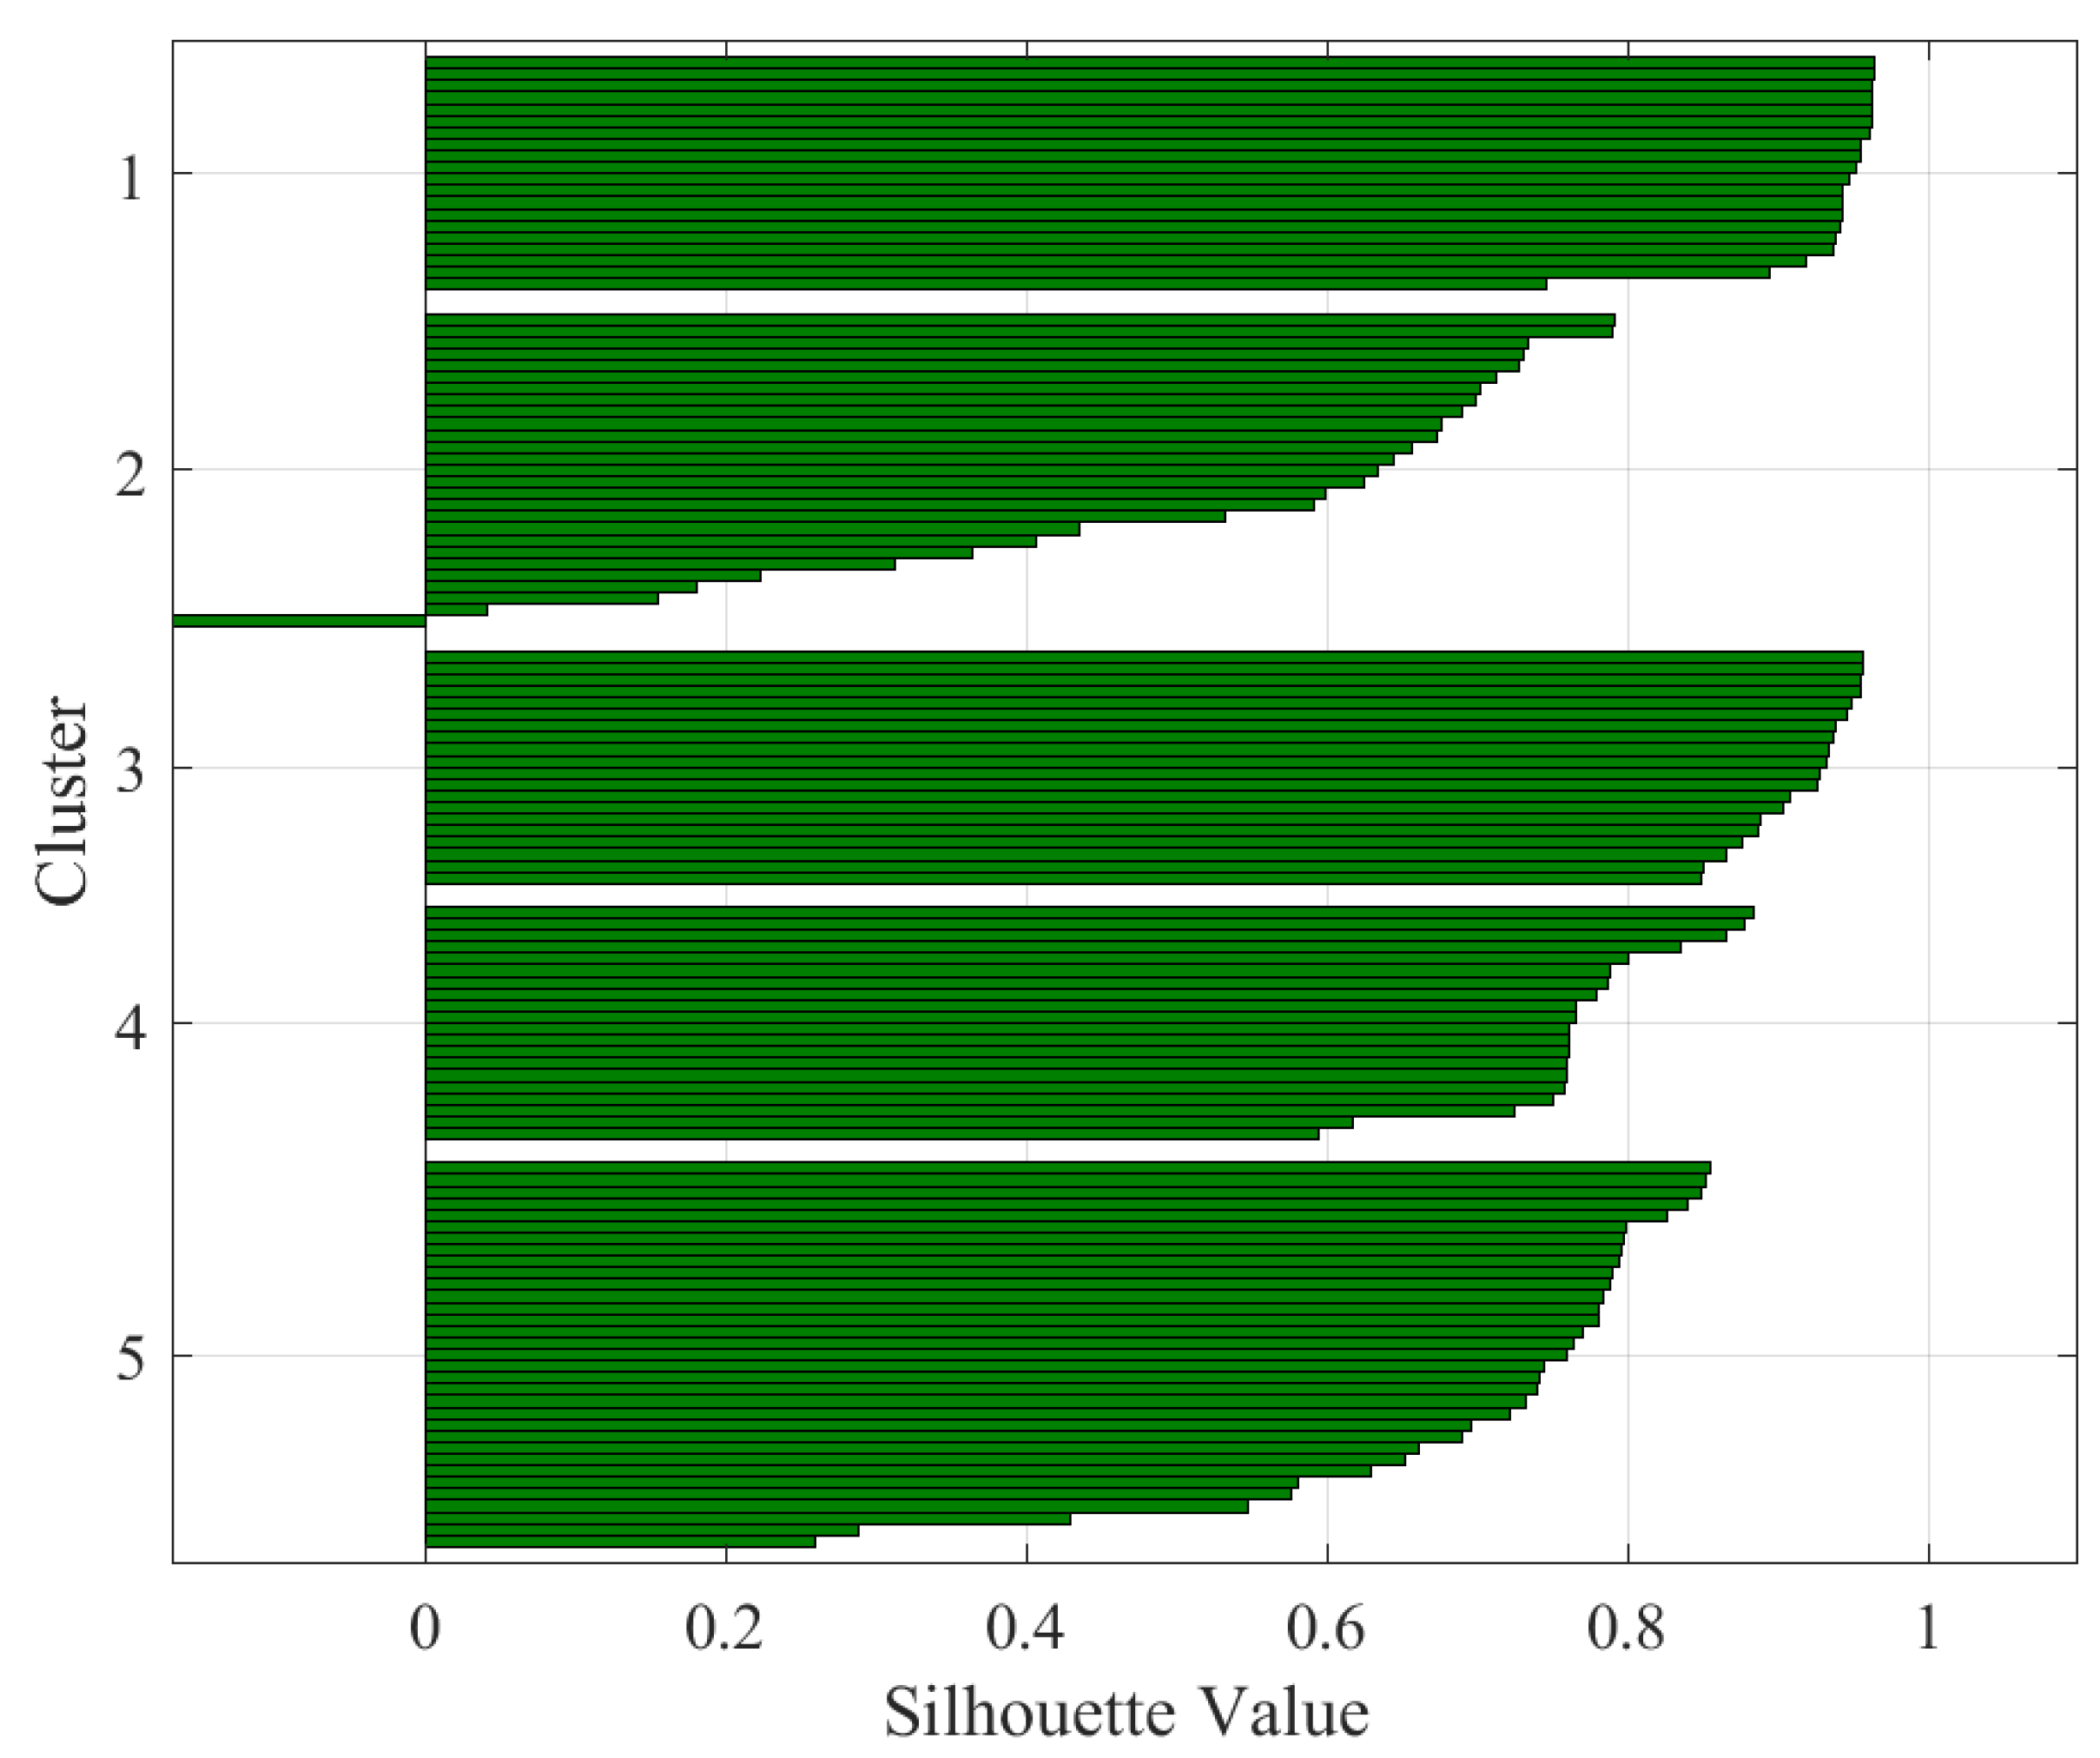
| Combined data | 5 | 0.89 | Excellent split |
Publisher’s Note: MDPI stays neutral with regard to jurisdictional claims in published maps and institutional affiliations. |
© 2020 by the authors. Licensee MDPI, Basel, Switzerland. This article is an open access article distributed under the terms and conditions of the Creative Commons Attribution (CC BY) license (http://creativecommons.org/licenses/by/4.0/).
Share and Cite
Swana, E.; Doorsamy, W. An Unsupervised Learning Approach to Condition Assessment on a Wound-Rotor Induction Generator. Energies 2021, 14, 602. https://doi.org/10.3390/en14030602
Swana E, Doorsamy W. An Unsupervised Learning Approach to Condition Assessment on a Wound-Rotor Induction Generator. Energies. 2021; 14(3):602. https://doi.org/10.3390/en14030602
Chicago/Turabian StyleSwana, Elsie, and Wesley Doorsamy. 2021. "An Unsupervised Learning Approach to Condition Assessment on a Wound-Rotor Induction Generator" Energies 14, no. 3: 602. https://doi.org/10.3390/en14030602
APA StyleSwana, E., & Doorsamy, W. (2021). An Unsupervised Learning Approach to Condition Assessment on a Wound-Rotor Induction Generator. Energies, 14(3), 602. https://doi.org/10.3390/en14030602