Article

MARTINE—A Platform for Real-Time Energy Management in Smart Grids

1
Polytechnic of Porto, Rua DR. Antonio Bernardino de Almeida, 431, 4200-072 Porto, Portugal
2
GECAD—Research Group on Intelligent Engineering and Computing for Advanced Innovation and Development, Rua DR. Antonio Bernardino de Almeida, 431, 4200-072 Porto, Portugal
*
Author to whom correspondence should be addressed.
Energies 2021, 14(7), 1820; https://doi.org/10.3390/en14071820
Submission received: 30 January 2021 / Revised: 16 March 2021 / Accepted: 22 March 2021 / Published: 25 March 2021
(This article belongs to the Special Issue Power Quality of Renewable Energy Source Systems)

Abstract

:
This paper presents MARTINE (Multi-Agent based Real-Time INfrastruture for Energy), a simulation, emulation and energy management platform for the study of problems related to buildings and smart grids. Relevant advances related to buildings and smart grid management and operation have been proposed, focusing either on software models for decision support or on physical infrastructure and control approaches. These two perspectives are, however, complementary, and no practical assessment can be achieved without a suitable interaction and analysis of the impact that decision-making models have on physical resources, and vice-versa. MARTINE overcomes this limitation by integrating, in a single platform: real buildings with the associated devices and resources; emulated components that complement the ones present in the buildings; simulated resources, players and buildings using multi-agent systems, real-time simulation with hardware in the loop capabilities, which enables integrating virtual and physical components; and a knowledge layer that incorporates all the required decision support and energy management models. MARTINE thus provides a comprehensive platform for the study and management of energy resources. The advantages of this platform are demonstrated in this paper through three use cases, related to agriculture irrigation, practical implementation of demand response and load modeling using various network configurations.

1. Introduction

The environmental issues around energy consumption and generation, namely from fossil fuels, are raising attention to greenhouse gas emissions, when looking for supplying all the demand needs [1]. In fact, electricity production has been largely based on fossil fuels [2]. Renewables-based energy resources have been contributing to the reduction of emissions of greenhouse gas [3]. Also, in the current and future world environment and social situation, the relationship between food, energy and water is very strong as phenomena occurring in one sector are closely related to others and affect them. It is then very important address the optimization of water and energy consumption in food production (agriculture) and industry [4]. In the present paper, one of the case studies addresses energy management in agriculture in a small scale.
Smart grids provide a large set of innovative approaches and options towards the efficient and automated operation of the network, increasing the integration of renewables and demand response, namely supported by transactive energy [5,6,7]. Virtual power aggregators have also been considered with several variants, towards the integration of renewables and demand response (DR) [8,9]. DR is in fact a major topic that makes possible the participation of the consumers in the flexible operation of the network, bringing benefits both for the network operator and for the consumers [10,11].
DR has been defined in several ways; the most accepted one is made by Federal Energy Regulatory Commission (FERC) [12] as: “Changes in electric use by demand-side resources from their normal consumption patterns in response to changes in the price of electricity, or to incentive payments designed to induce lower electricity use at times of high wholesale market prices or when system reliability is jeopardized.” In both the technical and the economic perspectives of DR programs implementation, namely by aggregators in the context of smart grids, adequate tools are needed. An aggregator can be seen as an entity that makes the bridge between large operators and small resources or consumers [13,14]. In fact, the aggregator can be associated with all small and medium scales DR participants, providing them as a single resource in the electricity market [15].
Operationalizing DR in an effective manner relies, however, on guaranteeing a suitable communication infrastructure to support the interactions between players (aggregator, consumers, among others). The emergence and widespread adoption of the Internet of Things (IoT) concept has brought promising solutions in this domain, with proven applications in an operational context [16]. In fact, industry-driven approaches are relying more and more on IoT solutions, benefiting from the rise of Industry 4.0 [17]. The significant advances achieved during the last few years, leading to scalable and permanent communication infrastructure, are giving birth to new and more ambitious paradigms, such as the Energy Internet (EI) [18]. However, in a domain in which not only is the communication infrastructure essential, but also its security and reliability, solutions relying on Distributed Ledger Technology (DLT), based on the blockchain concept, are arising as a promising way to go to enable smart contracts between the involved players [19]. Blockchain technology helps the involved players as more and more attention is paid in the energy industry to researching more diffuse models, including peer-to-peer trading, microgrids, and local demand response. DLT can play a key role as a driver of interactions without the need to involve a central authority. Such solutions are enabling an increase in the quality of the communication infrastructure, which brings several benefits besides supporting players interactions.
One of these advantages is the increased access to data from different sources, which enables the wide-scale application of artificial intelligence methods, such as machine learning approaches; see for example, [19], which presents a critical survey on the application of machine learning techniques in power systems. Another interesting work in this domain is presented in [20], comparing the performance of traditional machine learning approaches with deep learning methods in the specific problem of energy consumption forecasting. Other related works in the literature include [21] where an aggregator uses real hardware resources to emulate the consumption and generation. A real-time simulation model for a curtailment service provider is presented in [22]. Both lack the modeling of DR single components activation and simulation. In [23], DR assessment is based on the smart meter. Incentives are provided for near real-time participation in DR events. A numerical is presented, lacking experimental test and validation. The electricity market perspective concerning DR programs is innovated in [24], bringing DR to different market opportunities, in a realistic data case study. The financial benefits of a retailer is explored in [25], with a short-term DR trading methodology for participation in both real-time market and short-term DR. Short-term self-scheduling of an aggregator is also proposed in [26], focusing on the uncertainties of the electricity customers participation in the market. The use of multi-agent systems (MAS), in the context of smart grids, allows the distributed management of systems considering multiple entities while providing individual representation agents for entities [27]. Although the definition of an agent abilities was described by Wooldrige [28], what an agent should represent in smart grids is not consensual, with multiple authors proposing different agent types [29,30,31]. MAS can also be used for simulation proposes, as seen in [32] where a MAS is proposed for the real-time simulation of a microgrid controller with a Simulink connection to simulate wind turbines and storage units. In [33], a similar approach was used, but focused on the simulation of off-grid energy systems based on solar generation. MAS are also able to operate under uncertainty, as seen in [34] where an event-triggered MAS is proposed for cooperative control. The present paper focuses on an infrastructure for real-time simulation of smart grids, following previous work of the authors, namely [35,36]. The major contribution of the present paper, namely comparing with [37], relies on the development and implementation of a real-time microgrid simulation platform using a diversity of real and laboratorial hardware components. The platform supports real-time simulation skills and hardware in the loop (HIL) means to address the validation of DR programs and smart grid business models, supported by multi-agents. While most of the platforms in the literature have a defined set of equipment and protocols implemented according to the state of the art at the publication time, the platform implemented by the authors of the present paper seeks the accommodation of several protocols and equipment in a flexible way. Additional contributions of this paper include:
  • three realistic case studies to validate the use of the platform;
  • scheduling of the energy resources available in each scenario;
  • laboratory emulation of the developed models;
  • evaluating the activity of an aggregator during DR implementation, namely the ramp period, regarding scheduling and remuneration;
  • improvement of aggregator resources management in short and real-time DR;
  • development of real-time simulation models using a set of laboratory equipment;
  • use of multi-agents to support the simulations, namely the players modeling and resource models integration.
After this introduction, the proposed method is explained in Section 2 describing each stage. Proceeding to Section 3, the results of using the method are presented. The discussion is presented in Section 4, and the main conclusions are presented in Section 5.

2. Materials and Methods

This section presents MARTINE (Multi-Agent based Real-Time INfrastruture for Energy) [16], represented in Figure 1. It is part of the “Real-Time Energy Management And Simulation Infrastructure For Buildings And Smart Grids”, which aggregates several prototypes resulting from the research made in the GECAD research group.
MARTINE is the GECAD platform to support real-time energy management and simulation of buildings and smart grids, having the following most relevant features:
  • multi-agent based platform integrating several multi-agent systems;
  • agents representing energy resources can be of 3 types (real buildings, other installations and equipment, physically emulated components, or software agents) allowing mixing physical resources with simulated ones in real-time simulation;
  • includes a real-time data acquisition and historic data repository, storing measured real-time data, data obtained in measurement campaigns, and other data from multiple sources;
  • provides reality augmented by realistic simulation in real-time, enabled by GECAD algorithms in conjunction with hardware in the loop simulation;
  • enables integration of external applications and physical installation (buildings, houses, labs);
  • receives real-time data from remote partners, used in real-time management and simulation;
  • integrates most of the GECAD models for smart grids (for example, energy resource scheduling optimization, demand response, market simulation);
  • provides effectiveness/efficiency to intelligent management (according to the time constraints to provide the solution) by the use of reinforced learning.
MARTINE is organized in four main layers, as illustrated in Figure 1. The buildings layer is divided into 3 components, namely real, emulated, and simulated building.
The Multi-Agent System (MAS) layer, of Figure 1, is responsible for the representation of players, buildings, and infrastructures. All the players that are simulated or emulated have a dedicated agent for their representation inside the MARTINE environment. The MAS is developed in the JADE [38] framework and it is FIPA-ACL [39] compliant. The communication among MARTINE agents uses ontologies to enable the interoperability of the system [40]. The integration and synchronization of simulated buildings are done using the OPAL-RT Java library that allows the monitoring and control of the simulated building. Regarding the physical layer, the real buildings, as well as the emulated buildings, need to have a gateway that allows the remote monitor and control using high transmission rates. To simplify the integration of physical loads and resources, a configurable gateway was developed in [41], where the user can opt for IEEE 802.11, Dash7, or Zigbee. The MARTINE agents have connection drivers for TCP/IP, Dash7, and Zigbee, where the last two require specific hardware connected to the machine executing the agent. The referred protocols can have disadvantages in security, latency, and communication distance. However, the idea of the platform is to accommodate different options for being tested. Most of the performed simulations have been done with energy consumption data monitored each second and transmitted every 30 s. Security aspects are not a focus and will be improved in the future. The real building, shown in Figure 1, is integrated in MARTINE and has a prosumer representative agent in the MAS layer, but also has its own supervisory control and data acquisition (SCADA) system responsible for the real-time monitoring and control of the building and its loads and resources. This SCADA system stores the monitoring data and works as the building gateway. The SCADA system also uses semantic data that can be used in the agent’s communications [42].
In fact, a SCADA system is expensive, as the set of components, namely programmable logic controller (PLC) units, are expensive. However, these are largely used in industry as they are very reliable and robust. In MARTINE, the motivation is to integrate a large set of options regarding equipment for communication and control. For lower cost solutions, the gateways proposed in [41] can be used connected directly to any energy analyzer with MODBUS/RTU communication. Cloud-based solutions are much less expensive and can be acceptable namely for the residential sector and small business. However, for larger clients, due to privacy and security reasons, as well as for performance and quality requirements, a local system is usually required. The authors of the present paper have developed in [43] an embedded system using single board computers for real-time monitoring, control, and energy transactions. Additionally, a real-time resources optimization model is proposed and is deployed in a single-board computer [44].
The agents of MARTINE MAS are distributed among machines and can be executed in servers, desktop computers, and single-board computers. Despite being executed in the referred processing hardware, MARTINE has a web-based interface where agents can be monitored and controlled. This allows the deployment of agents near the infrastructures they represent. The only requirements, to execute MARTINE agents, are Java 8 and a stable TCP/IP connection. At the present moment, the MAS is executed in the same local network and without privacy and security concerns. However, to deploy the MAS outside the MARTINE simulation and emulation environment, the privacy issues and security issues must be addressed.
The MARTINE MAS can assume multiple organization types depending on the type of test that the user wants to perform. Some possibilities of MAS organizations in MARTINE are: hierarchies, coalitions, congregations, teams, federations, and markets. Nonetheless, the MAS also enables the use of compound organizations that allow the use of multiple organization types in the same ecosystem [45]. Internally, the agents of MARTINE are configured to be simultaneously, event-triggered and self-triggered allowing agents to be reactive and proactive. The event-trigging allows agents to react to internal events in the building they represent—for example, the re-optimization of loads considering the entering of a new person—and to external events that occur in the grid—for example, the launch of a new demand response event.
Currently, the MARTINE MAS has seven types of agents: consumer, producer, prosumer, grid operator, real-time simulation, microgrid operator, and market operator. The agent types of consumer, producer, and prosumer are similar and have connection drivers with simulation resources and real resources/infrastructures. The grid operator is responsible for monitoring and controlling the three-phase electrical lines that are available for emulation purposes. The real-time simulation allowed in MARTINE is done using the OPAL-RT that requires the execution of a simulation model. The real-time simulation agent is responsible for starting, communicating, and controlling the OPAL-RT. The microgrid operator is responsible for managing the microgrid and defining collective goals among the microgrid’s agents, that is, consumers, producers, and prosumers. Finally, the market operator allows MARTINE agents to have a market interaction where they can buy and sell energy. One of the key aspects of MARTINE is its ability to have emulated resources and provide real-time simulation, together with the MAS and real buildings. To do so, MARTINE integrates two models of OPAL-RT (OP5600 and OP4510). The real office building, equipment, and emulated resources are integrated in OPAL-RT, achieving a hardware in the loop environment controlled by the MAS. The simulation of resources is done using Simulink models. For the integration of emulated resources, the MODBUS/RTU protocol is used. Currently, as emulated resources, MARTINE has available one wind turbine generator of 1 kW, two photovoltaic panels of 1 kW each, one 3 kVA load, one 30 kW load, two induction motes of 1.5 kW, one 3 kW induction motor, three step loads of 16 kW each, and two step loads of 8 kW each.
To support the MAS, MARTINE has available several web services, located in a cloud system, that provide a diverse set of algorithms that agents can use. These algorithms can be used, for instance, for day-ahead forecasting, for real-time load optimization, for microgrid energy balance, for user profiling, and for the selection and execution of demand response events. The cloud solution uses Docker containers and is ready to support several programming languages such as RStudio and Python.
More details about the MARTINE components are given in Section 3.

3. Results

In this section, three different use cases are implemented and described in order to illustrate the distinct features of the MARTINE platform. It is organized in 3 sub-sections:
-
an agriculture irrigation management model is proposed to show the application of the MARTINE platform in the context of agriculture, in Section 3.1;
-
a practical model of the DR program is presented with a specific focus on the ramping of DR programs, in Section 3.2;
-
finally, in the last case, a practical strategy is shown for load modeling by using various network parameters and configurations, in Section 3.3.
Each sub-section presents the model, the inputs, and the results, in a succinct way as the available space is limited.

3.1. Energy Scheduling in an Agriculture Irrigation System

The model proposed in this section is related to an automatic and autonomous system for efficient use of energy in an agriculture system. In this model, several sensors are employed in order to monitor the ambient and soil parameters to estimate the best and optimal period for the irrigation of the crop. Also, the model contains various types of RERs, which are managed by several pre-defined decision rules to increase the efficiency of local energy resources and minimize the income energy from the power grid.

3.1.1. Implemented Solution

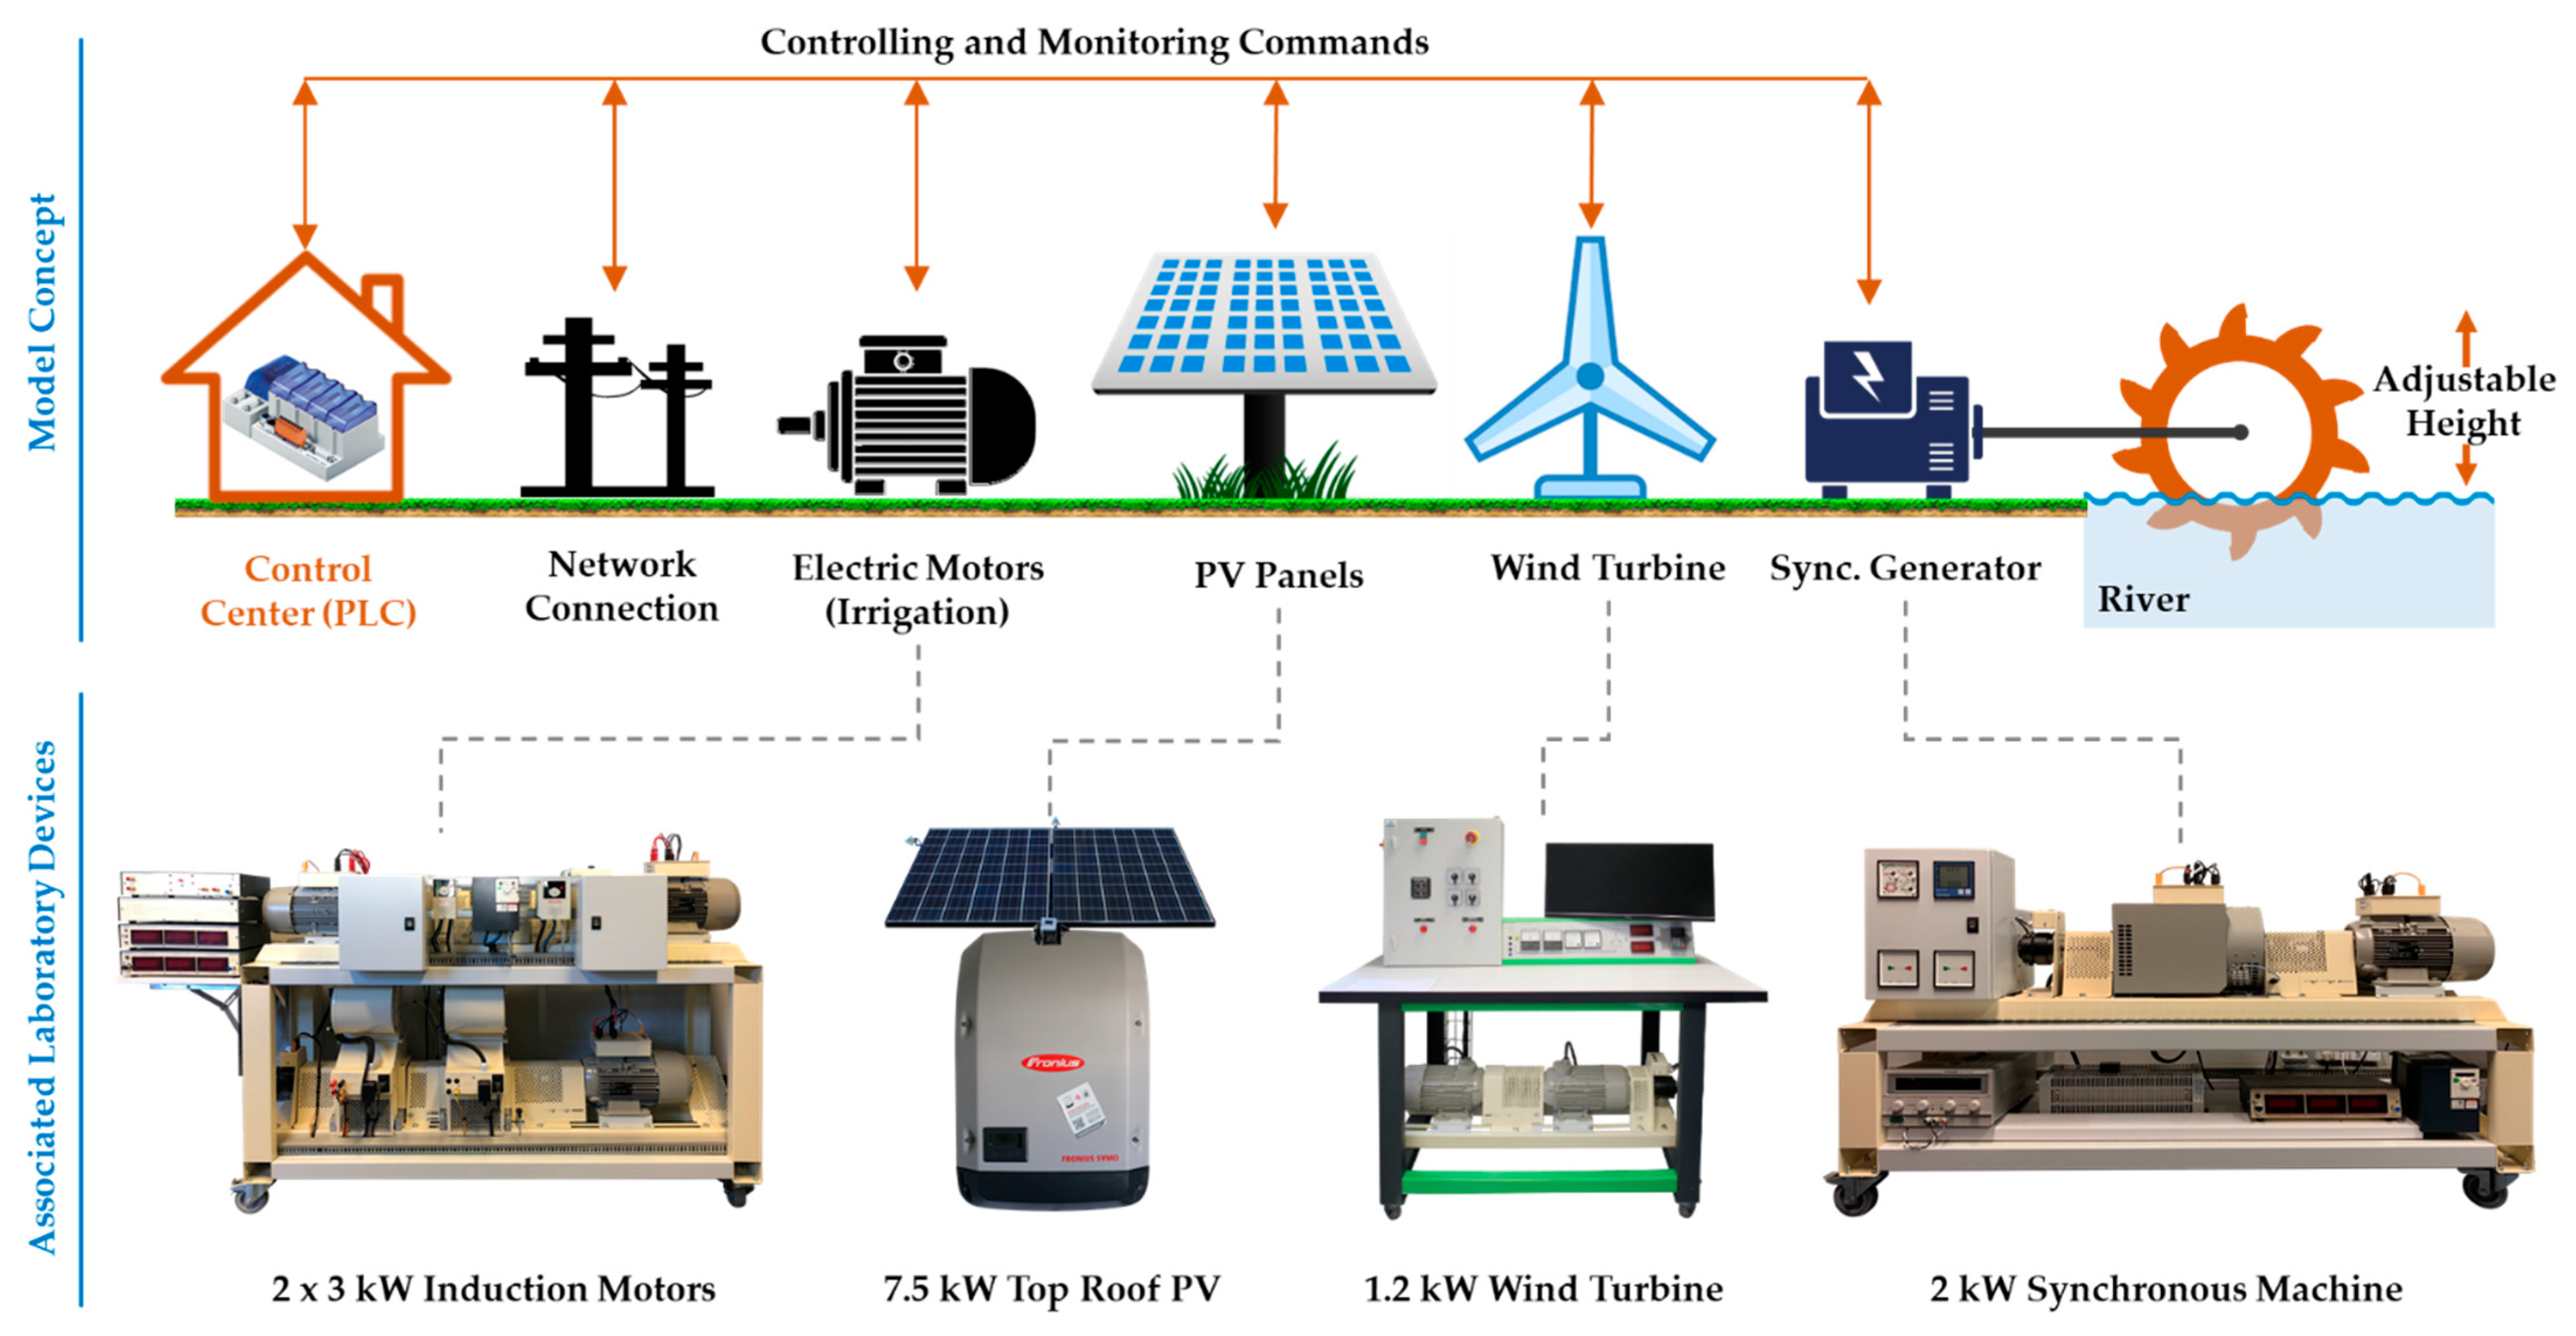
The proposed agriculture model contains various related equipment, such as irrigation motors, energy resources, and controller devices. As Figure 2 shows, there are three types of local energy resources considered in the agriculture irrigation system. These resources are photovoltaic (PV) panels, a wind turbine, and a synchronous generator. Furthermore, it is considered that the agriculture field is located near to a river, so the shaft of the synchronous generator is rotated by a wheel placed in the river. This system operates in a grid-connected mode, and therefore, the utility grid is considered as external and a supportive energy source to compensate for the lack of energy while the local resources are not able to supply the demand. However, the main goal of the system is to supply the consumption from the local resources as much as possible.
The principal controller of this system is a programmable logic controller (PLC), which is accountable to manage all the energy resources and transactions between the consumers and producers. For this purpose, the PLC is able to control and monitor the rate of energy consumption and generation through several implemented energy meters and local relays. Moreover, the PLC manages the plunging level of the river wheel to regulate the rotation speed of synchronous generator. It is very important to have such a flexible and reliable optimization for management of resources as the weather conditions have impact on the output of renewables-based energy resources, as they bring instability due to the unpredictability. One of the possible solutions to address this issue is the use of storage units in the consumer side [19].
To implement the proposed solution in a laboratory scale, several emulators have been used, as shown in the downside of Figure 2. All these emulators are controlled by a PLC by using various communication protocols, such as MODBUS TCP/IP, as well as Analog/Digital I/O channels.
To model the irrigation system, two induction motors are considered with nominal capacity of 3 kW. These motors are three-phases with an electric brake system applied to their shafts in order to have a variable rate of load. The generation side of the system includes a real installation of 7.5 kW rooftop PV arrays, a 1.2 kW wind turbine emulator, and a 2-kW synchronous machine for modeling the run-of-the-river turbine. All these resources are connected together through a local microgrid, and there is a switchboard in this microgrid to manage the connection and energy transaction with the utility grid.
In the context of decision making, the system always intends to supply the electricity demand from the local resources, that is, PV, wind turbine, and the synchronous generator. For this purpose, several pre-defined decision rules have been implemented in the PLC to perform optimal operation of the system with respect to the real-time information. Figure 3 shows a flowchart that presents the functionalities of these implemented rules in the PLC.
As Figure 3 illustrates, the process starts by checking the soil moisture level. If this level is below a desired rate, it means that irrigation is required, so irrigation motors should start operating according to the required irrigation capacity. Then, the system checks if the wind turbine and PV generation can respectively supply the demand, if not, the system adjusts the synchronous generator to produce the lack of energy. In a final case, if all PV, wind turbine, and synchronous generator are operating at full capacity and they are still not reaching the consumption level, the system supplies the rest of consumption from the utility grid.

3.1.2. Case Study

In this subsection, a case study is presented to validate the functionality of the system in a practical scenario. For this purpose, several actual data adapted from the real resources are employed to provide a better examination.
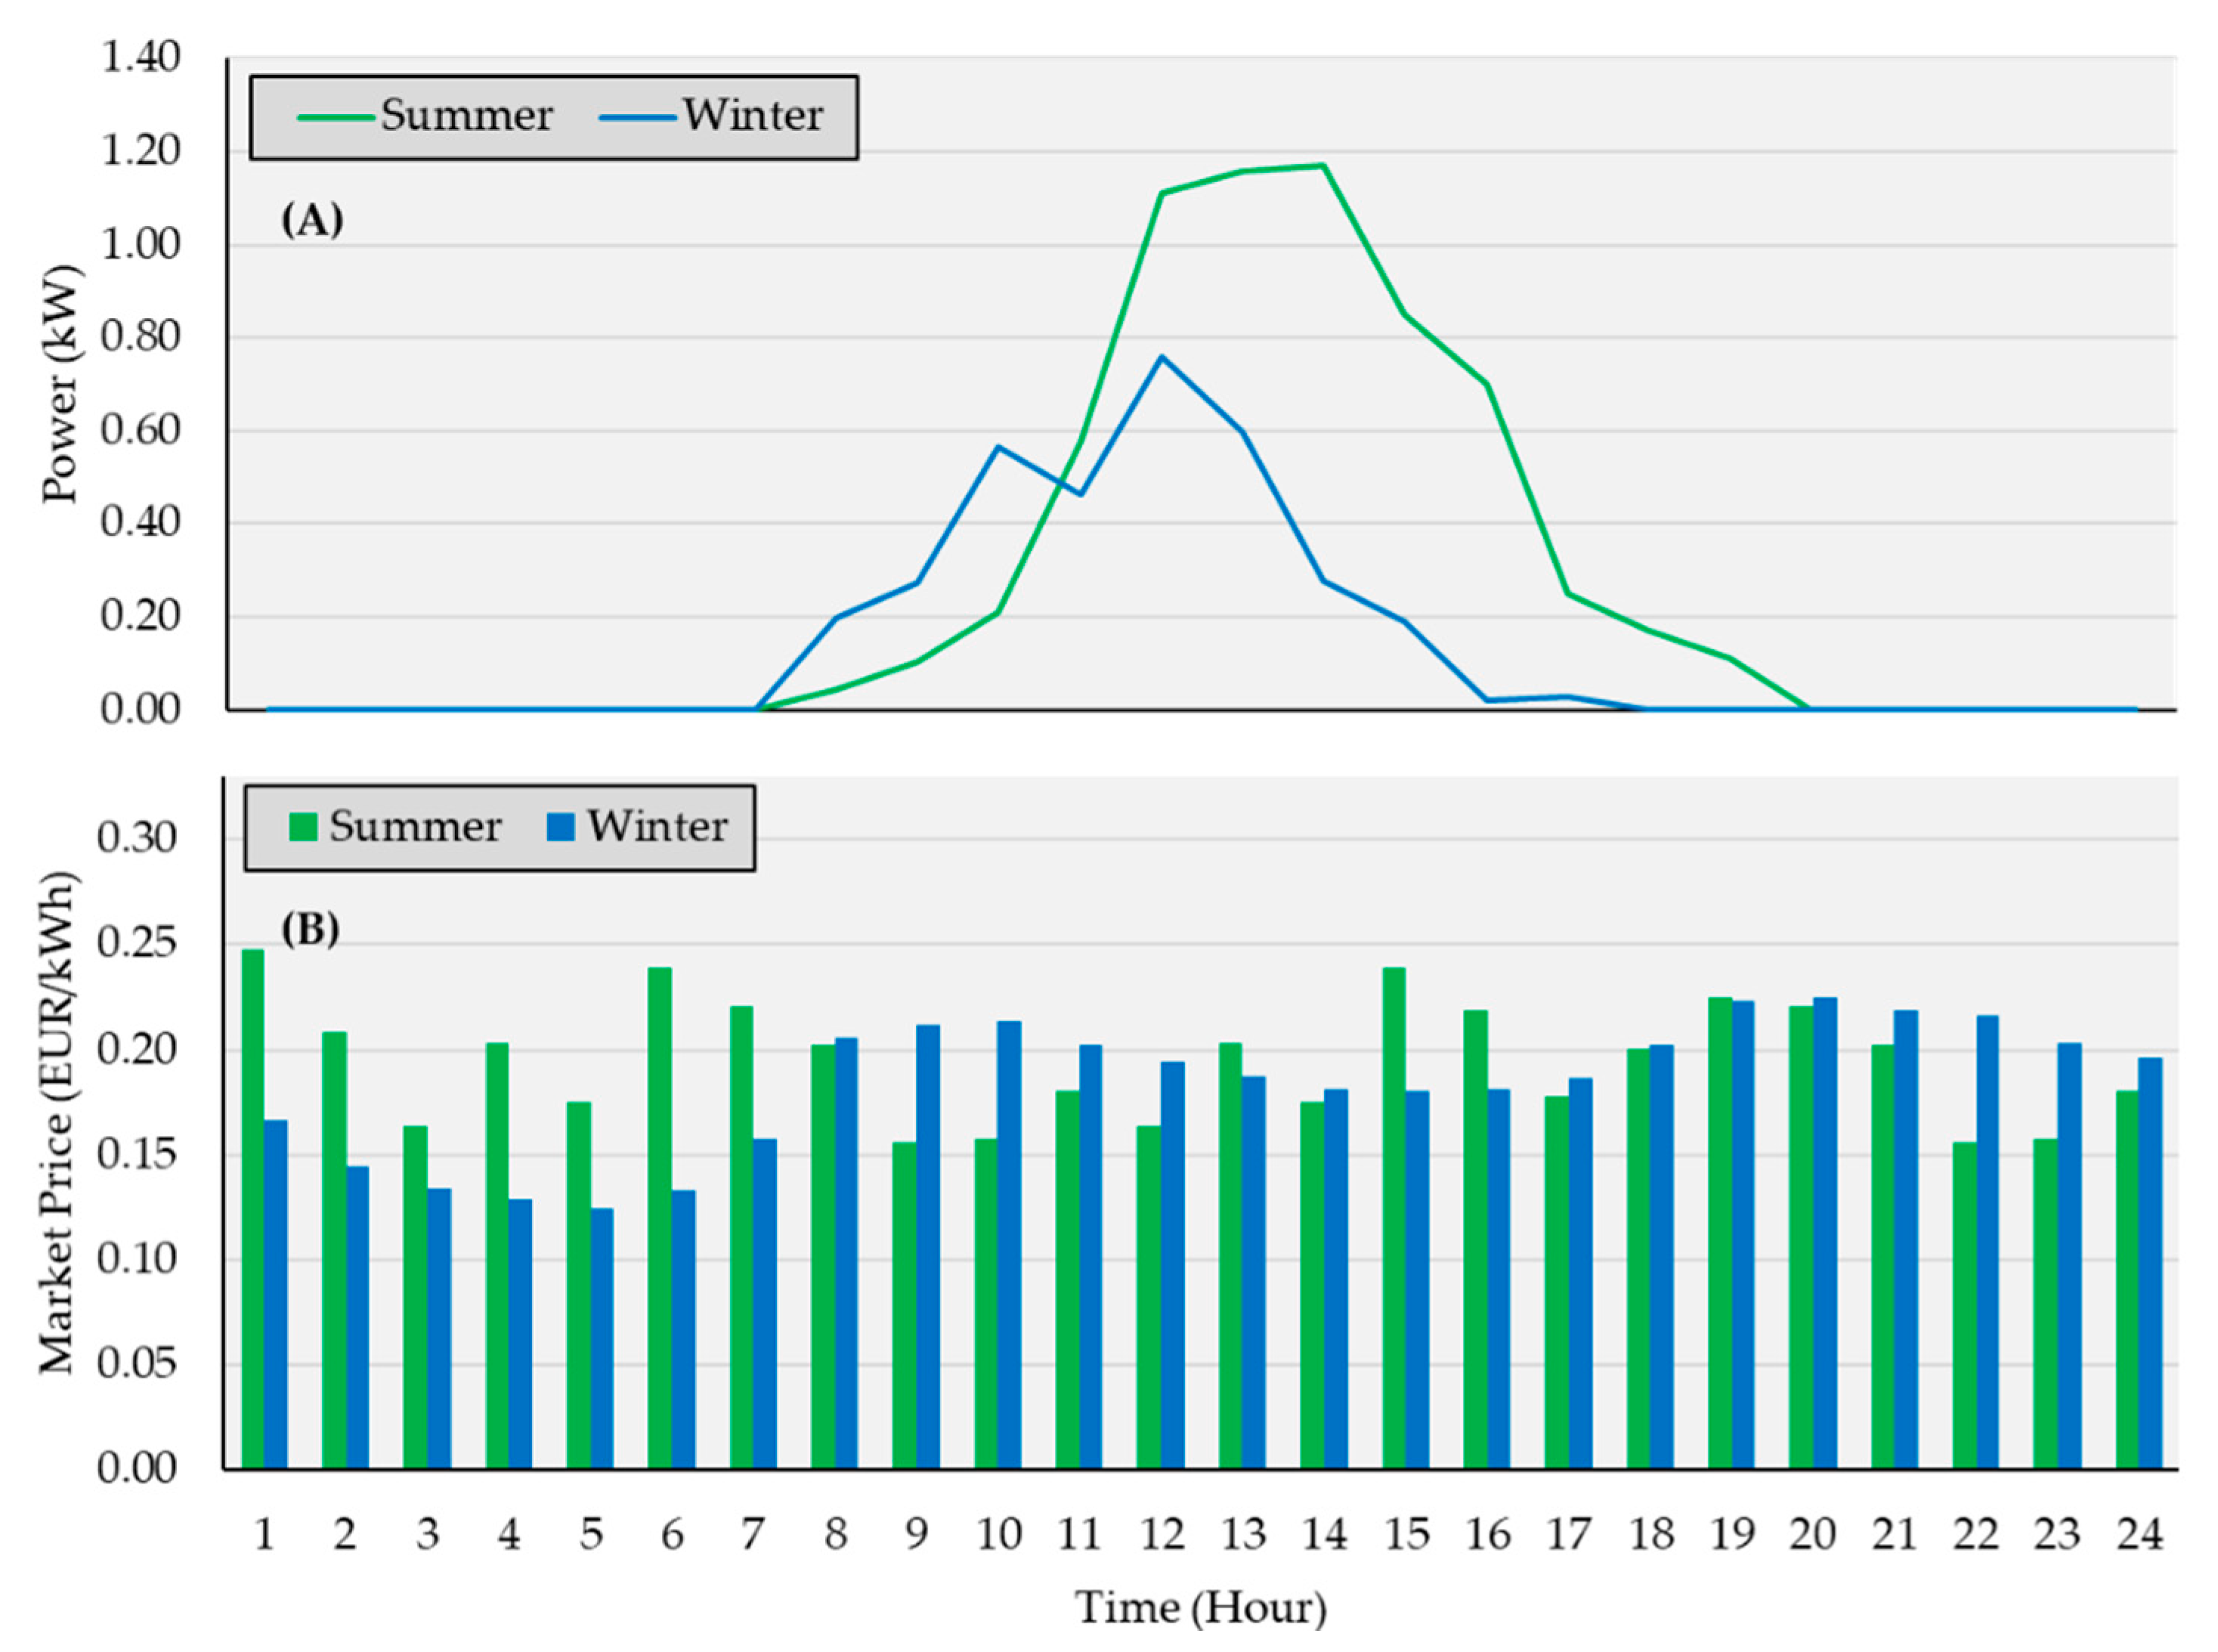
In this regard, Figure 4 demonstrates the input data considered for this case study. Figure 4A is related to two real PV profiles, one for summer and one for winter, which have been adapted from the database of the GECAD research center, in Porto, Portugal. Similarly, two electricity market prices (one for winter and one for summer) are shown in Figure 4B. The electricity prices have been adapted from the Iberian Electricity Market (www.omie.es (accessed on 24 March 2021)). All information shown on Figure 4 are considered as day-ahead information that are for an entire day with 24 periods of 1 h.
In fact, the system is always checking the requirements of the crops, such as soil moisture level, to estimate the best and optimal period for irrigation. However, as the focus of this paper is on energy side of the system, more information about how the model predicts the optimal irrigation period with respect to the field data, is available in the authors’ previous works [23].
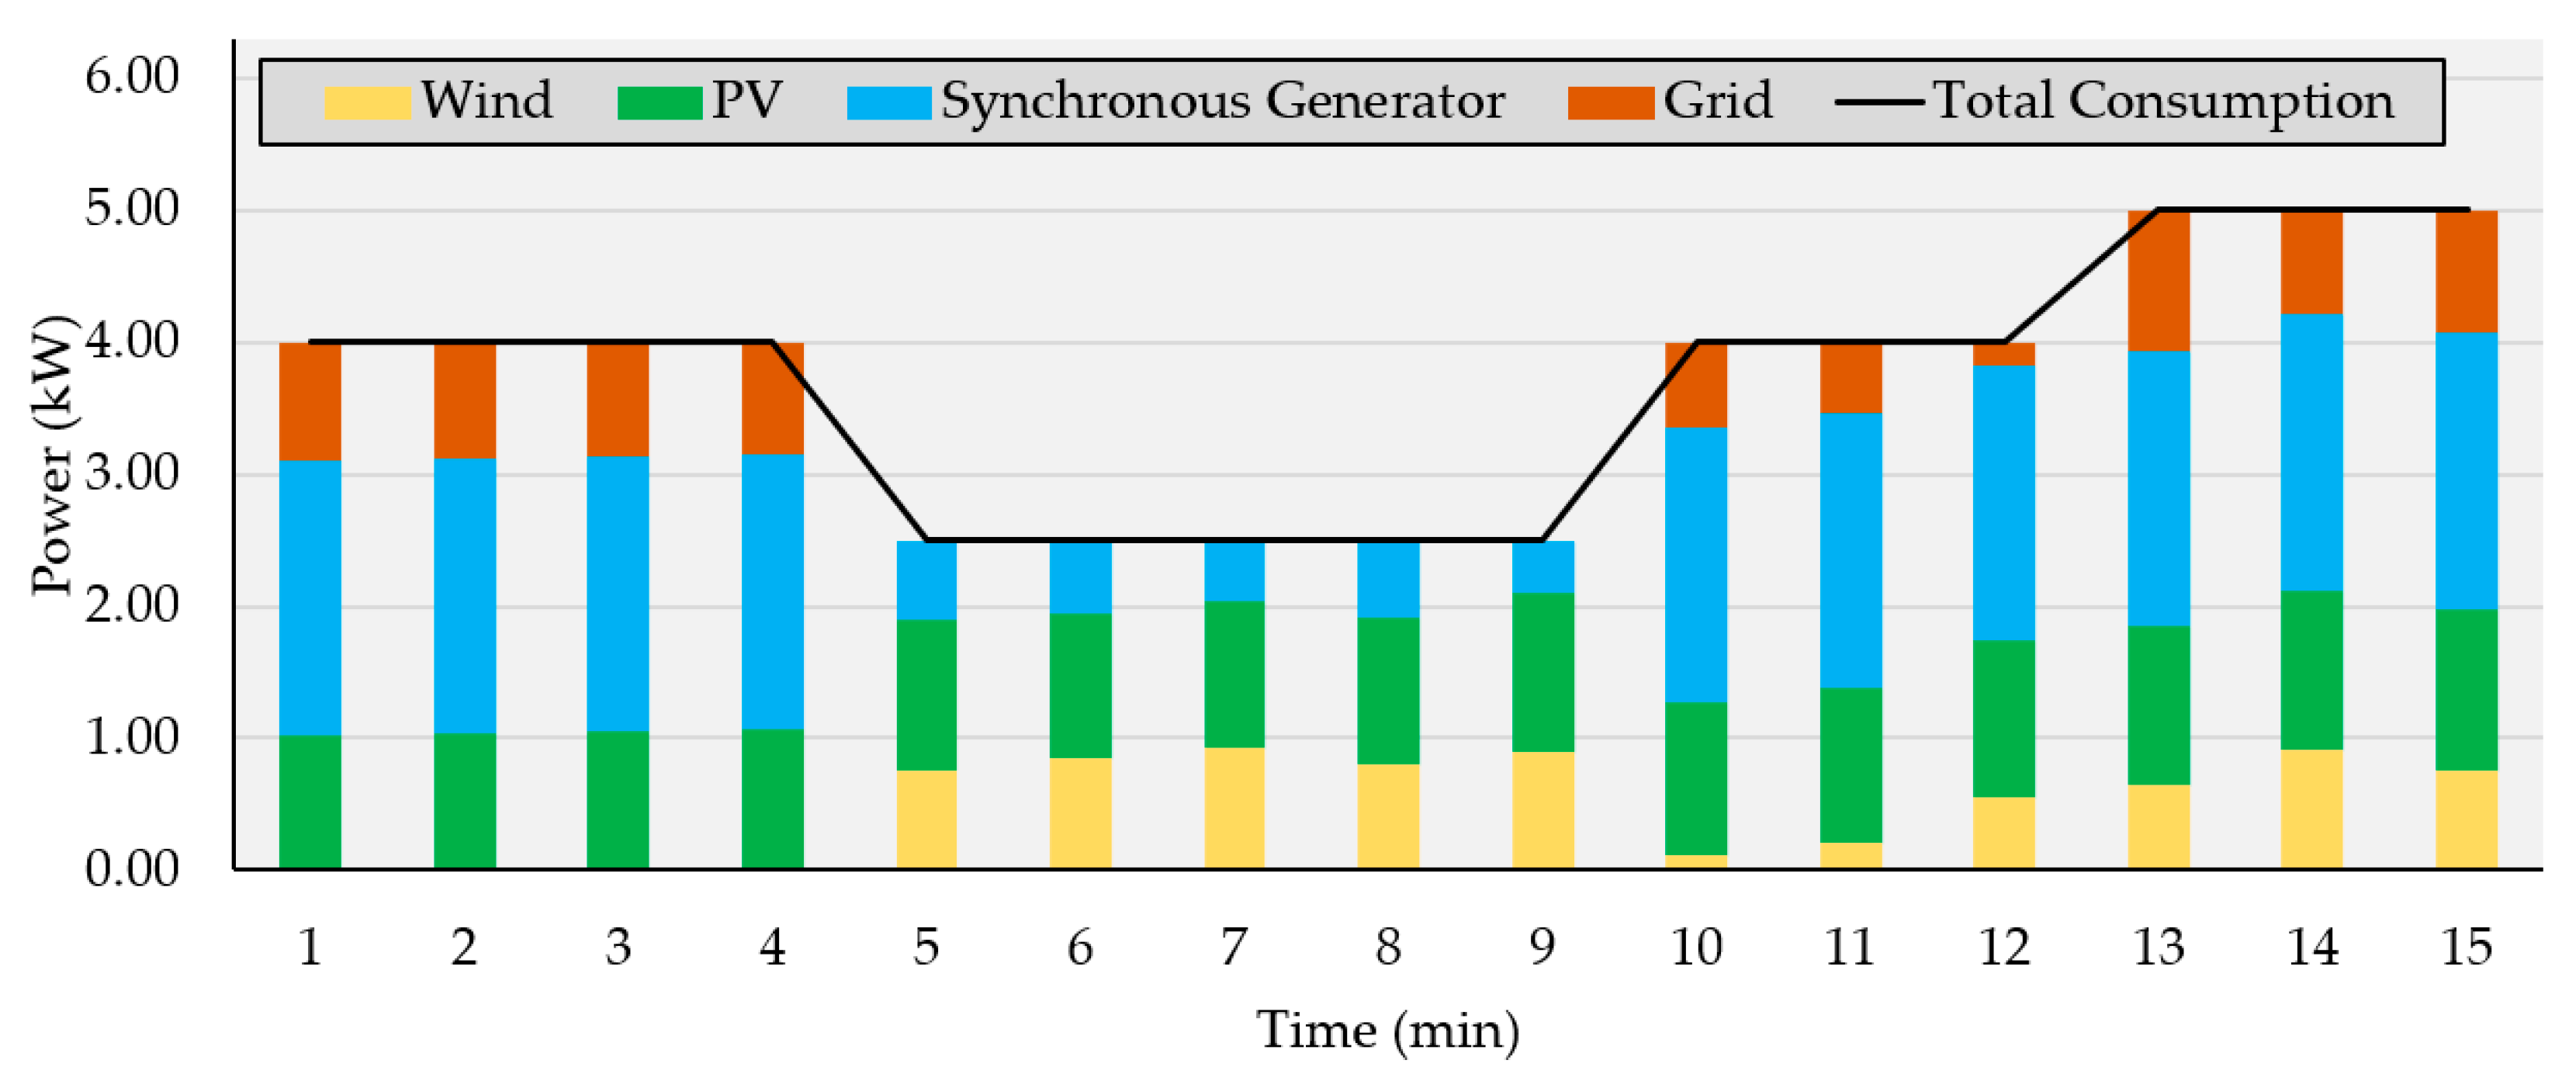
To perform the emulation tests, a period of 15 min has been selected from the input data and the energy scheduling algorithm shown in Figure 3 is run to adapt the energy scheduling results. Figure 5 illustrates the outcomes of the algorithm, which are a rate of energy production for each resource.
As Figure 5 shows, the wind turbine and PV are the first resources that the system uses, consuming all the available energy productions from those energy types in each period.
Then, if those generations are not sufficient, the synchronous generator is employed and the system adjusts a generation rate to be produced by this machine. It is clear that in some periods of the case study (for example, periods #5 to #9), the local resources were able to supply the demand, however, in other periods, the utility grid supplied the rest of the consumption. The information shown in Figure 5 is considered as a set point for each respective energy resource in the emulation tests.

3.1.3. Experimental Results

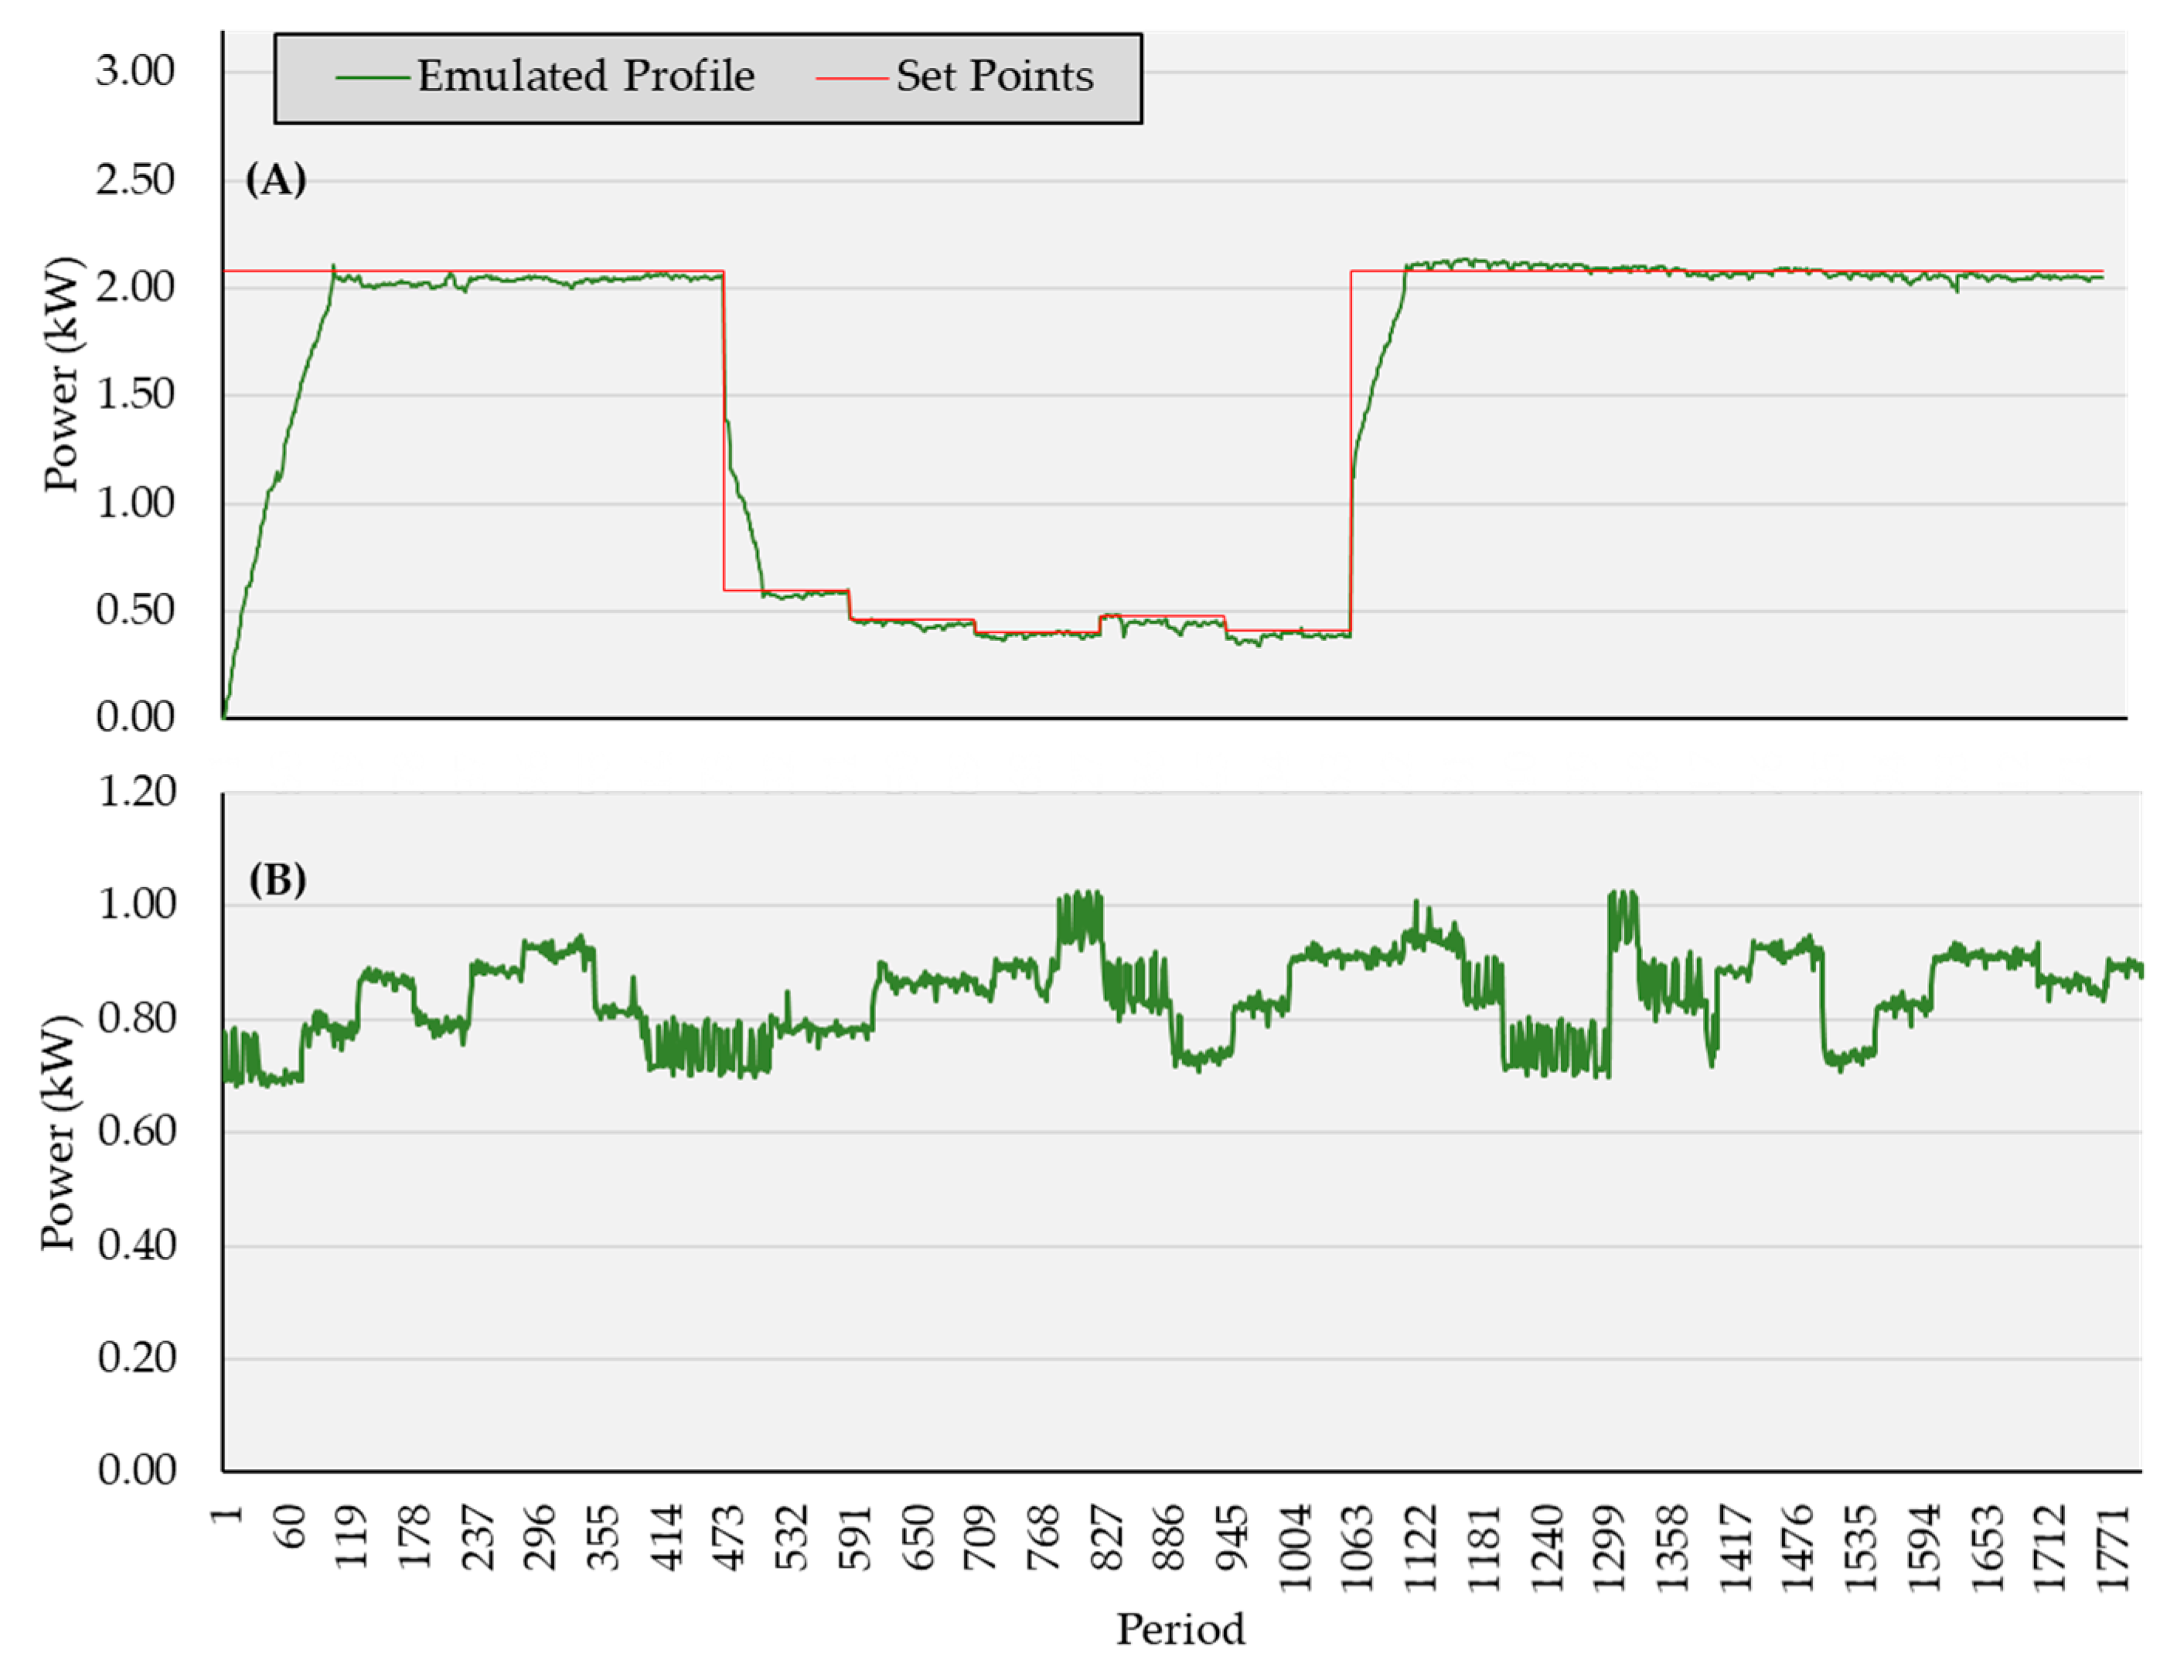
This part demonstrates and discusses the experimental results adapted from the laboratory emulators. The first group of results are shown in Figure 6, which include the results adapted from the synchronous generator (Figure 6A) and the wind turbine emulator (Figure 6B). In these results, each period presents 0.50 s (PLC time step) that in total provides 1800 periods for 15 min. In Figure 6A, the set point is the scheduled generation rate that PLC commands to the synchronous machine to be produced, and the emulated profile is the actual generation profile. The instabilities in the generation profile are due to the technical characteristics of the system, such as voltage and frequency variations.
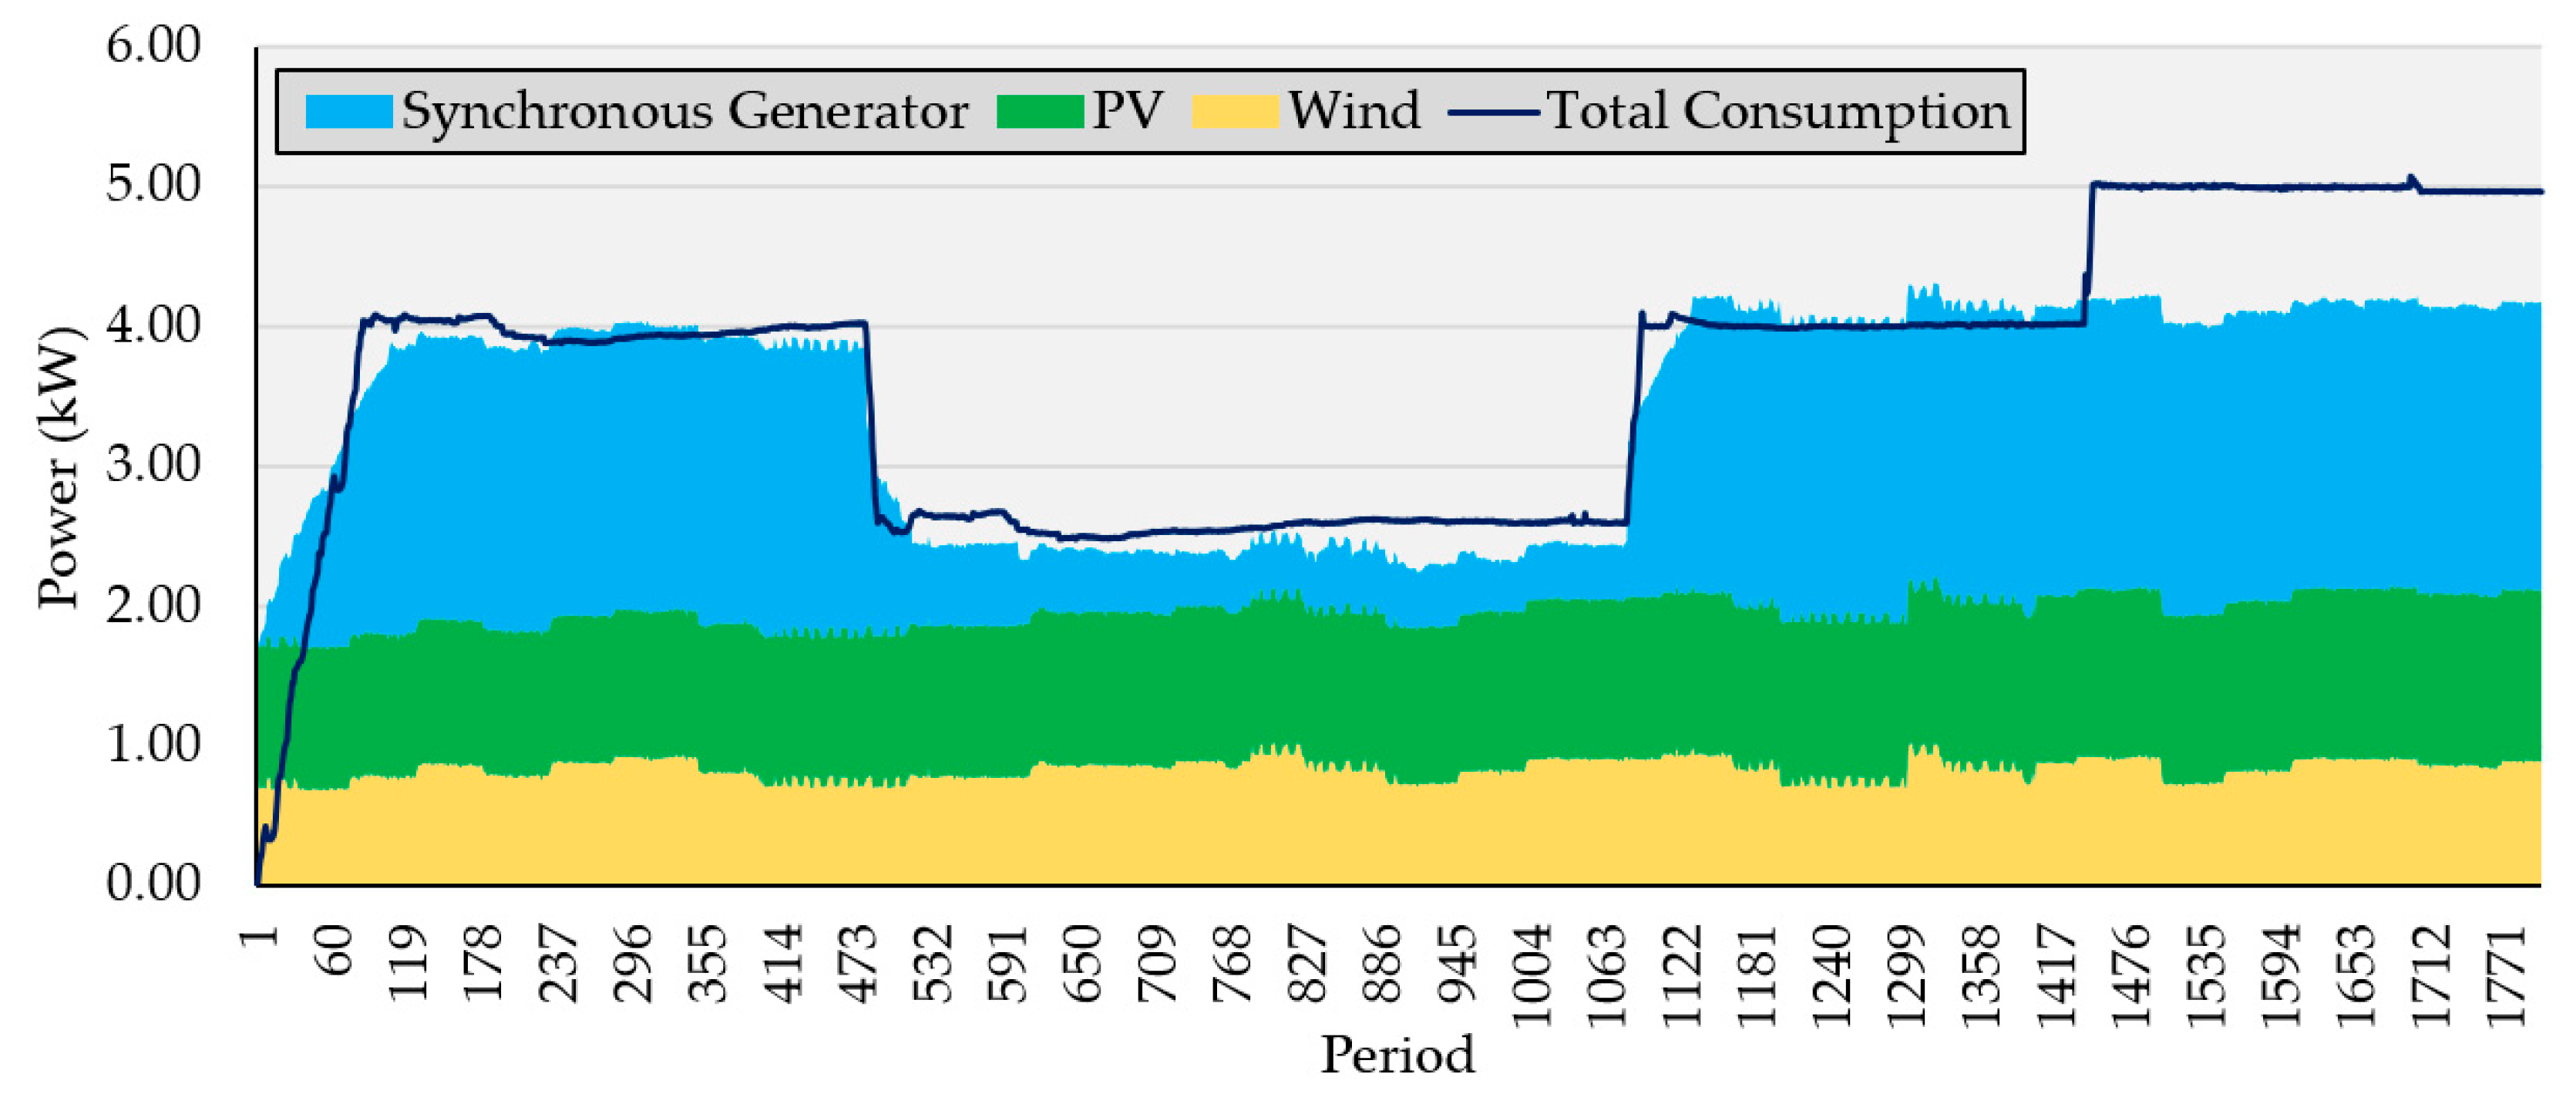
In addition to these results, Figure 7 illustrates the consumption profile of the irrigation system emulated by the two induction motors. By a precise look at Figure 7, it is obvious that in some periods there are some unexpected wind generations, which were not considered in the scheduling profile. In fact, in the case of RERs (that is, wind turbine and PV in this case study), it is profitable for the system to always use the produced energy by RERs, as soon as they have some ability to produce energy. Generally, in such system the weather condition is forecast, however, forecasting methods can also have some errors. So, in this situation, the system has to reschedule the resources in real-time, and try to use the RERs as much as possible, to minimize the input energy from the utility grid.
Moreover, as the system is operating in grid-connected mode, the main power network is considered as an external supplier and a supportive energy source. Therefore, in some moments when the difference of generation and consumption is very small, the system prefers to supply this lack from the utility grid, as it is more profitable. This matter is feasible in the white spaces between the total consumption line and the sum of generation profiles in Figure 7. There are also some contrary cases, for which the generation of the system is more than the consumption. In these periods, the system injected the surplus of produced power to the utility grid (for example, periods #1140 to #1430).
In addition, the device response time of the resources is a critical parameter that normally stays hidden during the theoretical studies. The main point in this context is that all the devices (for example, laboratory equipment or actual machines), require some time to reach the desired level of consumption or generation. As an example, in Figure 7, the synchronous generator takes some seconds for reaching the desire level of generation commanded by the PLC. This causes a ramping in the generation profile.
Therefore, in the moments that the synchronous generator has not reached the desired level, the main network, as a supportive supplier, should feed the consumption of the loads. This point is very important for the cost calculations of the model, as the consumed power from the grid during these moments should always be considered. In fact, the use of laboratory emulations and case studies reveal such issues and improve the quality of the system’s outcomes, before moving towards the real and business models.

3.2. Practical Implementation of Ramping in Distinct Demand Response Programs

In this use case, the MARTINE platform is used to demonstrate a precise investigation into ramping of DR programs in the laboratory scale. For this purpose, several emulator and real equipment and installation are employed for surveying the performance of the platform during the implementation of DR programs. In fact, all the emulators and devices that are used in this use case are the same as the ones employed in use case 1, just the architectures of using them are different.

3.2.1. Implemented Solution

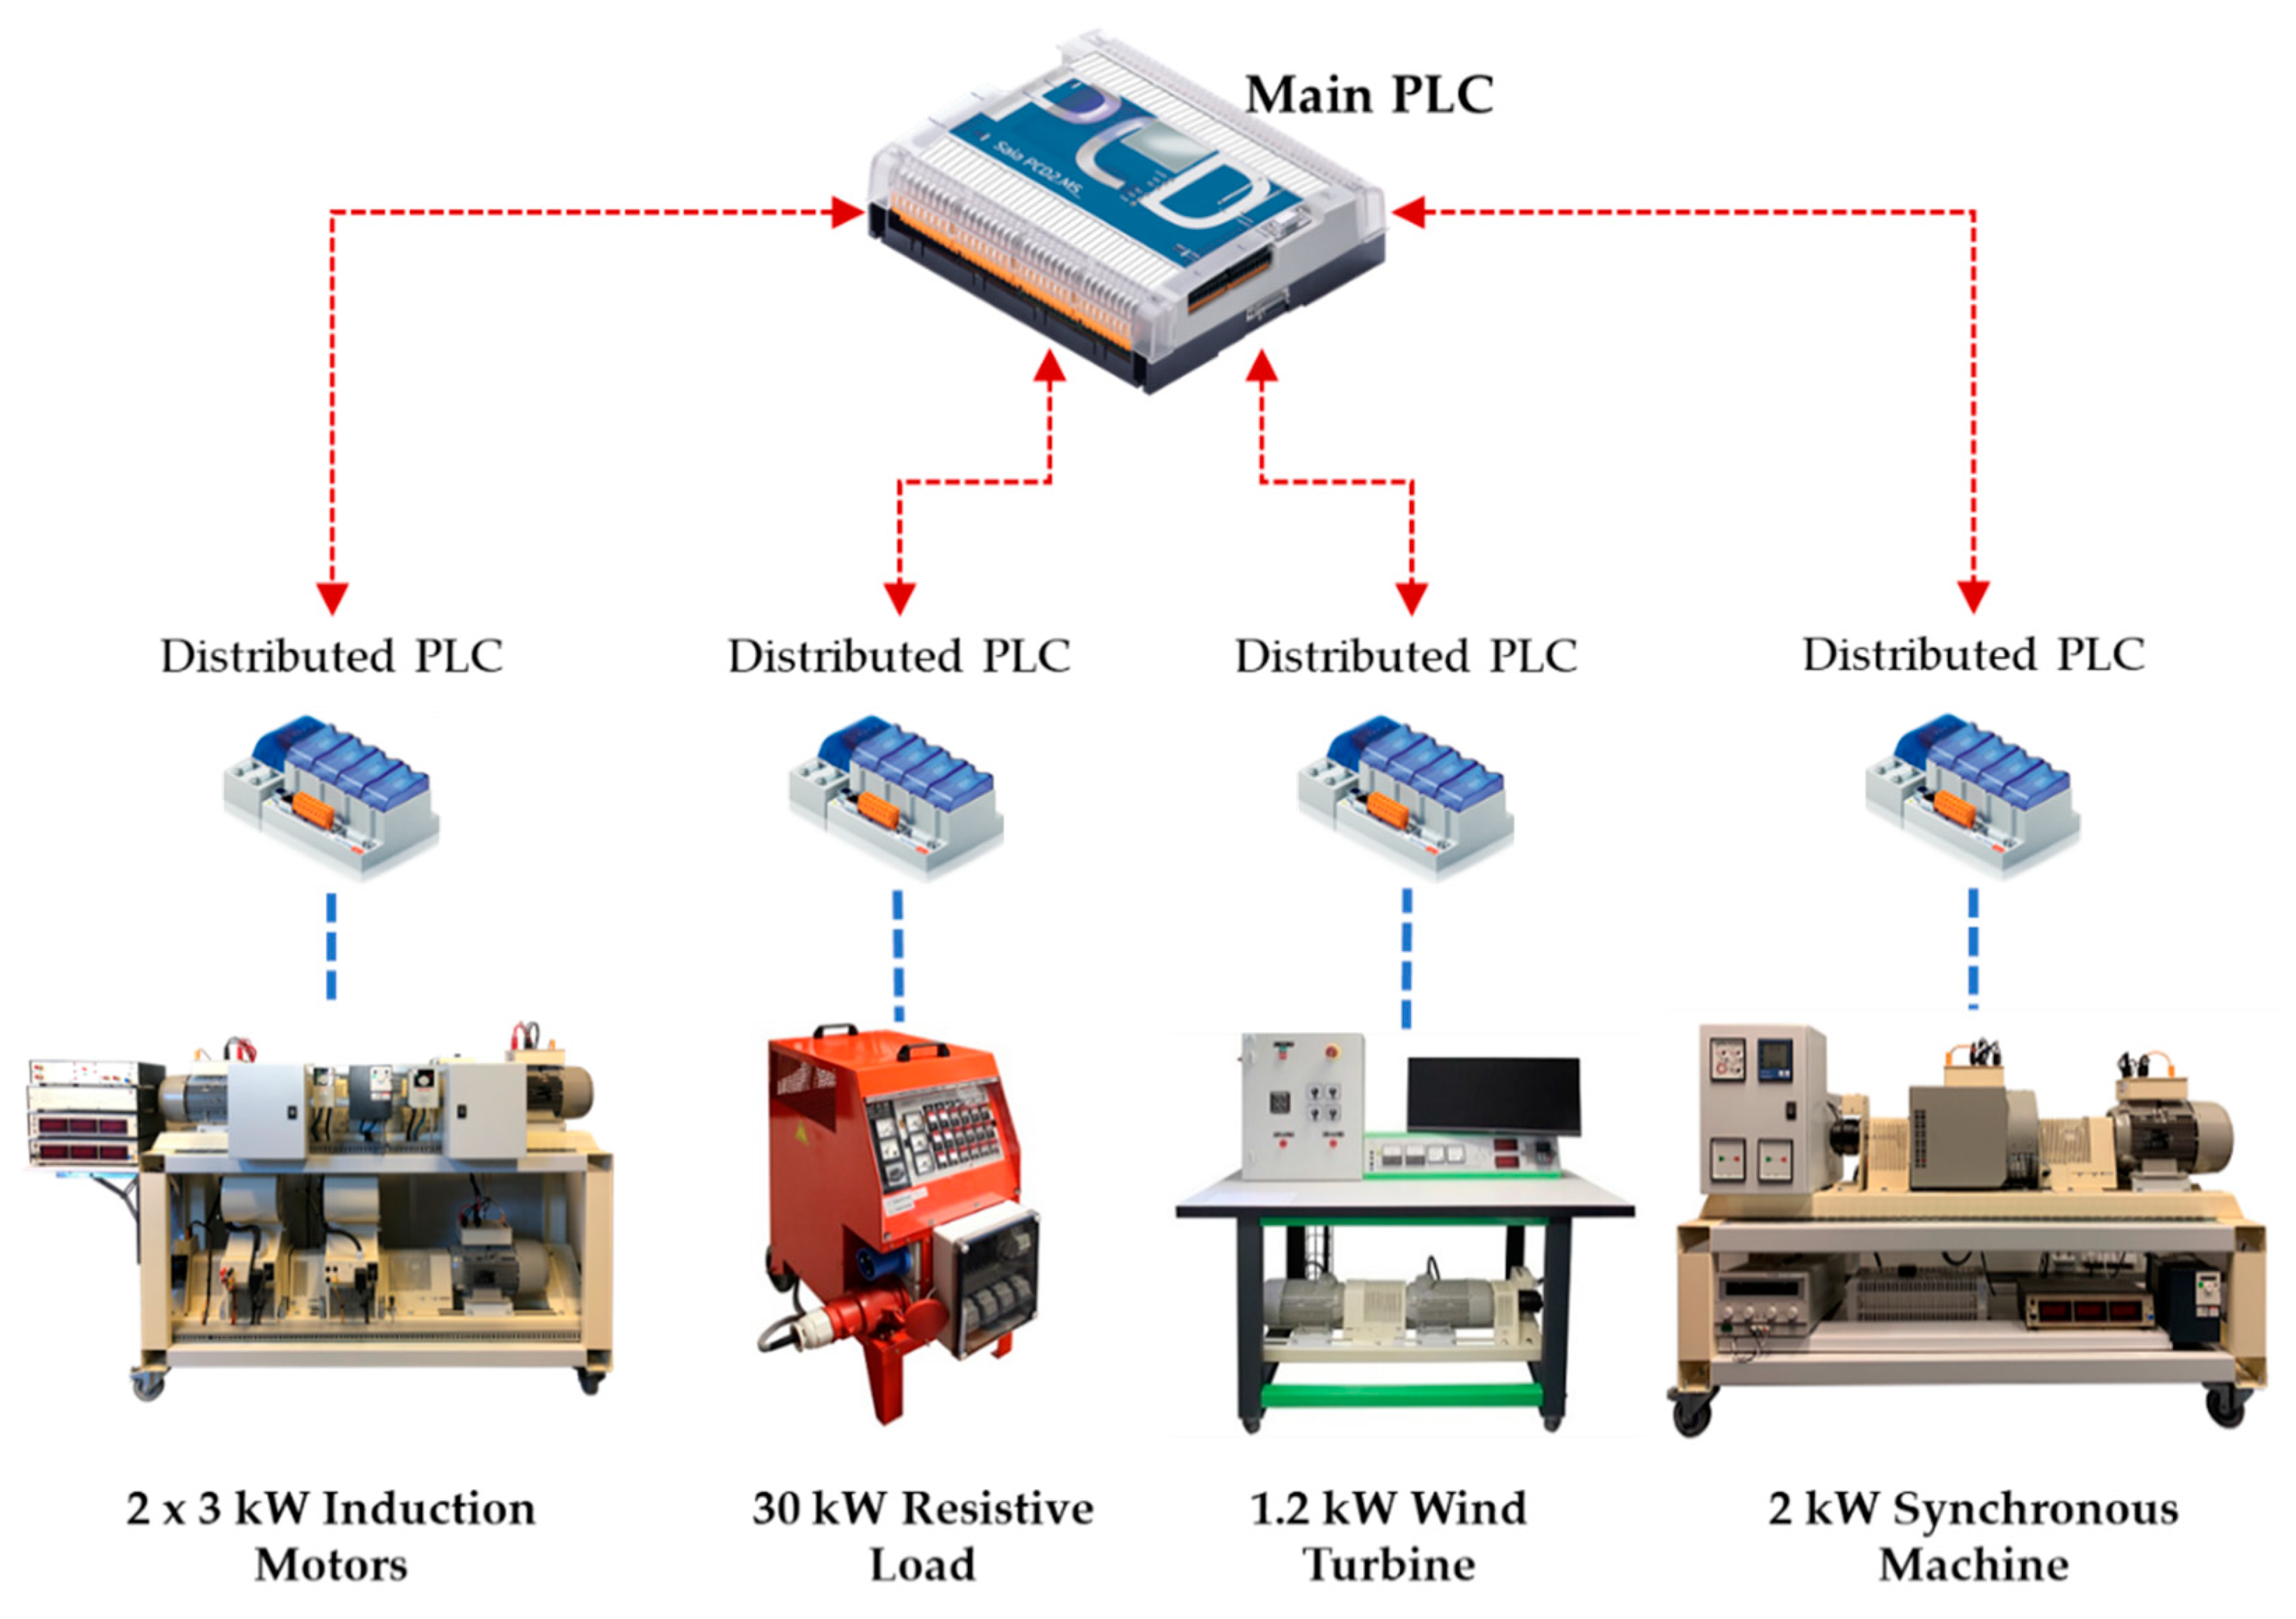
In order to implement a DR program at the laboratory level, it is required to design and develop a set of consumers and producers in the context of a microgrid. Therefore, various types of load and generator emulators are used in this section to model an actual microgrid. In this microgrid model, it is considered there is a residential building, a commercial building, an agriculture system, and a set of RERs, including a wind turbine and a synchronous generator. Figure 8 shows the architecture of the developed model and the associated emulators and devices.
As Figure 8 illustrates, a set of induction motors are considered for the irrigation motors in the agriculture system, and a 30 kW load is considered for the residential and commercial buildings consumption. Also, the 1.2 kW wind turbine emulator and the 2 kW synchronous generator are considered as the RERs in the proposed microgrid model.
In order to control the system, distributed PLCs are installed on each machine; that enables the system to have decision making locally without the need for a central unit. Also, a main PLC is placed on the model to acquire the data and store them in a database.
As it has been discussed widely in the literature, the use of RERs in the microgrids brings instabilities in the network balance, as RERs have many variations in the rate of generation. Therefore, DR programs should be used in such models to enable the microgrid´s operator to manage the rate of consumption and balance the network in term of consumption and generation. However, the implementation of DR programs must be surveyed using actual consumers to see how they react to the consumption reduction, while the operator sends a reduction command to change the consumption profile. This is the main point of this use case and the MARTINE platform is employed to practically survey the implementation of the ramp period before the DR programs are started.
Three DR programs (DR1 to DR3) are considered in this use case. It is assumed that the irrigation motors in the proposed agriculture system are involved in DR1, the residential building is involved in DR2 and finally the commercial building is involved in DR3. Furthermore, the synchronous generator is considered as a supportive resource in order to compensate for the reduction in the case that all consumers have been reduced in the maximum capacity and the microgrid operator still requires reduction in the network. In other words, if the synchronous generator starts producing power, the network will see a reduction in the consumption profile. More information about the characteristics of the DR programs and the ramping periods are available in the authors’ previous works [46].

3.2.2. Experimental Results

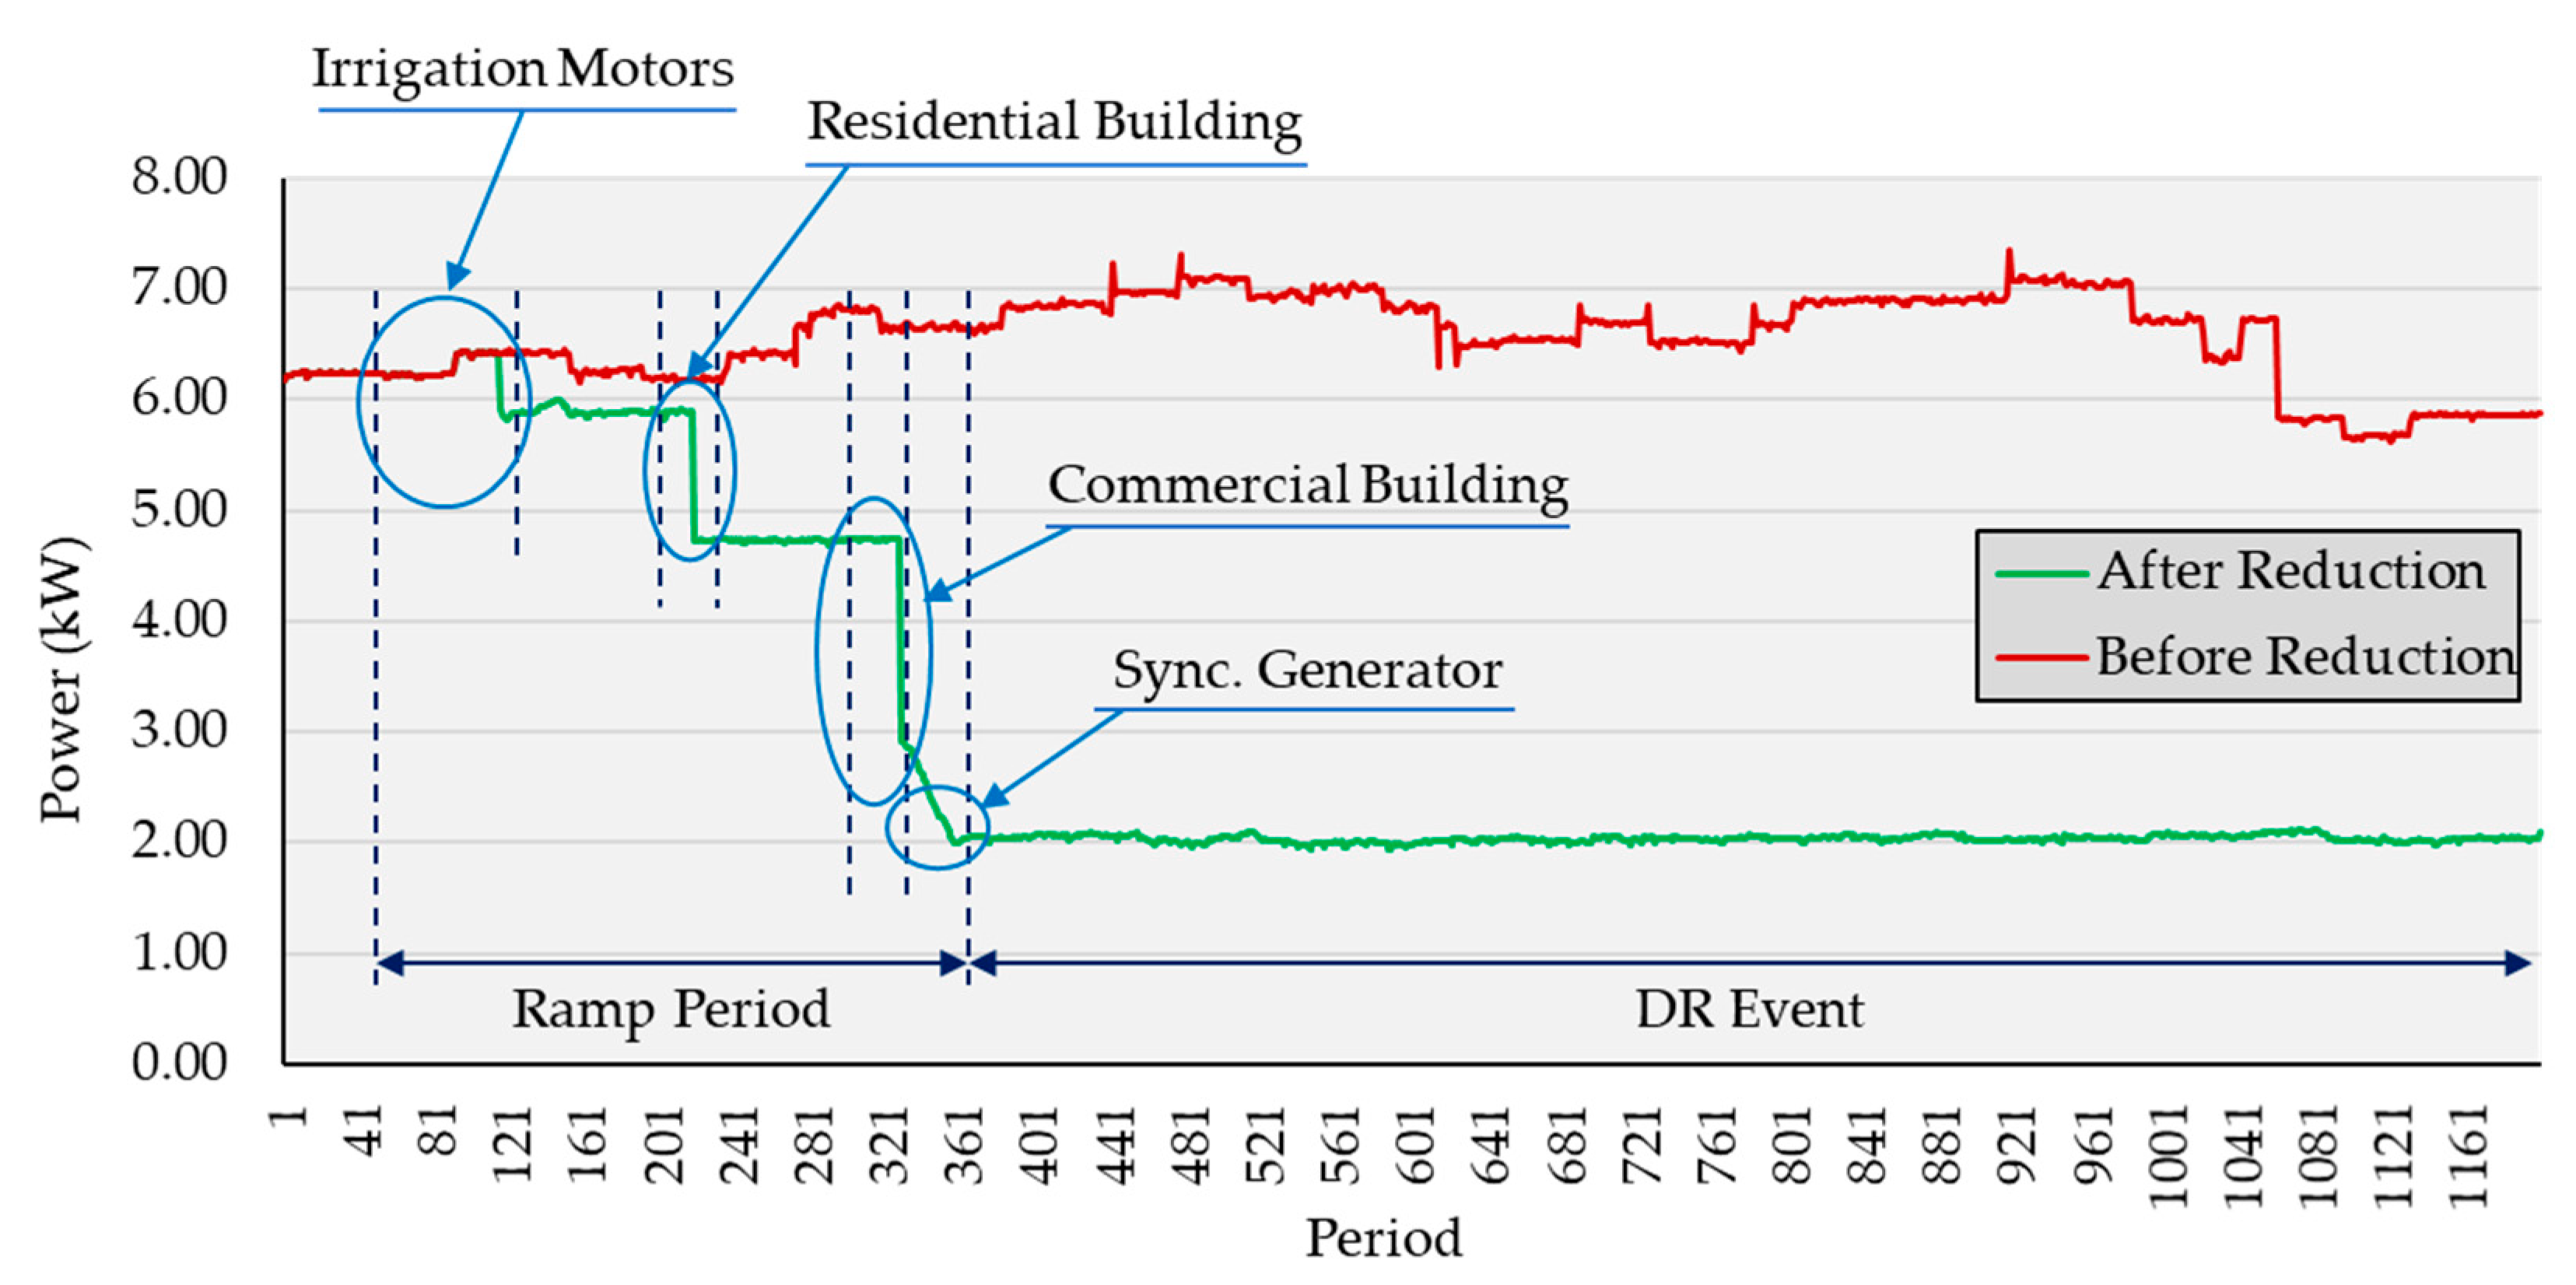
To run the model in real-time, a period of 15 min is considered for the microgrid with 0.5 s time interval. Therefore, there are 1800 periods during this laboratory examination. The adapted results for this use case are shown on Figure 9.
As the DR programs used in this section are considered as voluntary programs, the consumers have a specific period of time to respond to the DR request. If they accepted to participate, an OPT-IN signal is transferred to the system operator, and the consumers start reducing their consumption. This is the process for all consumers during the ramp period, until the microgrid consumption reaches to the required reduction level, i.e., 2 kW in this use case.
As Figure 9 shows, at first the microgrid operator sends a reduction notification to the irrigation motors to reduce the consumption. After that, the residential and commercial consumers are notified respectively, and they reduce the consumption. In the last stage, the microgrid operator employs the synchronous generator to produce energy, so the consumption rate reaches the desired level (2 kW in this case).
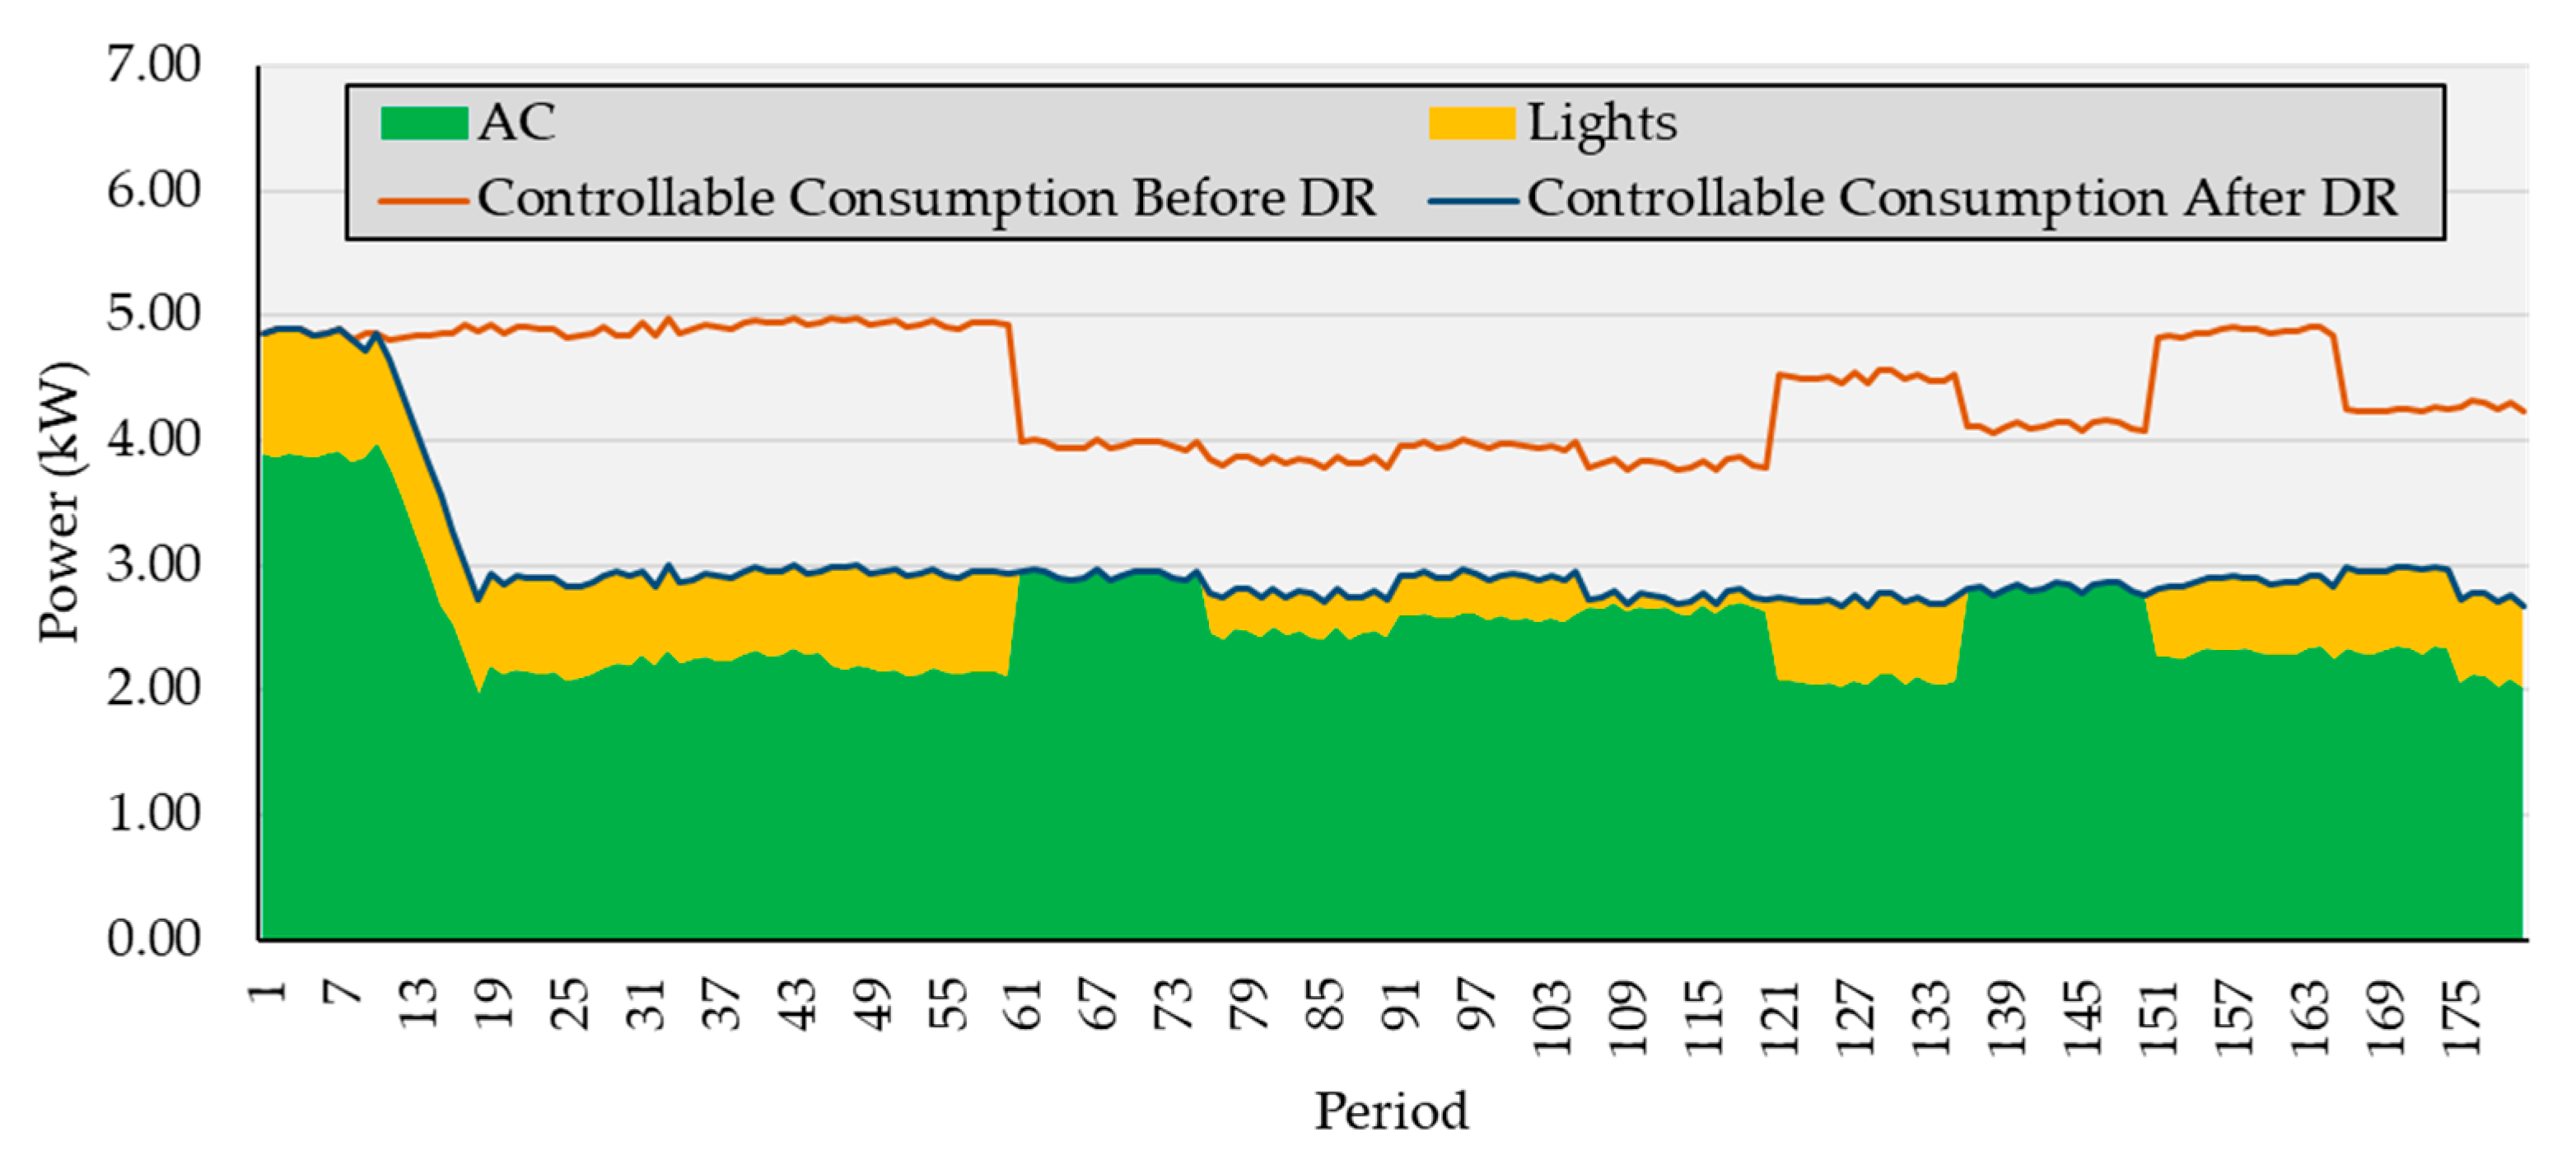
Also, in order to make a specific look to the inside of the building while DR ramping is being activated, the commercial building is selected in this use case to show the detailed building´s consumption reduction. Therefore, Figure 10 demonstrates the consumption of the commercial building before and after the DR reduction request. The information shown on Figure 10 is real data adapted from GECAD database, and it is for 180 periods of 0.5 s.
The profiles illustrated in Figure 10 are a part of the reduced consumption profile shown in Figure 9 (from period #290 to #470), and it only shows the periods that commercial building started to reduce the consumption for the DR event. The lights and air conditioners are the devices in this building that participated in the DR reduction request.
The main point that can be concluded in from these experimental results is that microgrid operator does not reach the desired reduction level immediately, and it always requires some time to achieve the reduction rate. This is very important in the calculation of remuneration for the DR participants, because while the consumers start reducing their consumption, they expect to receive financial remuneration for the related power reduction. This matter is more feasible during the ramp period, as in the most of the models in the literature, the remuneration payment begins at the starting point of the DR event. However, in the model demonstrated in this use case, the remuneration payment can be precisely calculated for the entire DR event and ramp period.

3.3. Real-Time Simulation System for Load Modeling

In this use case, the MARTINE platform is used for load modeling validation using the real-time simulation machine and laboratory loads. For this purpose, power hardware in the loop (PHIL) methodology is employed to validate the load models in different network conditions. In fact, in this way, it is possible to provide load modeling through a significant number of laboratory tests using actual measurements of voltage and frequency.

3.3.1. Implemented Solution

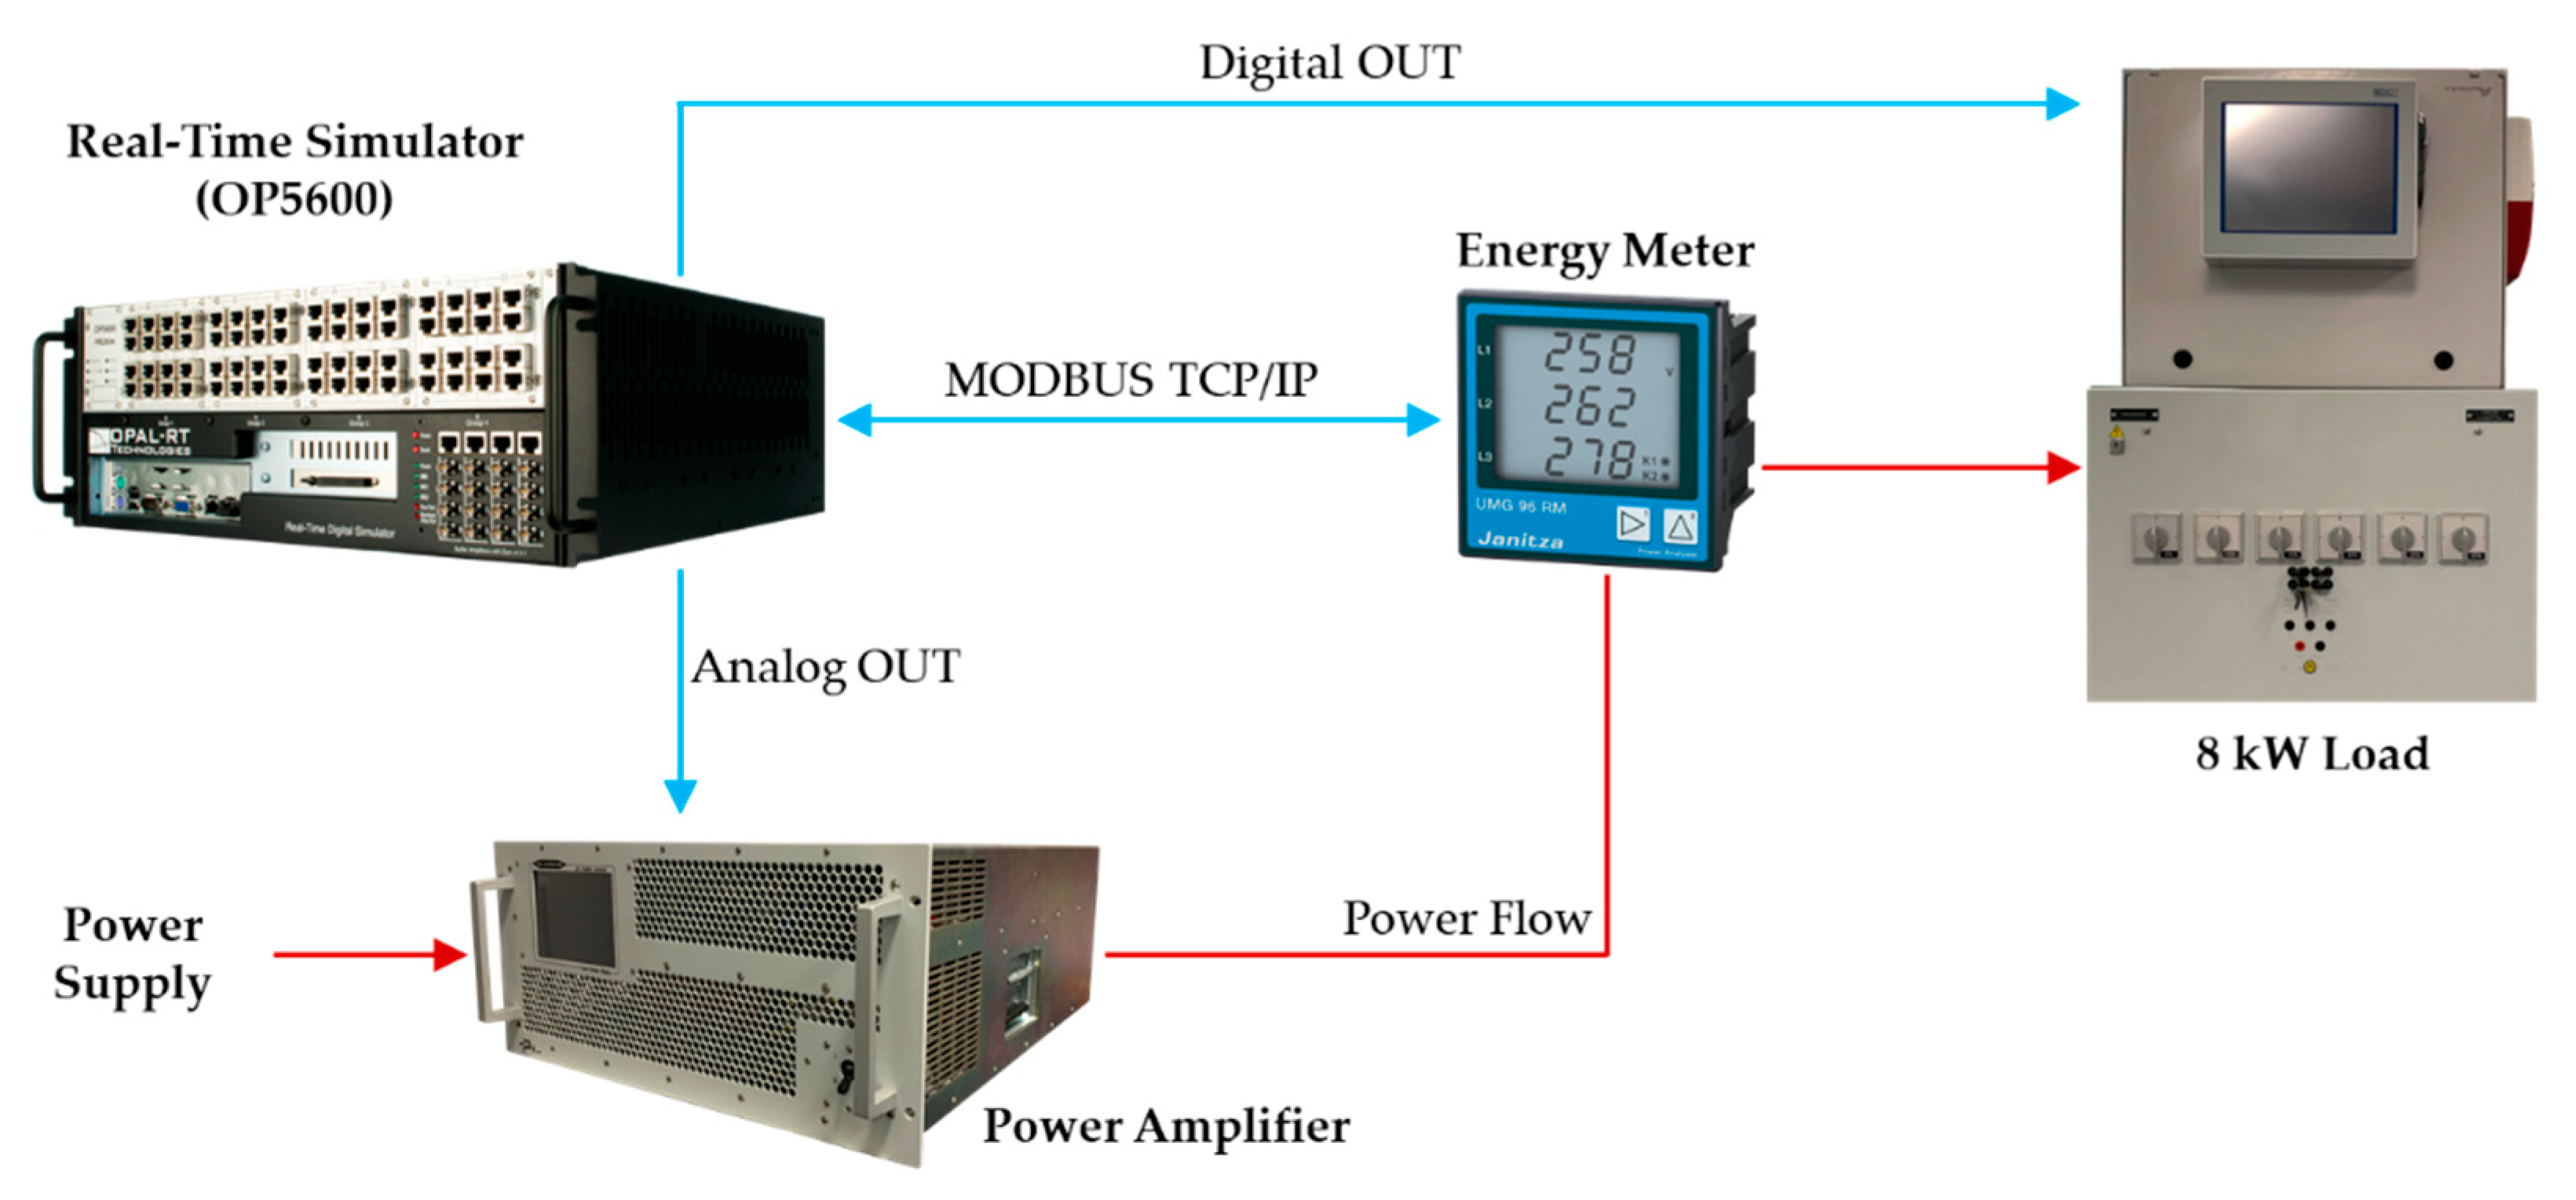
In order to implement the proposed system, a real-time simulator (OP5600), a power amplifier, a laboratory load, and a set of controlling and monitoring equipment have been employed. Figure 11 illustrates an overview of the architecture of the implemented solution. As it is clear in the same figure, the OP5600 is considered as the principal player of the system. This machine is accountable for network simulation models and controlling and monitoring the other devices through digital and analog I/O as well as various types of communication protocols, such as MODBUS TCP/IP.
The outputs of the OP5600 are a set of calculated rates of parameters that the power amplifier needs to implement an actual power network. In fact, the power amplifier reinforces the electricity power and supply to the connected consumer. So, it is possible to consider the power amplifier as a power source for which the user is able to modify the network parameters, such as the rate of voltage and frequency. By this approach it is possible to survey the behavior of the consumers (in this use case, an 8 kW load) in different network conditions, namely a peak of variation in voltage or frequency.
Another important aspect of this implemented solution is the use of PHIL. This matter is also shown on Figure 11, since the OP5600 conveys controlling commands to the laboratory devices (that is, power amplifier and 8 kW load), and then the energy meter measures the actual parameters of the network and it sends them back to the real-time simulator. Therefore, the network analysis can be done in the OP5600 by using both simulated and actual results of the model. The main outcome of this model is to calculate load modelling based on experimental results acquired from the 8 kW load. In other words, using this strategy enables the user to theoretically model a load that has been developed based on realistic data.

3.3.2. Experimental Results

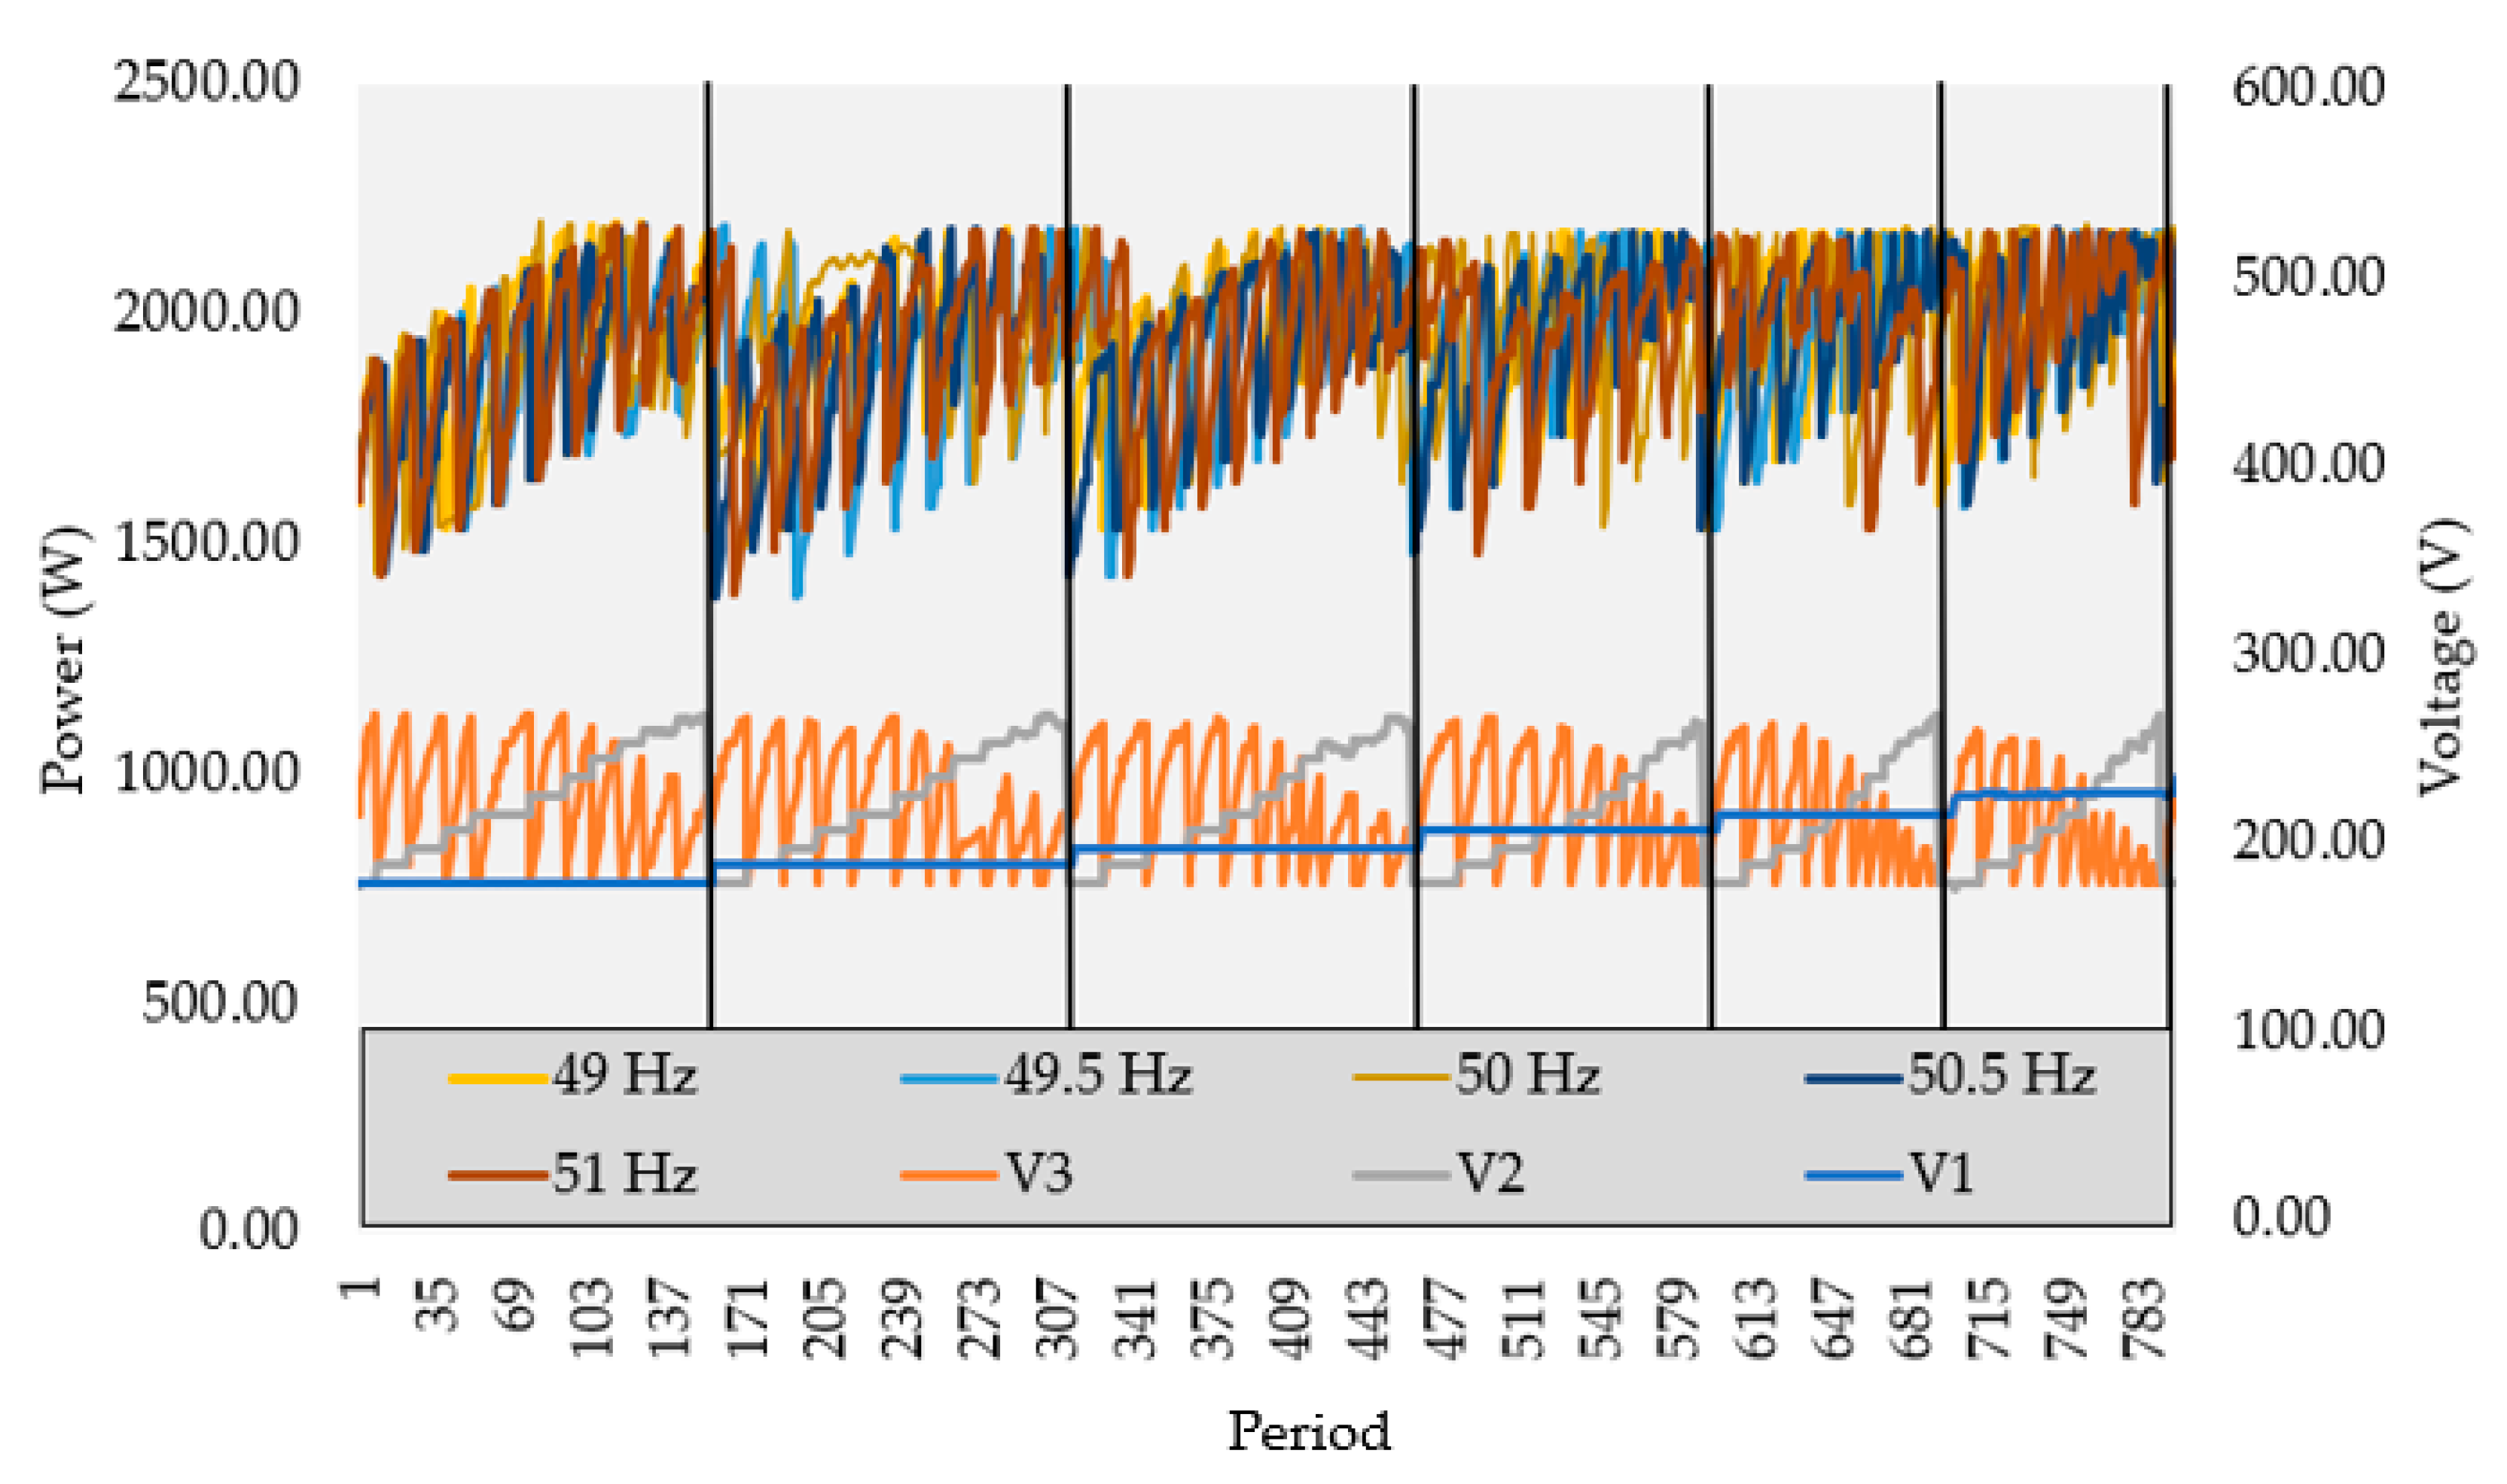
In this section, the experimental results adapted from the laboratory tests are shown, which have been adapted from OP5600. As many scenarios and possibilities are performed in this regard, only one of them is selected to show here due to the lack of space. Figure 12 shows the results adapted from the OP5600 for 790 periods. The real-time simulation step is 0.01 s (time step of OP5600).
The data shown in Figure 12 illustrates the variation of power in the load while the frequency of the network is changed from 49 to 51 Hz. The load bank used for the simulation is a coil resistor which has a predominant resistive component and a small inductive component dependent on the frequency. The later has a marginal effect but is still relevant when we want to improve the accuracy of the load model. As far as the period increases, the voltage levels in each one of the 3 phases are also changed, as can be seen in Figure 12. Vertical lines in Figure 12 show the major changes in voltage, namely the changing V1 level. Through this approach, it is possible to see the behavior of the load and, therefore, a mathematical formulation can be adapted to model the load.

4. Discussion

Assessing the impact of decision-making and energy management models in the actual physical resources is an often disregarded issue. The development of advanced theoretical models delivers relevant advances in the field. In the literature, several approaches propose alternatives based on digital twins, which can be an option also for real-time simulation of electricity grids [47].
However, without a suitable validation in real or near-real environments, these solutions cannot mature to the level of allowing widespread adoption. MARTINE has been developed to provide the testing and validation environment that is required to assess the impact of decision-making models in physical resources, and of communication and control approaches in the performance of the management systems.
MARTINE is composed of real buildings equipped with sensing and control devices, which are complemented by emulated resources that permit the enlargement of testing scenarios. The validation environment is further enriched by the incorporation of multi-agent systems that endow the capability of simulating diverse types of players acting in the domain, and even additional energy resources and buildings. Real-time simulation is used to validate power components and the grid, while enabling the interaction between virtual and physical resources through hardware in the loop. The knowledge layer comprises the multiple decision support and energy management models, including energy resources forecasting, energy resources scheduling, demand response programs, market participation, among others that can be used and integrated for validation purposes. Data used in MARTINE experimentations includes data acquired directly by the buildings, data resulting from simulations, real data gathered from external sources, and real-time monitored data from remote partners. The alternative is to consider numerical models, which are very relevant for the calculations of energy modeling aspects. Indeed, increasing the complexity of the models can be more realistic but at the same time it makes harder to model the problem, as the required parameters are difficult to obtain or have high uncertainty. This said, MARTINE allows combining all the possibilities as the user can select the more adequate ones in each simulation.

5. Conclusions

Results show that MARTINE enables the representation and experimentation of diverse test scenarios related to buildings and smart grid energy management, allowing for a comprehensive validation of different types of management and decision support solutions, as well as their impact on the physical resources, and on communication and control actions. The results in this paper show that the combination of emulated resources and real loads and generators provide a more realistic management and validation of an energy system. It is an advantage compared with the usually used numeric models, which include some assumptions and simplifications for computation purposes. Also, it is shown that demand response is very flexible, but adequate modeling and remuneration must be handled with care, namely regarding the ramping of resources activation.
As future work, MARTINE will be endowed with explainable-AI technologies, so that the AI-based decision support actions can be easily understood by the users. Moreover, automated machine learning solutions are being developed to enable the considered models’ real-time adaptation to different contexts of use and to the needs of different experiments. Security communications and data privacy, as well as power hardware in the loop (PHIL) will be improved.

Author Contributions

Conceptualization, L.G., P.F. and Z.V.; methodology, L.G., T.P., P.F. and Z.V.; software, O.A. and L.G.; validation, O.A., L.G., T.P., P.F. and Z.V.; formal analysis, O.A. and L.G.; investigation, O.A., L.G., T.P., P.F. and Z.V.; resources, P.F. and Z.V.; data curation, O.A., L.G. and Z.V.; writing—original draft preparation, O.A., L.G., P.F. and Z.V.; writing—review and editing, O.A., L.G., T.P., P.F. and Z.V.; visualization, O.A., L.G., P.F. and Z.V.; supervision, L.G., T.P., P.F. and Z.V.; project administration, P.F. and Z.V.; funding acquisition, T.P., P.F. and Z.V. All authors have read and agreed to the published version of the manuscript.

Funding

This work has received funding from FEDER Funds through COMPETE program and from National Funds through (FCT) under the projects UIDB/00760/2020, MAS-Society (PTDC/EEI-EEE/28954/2017), CEECIND/01811/2017 and CEECIND/02887/2017.

Data Availability Statement

The data used in this study are available in [37,44].

Acknowledgments

The authors would like to acknowledge the support given by Gabriel Santos, Jorge Lobão, and Cláudio Cardoso to this work.

Conflicts of Interest

The authors declare no conflict of interest.

References

  1. Wang, S.; Tarroja, B.; Schell, L.S.; Shaffer, B.; Samuelsen, S. Prioritizing among the end uses of excess renewable energy for cost-effective greenhouse gas emission reductions. Appl. Energy 2019, 235, 284–298. [Google Scholar] [CrossRef]
  2. Leonard, M.D.; Michaelides, E.E.; Michaelides, D.N. Energy storage needs for the substitution of fossil fuel power plants with renewables. Renew. Energy 2020, 145, 951–962. [Google Scholar] [CrossRef]
  3. Ghorbani, N.; Aghahosseini, A.; Breyer, C. Assessment of a cost-optimal power system fully based on renewable energy for Iran by 2050—Achieving zero greenhouse gas emissions and overcoming the water crisis. Renew. Energy 2020, 146, 125–148. [Google Scholar] [CrossRef]
  4. Piotr, F.B. Nexus between water, energy, food and climate change as challenges facing the modern global, European and Polish economy. AIMS Geosci. 2020, 6, 397–421. [Google Scholar] [CrossRef]
  5. Abrishambaf, O.; Lezama, F.; Faria, P.; Vale, Z. Towards transactive energy systems: An analysis on current trends. Energy Strategy Rev. 2019, 26, 100418. [Google Scholar] [CrossRef]
  6. Morais, H.; Faria, P.; Vale, Z. Demand response design and use based on network locational marginal prices. Int. J. Electr. Power Energy Syst. 2014, 61, 180–191. [Google Scholar] [CrossRef]
  7. Vale, Z.A.; Ramos, C.; Morais, H.; Faria, P.; Silva, M. The role of demand response in future power systems. In Proceedings of the 2009 Transmission & Distribution Conference & Exposition: Asia and Pacific, Seoul, Korea, 26–30 October 2009; pp. 1–4. [Google Scholar]
  8. Faria, P.; Vale, Z.; Baptista, J. Constrained consumption shifting management in the distributed energy resources scheduling considering demand response. Energy Convers. Manag. 2015, 93, 309–320. [Google Scholar] [CrossRef] [Green Version]
  9. Sikorski, T.; Jasiński, M.; Ropuszyńska-Surma, E.; Węglarz, M.; Kaczorowska, D.; Kostyła, P.; Leonowicz, Z.; Lis, R.; Rezmer, J.; Rojewski, W.; et al. A Case Study on Distributed Energy Resources and Energy-Storage Systems in a Virtual Power Plant Concept: Economic Aspects. Energies 2019, 12, 4447. [Google Scholar] [CrossRef] [Green Version]
  10. Yi, W.; Zhang, Y.; Zhao, Z.; Huang, Y. Multiobjective Robust Scheduling for Smart Distribution Grids: Considering Renewable Energy and Demand Response Uncertainty. IEEE Access 2018, 6, 45715–45724. [Google Scholar] [CrossRef]
  11. Althaher, S.; Mancarella, P.; Mutale, J. Automated Demand Response from Home Energy Management System under Dynamic Pricing and Power and Comfort Constraints. IEEE Trans. Smart Grid 2015, 6, 1874–1883. [Google Scholar] [CrossRef]
  12. Federal Energy Regulatory Commission. Assessment of Demand Response & Advanced Metering; Federal Energy Regulatory Commission: Washington, WA, USA, 2011.
  13. Della Giustina, D.; Ponci, F.; Repo, S. Automation for smart grids in Europe. In Application of Smart Grid Technologies; Elsevier: Amsterdam, The Netherlands, 2018; pp. 231–274. [Google Scholar]
  14. Du, P.; Lu, N.; Zhong, H. Demand Response in Smart Grids; Springer: Berlin/Heidelberg, Germany, 2019; ISBN 978-3-030-19768-1. [Google Scholar]
  15. Khorram, M.; Abrishambaf, O.; Faria, P.; Vale, Z. Office building participation in demand response programs supported by intelligent lighting management. Energy Inform. 2018, 1, 1–14. [Google Scholar] [CrossRef]
  16. Kathiriya, H.; Pandya, A.; Dubay, V.; Bavarva, A. State of Art: Energy Efficient Protocols for Self-Powered Wireless Sensor Network in IIoT to Support Industry 4.0. In Proceedings of the 2020 8th International Conference on Reliability, Infocom Technologies and Optimization (Trends and Future Directions) (ICRITO), Noida, India, 4–5 June 2020; pp. 1311–1314. [Google Scholar]
  17. Javied, T.; Bakakeu, J.; Gessinger, D.; Franke, J. Strategic energy management in industry 4.0 environment. In Proceedings of the 2018 Annual IEEE International Systems Conference (SysCon), Vancouver, BC, Canada, 23–26 April 2018; pp. 1–4. [Google Scholar]
  18. Wang, K.; Yu, J.; Yu, Y.; Qian, Y.; Zeng, D.; Guo, S.; Xiang, Y.; Wu, J. A survey on energy internet: Architecture, approach, and emerging technologies. IEEE Syst. J. 2017, 12, 2403–2416. [Google Scholar] [CrossRef]
  19. Siano, P.; De Marco, G.; Rolán, A.; Loia, V. A Survey and Evaluation of the Potentials of Distributed Ledger Technology for Peer-to-Peer Transactive Energy Exchanges in Local Energy Markets. IEEE Syst. J. 2019, 13, 3454–3466. [Google Scholar] [CrossRef]
  20. Paterakis, N.G.; Mocanu, E.; Gibescu, M.; Stappers, B.; van Alst, W. Deep learning versus traditional machine learning methods for aggregated energy demand prediction. In Proceedings of the 2017 IEEE PES Innovative Smart Grid Technologies Conference Europe (ISGT-Europe), Turin, Italy, 26–29 September 2017; pp. 1–6. [Google Scholar]
  21. Abrishambaf, O.; Faria, P.; Vale, Z. Application of an optimization-based curtailment service provider in real-time simulation. Energy Inform. 2018, 1, 3. [Google Scholar] [CrossRef] [Green Version]
  22. Abrishambaf, O.; Faria, P.; Vale, Z.; Corchado, J.M. Real-Time Simulation of a Curtailment Service Provider for Demand Response Participation. In Proceedings of the 2018 IEEE/PES Transmission and Distribution Conference and Exposition (T&D), Colorado, CO, USA, 16–19 April 2018; pp. 1–9. [Google Scholar]
  23. Zhong, H.; Xie, L.; Xia, Q. Coupon Incentive-Based Demand Response: Theory and Case Study. IEEE Trans. Power Syst. 2013, 28, 1266–1276. [Google Scholar] [CrossRef]
  24. Mahmoudi, N.; Heydarian-Forushani, E.; Shafie-khah, M.; Saha, T.K.; Golshan, M.E.H.; Siano, P. A bottom-up approach for demand response aggregators’ participation in electricity markets. Electr. Power Syst. Res. 2017, 143, 121–129. [Google Scholar] [CrossRef]
  25. Do Prado, J.C.; Qiao, W. A Stochastic Decision-Making Model for an Electricity Retailer with Intermittent Renewable Energy and Short-Term Demand Response. IEEE Trans. Smart Grid 2019, 10, 2581–2592. [Google Scholar] [CrossRef]
  26. Vahid-Ghavidel, M.; Mahmoudi, N.; Mohammadi-Ivatloo, B. Self-Scheduling of Demand Response Aggregators in Short-Term Markets Based on Information Gap Decision Theory. IEEE Trans. Smart Grid 2019, 10, 2115–2126. [Google Scholar] [CrossRef]
  27. Priyadarshana, H.V.V.; Kalhan Sandaru, M.A.; Hemapala, K.T.M.U.; Wijayapala, W.D.A.S. A review on Multi-Agent system based energy management systems for micro grids. AIMS Energy 2019, 7, 924–943. [Google Scholar] [CrossRef]
  28. Wooldridge, M. An Introduction to Multiagent Systems, 2nd ed.; Wiley Publishing: Hoboken, NJ, USA, 2009; ISBN 0470519460 9780470519462. [Google Scholar]
  29. De Azevedo, R.; Cintuglu, M.H.; Ma, T.; Mohammed, Q.A. Multiagent-Based Optimal Microgrid Control Using Fully Distributed Diffusion Strategy. IEEE Trans. Smart Grid 2017, 8, 1997–2008. [Google Scholar] [CrossRef]
  30. Amicarelli, E.; Tran, Q.T.; Bacha, S. Multi-agent system for day-ahead energy management of microgrid. In Proceedings of the 2016 18th European Conference on Power Electronics and Applications (EPE’16 ECCE Europe), Karlsruhe, Germany, 5–9 September 2016; pp. 1–10. [Google Scholar] [CrossRef]
  31. Dou, C.; Yue, D.; Li, X.; Xue, Y. MAS-Based Management and Control Strategies for Integrated Hybrid Energy System. IEEE Trans. Ind. Inform. 2016, 12, 1332–1349. [Google Scholar] [CrossRef]
  32. Azeroual, M.; Lamhamdi, T.; El Moussaoui, H.; El Markhi, H. Simulation tools for a smart grid and energy management for microgrid with wind power using multi-agent system. Wind Eng. 2020, 44, 661–672. [Google Scholar] [CrossRef]
  33. Sami, B.S. Intelligent Energy Management for Off-Grid Renewable Hybrid System Using Multi-Agent Approach. IEEE Access 2020, 8, 8681–8696. [Google Scholar] [CrossRef]
  34. Zhou, F.; Huang, Z.; Yang, Y.; Wang, J.; Li, L.; Peng, J. Decentralized event-triggered cooperative control for multi-agent systems with uncertain dynamics using local estimators. Neurocomputing 2017, 237, 388–396. [Google Scholar] [CrossRef]
  35. Abrishambaf, O.; Faria, P.; Gomes, L.; Spínola, J.; Vale, Z.; Corchado, J. Implementation of a Real-Time Microgrid Simulation Platform Based on Centralized and Distributed Management. Energies 2017, 10, 806. [Google Scholar] [CrossRef] [Green Version]
  36. Pinto, T.; Gomes, L.; Faria, P.; Sousa, F.; Vale, Z. MARTINE: Multi-agent based real-time infrastructure for energy. In Proceedings of the 19th International Conference on Autonomous Agents and Multiagent Systems (AAMAS 2020), Auckland, New Zealand, 9–13 May 2020. [Google Scholar]
  37. Abrishambaf, O.; Faria, P.; Gomes, L.; Vale, Z. Agricultural irrigation scheduling for a crop management system considering water and energy use optimization. Energy Rep. 2020, 6, 133–139. [Google Scholar] [CrossRef]
  38. Jade. Available online: https://jade.tilab.com/ (accessed on 3 March 2021).
  39. Fipa. Available online: http://www.fipa.org/repository/aclspecs.html (accessed on 3 March 2021).
  40. Santos, G.; Pinto, T.; Vale, Z.; Corchado, J.M. Multi-agent semantic interoperability in complex energy systems simulation and decision support. In Proceedings of the 2019 20th International Conference on Intelligent System Application to Power Systems (ISAP), New Delhi, India, 10–14 December 2019; pp. 1–6. [Google Scholar] [CrossRef]
  41. Gomes, L.; Faria, P.; Vale, Z.; Silva, J. Energy Analyzer Emulator for Microgrid Implementation and Demonstration and Respective Gateway. IEEE Trans. Ind. Appl. 2019, 55, 134–144. [Google Scholar] [CrossRef]
  42. Gomes, L.; Lefrançois, M.; Faria, P.; Vale, Z. Publishing real-time microgrid consumption data on the web of Linked Data. In Proceedings of the 2016 Clemson University Power Systems Conference (PSC), Clemson, SC, USA, 8–11 March 2016; pp. 1–8. [Google Scholar] [CrossRef] [Green Version]
  43. Gomes, L.; Vale, Z.; Corchado, J. Multi-Agent Microgrid Management System for Single-Board Computers: A Case Study on Peer-to-Peer Energy Trading. IEEE Access 2020, 8, 64169–64183. [Google Scholar] [CrossRef]
  44. Gomes, L.; Spínola, J.; Vale, Z.; Corchado, J. Agent-based architecture for demand side management using real-time resource’s priorities and a deterministic optimization algorithm. J. Clean. Prod. 2019, 241. [Google Scholar] [CrossRef]
  45. Horling, B.; Lesser, V. A survey of multi-agent organizational paradigms. Knowl. Eng. Rev. 2004, 19, 281–316. [Google Scholar] [CrossRef] [Green Version]
  46. Abrishambaf, O.; Faria, P.; Vale, Z. Ramping of Demand Response Event with Deploying Distinct Programs by an Aggregator. Energies 2020, 13, 1389. [Google Scholar] [CrossRef] [Green Version]
  47. Teng, S.; Touš, Y.; Leong, W.; How, B.; Lam, H.; Máša, V. Recent advances on industrial data-driven energy savings: Digital twins and infrastructures. Renew. Sustain. Energy Rev. 2021, 135. [Google Scholar] [CrossRef]
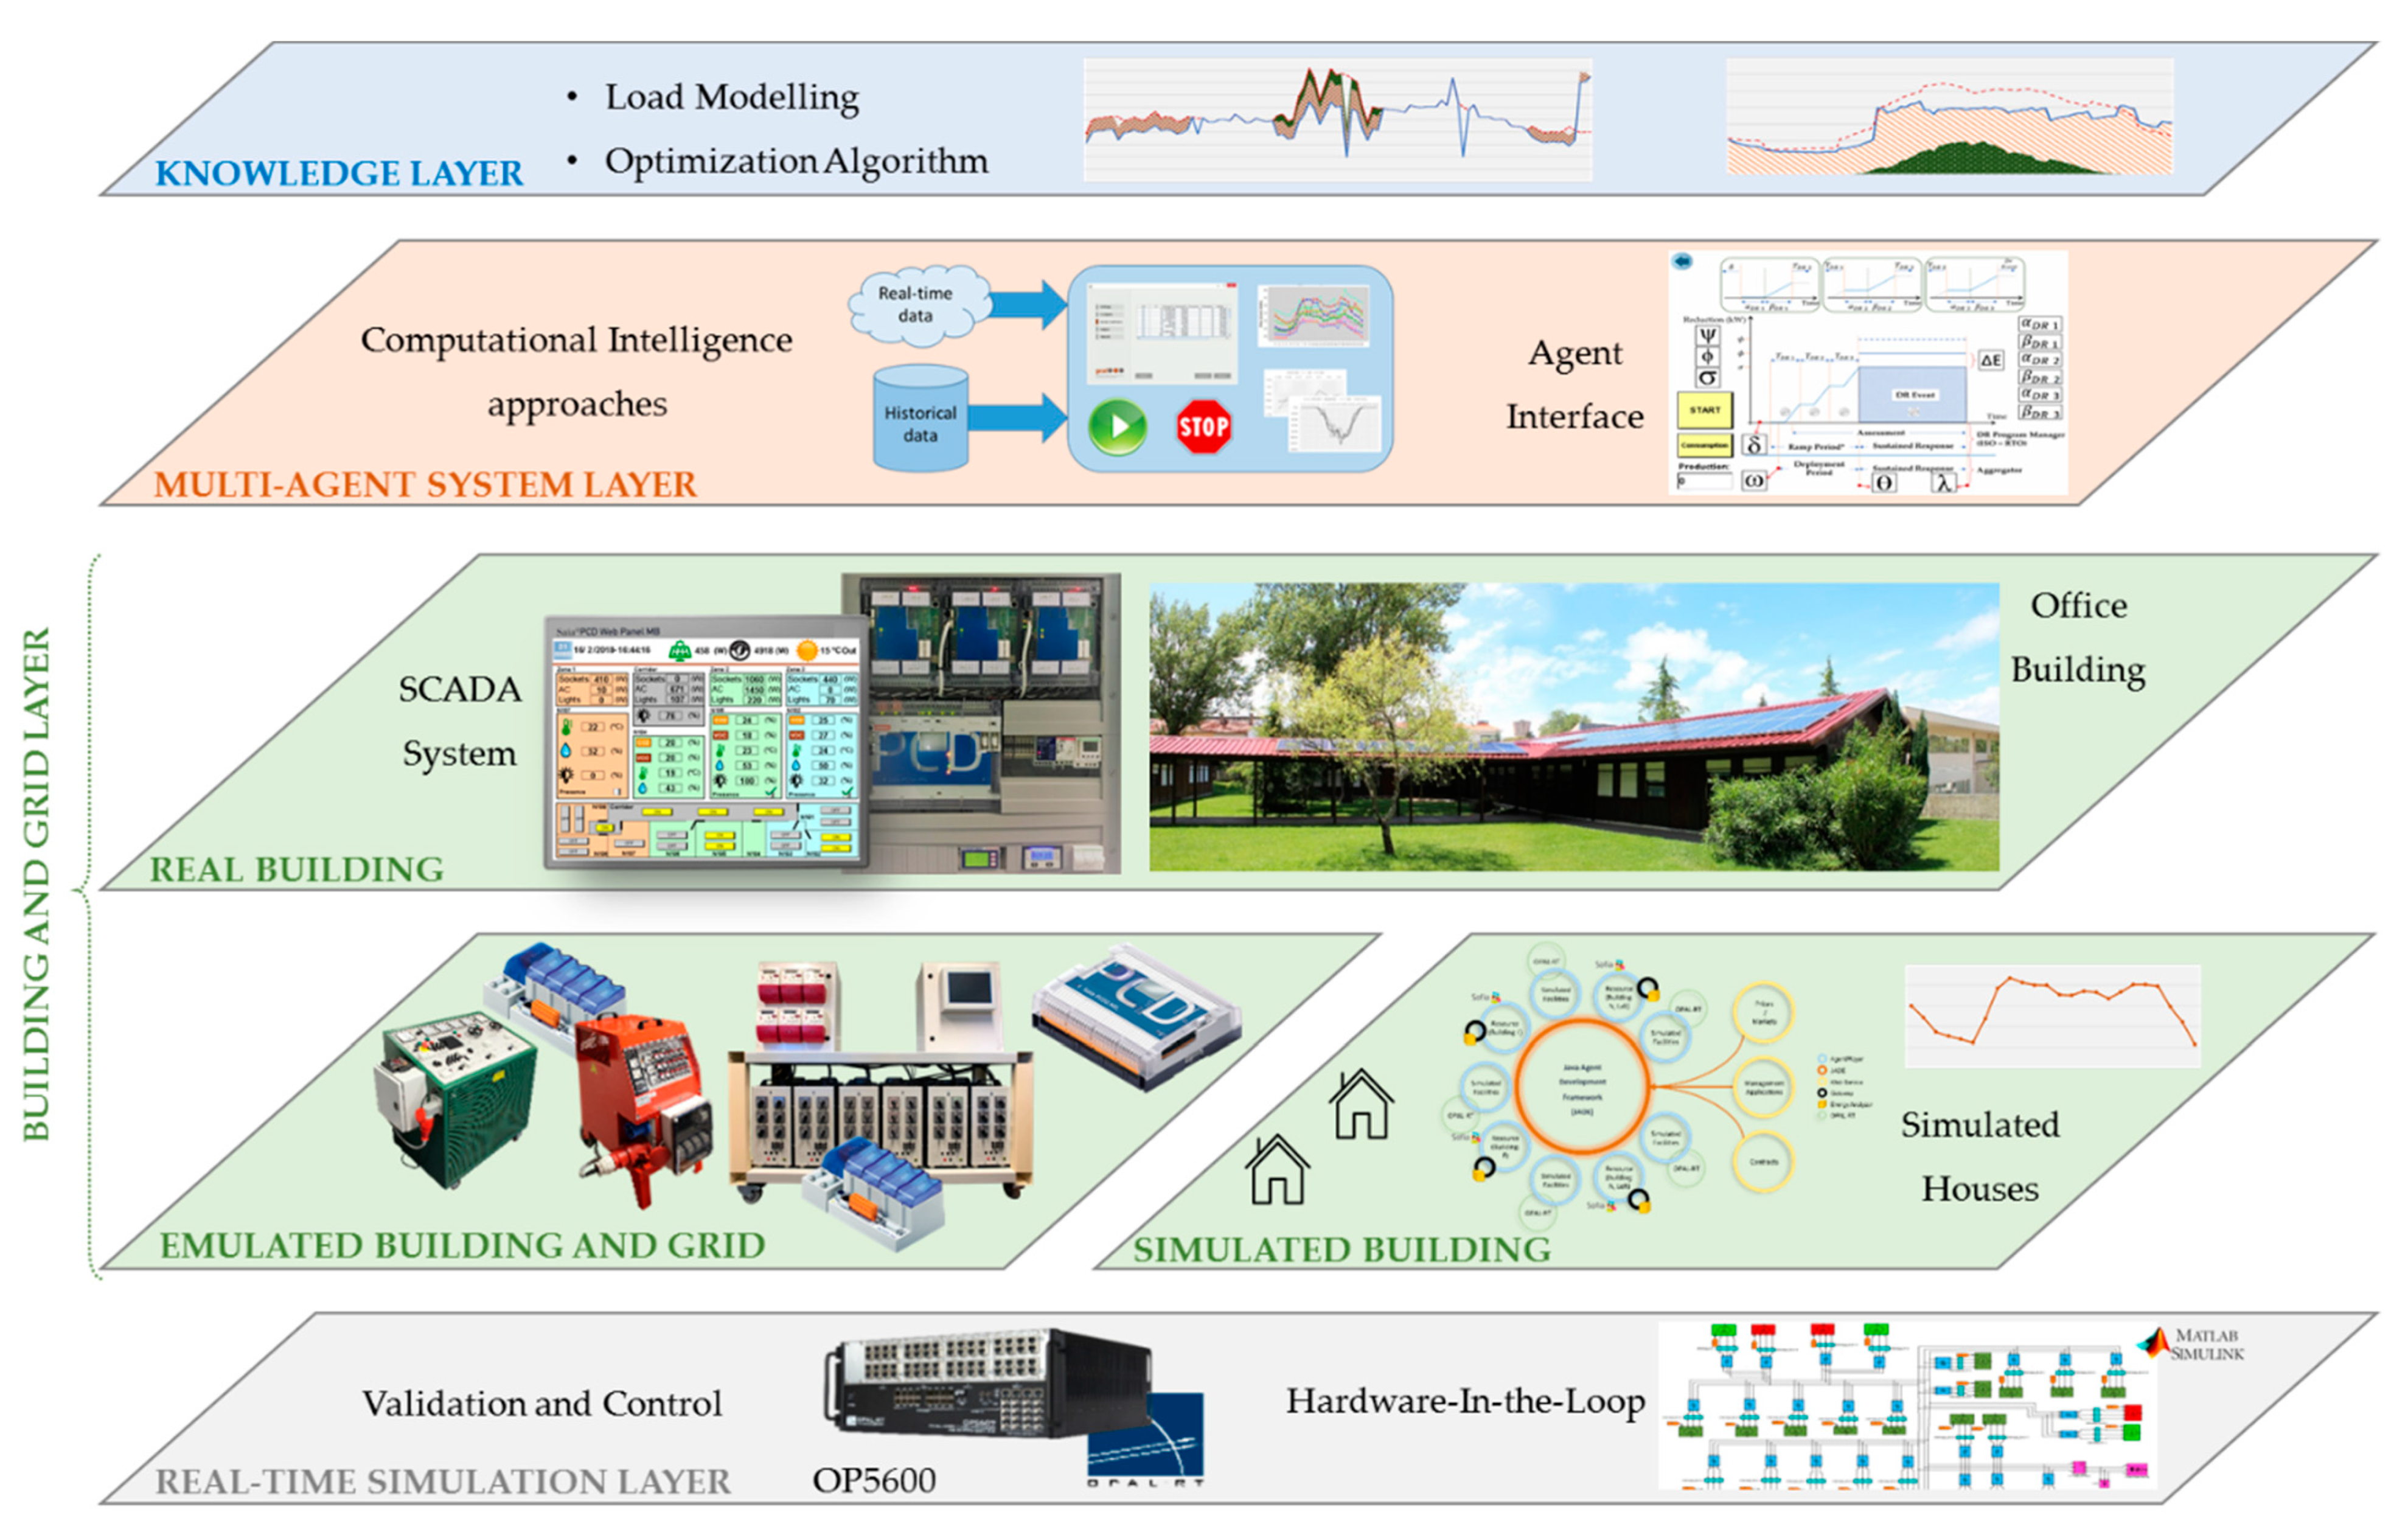
Figure 1. MARTINE (Multi-Agent based Real-Time INfrastruture for Energy) structure and components.
Energies 14 01820 g001
Figure 2. Overall view of the designed model.
Energies 14 01820 g002
Figure 3. Flowchart of energy scheduling process in the developed agriculture irrigation model.
Energies 14 01820 g003
Figure 4. Input data for the case study: (A) photovoltaic (PV) production and (B) electricity market prices.
Energies 14 01820 g004
Figure 5. Energy scheduling results adapted from the algorithm for a period of 15 min.
Energies 14 01820 g005
Figure 6. Experimental results adapted from emulators: (A) synchronous generator and (B) wind turbine emulator.
Energies 14 01820 g006
Figure 7. Irrigation system consumption breakdown by generation source.
Energies 14 01820 g007
Figure 8. Architecture of the implemented model for ramping of the DR program.
Energies 14 01820 g008
Figure 9. Experimental results adapted from the emulators during the case study.
Energies 14 01820 g009
Figure 10. Consumption reduction in the commercial building during ramping of DR event.
Energies 14 01820 g010
Figure 11. Implemented power hardware in the loop (PHIL) methodology using OP5600 and power amplifier.
Energies 14 01820 g011
Figure 12. Experimental results from the OP5600 for different frequency and voltage levels.
Energies 14 01820 g012
Publisher’s Note: MDPI stays neutral with regard to jurisdictional claims in published maps and institutional affiliations.