Article

Grid Support with Wind Turbines: The Case of the 2019 Blackout in Flensburg

1
Wind Energy Technology Institute, Flensburg University of Applied Sciences, 24943 Flensburg, Germany
2
Stadtwerke Flensburg GmbH, Grids, 24939 Flensburg, Germany
*
Author to whom correspondence should be addressed.
Energies 2021, 14(6), 1697; https://doi.org/10.3390/en14061697
Submission received: 24 February 2021 / Revised: 11 March 2021 / Accepted: 15 March 2021 / Published: 18 March 2021
(This article belongs to the Special Issue Grid Services with Wind Turbines and the Resulting Mechanical Loads)

Abstract

:
The work presented in this paper aims to show how modern wind turbines can help to control the frequency in a small grid which suffers from large power imbalances. It is shown for an exemplary situation, which occurred in Flensburg’s distribution grid in 2019: a major blackout, which occurred after almost two hours in islanding operation, affecting almost the entire distribution grid, which supplies approximately 55,000 households and businesses. For the analysis, a wind turbine model and a grid support controller developed at the Wind Energy Technology Institute are combined with real measurements from the day of the blackout to generate a fictional yet realistic case study for such an islanding situation. For this case study, it is assumed that wind turbines with grid support functionalities are connected to the medium voltage distribution grid of the city. It is shown to what extent wind turbines can help to operate the grid by providing grid frequency support in two ways: By supplying synthetic inertia only, where the wind turbines can help to limit the rate of change of frequency in the islanded grid directly after losing the connection to the central European grid. In combination with the primary frequency control capabilities of the wind turbines (WTs), the disconnection of one gen set in the local power station might have been avoided. Furthermore, wind turbines with primary frequency control capabilities could have restored the grid frequency to 50 Hz shortly after the islanding situation even if the aforementioned gen-set was lost. This would have allowed connecting a backup medium voltage line to the central European grid and thereby avoiding the blackout.

1. Introduction

Modern power systems with high penetration of inverter-based renewables are bound to exhibit little system inertia [1]. To avoid unfavorable excursions of the grid frequency and high rates of change of frequency (RoCoFs), system operators will require the provision of grid frequency support from renewables. Such grid support is already mandatory in some grids for instance in Ireland [2], Québec [3], or India [4]. To fulfill these requirements, wind turbine (WT) manufacturers, as well as academics, have developed various methods of grid support for WTs. Control options developed by manufacturers are usually tailored to the needs of a specific grid (e.g., Enercon for Hydro-Québec [5]) while academia follows a more general approach. A good overview of current control strategies to provide synthetic inertia and primary frequency response is given by Díaz-González et al. [6] and by Fernández-Guillamón et al. [7]. In an electrical grid large power imbalances i.e., the difference between generation and consumption, can cause heavy excursions of the grid frequency. Such contingencies may be caused by the failure of a large power plant, a large line but also by a system split. The ENTSO-E regards a system split as a major threat for the continental European grid [8]. In case of a system split, the power imbalances may reach up to 40% of the generated power [9]. Just recently the European grid was split into two parts during which a blackout could be avoided [10]. However, a system split may cause a devastating blackout as in Italy 2003 (affecting 56 Million people) [11]. Blackouts may also be triggered by a combination of market effects and technical problems as recently seen in Texas [12]. In addition to technical solutions, a different market design may also help to mitigate such imbalance situations: Borowski [13] proposes a different model for the electricity market which may send price signals depending on the local situation and thus helping during times of high imbalances. Blackouts may have devastating economic effects: Yamashita et al. report a range for the lost gross domestic product between $3.53 and $39.7 for every undelivered kWh [14].
System splits may also occur locally, leaving a local, islanded grid without connection to the rest of the system. Such an incident occurred in Flensburg on 9 January 2019. On that morning, Flensburg’s electricity demand was covered by two coal-fired gen sets (Generator 7 & 9) and one combined cycle gen set in the local power station, of the latter only the gas-fired gen-set (Generator 12) was connected to the grid (see Figure 1).
Stadtwerke Flensburg (SWFL) operates the power station as well as the distribution grid in Flensburg. While exporting a large share of the generated power to Denmark, the connection to the Danish grid was lost due to a cable failure. Consequently, the connection to the German grid was also lost, leaving the islanded grid with a large power surplus. This caused a strong acceleration of the generator rotors resulting in a high RoCoF (see Figure 2b), which in return triggered protection systems of Generator 12. Such a combination of an initial event and following failures of other grid components has been often observed during a major blackout in the past [14].
Loosing Generator 12 was problematic as this generator unlike the two remaining generators is capable of providing primary frequency control (PFC). The loss of Generator 12 and the increase of the electricity consumption in the morning hours caused a power deficit. Consequently, the grid frequency slowly (see Figure 2a). Over the next 75 min, the SWFL used cascaded load shedding for parts of the city to stabilize the frequency but eventually had to disconnect almost all remaining customers from the grid. After stabilizing the grid frequency, a backup connection to Denmark was engaged to reconnect to the central European grid and to end the blackout, approximately three hours after the initial incident (see Figure 2a).
This paper investigates whether wind turbines (WTs) with grid support capabilities would have been able to prevent the blackout. For this purpose, it is assumed that WTs would have generated a part of the electricity on 9 January 2019; the power plant’s production would have been accordingly lower. In three different scenarios, the WTs would be equipped with different functionalities to support the grid frequency. The goal is to avoid the blackout either by keeping Generator 12 synchronized with the grid or by a fast reconnection via the back-up line to the Danish 60 kV grid.
There is plenty of literature on grid support with WTs. However, these publications usually test the developed controller with reference cases (e.g., [15]) or focus on a comprehensive study of grid behavior rather than the WT behavior [16]. Ela et al. study the WT dynamics during system disturbances with measured data but the considered data lacks the severity of a blackout event [17]. Therefore, this paper aims to close this gap by using real data of a severe incident in combination with a reasonable model to study the WT dynamics. Furthermore, the performance of the variable H controller developed at the Wind Energy Technology Institute (WETI) is shown during a localized event in a small grid. This allows not only accessing the control performance with respect to the WT but also with respect to grid frequency stabilization with little uncertainty for the wind conditions and grid participants.
Section 2 of this paper describes the used WT model, the controller capabilities, and the applied grid model. Furthermore, the blackout event and the simulated scenarios are described in detail. Section 3 presents and discusses the simulation results. Section 4 summarizes the findings.

2. Materials and Methods

2.1. Detailed Description of the Blackout

Historically, the local grid in Flensburg has a strong connection to the Danish grid via a large 150 kV cable/line connection to the Aabenraa power station. Furthermore, there is a 110 kV connection to the German grid via one phase angle regulating transformer (quadrature booster) and a 60 kV back-up connection to the Danish distribution grid (see Figure 1). The power station in the city consists of four gen-sets: three coal-fired steam turbines and one combined cycle gas turbine.
In the early hours of 9 January 2019, approximately 57% of the generated electricity was consumed in the city while the rest was exported to Denmark via the aforementioned 150 kV cable-line connection (see Figure 1). Generator 7 & 9 (coal-fired) and Generator 12 (gas-fired) produced the power.
At 06:18:55 there was a short-circuit between one of the phases in the 150 kV cable and earth. Protection relays triggered and isolated the faulty phase immediately (see Figure 2b). Approximately one second later an automatic reclose of the circuit breakers was attempted. As the short-circuit remained, the complete 150 kV cable was isolated by automatically opening the circuit breakers (see Figure 2b). Consequently, the connection to the German high-voltage grid was also lost and the distribution grid worked as an islanded grid with a massive surplus (approximately 43%) of generated power. This caused a strong acceleration of the generator rotors resulting in a high RoCoF (up to 1.8 Hz/s), which in return triggered protection systems of Generator 12. Hence, Generator12 disconnected itself from the grid approximately 70 ms after losing the 150 kV connection to Denmark. The sudden changes of the electrical torque caused oscillations in the generator rotors of the two remaining generators as typical for a directly connected synchronous generator after a sudden change of the operating point [18]. As Generator 7 & 9 did not work at rated active power at the moment of islanding, their power could be increased (see Table 1). This allowed stabilizing the frequency for some time (see Figure 2a). However, after approximately 15 min the electricity demand rose so much that cascaded load shedding was inevitable. The exact load shedding sequence is described in Thiesen and Jauch [19].
After the cascaded load shedding did not decrease the power demand sufficiently to increase the grid frequency back to 50 Hz, the SWFL disconnected almost the entire city. In the next 80 min, the operating points of the generators were adjusted such that the grid frequency eventually stabilized and the 60 kV back-up connection to Denmark could be engaged to resynchronize with the central European grid. In this paper, three strategies are researched, which could have helped to avoid the blackout. All scenarios work with a fictive case in which part of the power in the islanded system is produced by WTs instead of by the fossil-fueled power station:
  • Scenario I: WTs supplying synthetic inertia (SI) could have lowered the high RoCoF, which occurred immediately after the system split. This might have kept the gas-fired gen-set connected to the grid and thereby the grid frequency could have been controlled because Generator 12 is capable of PFC.
  • Scenario II: As in scenario I, the goal is to keep Generator 12 connected to the grid. In addition to scenario I, the WTs also supply PFC. As there was an excess of power in the islanded grid the WTs could have reduced their power rapidly and thus allowing a longer reaction time for Generator 12 than in scenario I.
  • Scenario III: In this scenario, losing Generator 12 is accepted. The goal is to increase the grid frequency back to 50 Hz in the first minutes after the system split and keep it there long enough to allow a reconnection with the central European grid via the 60 kV back-up connection to Denmark (see Figure 1). To achieve that the WTs must be able to provide PFC and they must be curtailed before the event. This scenario is similar to the situation in Ireland, where the system operator is allowed to require such curtailment during times of volatile grid frequency [2]. WT curtailment due to feed-in management is common in the federal state surrounding Flensburg [20]. Hence, in strong wind conditions, some level of curtailment is to be expected, which may be used for PFC provision. As in scenarios I & II, the WTs also provide SI.

2.2. Grid Model, Wind Turbine Model, and Frequency Support Controller

The behavior of the WT, its capability to provide frequency support in extreme situations, and the consequences for the WTs are the focus of this paper. Hence, a complex model of the WT is used in combination with a simple model of the grid for representing the behavior of the grid frequency.

2.2.1. Grid Model

In an AC power system, the grid frequency depends on the balance of generated and consumed power as well as the inertia of the grid [18]. The relation can be expressed by the so-called swing equation:
δ f g r i d , t δ t =   P g e n , t P l o a d , t 4   π 2   · f g r i d , t   · J g r i d , t
where δfgrid,t/δt is the RoCoF, Pgen,t is the sum of all generated (and imported) power, Pload,t is the sum of all consumed (and exported) power, fgrid,t is the grid frequency and Jgrid is the sum of the inertia of all grid participants. The generation and consumption changes constantly. By contrast, the grid frequency changes typically only in a small interval (in extreme cases +/− 800 mHz [9]) and is therefore almost constant. The grid inertia changes only whenever grid participants (generators or rotating loads) are connected or disconnected. Furthermore, a self-regulation factor is considered for the loads: its power changes with 2%/Hz which is in line with ENTSO-E recommendations [9].

2.2.2. Wind Turbine Model and Frequency Support Controller

The WTs are simulated with the so-called 1st eigenmodes model developed at the WETI [21]. The model allows simulating the most important degrees of freedom of a WT, i.e., two-directional motions of tower and blades, as well as the torsional movement of the drive train. The flywheel in the model of the WT rotor [21] is disabled, such that the model represents a state-of-the-art WT. Furthermore, the power controller is adapted as described below to allow providing SI with the variable-H controller [22] and PFC as defined in the Irish grid code [2]. In this study, the parameters of the NREL 5 MW research WT are used [23].
The power controller of the WT is modified to allow SI and PFC provision (see Figure 3). Hence, the power reference for the WT is calculated using three terms as explained below (see also three shaded areas in Figure 3).
  • Power-vs-speed characteristic: If a WT operates in part load, there is an optimal combination of generator speed and generator power to maximize the aerodynamic performance of the WT. If all grid support functionalities are disabled, the power setpoint of the WT is determined by the optimal power (Popt).
  • SI provision: Whenever a non-zero RoCoF is detected the WT alters its power output from the optimal aerodynamic value to support the grid frequency. To provide a reliable SI provision and safe operation of the WT the variable H controller is used [22]. The power change is described by equation (2) [22]:
    P S I = 2   ·   H v a r ·   P r a t e d ·   R o C o F f g r i d
    where PSI is the power change for SI, Hvar is the variable inertia constant and Prated is the rated power of the WT. The variable inertia constant scales with the operating point of the WT in accordance with the available kinetic energy stored in its rotation (see (3); [22]).
    H v a r = H d e m ·   0.5   ·   J W T   ·   ( ω g e n 2   ω c u t i n 2 ) 0.5   ·   J W T   ·   ( ω r a t e d 2   ω c u t i n 2 )
    where Hdem is the inertia constant to be emulated as defined by the grid operator, ωgen is the generator speed, ωcut-in is the generator speed at which the WT starts to produce power, and ωrated is the rated generator speed of the WT.
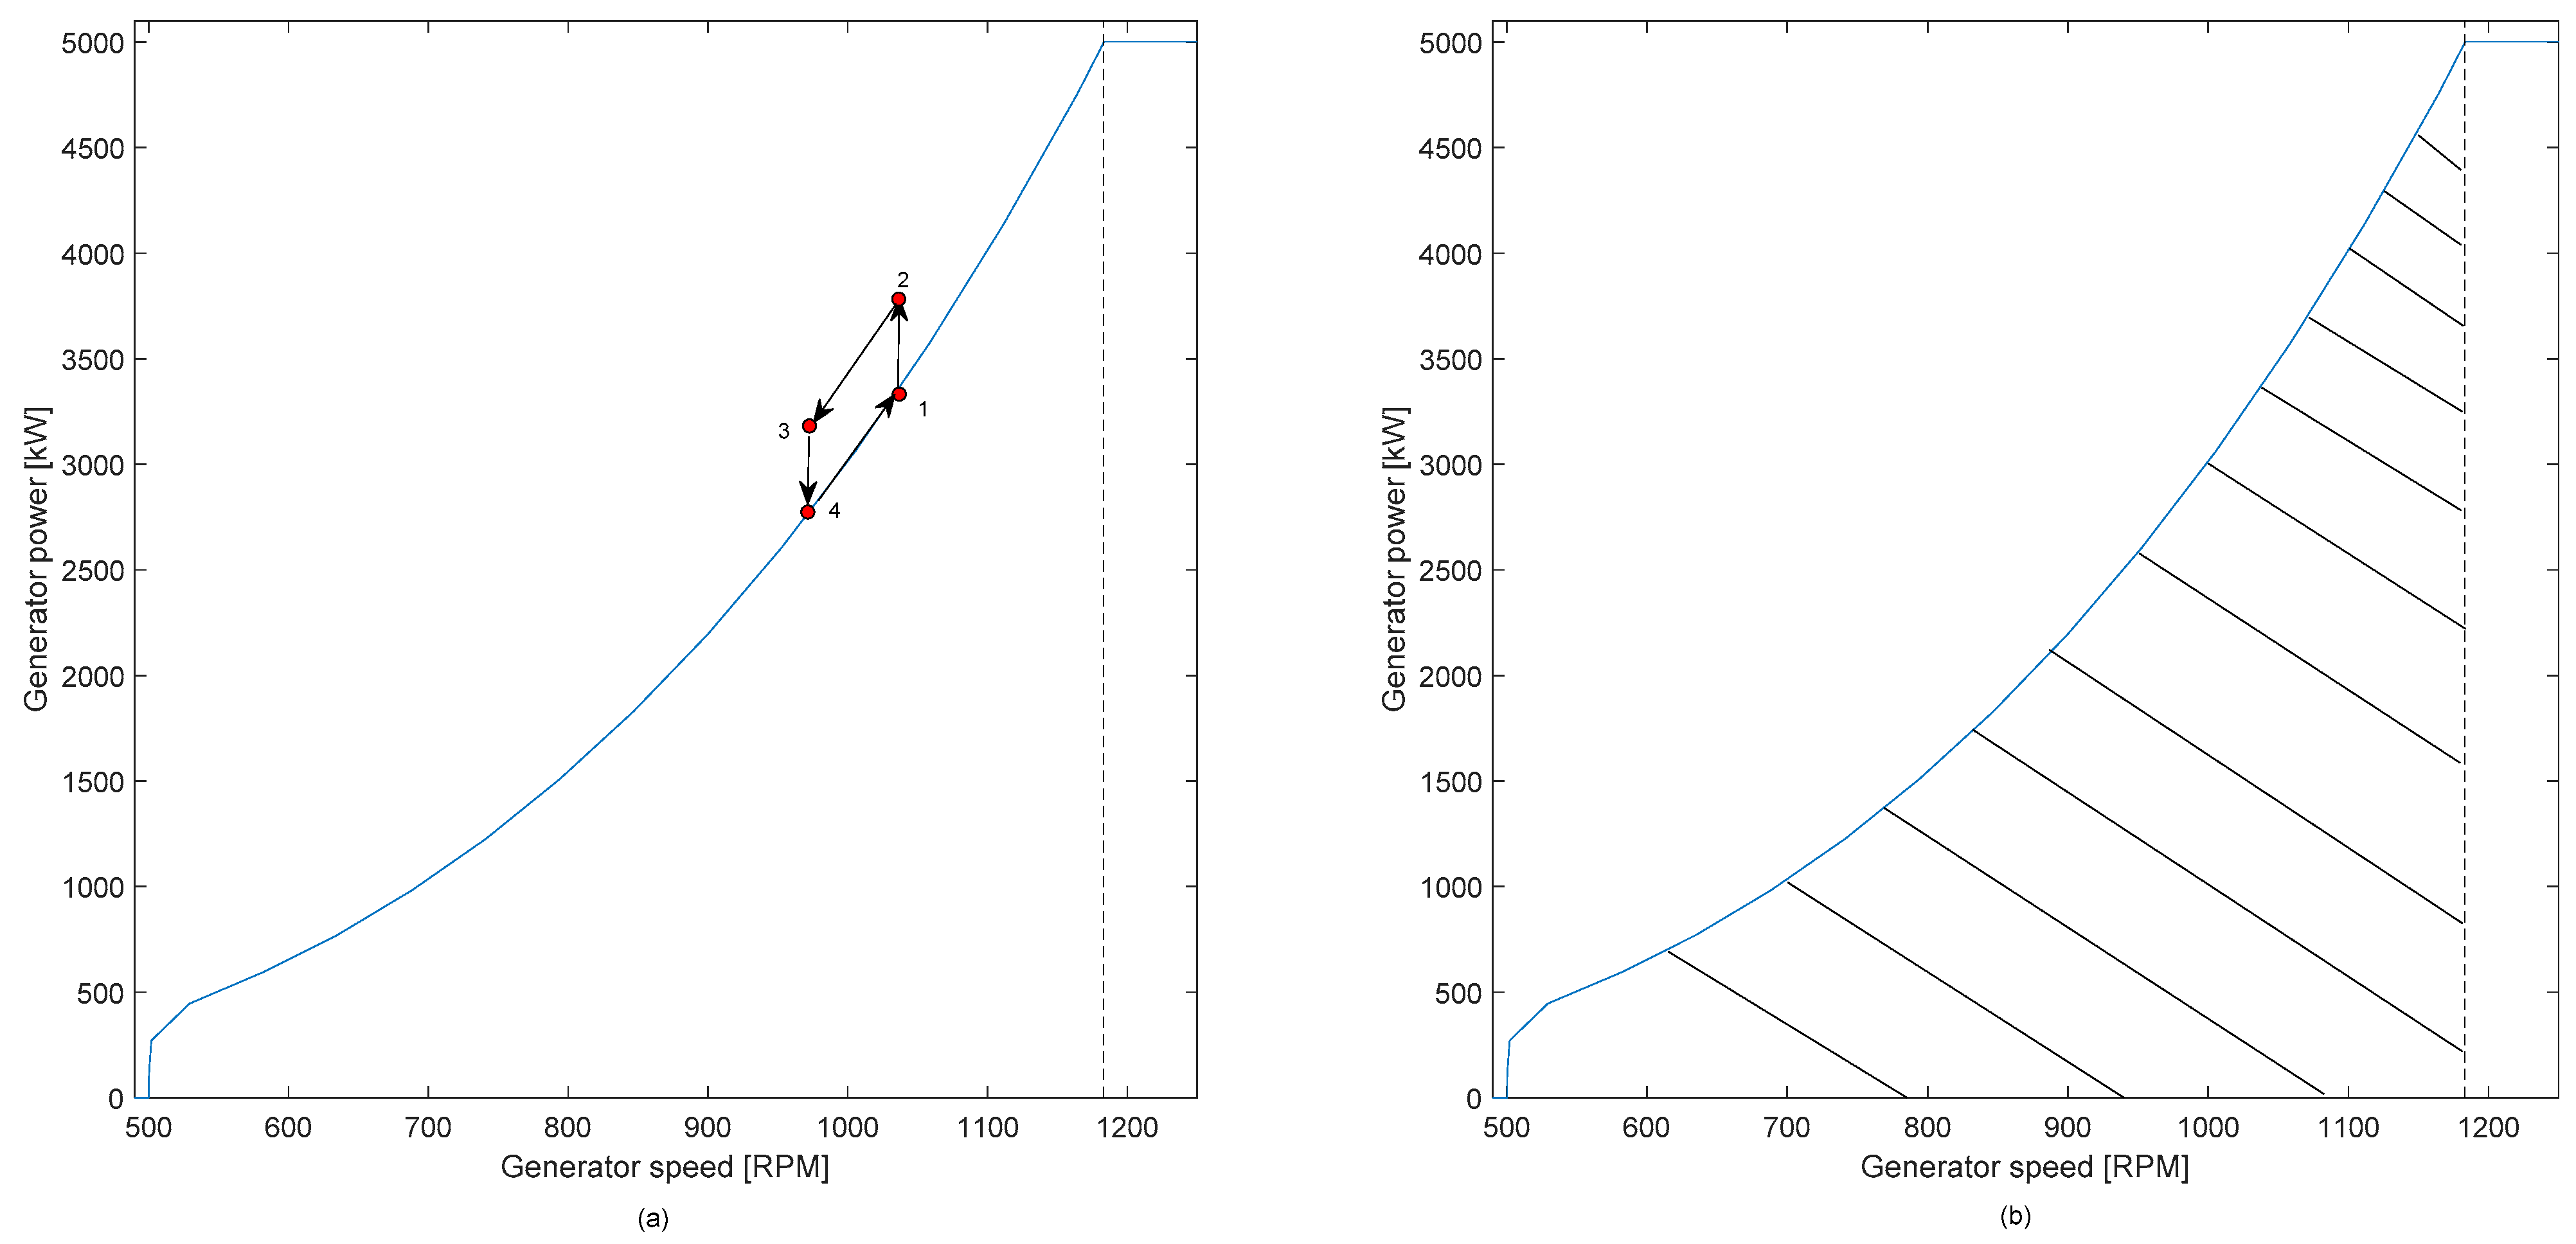
    Figure 4a depicts the transient behavior of the WT during a negative RoCoF event. The WT leaves the steady-state value (point 1) by producing additional power (point 2). As the electrical power is temporarily higher than the aerodynamic power, the WT uses some of the kinetic energy stored in its rotation and the generator slows down (point 3). The power output of the WT is still higher than the optimal value according to the power-vs-speed characteristic but not necessarily higher than in point 1. When SI is no longer needed the WT falls back to the power-vs-speed characteristic (point 4). Assuming stable wind conditions the WT would return to point 1 as the aerodynamic power is now higher than the electrical power. Obviously, the exact behavior of the WT depends on several factors, most prominently the wind conditions and the severity of the frequency event. More detailed explanations of the aerodynamics during the transient operation of the WT can be found in [22].
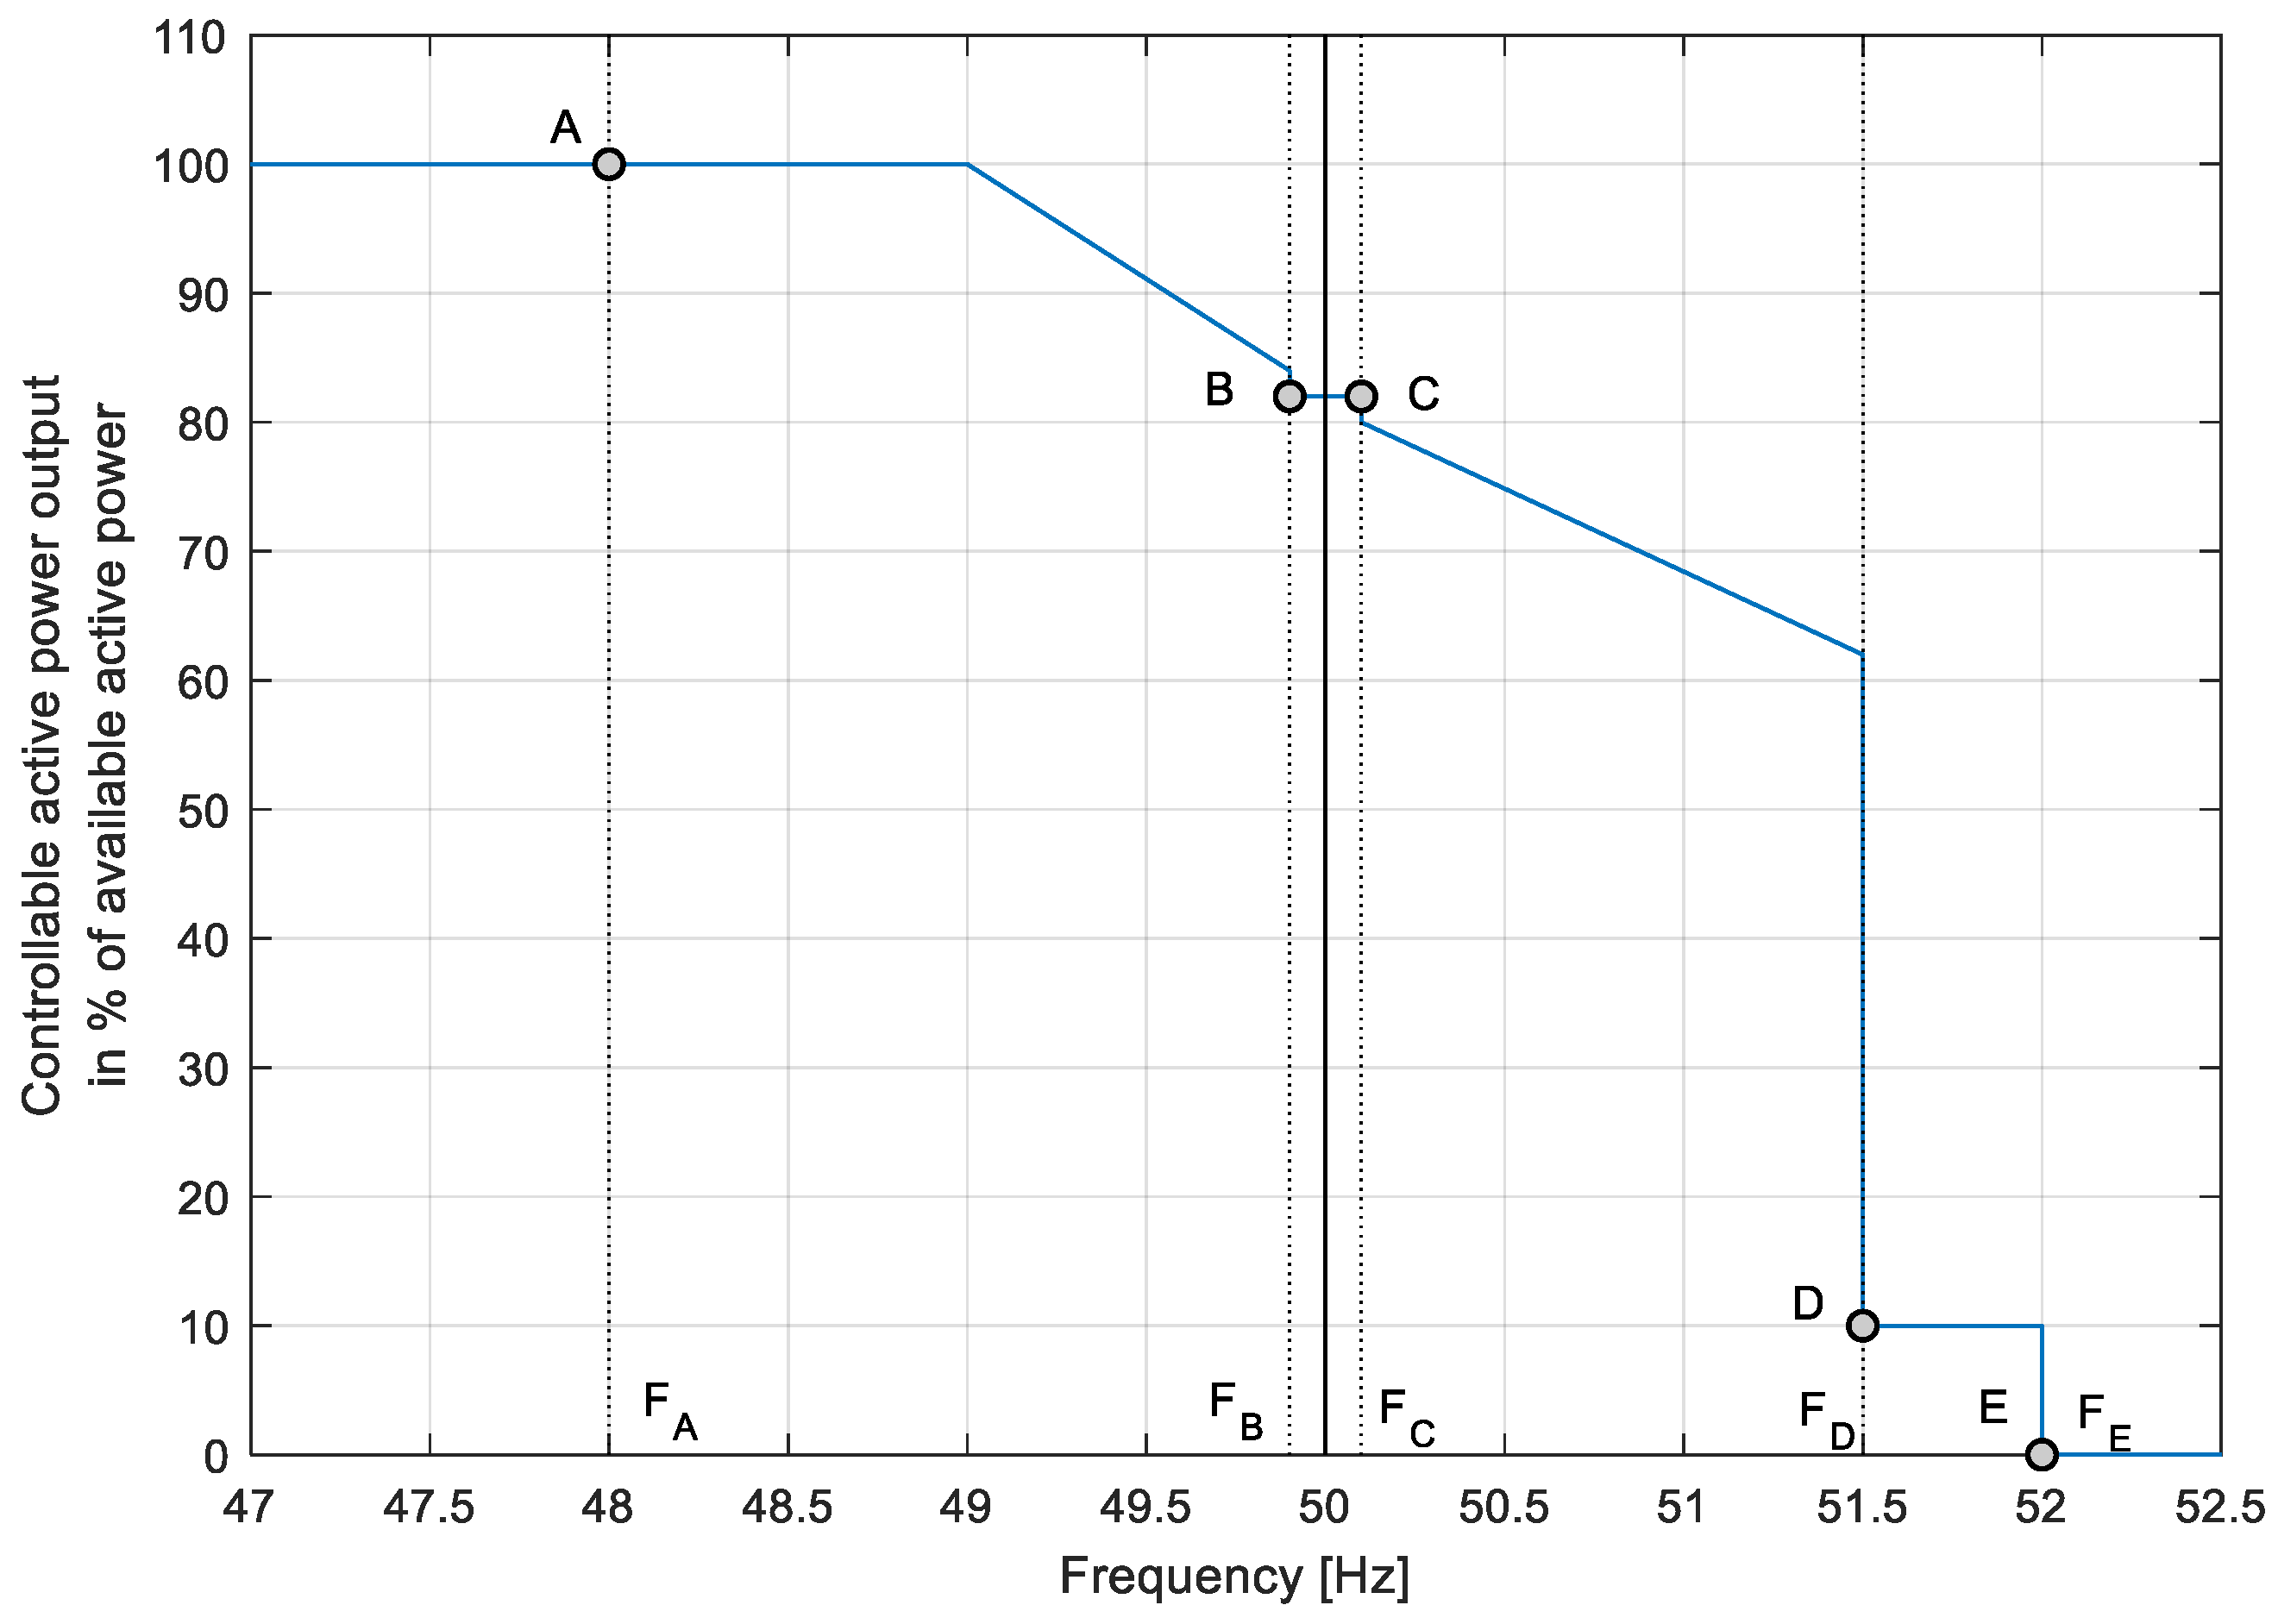
  • PFC: In addition to SI, the WT also provides PFC for scenarios II & III. The controller is modeled based on the requirements in the Irish grid code during frequency-sensitive mode [2]. The grid operator is allowed to curtail the WTs to a certain percentage of the available power. This allows increasing the power output of the WT whenever the grid frequency drops below the insensitivity band (see Figure 5). The curtailment of the WTs is lowered in accordance with the so-called droop characteristic. For high frequencies, the curtailment is increased. The curtailment factor resulting from this power-vs-frequency characteristic is hereafter called ηPFC and is used to scale the output of the power-vs-speed characteristic. When the WT is curtailed in part-load operation, a prolonged curtailment will cause the WT to run at super optimal speed as the aerodynamic power exceeds the electrical power (see the shaded area in Figure 4b). Furthermore, a prolonged curtailment imposes a significant financial burden on the WT operator due to the lower energy yield.
When the grid frequency support is activated, the power reference of the WT, Pref, is calculated as a combination of the three effects described above: (see (4) and Figure 3):
P r e f = P o p t · η P F C +   P S I
The PI controller is used to derive the setpoint for the generator-converter model (PT1 element) from the power reference (see Figure 6 and [24]). The parameters for the generator-converter model and the PI power controller are taken from [24].

2.3. Detailed Scenario Description and Used Data

For the scenario development, data provided by the SWFL are combined with measurements taken at WETI. Table 2 gives an overview of the settings used in the different scenarios. The simulations for scenarios I & II start shortly before the initial short-circuit (see Figure 2b). By contrast, scenario III starts after the transient phase of the grid frequency (see Figure 2b), as the frequency measurement is unreliable during the voltage dips [25] and afterward dominated by the pole angle oscillations.
The assessment criteria for the three scenarios are:
  • Scenario I: the instantaneous RoCoF falls below 1 Hz/s within 70 ms.
  • Scenario II: the instantaneous RoCoF falls below 1 Hz/s within 70 ms & the grid frequency stays below 51.5 Hz for at least 30 s.
  • Scenario III: the grid frequency can be increased to 50 Hz and be stabilized within 50 Hz +/− 10 mHz for as long as possible.
For all scenarios, various simulations were conducted to define the minimum number of WTs, which still allowed fulfilling the assessment criteria (see Table 2). To fulfill these criteria, the WTs have to provide a high share of the power production in scenarios I & II. The simulation time is adapted to the assessment criteria of the scenarios. In addition, the effect of the frequency support on the WTs are shown.

2.3.1. Scenario Inputs

For each scenario, the power imbalance (i.e., the imbalance before the fictional WT power is added) and the grid inertia must be defined to solve (1), which allows calculating the grid frequency. Furthermore, the wind inputs must be defined.
The inertias of Generator 7 & 9 as listed in Table 1 are known from technical documentation provided by SWFL. This is also true for the inertia of the generator rotor of Generator 12. However, the inertia of the gas turbine had to be estimated with help of the known weight [26] and an assumed distance of the mass center to the rotational axis. The estimated inertia constant for the gas-fired gen-set (5.9 s) is in line with inertia values of gas-fired gen-sets reported in the literature [27]. The inertia provided by the loads is known from Thiesen and Jauch [19].
While the power production of the different generators at the power station is well known, there is a lot of uncertainty in the data for the loads. The data of the current measurements are mainly taken on the low-voltage side of the controllable transformer (see Figure 1) while the voltage measurements are taken on the high voltage side. Hence, the power imbalance cannot be calculated from the power calculated using these measurements. However, the power export is exactly known and can be used as an initial power imbalance for scenarios I & II. The power imbalance occurs once the export line to Denmark is fully disconnected (second nadir in the voltage measurements in Figure 2b). A constant power imbalance assumes that the power of the generators and the loads remain constant during the simulation. This is a conservative approach: a PFC power adjustment of Generator 12 as well as self-regulation of the loads would decrease the power imbalance and help to stabilize the grid frequency.
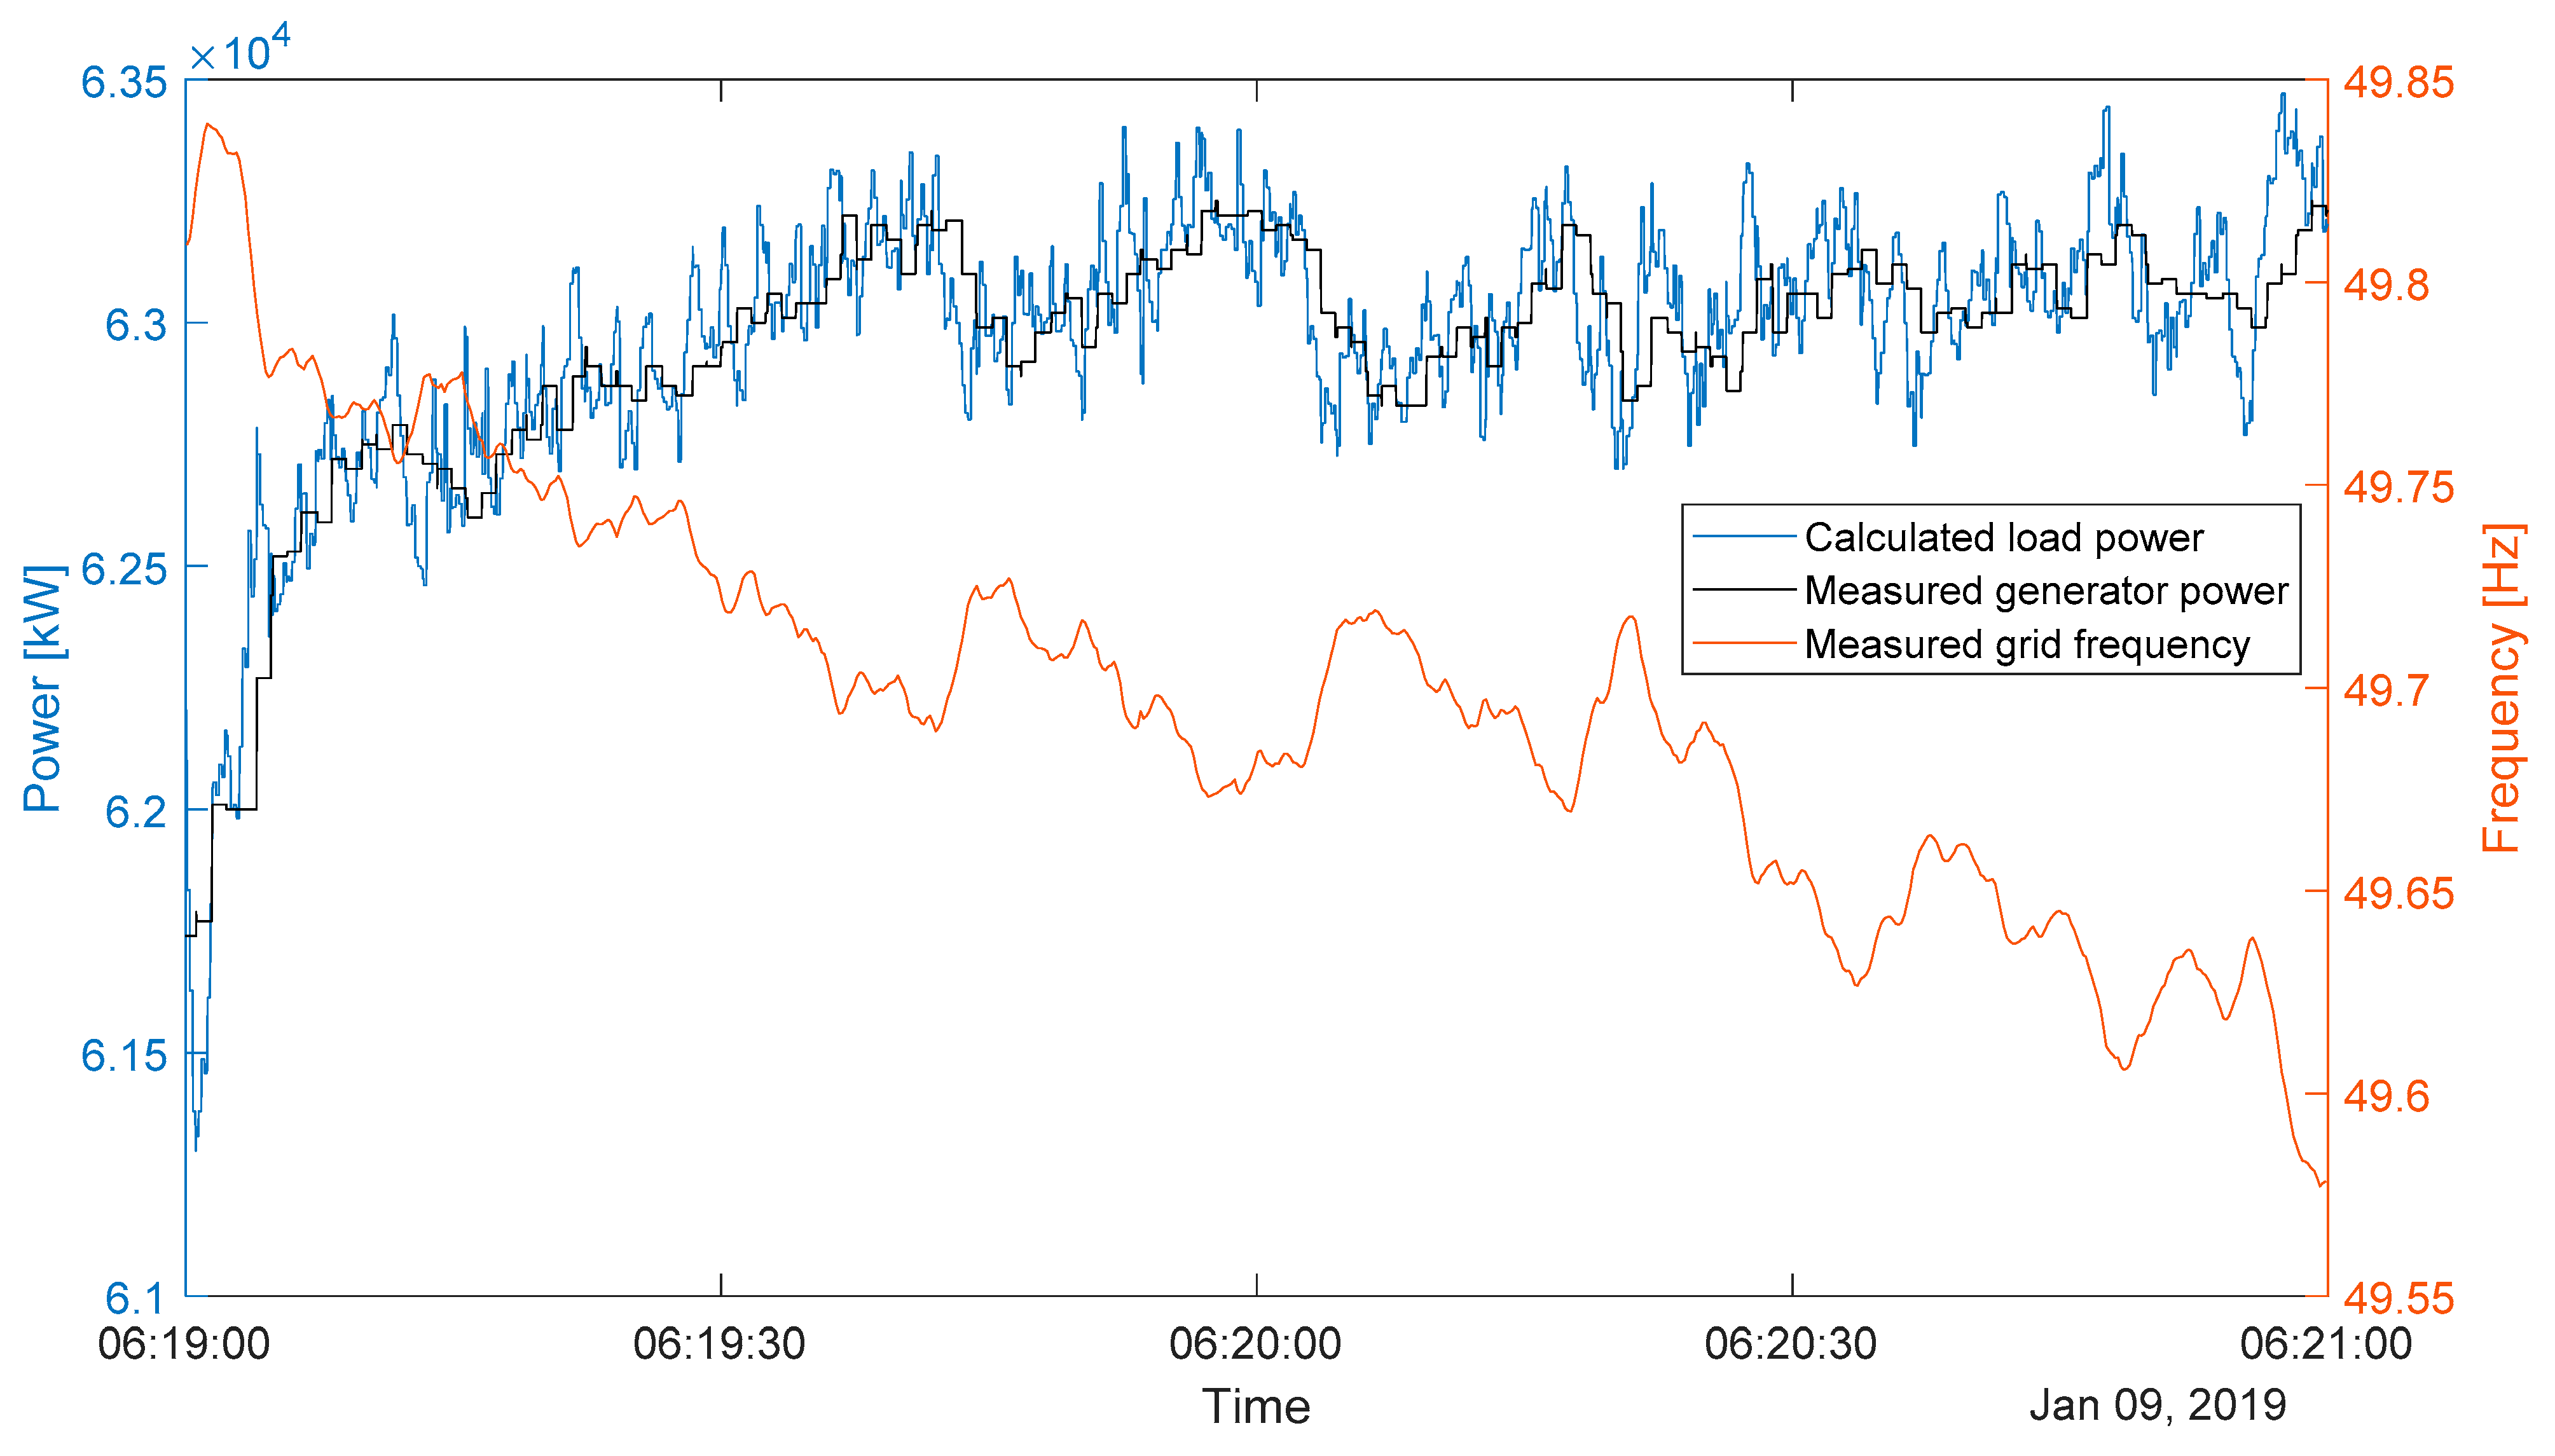
For scenario III, the self-regulation of the loads would hinder bringing the grid frequency back to 50 Hz. Hence, the load must be calculated from the available data and scaled with the grid frequency during the simulation. In a first step, the power imbalance can be calculated with the known grid inertia and the frequency measurements taken at WETI (fmeas) by solving (1) for the power imbalance. As the power production of Generator 7 & 9 is directly measured, the load is given as the difference between the total power production and the power imbalance (see (5) and Figure 7). Figure 7 shows how slowly the frequency declines. Hence, the calculated load power is most of the time slightly higher than the generator power but also falls below it occasionally.
P l o a d , t =   P g e n , t   f m e a s ,   t + 1   f m e a s ,   t Δ t   ·   4   π 2   · f m e a s , t     · J g r i d , t
Data provided by German Metrological Service, Deutscher Wetterdienst, is used to model the wind conditions in Flensburg on 9 January 2019. The hourly mean wind speed at the time of the system split was 7.9 m/s in 10 m height [28]. The wind speed at hub height can be calculated with a logarithmic wind profile [29]. It is assumed that the roughness length, z0, is 0.35 m, which is a reasonable value for the landscape and topography in the area around Flensburg [29]. Using this data the mean wind speed at the hub height (90 m) is 13 m/s. Furthermore, the turbulence intensity is assumed 0.12, which is also a reasonable value for the region. In a previous project, the measured turbulence intensity for 13 m/s average wind speed at the campus in the outskirts of Flensburg was 0.17 (based on the measurements in 50 m height) [30]. In the same project, the roughness length for the site was estimated at 1.7 m, which is a very turbulent site. Hence, the lower TI is reasonable due to the higher hub height [31] and the lower turbulence, which can be expected outside the city. Individual WTs are simulated by using independent turbulence seeds for each WT.
Currently, there is no large-scale WT directly connected to Flensburg’s distribution grid. Therefore, the analyzed scenarios are fictional. However, as the distribution grid also comprises some of the surrounding villages and dwellings, it seems feasible that WTs could be connected to the grid. Currently, there are several WTs with 25 MW installed capacity within a 10 km radius around the city center [32]. Furthermore, the installation of an additional 25 MW is planned [32]. These WTs are connected to a different medium voltage grid but show the potential for WT installations in close proximity to the city with cable length comparable to the ones in the existing grid.

2.3.2. Controller and Simulation Settings

For the frequency support controller, some settings must be chosen which are in reality defined by the transmission system operator. A reasonable approach is to choose an inertia constant, which the WTs have to emulate, in a similar range of fossil-fueled or hydroelectric power stations [33]. However, with increasing penetration of non-synchronous generation, higher inertia constants may need to be demanded to safely operate a grid in challenging situations [34]. It has also been shown that WTs can be safely operated with emulated inertia constants as high as 6 s [35] or even 12 s [24]. For this study, the demanded inertia constant was set to 12 s, which is in line with the aforementioned [24] and the findings in [34] for such high power imbalances.
Reducing the RoCoF to a value below 1 Hz/s in such a short time (100 ms) is very difficult, as the WTs have to react very fast. While the generator-converter-units have a very fast reaction time, the PI controller naturally dampens such drastic power changes. When the original settings as reported in [24] are used, the behavior of the PI controller is dominated by the anti-wind-up (AWU) loop of the integrator. Therefore, the power of the WT falls too slow to reduce the RoCoF below the threshold in the designated time. The original AWU considers the proportional controller output when limiting the integrator, such that the sum of the proportional and integral terms is the minimum power, Pmin (0 W). This has been changed such that the integrator is set to Pmin. As the sum of the proportional and integral terms can be negative, the limiter adjusts the controller output in such cases (see Figure 6).
The PFC controller settings are chosen in accordance with the requirements stated in the Irish grid code [2]. It has to be noted that these settings can change during the operation of the WTs depending on the status of the grid [2]. Especially the curtailment factor ηPFC valid for 50 Hz is adopted depending on the expected grid situation. Hence, a curtailment of the WTs as needed for scenario III would only be present in specific situations, when the grid is vulnerable. However, WTs can also be curtailed for other reasons, e.g., feed-in management, which occurs regularly in the federal state surrounding Flensburg [20]. Hence, some level of curtailment would have been likely considering the strong wind conditions on the day of the blackout even though the grid islanding was not foreseeable. In the third scenario of this study, the WTs were curtailed to 90% of the available power before the frequency event happened. For scenario II, no curtailment is needed as the power output has to be reduced to provide PFC. The droop factor is set to 2%, which is on the lower end of the range mentioned in [2] and [36] and causes a strong reaction to frequency deviations. The frequency insensitivity, i.e., the minimum detected deviation of the grid frequency for the controller to react, is set to 10 mHz [36] in scenario II and to 0 mHz in scenario III to facilitate bringing back the grid frequency to 50 Hz in the latter scenario.

3. Results

The results of the simulations show that it is theoretically possible to achieve the assessment criteria of the three scenarios with help of WTs. The results are discussed individually for each scenario below.

3.1. Scenario I

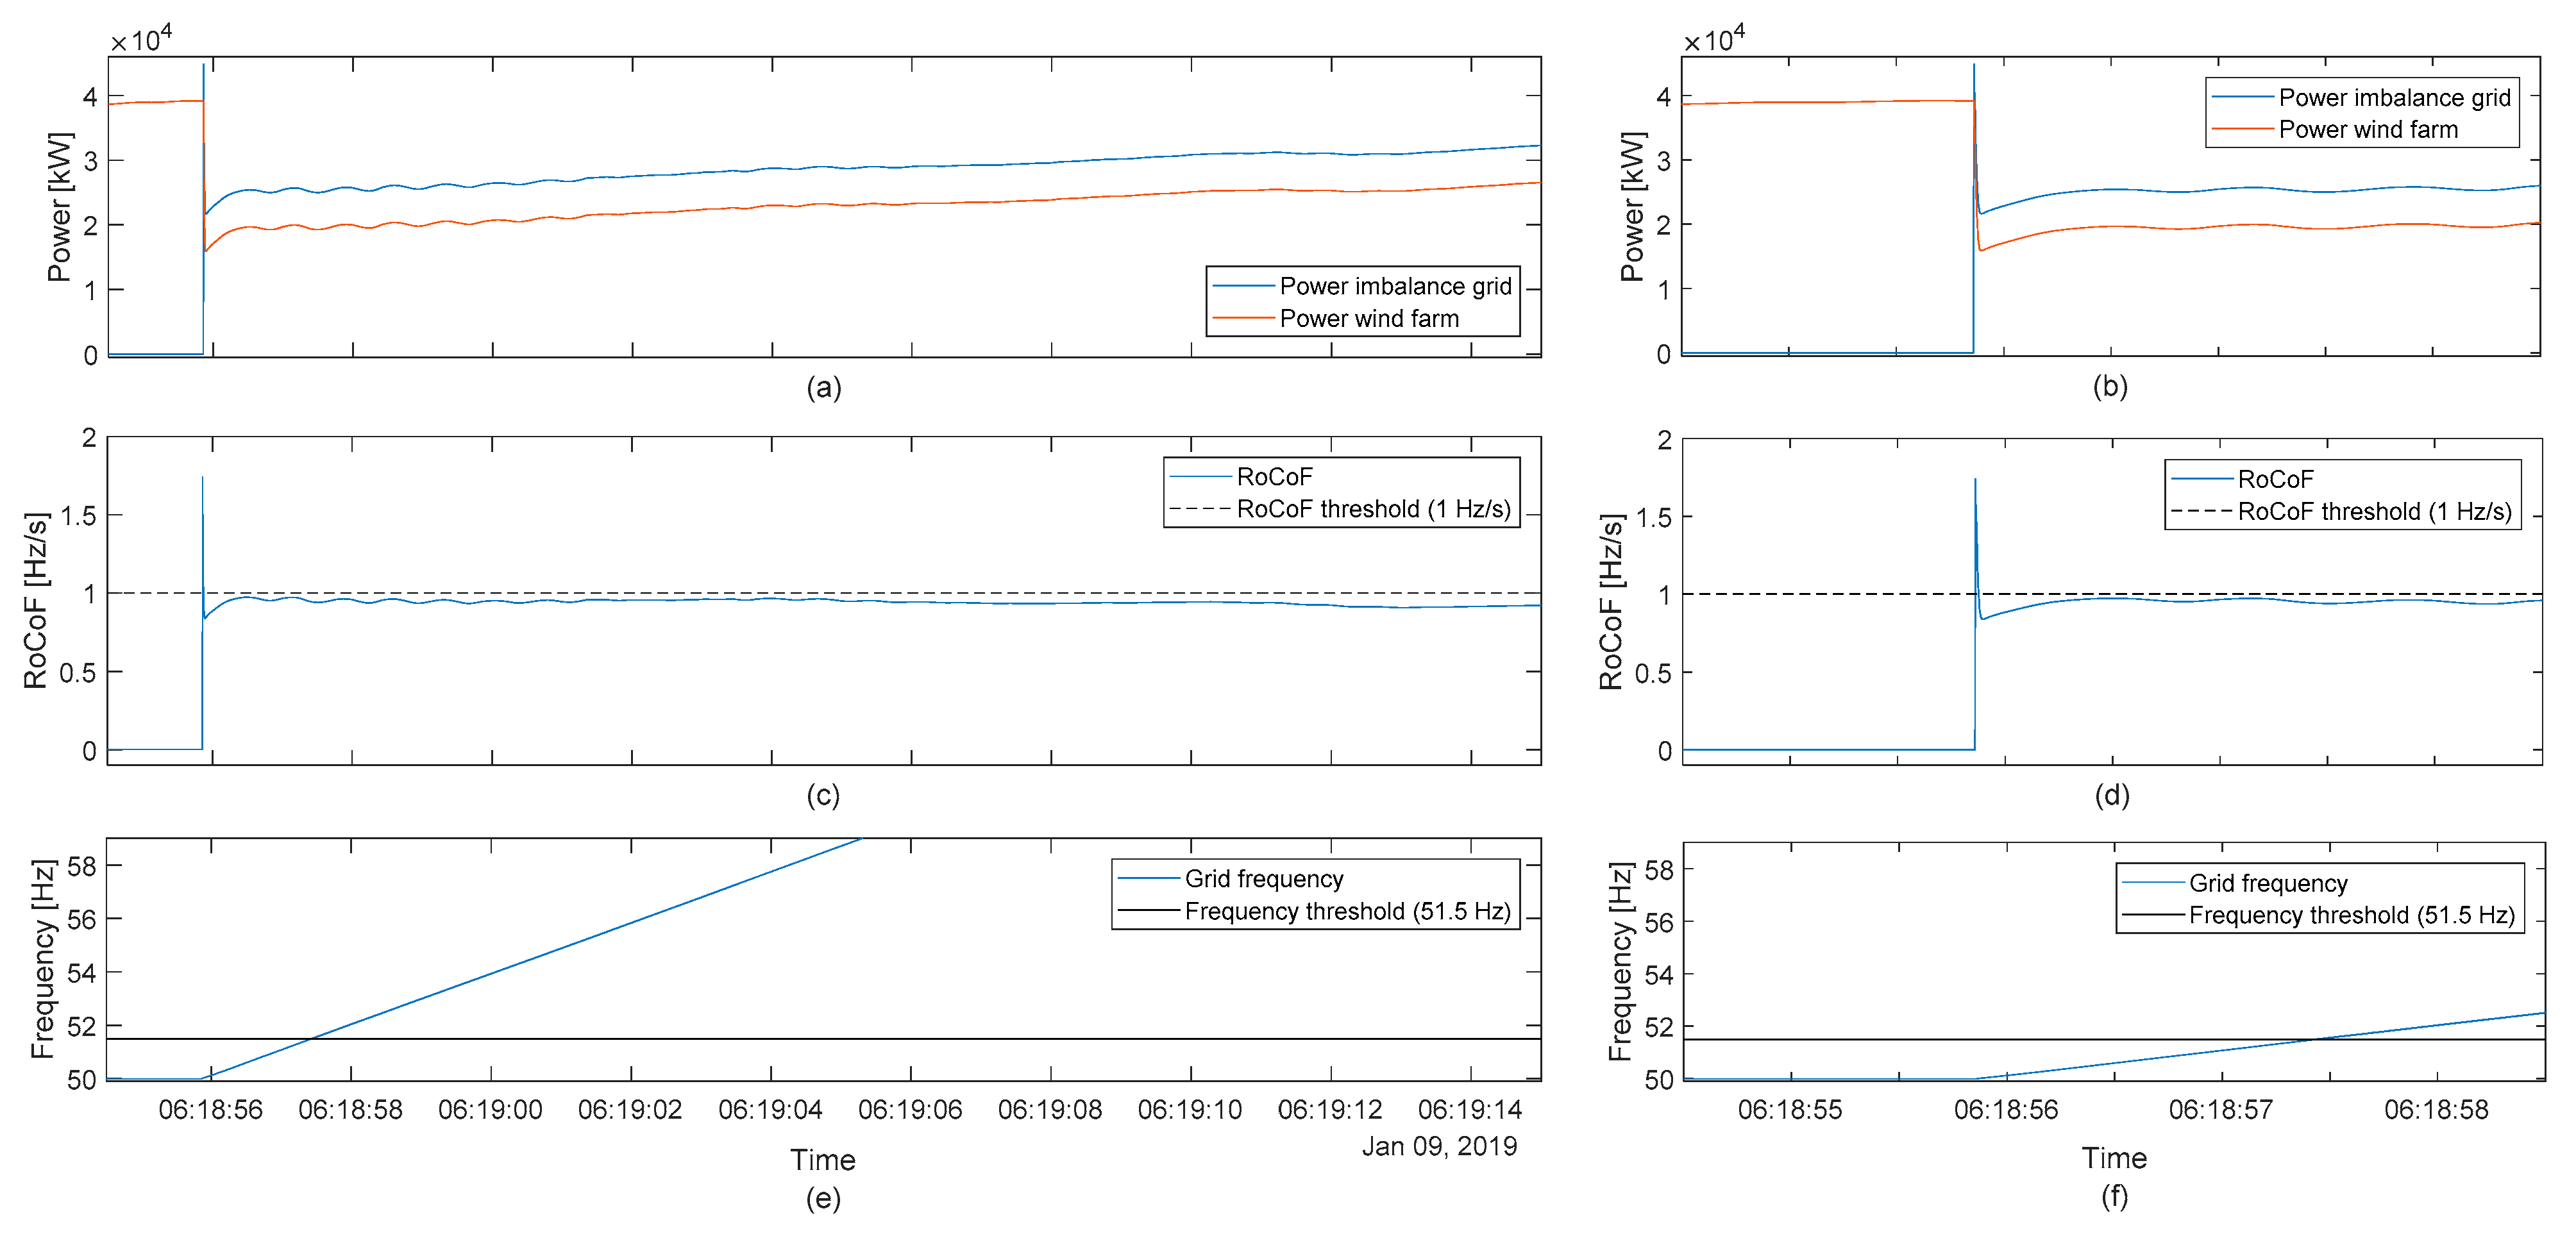
In this scenario, the eight simulated WTs lower the RoCoF below the 1 Hz/s threshold within 17 ms by reducing their power output (see Figure 8a–d). Hence, the RoCoF threshold could be reached in time even considering a time delay for detecting the frequency event due to measurement and signal processing delays in the WT. However, as the WTs only provide SI, the frequency support is not sufficient to stop the rise of the grid frequency. Hence, Generator 12 is likely to disconnect from the grid as soon as the grid frequency reaches 51.5 Hz approximately 1.5 s after the start of the islanding event (see Figure 8e,f). This time is obviously too short for the gas-fired gen set to activate its own frequency support.
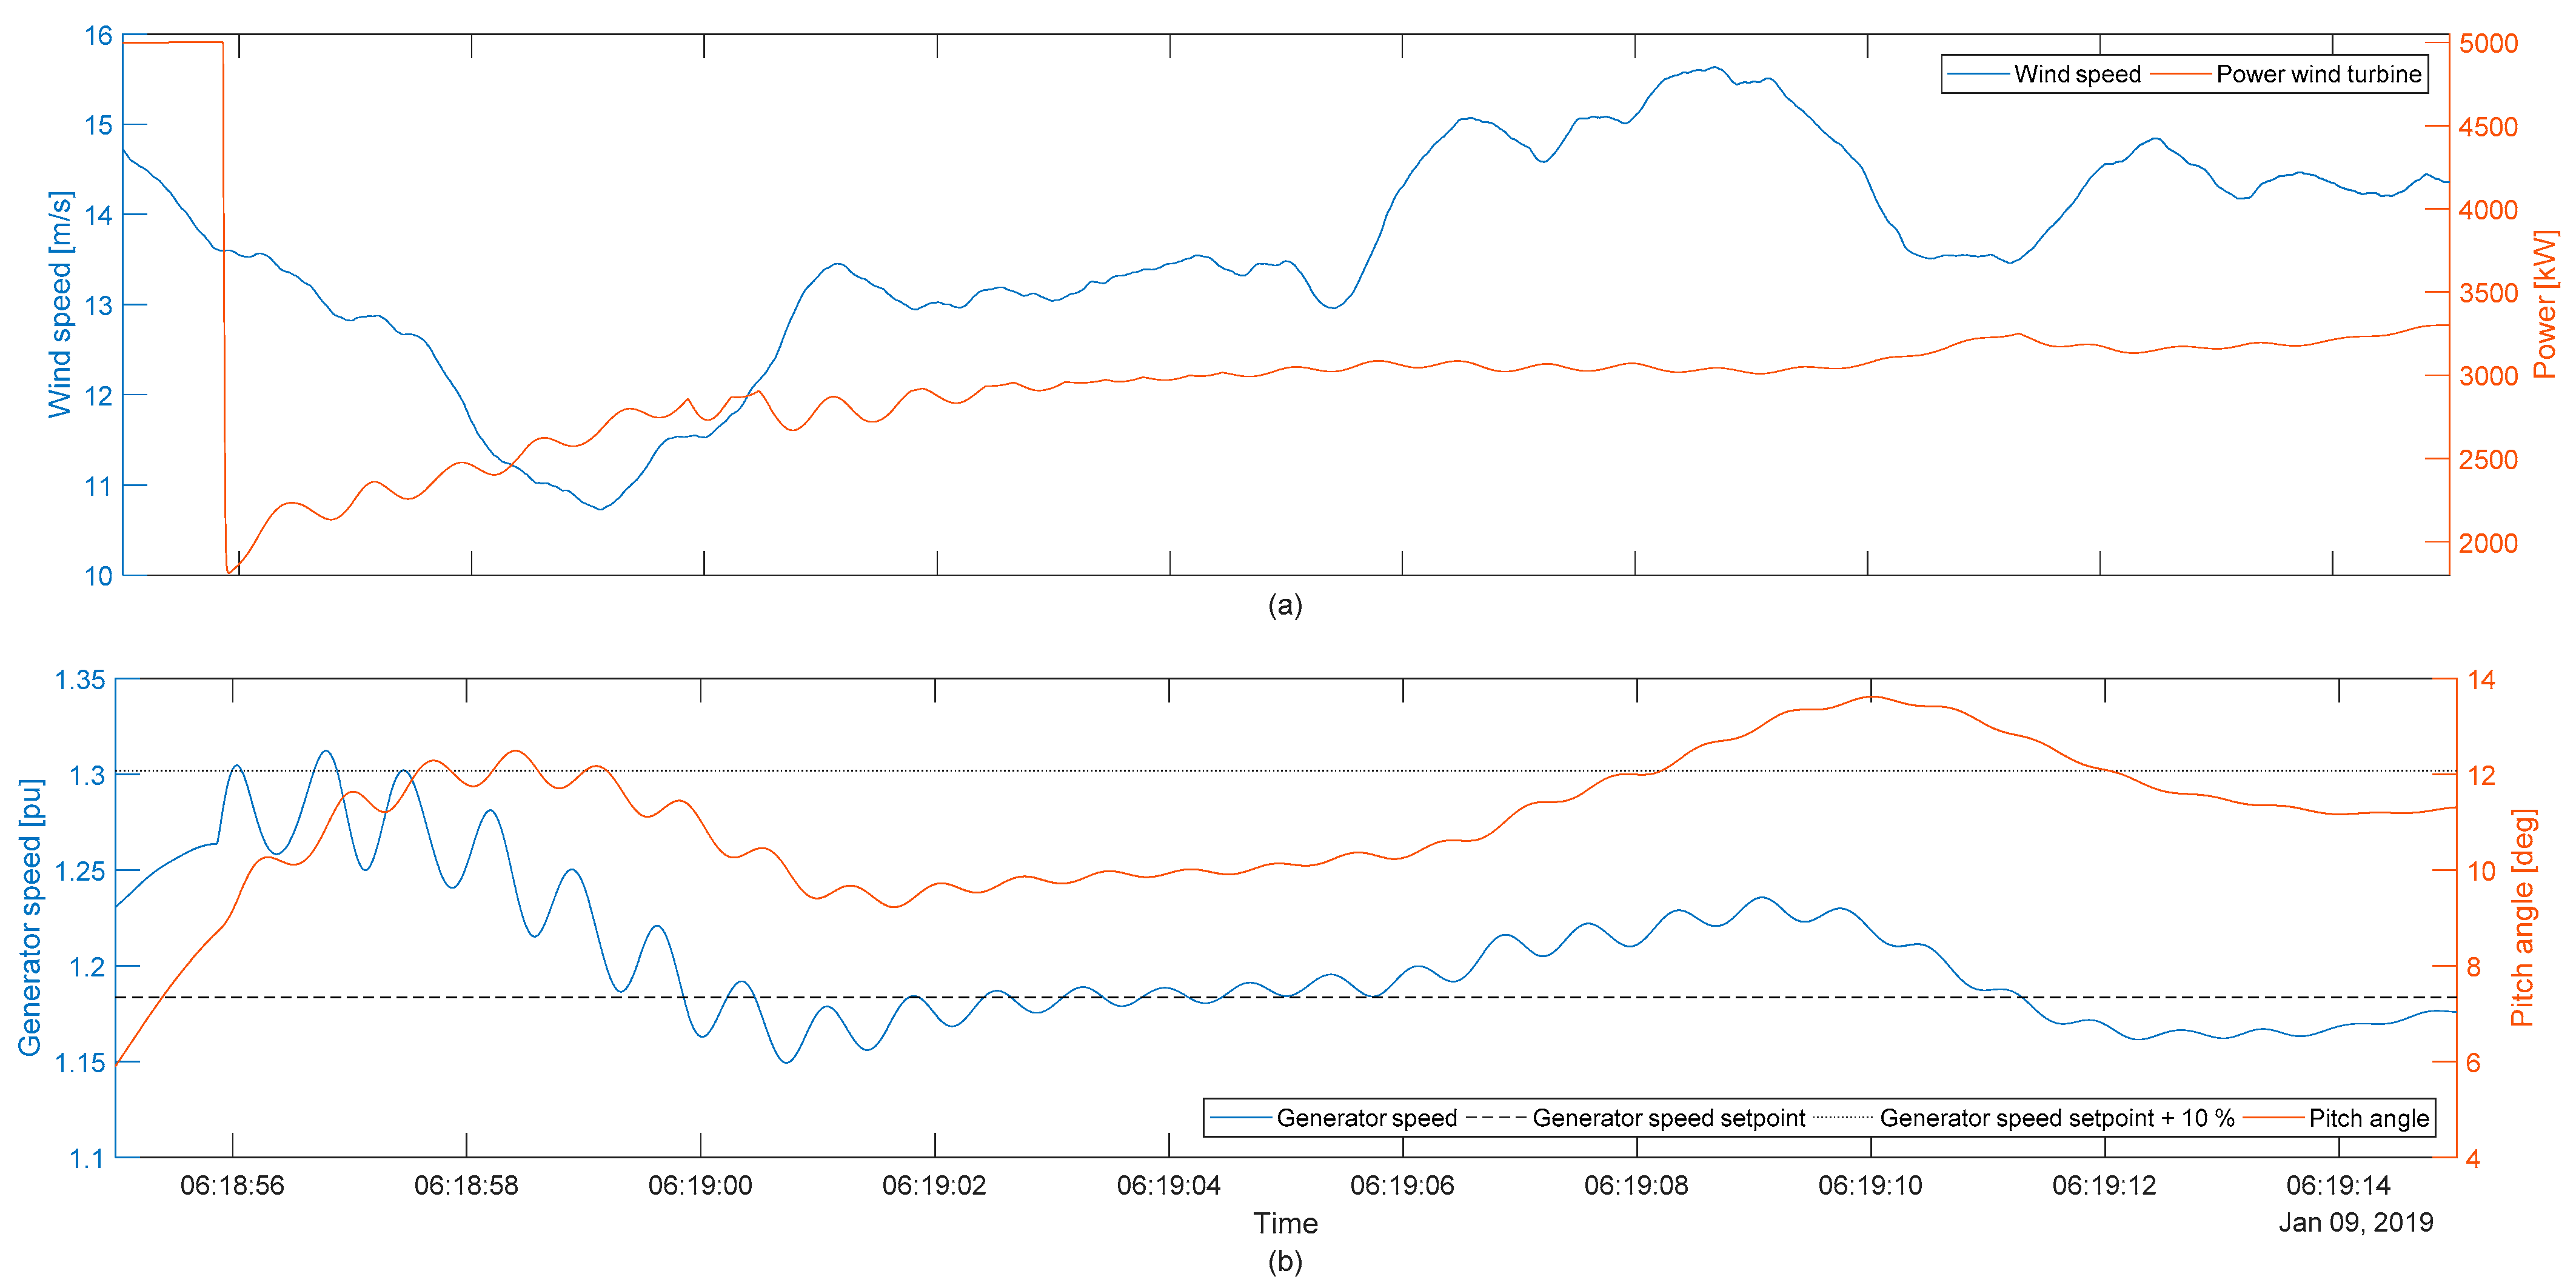
The massive frequency support provides a heavy burden for the drive trains of the WTs. The almost instantaneous power reduction causes a strong temporary imbalance between the accelerating aerodynamic torque and the decelerating electrical torque. Hence, the generator speed rises rapidly and starts to oscillate with the 1st torsional eigenfrequency of the drive train (see Figure 9b). As a result, the pitch angle also oscillates. These oscillations last for approximately 10 s with decreasing magnitude. As the power setpoint of the WT is linked to the generator speed, the WT power also oscillates (see Figure 9b).
Furthermore, the WT is at risk of shutting down due to overspeed. A typical value for the allowed overspeed is in the range of 10% [30,35] and is marked in Figure 9b. The shown WT experienced a gust shortly before the event. Hence, the generator speed is already high and the pitch not at a steady-state value when the frequency support is demanded. As a result, the generator speed instantaneously exceeds the overspeed threshold. As this occurs only for various milliseconds, the WT would probably stay connected to the grid, which is favorable for a reliable frequency response [22]. For WT 5, 6 & WT 8 however, the power reduction coincides with stronger gusts causing longer periods of overspeed (see Figure 10 and Table 3). Depending on the settings in the WTs safety systems, this may cause an emergency stop of the WTs. Figure 10 also depicts the simulation results of the least affected WT 2. It is clearly visible how the negative gust at the time of the frequency event helps to avoid an extreme overspeed situation.

3.2. Scenario II

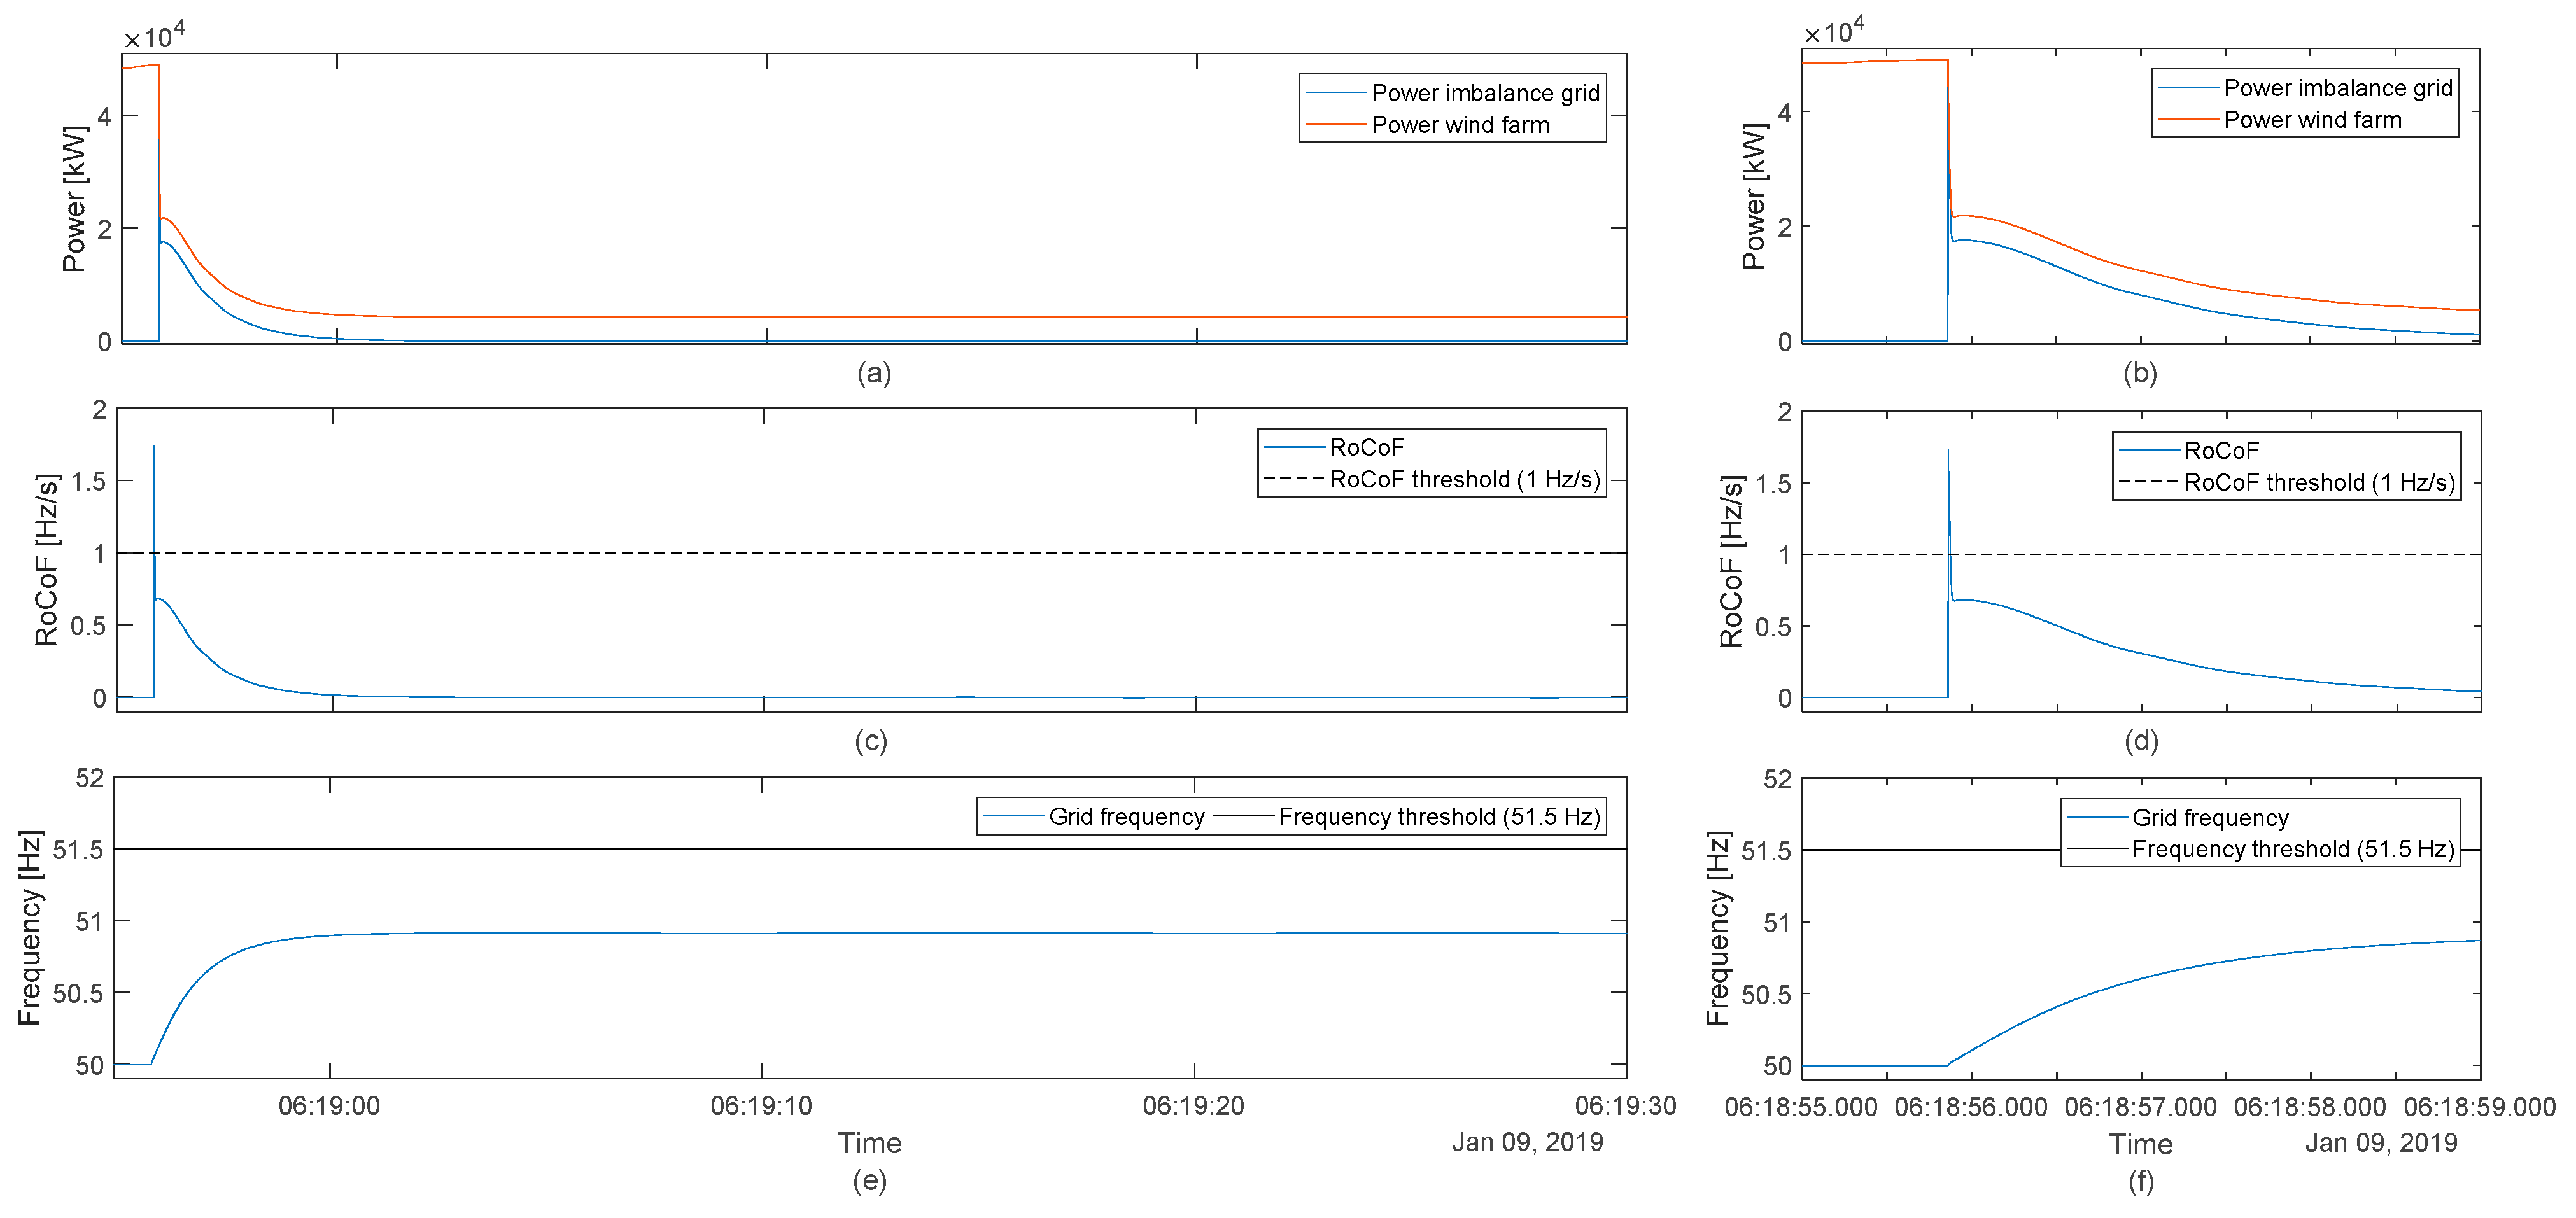
For scenario II, PFC is activated and the number of grid-connected WTs is raised to ten to keep the grid frequency below 51.5 Hz. As in scenario I, the RoCoF is pushed below the 1 Hz/s threshold in time by a rapid reduction of the power of the wind farm (i.e., 16 ms, see Figure 11a–d). As the power reduction persists, the grid frequency is stabilized within a few seconds and stays stable during the rest of the simulation (see Figure 11e,f).
Figure 12 shows how the SI and PFC work together to allow stabilizing the grid frequency: in the first moments after the system split, the SI controller provides a very fast frequency response, which decreases as the RoCoF approaches 0 Hz/s. The depicted PFC modification factor lowers the WTs power setpoint (see (4)) as the grid frequency rises. Eventually, an equilibrium is reached once the frequency response of the wind farm balances the power in the grid. To bring back the frequency to 50 Hz, more WTs would be needed. However, the stable frequency should allow keeping the gas-fired gen-set grid connected and using its frequency response to stabilize the grid frequency at 50 Hz.
As in scenario I, most of the WTs experience overspeed situations in the first seconds after the system split. The maximum generator speed and the duration for which the generator speed exceeds 110% of the rated speed are given in Table 4. Both values increased in comparison with scenario I. The increase is caused by the PFC, which keeps the generator power at a low level (see Figure 12 and Figure 13). As the pitch drive needs some time to adjust the pitch angle, overspeed occurs for most WTs. This problem is worsened when the frequency support coincides with a positive gust.
Examples of such coincidences are depicted in Figure 13. The WT 5, WT6, and WT8 experience a strong gust starting shortly before the power reduction for frequency support. Hence, the increase of the aerodynamic torque coincides with the decrease of the electrical torque. Consequently, the drive train is strongly accelerated. Furthermore, the drastic change of the electrical torque causes drive train oscillations with the 1st torsional eigenfrequency (see Figure 13c). The speed controller slows down the generator speed to rated speed after approximately 10 s and can stabilize the speed even though the WT operates at a low power setpoint and experiences heavy gusts. As in Figure 10 the least affected WT2 is also depicted. For this WT the highest speed occurs at the end of a gust starting shortly after the initial event. The power reduction at this time of the event is dominated by PFC, which explains the increase of the maximum speed compared to scenario I (see Figure 12).

3.3. Scenario III

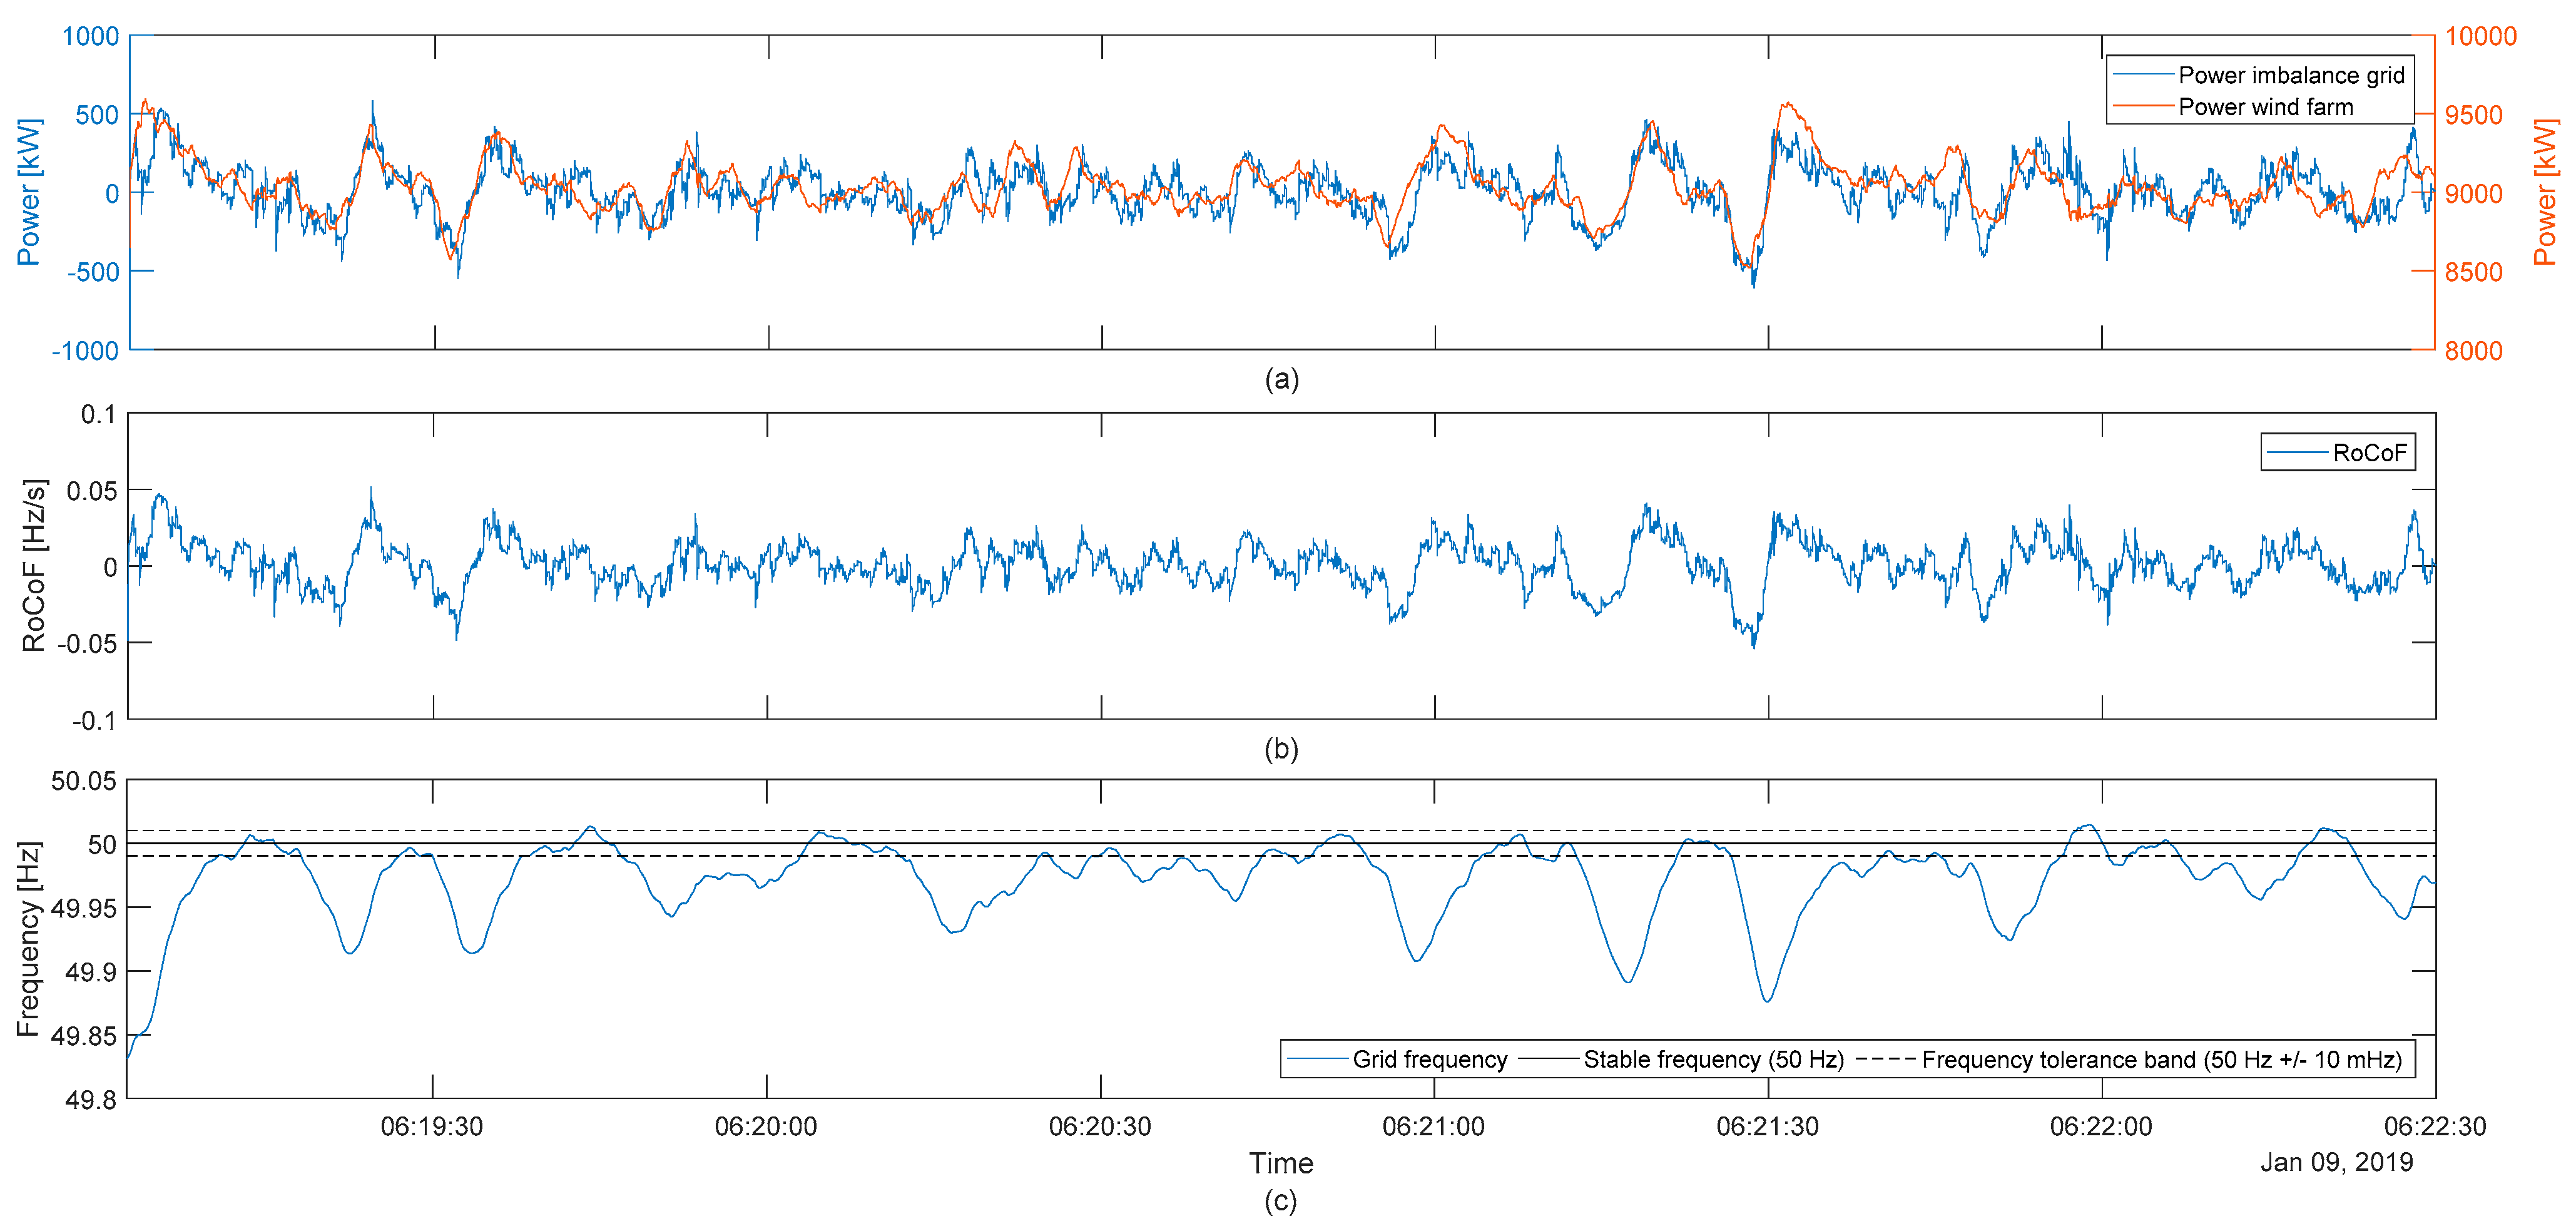
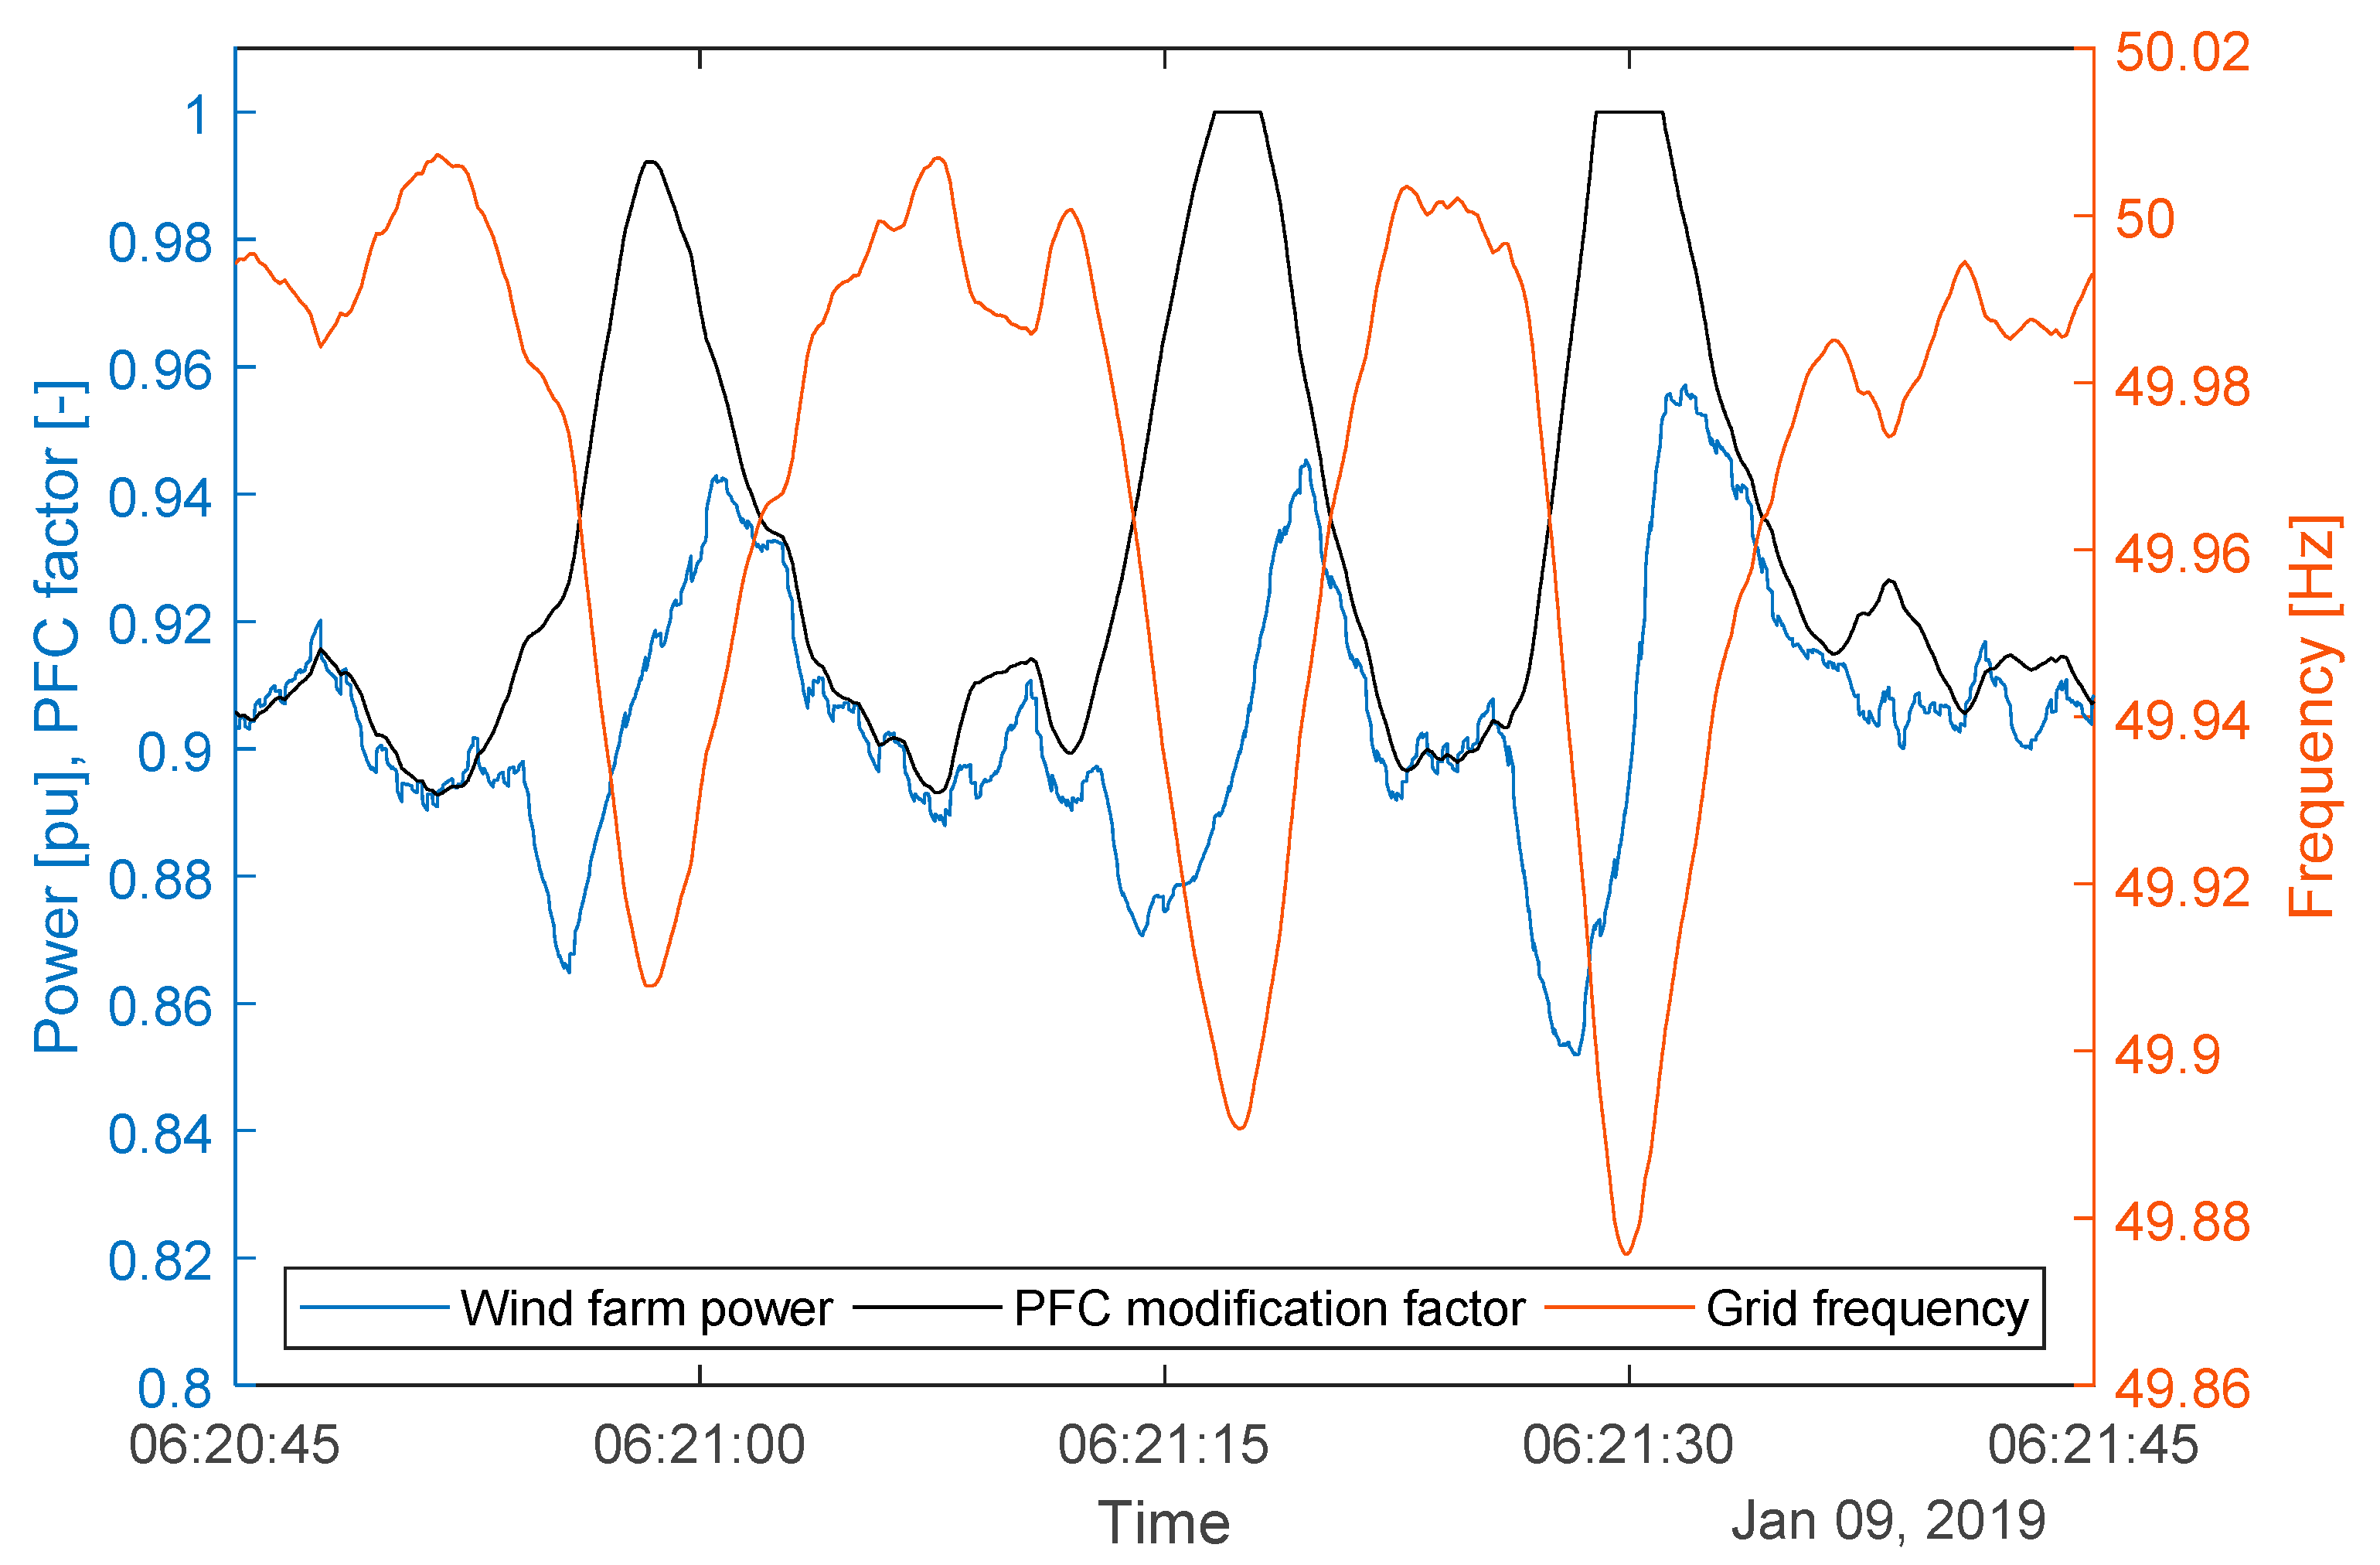
As in scenario II, PFC and SI controller are active. The number of grid connected WTs is reduced to two and a pre-event curtailment to 90% of the available power is introduced. Hence, the wind farm is allowed to produce 9000 kW when the grid frequency is at 50 Hz. The results show that the WTs can bring the grid frequency back to 49.99 Hz within 15 s after the event by increasing the power up to 9500 kW (see Figure 14a,c). The RoCoF is limited to approximately +/− 0.05 Hz/s, which is a low, unproblematic value. The axes scales for Figure 14a are chosen such that it becomes visible how the power imbalance in the grid is dominated by the power output of the wind farm. The load fluctuations and the changing power production of the power plant are comparable small for most of the time. Due to the turbulent wind, the PFC controller fails to keep it in the 50 Hz +/− 10 mHz tolerance band during negative gusts (see Figure 14a,c). The effects of the strongest gusts are shown in Figure 15: The drop of the wind farm power causes a drop in the grid frequency. Consequently, the PFC controller allows the WTs to generate as much power as possible for the WTs (ηPFC = 1). This helps to bring back the grid frequency to the tolerance band around 50 Hz. After the initial recovery, the grid frequency is only for five seconds below 49.9 Hz, which is the threshold for possible load shedding. After reaching the tolerance band, the grid frequency is for 56 s out of the remaining 185 s simulation within the tolerance band (appr. 30% of the time). This could have been increased by heavily increasing the number of grid-connected WTs. However, in this scenario, a small share of WTs on the power production is deliberately chosen to show the strong effect PFC provision of a few WTs may have on grid frequency stabilization.

4. Discussion

The results show that WTs would have been able to support the grid to some extent. The provision of SI could have lowered the RoCoF below a critical threshold within milliseconds and thus have lowered the consequences for the conventional power station. However, as the frequency rises too fast above the 51.5 Hz threshold, it would not have been possible to keep the gas-fired gen-set (Generator 12) connected to the grid. The grid could have been stabilized if the number of WTs were increased to ten and the WTs would provide PFC in addition to SI. In this case, the WTs would have been able to balance the power in the grid effectively and limit the frequency to 50.8 Hz. Keeping Generator 12 synchronized would have allowed using its PFC functionalities to bring the grid frequency back to 50 Hz and to stabilize it. This would have allowed reconnecting to the central European grid. In this case, the blackout would have been avoided. However, both scenarios require a large share of the power being produced with WTs. In the third scenario, a much smaller part of the power production would have been provided by WTs. The small number of individual WTs in combination with the small grid makes the power balance in the grid very sensitive to gusts. The regular gusts prevent the WTs to keep the grid frequency continuously within the tolerance band. The effect of the gusts would be smaller in a larger wind farm, as spatial smoothing effects occur in larger wind farms [37]. The ongoing development of various energy storage systems [38] could make local storage systems affordable and thus help smooth the power production further. Finally, even the inertia of the WT rotor in combination with advanced control could be used to smooth the power output [39,40]. However, even in the shown scenario, the grid frequency stays very close to or in the tolerance band for longer periods. Thus, a reconnection to the central European grid might have been possible and the blackout may have been avoided.
The first two scenarios have no direct financial implication for the WT operation. Although the continuous provision of SI alters the power setpoint of the WT, the consequences for the WT performance are negligible [22]. The PFC in scenario II requires no pre-event curtailment and is therefore financially negligible. By contrast, scenario III requires a pre-event curtailment by 10%. Such a prolonged curtailment solely for frequency support is very costly. However, in the region around Flensburg curtailment due to feed-in management is very common. It may be possible to use such curtailed WTs as a PFC reserve as the time scope of frequency support and feed-in management differ [24]. Hence, a temporary frequency support would most likely not compromise the safety of the affected grid.
The overspeed problem, which occurred in scenarios I & II, could be addressed by directly integrating the speed controller in the frequency response logic. Another option would be to use Lidar data to foresee gusts and thus reduce overspeed. Whether both options yield better results and stable control of the WT may be part of future research.
Although the frequency support provides a heavy burden for the drive train, it is unlikely to cost much lifetime. Lifetime is influenced by fatigue loads and extreme loads. A system split occurs seldom. Therefore, the frequency response during such an event is unlikely to cause significant fatigue loads. Furthermore, the change of the electrical torque for frequency response is slower than during low-voltage-ride-through (LVRT), which is a typical extreme burden for the drive train [41,42]. Hence, frequency support in the researched scenario is unlikely to be more significant than LVRT events and consequently neither for fatigue nor for extreme loads relevant.

5. Conclusions

For three fictive, yet realistic scenarios, it has been shown to what extent WTs could have helped to avoid the blackout in Flensburg on 9 January 2019. WTs solely providing SI would not have been sufficient for keeping the grid frequency in an acceptable band. Hence, the WTs would also need to provide PFC. As expected the frequency support comes at a price: namely possible overspeed and speed oscillation issues when the power output is heavily reduced and a need for pre-event curtailment when the power is to be increased. Possible mitigation strategies have to be researched to weaken these effects.
While the study focuses on the real situation in Flensburg on the day of the event, the findings are also relevant for other cases. The power imbalance in the grid matches the worst-case scenario for a system split defined by ENTSO-E very well. The exact behavior of a WT during frequency support depends strongly on its operating point thus the shown effects are limited to similar wind conditions. Whether WTs in part-load operation (providing a similar share of the power production) could have stabilized the grid frequency is likely but not shown in the paper. This is due to the attempt to stick as closely as possible to the real situation in Flensburg on 9 January 2019.
Further limitations of the results concern the used grid model. As the focus of the paper is on the WT dynamics power balances are used to calculate the RoCoF and the grid frequency. Furthermore, the measurement of the grid frequency is not modeled which could affect the efficiency of the grid frequency support and certainly would have delayed the power reduction in scenarios I & II. However, as the assessment criterion (RoCoF < 1 Hz/s) is reached approximately 50 ms before the goal, a successful stabilization of the grid frequency is likely for scenario II. Finally, the reconnection to the Central European grid is not modeled but the research shows to what extent this reconnection could have been facilitated and a successful reconnection would have been likely. Hence, it is concluded that a blackout could have most likely been prevented for scenarios II & III through the grid support of the WTs.

Author Contributions

A.G.: conceptualization, methodology, literature review, data analysis, development and implementation of the model, conducting the simulation, visualization, writing—original draft preparation; C.J.: conceptualization, development of the wind turbine simulation model, discussions and comments, writing—review and editing; T.R.: provision of data and information on the blackout, writing—review and editing. All authors have read and agreed to the published version of the manuscript.

Funding

This research is funded by the Bundesministerium für Bildung und Forschung and the gemeinsamen Wissenschaftskonferenz, project number 03IHS091. Parts of this paper are based on research funded by the Gesellschaft für Energie und Klimaschutz Schleswig-Holstein GmbH (EKSH), project number 8/12–20.
Energies 14 01697 i001

Data Availability Statement

The data presented in this study are available on request from the corresponding author. The data are not publicly available as some of data used for this study are protected by an NDA.

Acknowledgments

The authors acknowledge the support of the management and staff of the Stadtwerke Flensburg GmbH, especially Jochen Niedermeyer and Tom Trittin.

Conflicts of Interest

The authors declare no conflict of interest.

References

  1. Tielens, P.; van Hertem, D. The relevance of inertia in power systems. Renew. Sustain. Energy Rev. 2016, 55, 999–1009. [Google Scholar] [CrossRef]
  2. EirGrid. EirGrid Grid Code. Version 9. December 2020. Available online: https://www.eirgridgroup.com/site-files/library/EirGrid/GridCodeVersion9.pdf (accessed on 15 January 2021).
  3. Hydro-Québec TransÉnergie. Technical Requirements for the Connection of Generating Stations to the Hydro-Québec Transmission System. D-2018-145, January 2019. Available online: http://www.hydroquebec.com/transenergie/fr/commerce/pdf/2_Requirements_generating_stations_D-2018-145_2018-11-15.pdf (accessed on 15 January 2021).
  4. Central Electricity Authority. Technical Standards for Connectivity to the Grid (Amendment). 2019. Available online: https://cea.nic.in/wp-content/uploads/2020/02/notified_regulations.pdf (accessed on 15 January 2021).
  5. Godin, P.; Fischer, M.; Röttgers, H.; Mendonca, A.; Engelken, S. Wind power plant level testing of inertial response with optimised recovery behaviour. IET Renew. Power Gener. 2019, 13, 676–683. [Google Scholar] [CrossRef]
  6. Díaz-González, F.; Hau, M.; Sumper, A.; Gomis-Bellmunt, O. Participation of wind power plants in system frequency control: Review of grid code requirements and control methods. Renew. Sustain. Energy Rev. 2014, 34, 551–564. [Google Scholar] [CrossRef]
  7. Fernández-Guillamón, A.; Gómez-Lázaro, E.; Muljadi, E.; Molina-García, Á. Power systems with high renewable energy sources: A review of inertia and frequency control strategies over time. Renew. Sustain. Energy Rev. 2019, 115, 109369. [Google Scholar] [CrossRef] [Green Version]
  8. ENTSO-E. Connection Network Codes—Response to the Comments Received during the Public Consultation of Implementation Guidance Documents on Frequency Stability Parameters. January 2018. Available online: https://eepublicdownloads.blob.core.windows.net/public-cdn-container/clean-documents/Network%20codes%20documents/NC%20RfG/ENTSO-E_IGD_consultation_response.pdf (accessed on 27 January 2021).
  9. ENTSO-E. Frequency Stability Evaluation Criteria for the Synchronous Zone of Continental Europe. March 2016. Available online: https://eepublicdownloads.entsoe.eu/clean-documents/SOC%20documents/RGCE_SPD_frequency_stability_criteria_v10.pdf (accessed on 27 January 2021).
  10. ENTSO-E. System separation in the Continental Europe Synchronous Area on 8 January 2021. 2nd Update. January 2021. Available online: https://www.entsoe.eu/news/2021/01/26/system-separation-in-the-continental-europe-synchronous-area-on-8-january-2021-2nd-update/ (accessed on 27 January 2021).
  11. UCTE. Final Report of the Investigation Committee on the 28 September 2003 Blackout in Italy. Technical Report. April 2004. Available online: https://eepublicdownloads.entsoe.eu/clean-documents/pre2015/publications/ce/otherreports/20040427_UCTE_IC_Final_report.pdf (accessed on 3 March 2021).
  12. Everhart, K.; Gergely, M. Severe Power Cuts in Texas Highlight Energy Security Risks Related to Extreme Weather Events. IEA, Paris. February 2021. Available online: https://www.iea.org/commentaries/severe-power-cuts-in-texas-highlight-energy-security-risks-related-to-extreme-weather-events (accessed on 3 March 2021).
  13. Borowski, P.F. Zonal and Nodal Models of Energy Market in European Union. Energies 2020, 13, 4182. [Google Scholar] [CrossRef]
  14. Yamashita, K.; Joo, S.K.; Li, J.; Zhang, P.; Liu, C.C. Analysis, control, and economic impact assessment of major blackout events. Eur. Trans. Electr. Power 2008, 18, 854–871. [Google Scholar] [CrossRef]
  15. Yuxin, Z.; Xuemin, Z.; Shengwei, M.; Deming, X.; Shuai, W.; Rui, S. Blackout risk analysis and control of power system integrated with wind farm. In Proceedings of the 2016 Chinese Control and Decision Conference (CCDC), Yinchuan, China, 28–30 May 2016; pp. 876–882. Available online: http://ieeexplore.ieee.org/document/7531107/ (accessed on 3 March 2021).
  16. Yan, R.; Saha, T.K.; Bai, F.; Gu, H. The Anatomy of the 2016 South Australia Blackout: A Catastrophic Event in a High Renewable Network. IEEE Trans. Power Syst. 2018, 33, 5374–5388. [Google Scholar] [CrossRef]
  17. Ela, E.; Gevorgian, V.; Fleming, P.; Zhang, Y.C.; Singh, M.; Muljadi, E.; Scholbrook, A.; Aho, J.; Buckspan, A.; Pao, L.; et al. Active Power Controls from Wind Power: Bridging the Gaps; NREL, Technical Report NREL/TP-5D00-60574; National Renewable Energy Lab. (NREL): Golden, CO, USA, 2014.
  18. Kundur, P.; Balu, N.J.; Lauby, M.G. Power System Stability and Control; McGraw-Hill: New York, NY, USA, 1994. [Google Scholar]
  19. Thiesen, H.; Jauch, C. Determining the Load Inertia Contribution from Different Power Consumer Groups. Energies 2020, 13, 1588. [Google Scholar] [CrossRef] [Green Version]
  20. Ministerium für Energiewende, Landwirtschaft, Umwelt, Natur und Digitalisierung (MELUND) Schleswig-Holstein. Bericht zum Engpassmanagementin Schleswig-Holstein. Kiel. December 2020. Available online: https://www.schleswig-holstein.de/DE/Landesregierung/Themen/Energie/Energiewende/Strom/pdf/berichtEngpassmanagement.pdf?__blob=publicationFile&v=3 (accessed on 4 February 2021).
  21. Jauch, C. First Eigenmodes Simulation Model of a Wind Turbine—For Control Algorithm Design; Technical Report; Wind Energy Technology Institute: Flensburg, Germany, 2020. [Google Scholar] [CrossRef]
  22. Gloe, A.; Jauch, C.; Craciun, B.; Winkelmann, J. Continuous provision of synthetic inertia with wind turbines: Implications for the wind turbine and for the grid. IET Renew. Power Gener. 2019, 13, 668–675. [Google Scholar] [CrossRef]
  23. Jonkman, J.; Butterfield, S.; Musial, W.; Scott, G. Definition of a 5-MW Reference Wind Turbine for Offshore System Development; Technical Report, NREL/TP-500-38060; National Renewable Energy Lab. (NREL): Golden, CO, USA, 2009.
  24. Jauch, C.; Gloe, A. Simultaneous Inertia Contribution and Optimal Grid Utilization with Wind Turbines. Energies 2019, 12, 3013. [Google Scholar] [CrossRef] [Green Version]
  25. Kušljevic, M.D.; Tomic, J.J.; Jovanovic, L.D. Frequency Estimation of Three-Phase Power System Using Weighted-Least-Square Algorithm and Adaptive FIR Filtering. IEEE Trans. Instrum. Meas. 2010, 59, 322–329. [Google Scholar] [CrossRef]
  26. Hagerstål, T.; Wikner, J. Development & Operational Experience with SGT-800, a Siemens 45 MW Industrial Gas Turbine for Various Appications; Technical Report; Siemens Industrial Turbomachinery AB: Finspong, Sweden, 2006. [Google Scholar]
  27. Tielens, P.; van Hertem, D. Grid Inertia and Frequency Control in Power Systems with High Penetration of Renewables. Presented at the Young Researchers Symposium in Electrical Power Engineering, Delft. 2012. Available online: https://lirias.kuleuven.be/retrieve/182648 (accessed on 4 February 2021).
  28. German Weather Service. Climate Data Center. Available online: https://cdc.dwd.de/portal/202007291339/mapview (accessed on 27 January 2021).
  29. Manwell, J.F.; McGowan, J.G.; Rogers, A.L. Wind Energy Explained: Theory, Design and Application, 2nd ed.; Wiley: Chichester, UK, 2011. [Google Scholar]
  30. Gloe, A.; Jauch, C. Simulation Model Design and Validation of a Gearless Wind Turbine—For Fast Power Control to Enhance Congestion Management; Technical Report; Wind Energy Technology Institute: Flensburg, Germany, 2016. [Google Scholar] [CrossRef]
  31. Jauch, C.; Gloe, A.; Hippel, S.; Thiesen, H. Increased Wind Energy Yield and Grid Utilisation with Continuous Feed-In Management. Energies 2017, 10, 870. [Google Scholar] [CrossRef] [Green Version]
  32. Federal Network Agency. Core Energy Market Data Register. Available online: https://www.bundesnetzagentur.de/EN/Areas/Energy/Companies/CoreEnergyMarketDataRegister/CoreDataReg_node.html (accessed on 4 March 2021).
  33. Hydro Québec TransÉnergie. Transmission Provider Technical Requirements for the Connection of Power Plants to the Hydro-Québec Transmission System. February 2009. Available online: http://www.hydroquebec.com/transenergie/fr/commerce/pdf/exigence_raccordement_fev_09_en.pdf (accessed on 3 May 2016).
  34. Fernández-Guillamón, A.; Gómez-Lázaro, E.; Molina-García, Á. Extensive Frequency Response and Inertia Analysis under High Renewable Energy Source Integration Scenarios: Application to the European Interconnected Power System. IET Renew. Power Gener. 2020, 14, 2885–2896. [Google Scholar] [CrossRef]
  35. Gloe, A.; Jauch, C.; Thiesen, H.; Viebeg, J. Inertial Response Controller Design for a Variable Speed Wind Turbine; Technical Report; Wind Energy Technology Institute: Flensburg, Germany, 2018. [Google Scholar] [CrossRef]
  36. The European Commission. Commission Regulation Establishing a Network Code on Requirements for Grid Connection of Generators; European Commission: Brussels, Belgium, 2016; Volume 631. [Google Scholar]
  37. Li, P.; Banakar, H.; Keung, P.K.; Far, H.G.; Ooi, B.T. Macromodel of spatial smoothing in wind farms. IEEE Trans. Energy Convers. 2007, 22, 119–128. [Google Scholar] [CrossRef]
  38. Koohi-Fayegh, S.; Rosen, M.A. A review of energy storage types, applications and recent developments. J. Energy Storage 2020, 27, 101047. [Google Scholar] [CrossRef]
  39. Abedini, A.; Nasiri, A. Output Power Smoothing for Wind Turbine Permanent Magnet Synchronous Generators Using Rotor Inertia. Electr. Power Compon. Syst. 2008, 37, 1–19. [Google Scholar] [CrossRef]
  40. Jauch, C. Controls of a flywheel in a wind turbine rotor. Wind Eng. 2016, 40, 173–185. [Google Scholar] [CrossRef] [Green Version]
  41. Joos, G. Wind turbine generator low voltage ride through requirements and solutions. In Proceedings of the 2008 IEEE Power and Energy Society General Meeting—Conversion and Delivery of Electrical Energy in the 21st Century, Pittsburgh, PA, USA, 20–24 July 2008; pp. 1–7. Available online: http://ieeexplore.ieee.org/document/4596605/ (accessed on 10 February 2021).
  42. Wenske, J.; Beckert, U. Voltage-Induced Stresses during Low Voltage Ride through (LVRT) in the Drive Train of Wind Turbines with DFIG. Presented at the International Conference on Renewable Energies and Power Quality, Santiago de Compostella. 2012. Available online: http://www.icrepq.com/papers-icrepq12.html (accessed on 10 February 2021).
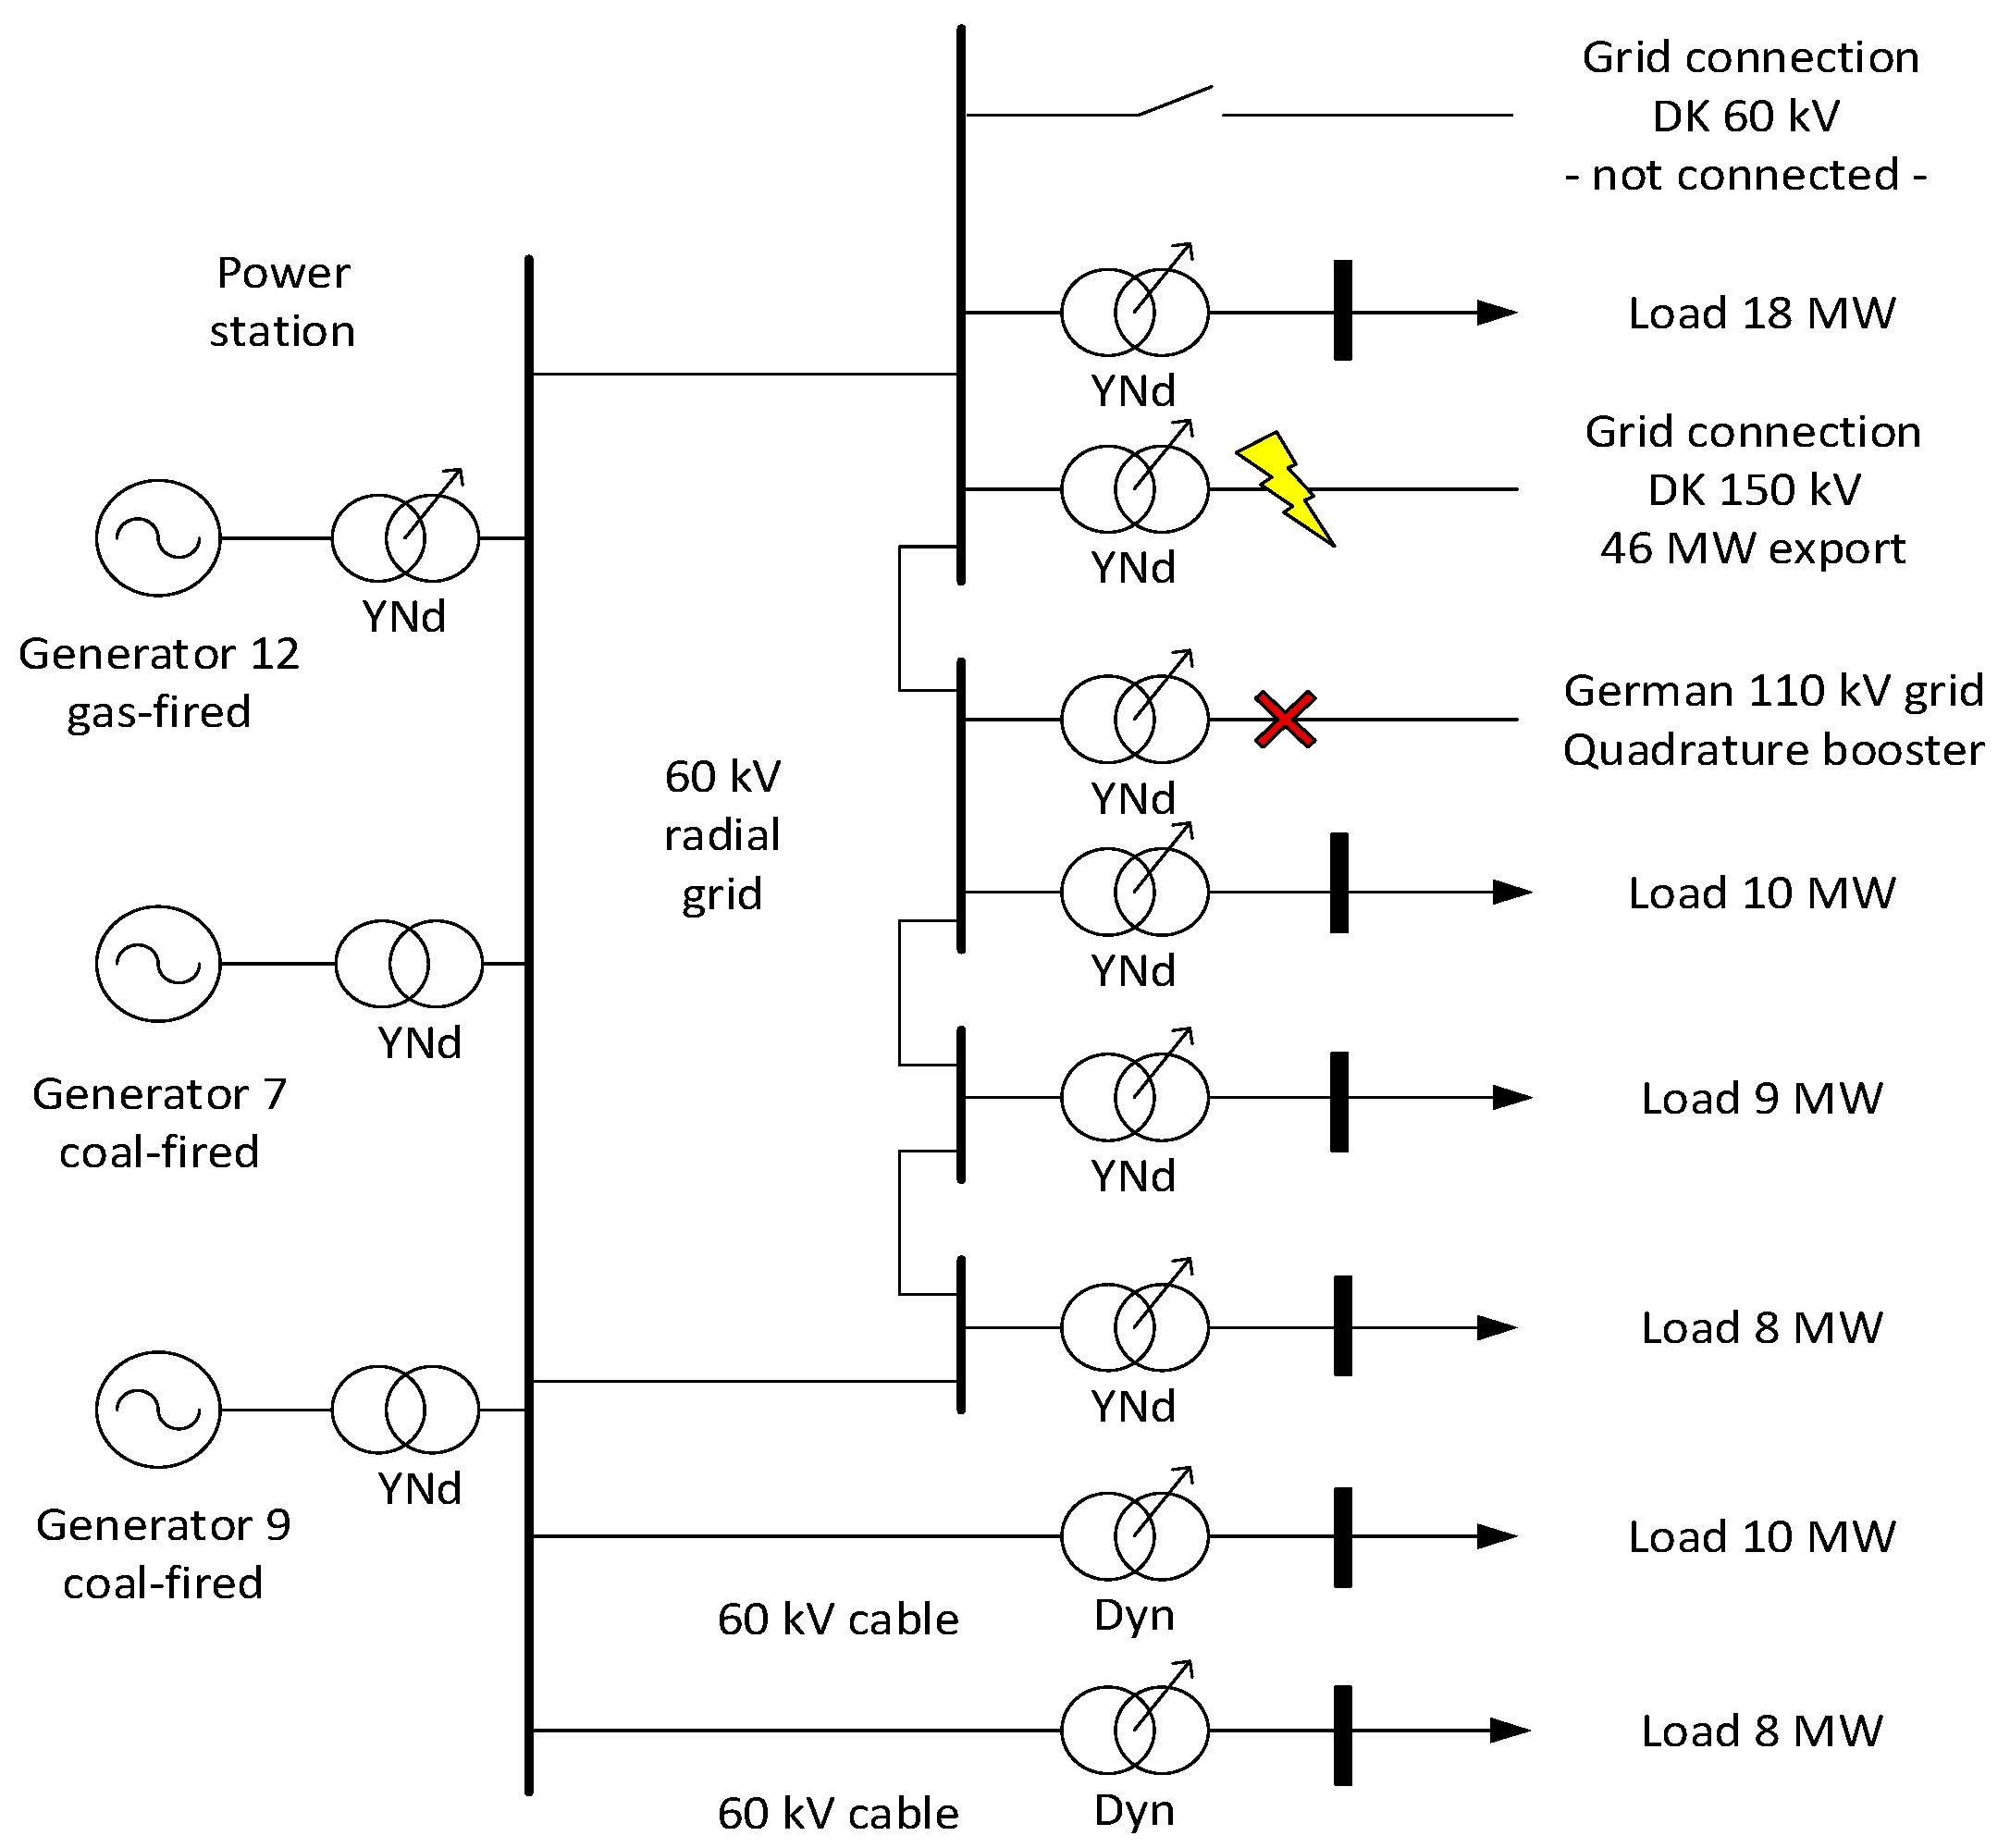
Figure 1. Schematic depiction of the distribution grid in Flensburg, the connected generators, export lines, and the aggregated loads shortly before the blackout on 9 January 2019.
Energies 14 01697 g001
Figure 2. (a) Grid frequency measured at the Flensburg power station on 9 January 2019. (b) Grid frequency and root mean square (RMS) value of the grid voltage measured at the Wind Energy Technology Institute (WETI) during the initial event on 9 January 2019.
Energies 14 01697 g002
Figure 3. Block diagram of the power reference for the WT including grid frequency support (primary frequency control (PFC) and synthetic inertia (SI)).
Energies 14 01697 g003
Figure 4. Power-vs-speed characteristic (blue line) of the NREL 5 MW wind turbine (WT) [23]. (a) The black quadrangle depicts the transient behavior of the WT when supplying SI. (b) The black shaded area depicts typical operating points of the WT when operating in curtailed mode with the simulated PFC controller.
Energies 14 01697 g004
Figure 5. PFC requirements during frequency sensitive mode in the Irish grid code [2].
Energies 14 01697 g005
Figure 6. Block diagram of the power controller and the generator-converter model.
Energies 14 01697 g006
Figure 7. Example of the load power, calculated with the measured generator power and the grid frequency measured at WETI.
Energies 14 01697 g007
Figure 8. Results of scenario I: Power imbalance in the islanded grid and power of the simulated wind farm for (a) the full simulation time and (b) a zoom to the time of the event; (c,d) RoCoF and RoCoF threshold; (e,f) grid frequency and frequency threshold. Time axes of (e,f) are valid for the above subplots as well.
Energies 14 01697 g008
Figure 9. Results of scenario I for the 1st simulated WT: (a) Wind speed at hub height and electrical power of the WT; (b) generator speed, speed setpoint, overspeed threshold and pitch angle.
Energies 14 01697 g009
Figure 10. Simulation results of scenario I for four WTs: (a) Wind speed and rated wind speed; (b) Generator power; (c) generator speed, speed setpoint, and overspeed threshold. The time axis of (c) is valid for the above subplots as well.
Energies 14 01697 g010
Figure 11. Results of scenario II: power imbalance in the islanded grid and power of the simulated wind farm for (a) the full simulation time and (b) a zoom to the time of the event; (c,d) RoCoF and RoCoF threshold; (e,f) grid frequency and frequency threshold. Time axes of (e,f) are valid for the above subplots as well.
Energies 14 01697 g011
Figure 12. Results for scenario II. Generator power and the two frequency support functions: SI and PFC.
Energies 14 01697 g012
Figure 13. Simulation results of scenario II for 4four WTs: (a) Wind speed and rated wind speed; (b) Generator power; (c) generator speed, speed setpoint, and overspeed threshold. The time axis of (c) is valid for the above subplots as well.
Energies 14 01697 g013
Figure 14. Results of scenario III: (a) power imbalance in the islanded grid and power of the simulated wind farm; (b) RoCoF; (c) grid frequency, stable frequency, and frequency tolerance band.
Energies 14 01697 g014
Figure 15. Results of scenario III: Wind farm power (pu base = 10 MW), PFC modification factor ηPFC, and grid frequency during negative wind gusts.
Energies 14 01697 g015
Table 1. Specifications and operating points of the generator and the local consumers.
Grid ParticipantsPower at Moment
of Islanding
Rated PowerInertia 1Number of Pole Pairs
Generator 7
(coal-fired gen-set)
29.6 MW33 MW2293 kg·m21
Generator 9
(coal-fired gen-set)
31.3 MW36 MW2223 kg·m21
Generator 12
(gas-fired gen-set)
49.1 MW49 MW7320 kg·m2
(referred to grid speed)
2
Local consumers63 MW-1216 kg·m2-
Power export47 MW---
1 The sources of the reported inertias are described in Section 2.3.1.
Table 2. Overview of simulated scenarios and the used simulation and controller settings.
CategoryScenario IScenario IIScenario III
Scenario goalKeep Generator 12 connected to the gridKeep Generator 12 connected to the gridStabilize fgrid close to 50 Hz
Assessment criteriaTime until RoCoF falls below 1 Hz/sTime until frequency reaches 51.5 HzTime until frequency reaches 49.99 Hz
Time within frequency insensitivity 50 Hz +/− 10 mHz
Active controllerSISI & PFCSI & PFC
Simulation time20 s60 s200 s
Power imbalancePower export of lost export linePower export of lost export lineCalculated from grid frequency measurements
Grid inertia13,052 kg·m213,052 kg·m25732 kg·m2
Number of WTs8102
Share of WTs in power production35%44%15%
Wind characteristicturbulentturbulentturbulent
Average wind speed13 m/s13 m/s13 m/s
Turbulence intensity12%12%12%
Hdem12 s12 s12 s
Curtailment factor ηPFC before eventNot used1 (no curtailment)0.9
Droop factorNot used2%2%
Frequency insensitivityNot used10 mHz0 mHz
Table 3. Results of scenario I. Maximum speed and duration in overspeed for all simulated WTs.
WT NumberMaximum Generator Speed
[% of Rated Speed] 1
Duration in Overspeed [ms]
1110.7316
2104.80
3107.40
4110.7184
5111.6864
6115.83090
7108.20
8113.31995
1 Rated generator speed is 1.183 pu.
Table 4. Results of scenario II. Maximum speed and duration in overspeed for all simulated WTs.
WT NumberMaximum Generator Speed
[% of Rated Speed] 1
Duration in Overspeed [ms]
1111.1517
2106.20
3109.60
4112.21296
5113.62791
6119.53901
7110.7542
8115.23951
9112.82105
10108.30
1 Rated generator speed is 1.183 pu.
Publisher’s Note: MDPI stays neutral with regard to jurisdictional claims in published maps and institutional affiliations.