Article

Low Voltage Induction Motor Traction Drive Self-Commissioning Technique with the Advanced Measured Signal Processing Procedure

Faculty of Technical Sciences, University of Novi Sad, Trg Dositeja Obradovića 6, 21000 Novi Sad, Serbia
*
Author to whom correspondence should be addressed.
Energies 2021, 14(6), 1700; https://doi.org/10.3390/en14061700
Submission received: 28 January 2021 / Revised: 2 March 2021 / Accepted: 10 March 2021 / Published: 18 March 2021
(This article belongs to the Special Issue Energy Control and Management for Transportation Electrification)

Abstract

:
In this paper, the enhanced auto-tuning technique based on the injection of two sinusoidal test signals of different frequencies applicable on the low voltage induction motor self-commissioning process is presented. The main feature of the proposed technique resides in the advanced signal processing of measured IM voltage and current signals based on the cascaded delay signal cancelation structure. This processing algorithm enables the filtering of the symmetry-related fundamental harmonic from the non-symmetrical test signal excitation typical for the self-commissioning process. Based upon the steady-state response from the proposed filtering block, the simple yet effective calculation method derives the complete parameter set of the IM equivalent circuit. The technique is validated through the variety of computer simulations and experimental tests on the digitally controlled low voltage IM traction drive.

Graphical Abstract

1. Introduction

High robustness and reliability are the main features of induction motors (IM). Yet, to achieve high performance and robust digital control of IM, it is essential to use advance control strategies which require accurate IM parameters [1,2,3,4]. Rated parameters obtained from a manufacturer are prone to the drift caused by the impact of production procedure, ambient temperature, and other specific conditions of drive, and therefore cannot be used, especially if high performances are required. This is especially the case in a drive application where low voltage IM modified with low voltage/flux conditions and with some essential parametric enlarged ratios is used. For that reason, the modification of an IM parameter identification procedure is necessary for usage in low voltage IM traction drives.
Parameter identification techniques for IM can be classified into two main categories: Online and offline parameter identification techniques. Overall review of the major parameter identification techniques for IM can be found in overview papers [5,6,7]. While online parameter identification techniques enable parameter adaptation during drive operation, offline techniques require special testing conditions. Among offline parameter estimation techniques, self-commissioning technique can be classified. Every modern inverter-fed IM drive requires the self-commissioning process to be initiated prior to the drive continuous operation. Self-commissioning techniques are usually based on the injection of DC or AC test signals in IM in order to determine unknown motor parameters [5]. Typically, two or more voltage or current test signals with different frequencies or amplitude are injected, and the input impedance of the IM equivalent circuit is measured. These sorts of techniques are called impedance equation set techniques (IES techniques) [8,9,10,11,12,13,14,15,16,17,18,19,20].
The self-commissioning technique presented in this paper is based on the injection of two sinusoidal test signals with different frequencies and the measurement of the input impedance of the IM inverse “Γ” lumped equivalent circuit. The technique is developed and adapted to be applicable for the real high efficiency, low voltage IM traction drive. Such a special application requires different approaches and adjustments in order to apply self-commissioning techniques on a real drive. For signal processing procedure, in order to extract a symmetry-related fundamental harmonic from the non-symmetrical test signal excitation during the self-commissioning, the cascaded delay signal cancellation (DSC) filter is used. Different approaches are used in novel literature for the same purpose. An author in [8] uses Fourier Series Expansion (FSE) method, while authors in [9] use Fast Fourier Transformation (FFT) in combination with low pass filters. In the Ph.D. thesis [10], the author suggests the use of the resonant filter tuned exactly at the injection frequency of AC test signals. Interesting research was given in [11,12], denoting the specific choice of injection frequency to be applied during the IM self-commissioning process to avoid parameter sensitivity and non-modeled dynamic issues. In paper [13], it is suggested to use step current excitation command to identify the IM magnetization parameter. However, it is worth mentioning that the “Γ” lumped equivalent circuit provides a good IM model approximation only when sinusoidal voltage test signals are injected, thus reducing the reliability of the method itself. The robust approach, which copes with the noise-free estimation and non-linearity involved within the parameter estimation, represents the implementation of the Recursive Least Square estimator (RLS), as given in [14,15,16]. Papers [14,15] suggest the use of the least square algorithm in linear parametrization form, yet both introduce the necessity of estimating the second-order time derivative of stator currents by involving the measurement of the first time derivative of both voltage and currents. A different problem is found in [16], which suggests the more natural choice of regression variables within the estimation model, though it introduces the computationally demanding two-stage non-linear RLS. Authors in [17] propose the automatic procedure for estimating the IM parameters at a standstill by using the machine transient analysis. The approach combining two simple neural networks in parallel, reported in [18], estimates the stator resistance and self-inductance at low-frequency range and rotor parameters along with the leakage effects at the high-frequency range. Publications referenced within [19,20] enlist the problems of estimating the magnetization curve in standstill operation, but ultimately fail to solve the sensitivity problems.
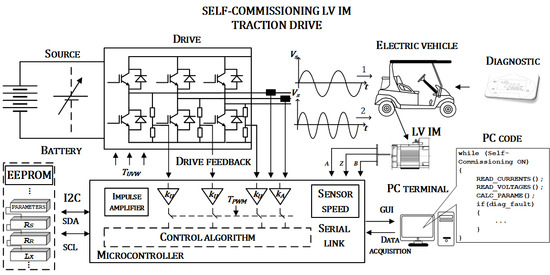
All of the given proposals are impractical for real-time implementation, due to high computation burden. Moreover, the reliability of the presented state-of-the-art is questionable from the viewpoint of the use of fault-safe current-injection methodology as an excitation paradigm. Such an approach does not fully comply to the IM inverse “Γ” lumped equivalent circuit derived by the assumption of voltage supply operation. For these reasons, many modifications have been made to implement the proposed self-commissioning technique on the real low voltage IM traction drive. First, although the reference sinusoidal voltage or current test signals with known phase and amplitude are commanded during the self-commissioning, actual inverter output voltages or currents are being measured and processed in the algorithm of the technique. Second, an improved and more practical signal processing procedure based on the cascaded delay signal cancellation (DSC) filter is used. Finally, IM measured phase voltage and current signals are already available for drive control in the rotating dq frame, and they are used for the implementation of the self-commissioning technique. All of the above listed modifications significantly increased the accuracy of the parameter estimation, without the increase of the firmware complexity or the computation burden to the microcontroller. The effectiveness of the proposed improved self-commissioning technique is verified with a set of computer simulations and experiments on the real low voltage IM traction drive.

2. Theory and Basic Principle of the Self-Commissioning Technique

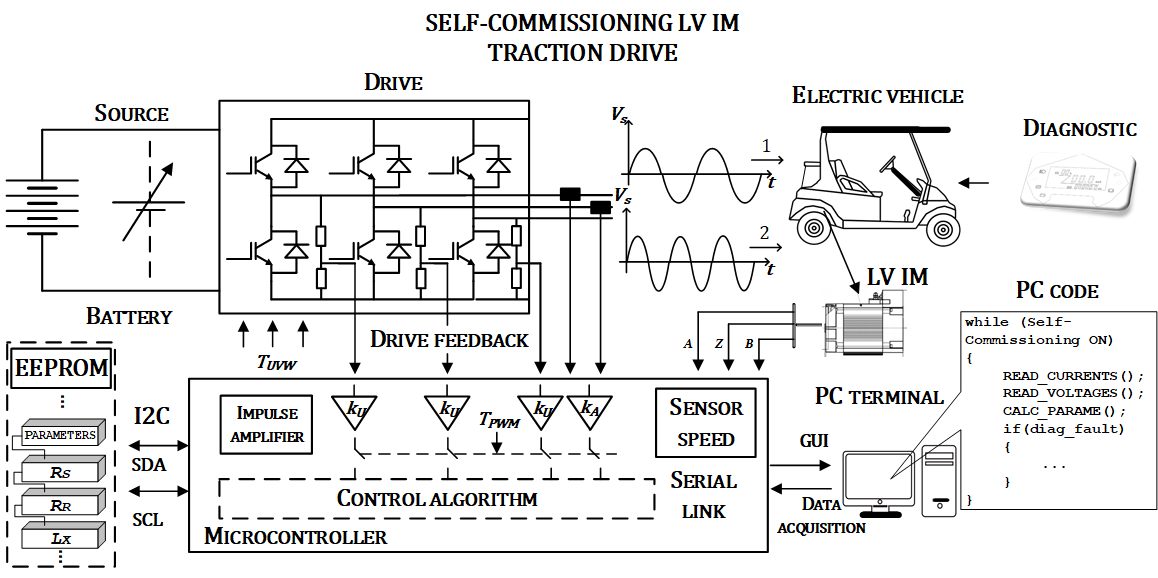
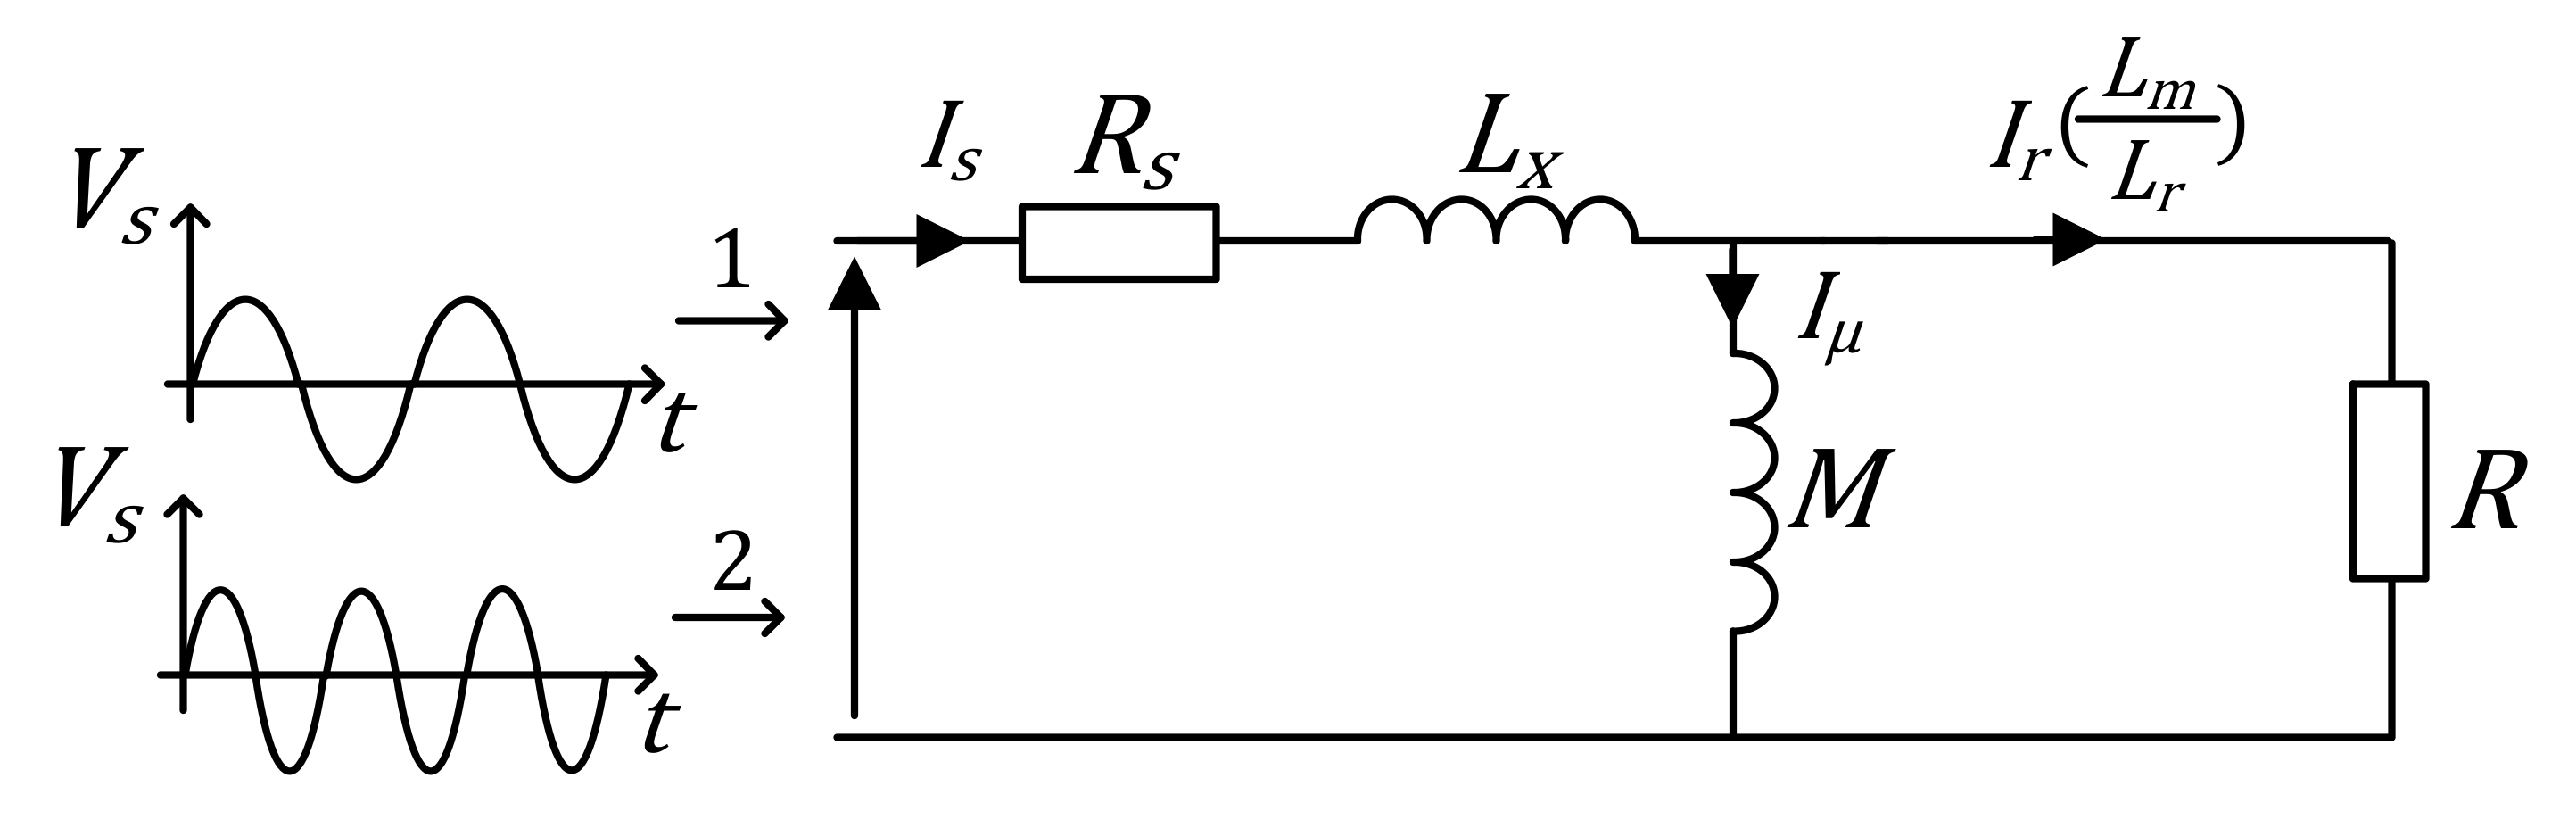
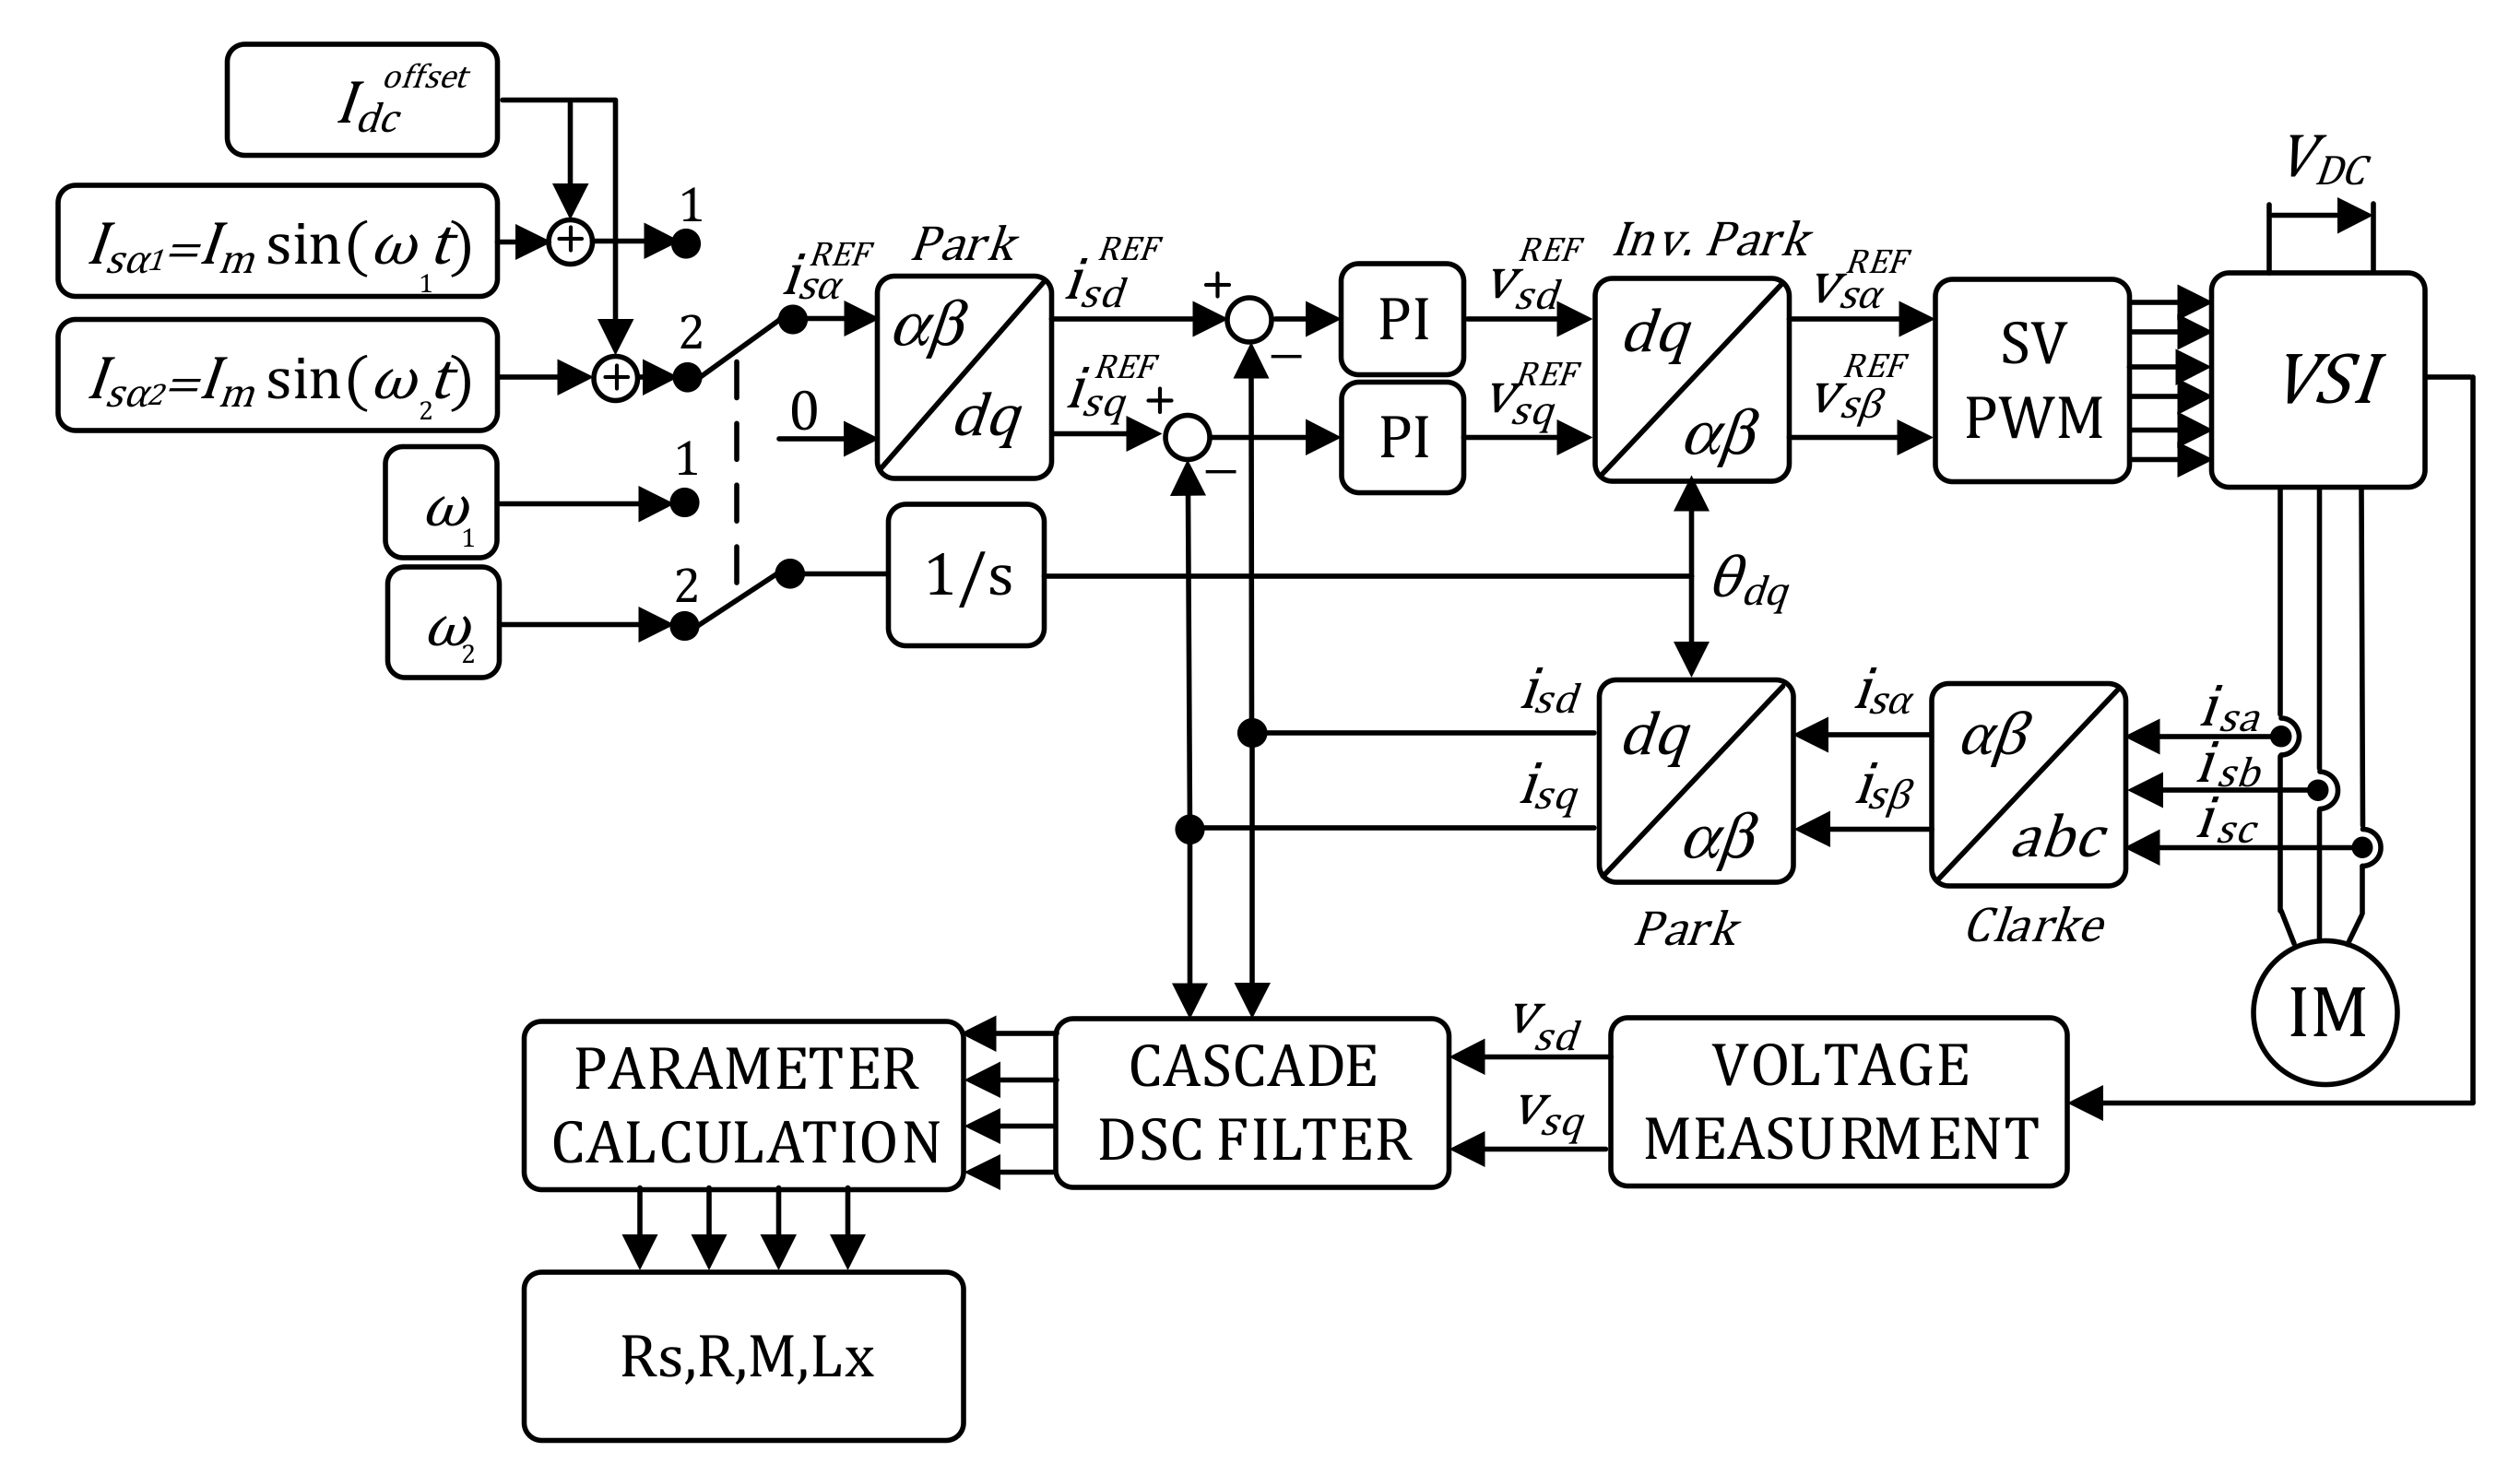
The fundamental principle of the proposed technique is based on determining IM equivalent circuit parameters from the total motor impedance. During the test, IM is supplied with a single-phase sinusoidal supply to maintain rotor stationary, which is necessary for situations where the rotation is not allowed during the self-commissioning process. If IM is fed with a single-phase supply, only a pulsating magnetic field is generated, which does not create continuous starting torques. Therefore, one can extract the information regarding IM parameters. Additionally, if the physical insight and observation are employed, a more practical and straightforward solution for parameter estimation can be derived. Precisely, it is advisable to employ the analysis of the single-phase excitation in the formalism of decoupled rotating magnetic fields of related symmetry. Observing the positive- or negative-sequence rotating phasors of terminal machine variables, such as stator voltages and currents, the complete parameter set of IM can be determined. To formulate the equations for the proposed self-commissioning technique, the inverse “Γ” equivalent circuit shown in Figure 1 is considered. The main reason for using the inverse “Γ” equivalent circuit is simplicity and the possibility to convert parameters to “T” equivalent circuit. The parameters of the inverse “Γ” equivalent circuit derived in relation to the parameters of “T” equivalent circuit are defined as:
  • R = L m L r 2 R r —the rotor winding resistance referred to the stator windings;
  • M = 1 σ L s —the magnetizing inductance;
  • L x = σ L s —the stator and rotor leakage inductances referred to the stator windings.
The total impedance of the IM phase circuit shown in Figure 1, when single-phase voltage/current supply is applied, can be calculated as a ratio of the voltage phasor at the motor winding V ¯ s and the phase current passing through a given winding I ¯ s , where φ represents the phase shift of the current relative to the voltage at a given frequency of the test signal ω. The real and the imaginary parts of the total impedance at the frequency ω of the test signal are represented with R Γ and X Γ .
Z ω = R Γ + j X Γ = V ¯ s I ¯ s = V ¯ s 0 I ¯ s φ
For the practical calculation of overall input impedance, it is necessary to measure voltage and current magnitude as well as the power factor considered with the parameter φ in (1). Therefore, the complex notation, as presented in (2), is more desirable than (1), since the power factor measurement is usually omitted:
Z ω = R Γ + j X Γ = V s d + j V s q I s d + j I s q
Relation (2) implies the necessity of adopting advanced computing for the calculation of real and imaginary parts of the input impedance Z ω .
On the other hand, total input impedance as a function of the supply frequency Z ω observed from the viewpoint of the equivalent circuit shown in Figure 1 can be expressed as follows:
Z ω = R s + j ω L x + R j ω M R + j ω M = R s + j ω L x + R ω M 2 + j R 2 ω M R 2 + ω M 2
where real and imaginary parts R Γ and X Γ are:
R Γ = R s + R ω M 2 R 2 + ω M 2 = R s + R Tot
X Γ = ω L x + R 2 ω M R 2 + ω M 2 = X Tot
Since the stator resistance R s parameter is estimated priorly, the real and the imaginary part of the total impedance, when the test signal with the frequency ω 1 is applied, can be derived as follows:
R Tot 1 = R ω 1 M 2 R 2 + ω 1 M 2
X Tot 1 = ω 1 L x + R 2 ω 1 M R 2 + ω 1 M 2
Limitation of the frequency of the applied sinusoidal test signal should be in a specific range. If the test signal frequency is set too low, the imaginary part cannot be measured; if it is set too high, the skin effect in the rotor windings, machine slot-induced harmonics reaction, and/or other non-modelled dynamics can be triggered. Therefore, it is recommended that the frequency of the test signal is in a range of the rated slip of IM.
Equations (6) and (7) represent the nonlinear set of two equations with three unknown parameters ( R , M , L x ), which, due to the degree of uncertainty within the system, cannot be solved. For this reason, it is necessary to use two test signals, and another impedance at different test frequency ( ω 2 ) has to be measured. The real and the imaginary part of impedance at the test frequency ( ω 2 ) are:
R Tot 2 = R ω 2 M 2 R 2 + ω 2 M 2
X Tot 2 = ω 2 L x + R 2 ω 2 M R 2 + ω 2 M 2
With the introduction of the second test signal, the equation system (6) to (9) becomes oversized and redundant. However, by carefully combining four equations, one can extract three unknown parameters to determine the unique solution. Nonlinear equation system (6) to (9) has an analytic solution by combining Equations (6)–(8):
R = R Tot 1 R Tot 2 ω 2 2 ω 1 2 R Tot 1 ω 2 2 R Tot 2 ω 1 2
M = R Tot 1 R Tot 2 ω 2 2 ω 1 2 ω 1 2 ω 2 2 R Tot 1 ω 2 2 R Tot 2 ω 1 2 ·   R Tot 1 ω 2 2 R Tot 2 ω 1 2 R Tot 1 R Tot 2
L x 1 = X Tot 1 ω 1 2 + R 2 M R 2 + ω 1 M 2
The only approach to obtain an analytic solution introduces R t o t 1 and R t o t 2 to calculate the parameters R and M first, as in (10) and (11). For that reason, the parameter L x has two possible solutions, which can be obtained from the Equations (7) or (9). The first solution for the parameter L x is presented in the Equation (12), and it is derived considering the imaginary part of the total impedance at the test frequency ( ω 1 ), which is given by Equation (7). The other solution for the parameter L x relies on the imaginary part of total impedance at the test frequency ( ω 2 ), which is derived from Equation (9) as follows:
L x 2 = X Tot 2 ω 2 2 + R 2 M R 2 + ω 2 M 2
The solutions for the parameter L x (12) and (13) are expected to match perfectly, since there is no significant dependency between leakage inductance and supply frequency. Yet, due to the errors during the measurement process, they may slightly vary to a certain level. For those reasons, a more precise solution for the parameter L x is given by Equation (14), where the arithmetic mean of (12) and (13) suppresses the measurement uncertainty.
L x = L x 1 + L x 2 2
The stator winding resistance parameter R s used in (4) is measured first. The procedure is based on the injection of two DC voltage test signals of different values ( V s 1 , V s 2 ) in order to cancel measurement offset and/or inverter nonlinearities [10]. Due to the DC excitation, a stationary magnetic field is produced, and no starting torque is induced. With stator currents measured in the steady state ( I s 1 ,   I s 2 ), the influence of inductances is avoided, and the unknown stator resistance R s is measured accurately using a simple Equation (15). Phasor formalism and advanced computing due to the non-availability of power factor measurement are avoided since voltages and current are in phase due to injected DC test signals.
R s = V s 1 V s 2 I s 1 I s 2

3. Practical Implementation Aspects

The effectiveness of the proposed technique depends on the accuracy of two successive measurements of the real and imaginary part of total stator impedance, performed for two different test frequencies. Considering (2), the following equations in dq reference frame are derived:
R Γ = V s d I s d + V s q I s q I s d 2 + I s q 2
X Γ = V s q I s d V s d I s q I s d 2 + I s q 2
The accuracy of measurement of real and imaginary part results based on (16) and (17) is affected by both single-phase supply unbalanced condition and the non-linearity of the inverter as a voltage source.
The single-phase supply is provided only in one phase of stator windings, thus creating unbalanced condition in IM during the self-commissioning technique. Unbalanced condition is a consequence of supplying only the α axes with the sinusoidal test signal, resulting in non-constant variables in dq reference frame. Yet, pulsating magnetic field formed from single-phase supply can be decoupled on direct and inverse rotating magnetic fields with opposite directions. After Park transformation, the dq reference frame will rotate synchronously with the direct magnetic field, while the inverse rotating magnetic field will rotate twice faster in the opposite direction and produce undesirable sinusoidal components with a double frequency of the test signal.
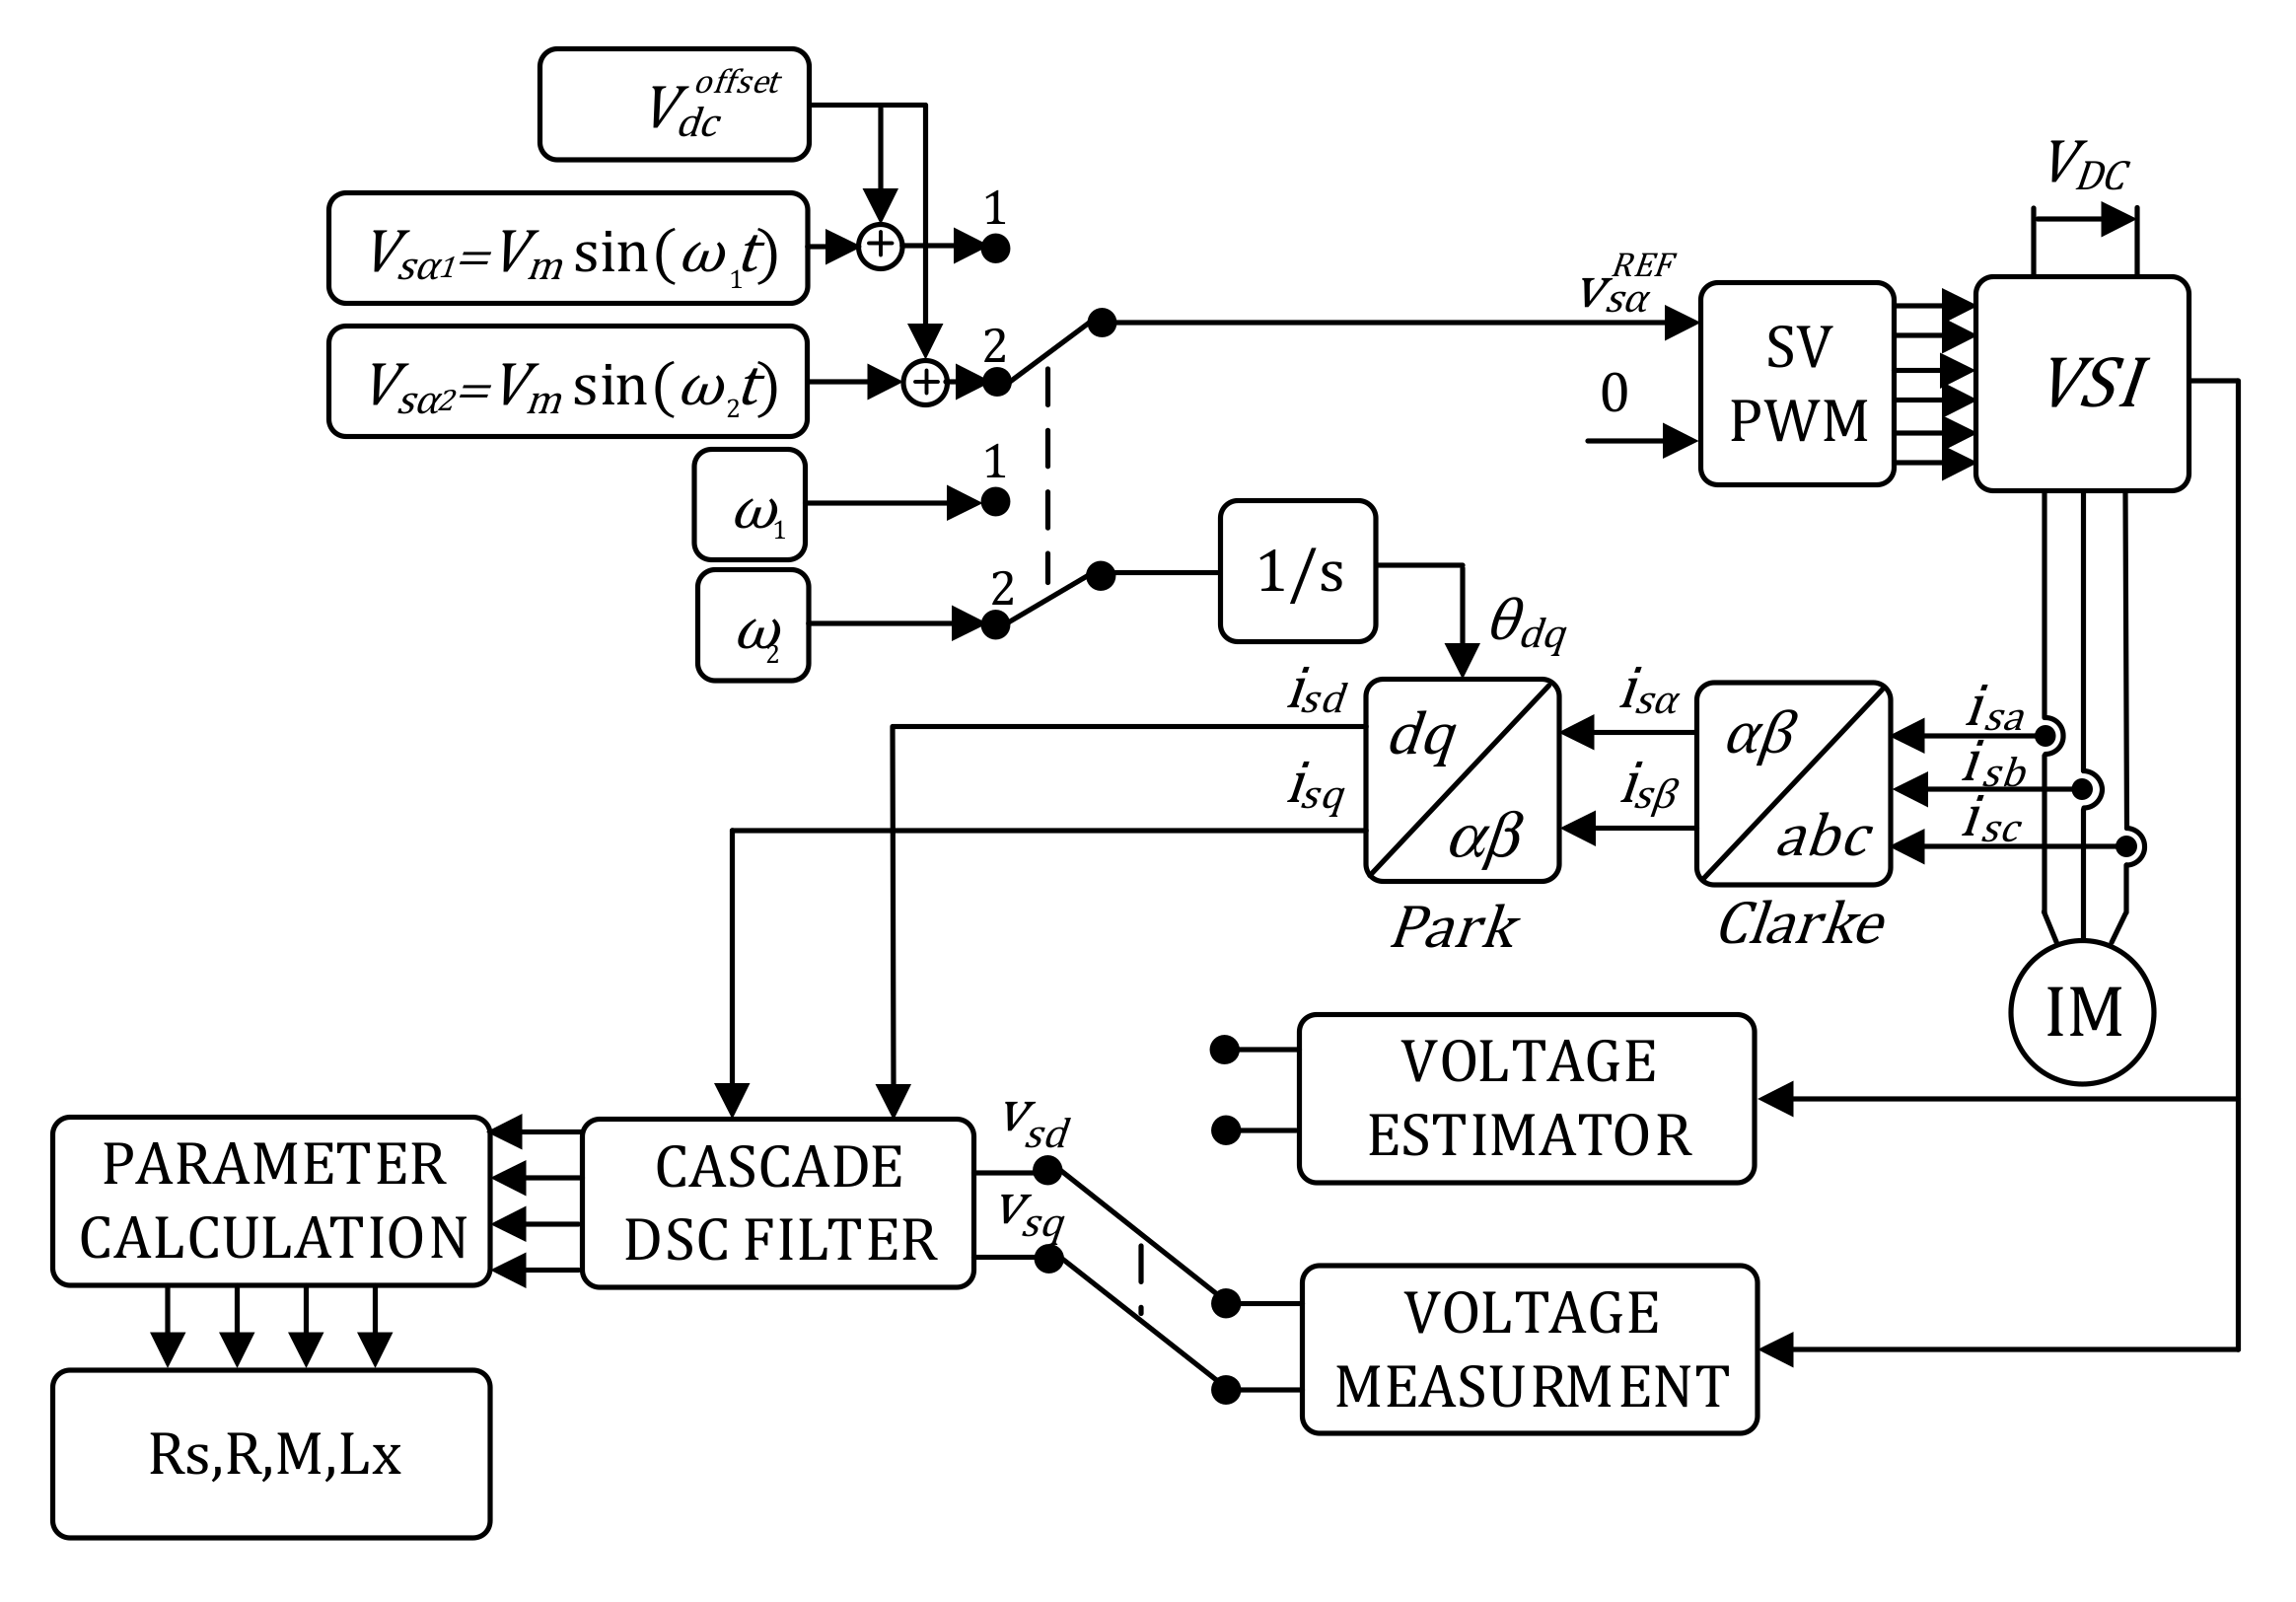
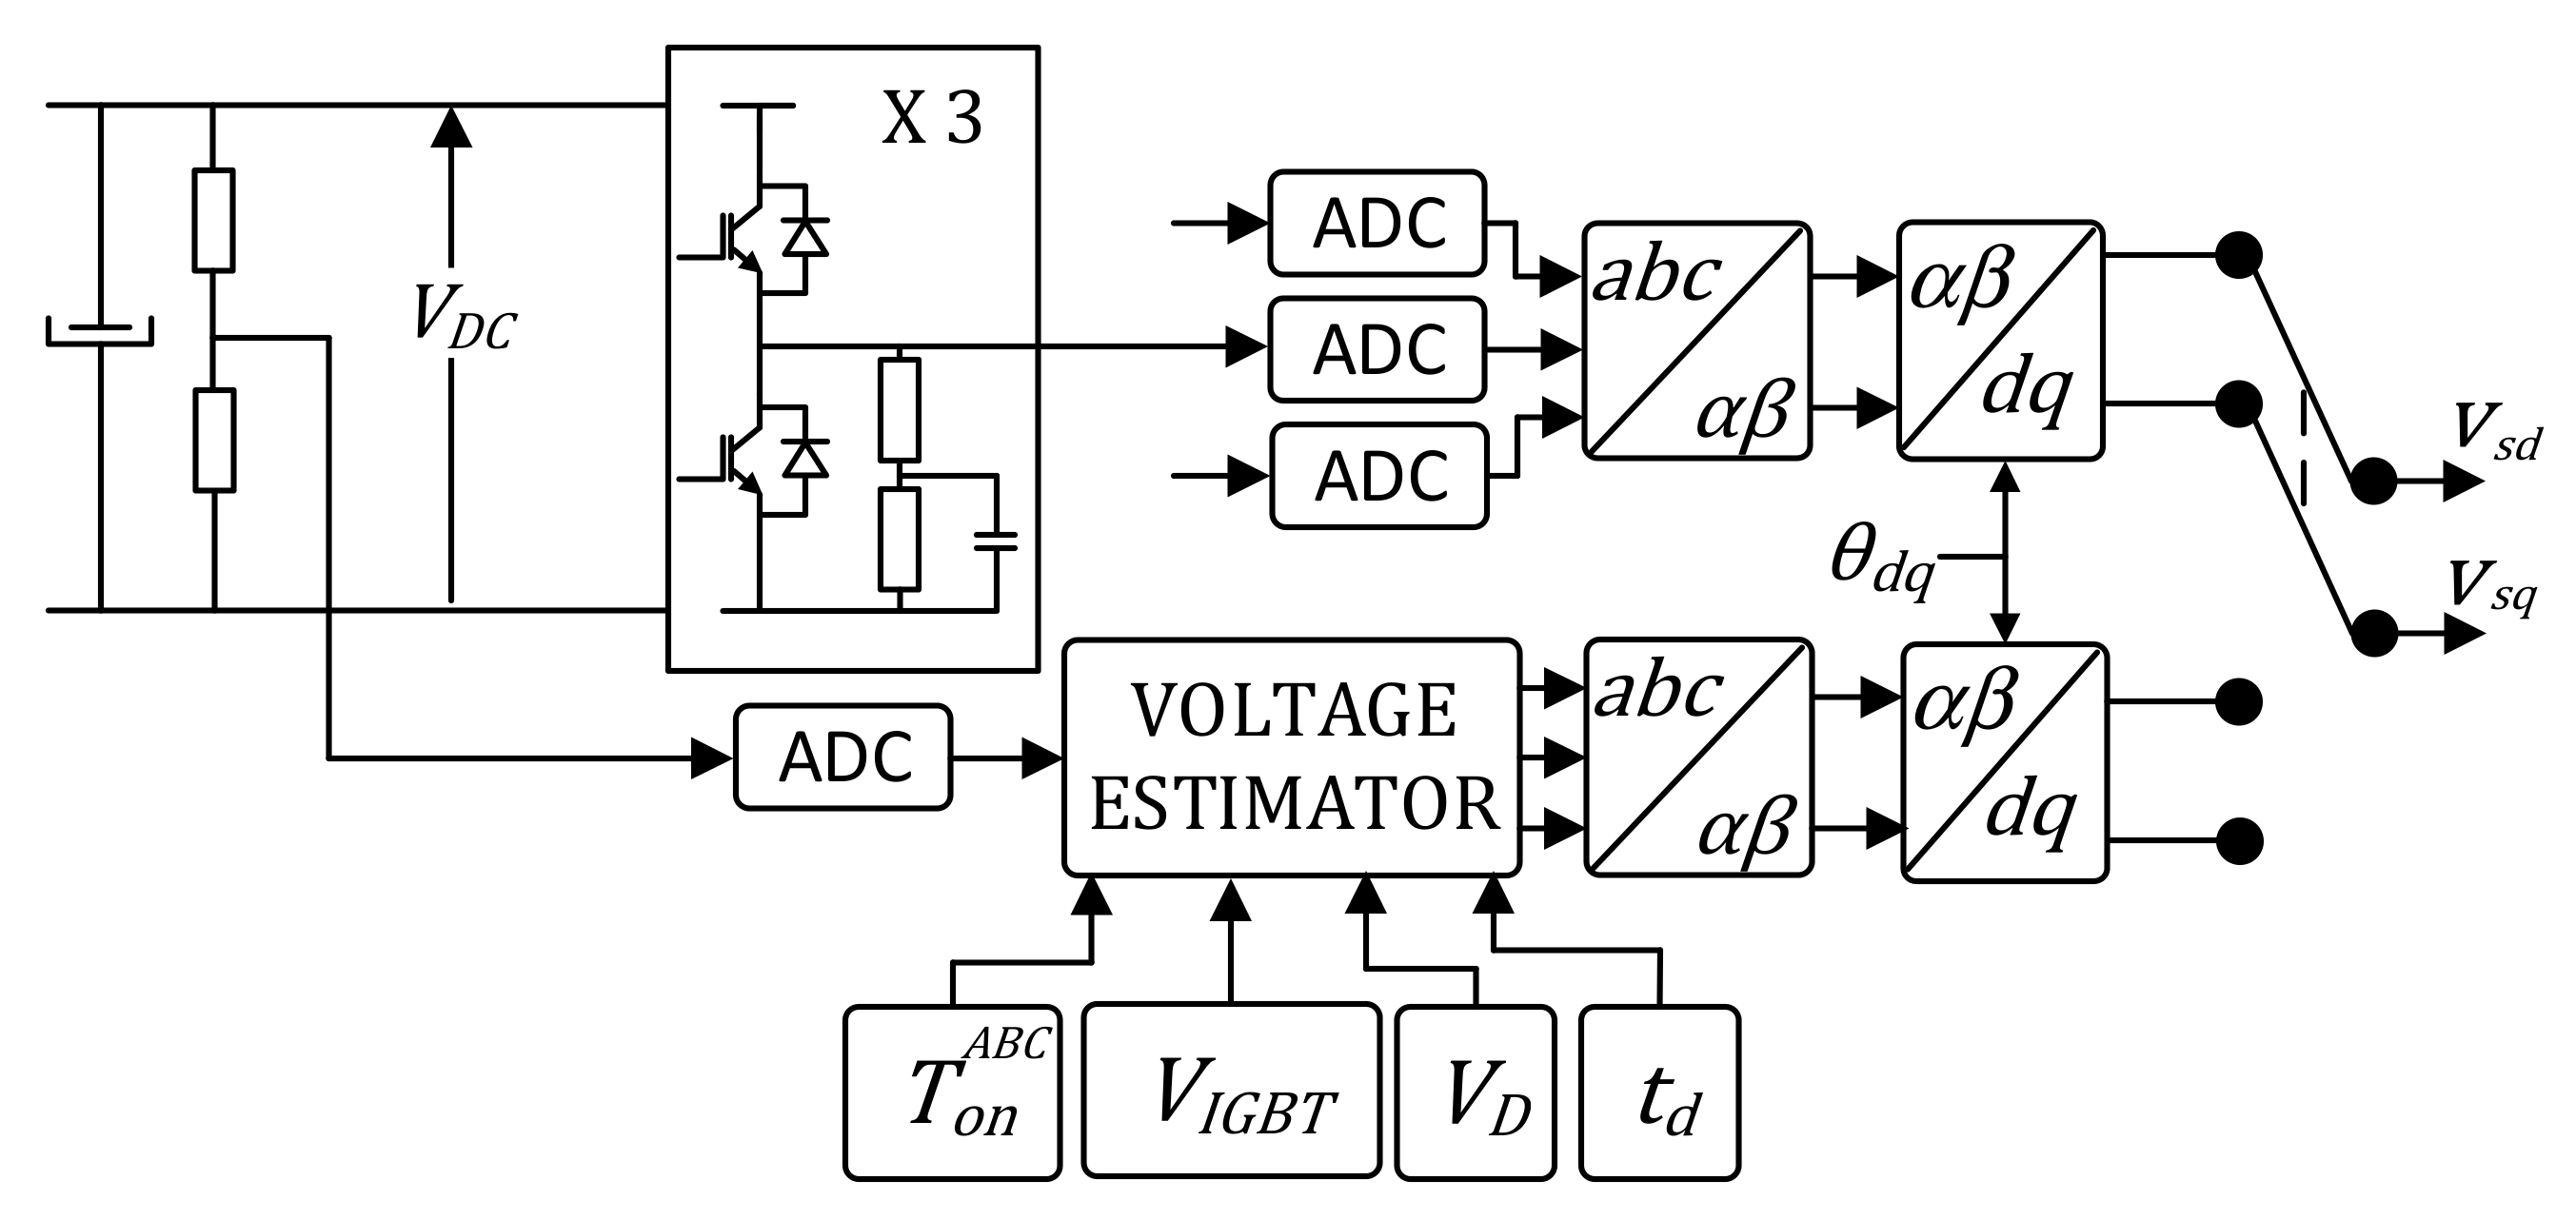
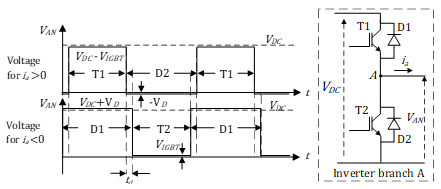
The proposed self-commissioning technique is also affected by the nonlinearity of inverter, which is the consequence of power electronic component voltage drops, switching transients, inserted dead time, and PWM signal propagation delay [21,22]. This nonlinearity creates the harmonic distortions of both voltage and current waveforms, and therefore makes the signal processing procedure more sensitive. To avoid zero crossing, and to minimize the influence of the inverter nonlinearity on the output voltage waveform, the DC offset is added to the original sinusoidal test signal. Yet, the added DC offset produces an undesirable sinusoidal component with the same frequency as the frequency of the AC test signal in the dq reference frame, which has to be removed during the signal processing phase.
The new advance solution for the filtration of voltage and current in the dq reference frame is an implementation of the cascade delay signal cancellation filter (DSC filter). DSC filter is an effective and robust method for the detection of positive- and negative-sequence components of voltages and currents in a vast range of applications [23,24,25,26]. After the DSC filter, even with an unbalanced test signal, all variables in the dq reference frame become constant values, and it is possible to represent them as complex numbers, which would make Equations (16) and (17) solvable.
The general principle of the DSC filter is the summation of the original signal, which has an undesirable harmonic component on a specific known frequency and the original signal, which is phase-shifted for the appropriate number of periods in order to cancel an undesirable harmonic component. Therefore, the transfer function of the DSC filter is defined as:
G D S C k T s = a · V d q k T s + e j θ r V d q k k d T s
where a represents the constant complex gain of the transfer function, T s is the sample rate of a discrete-time signal, k d is the number of samples to which the original signal is phase-shifted, and e j θ r rotates the delayed signal by the angle θ r . Due to the summation of the phase-shift and the original signal, a newly created signal has to be divided with two, which implicates that the parameter | a | is set to 0.5. The other parameters of DSC for eliminating the specific harmonic component, which is undesirable, are depicted in Table 1. The DSC filter is not usable to filter some stochastic signal; therefore, the harmonic order of undesirable components has to be known.
The cascade DSC filter is implemented both in the Matlab/Simulink toolbox, for computer simulation, and in the microcontroller for the experimental verification of the proposed technique. Two DSC filters are connected cascading to a row, with the first filter used for suppressing the component with the double frequency of the test signal originating from the inverse rotating field, and the second filter suppressing the component with the frequency of test signal related to the DC offset.

4. Self-Commissioning Technique Evaluation through Computer Simulation

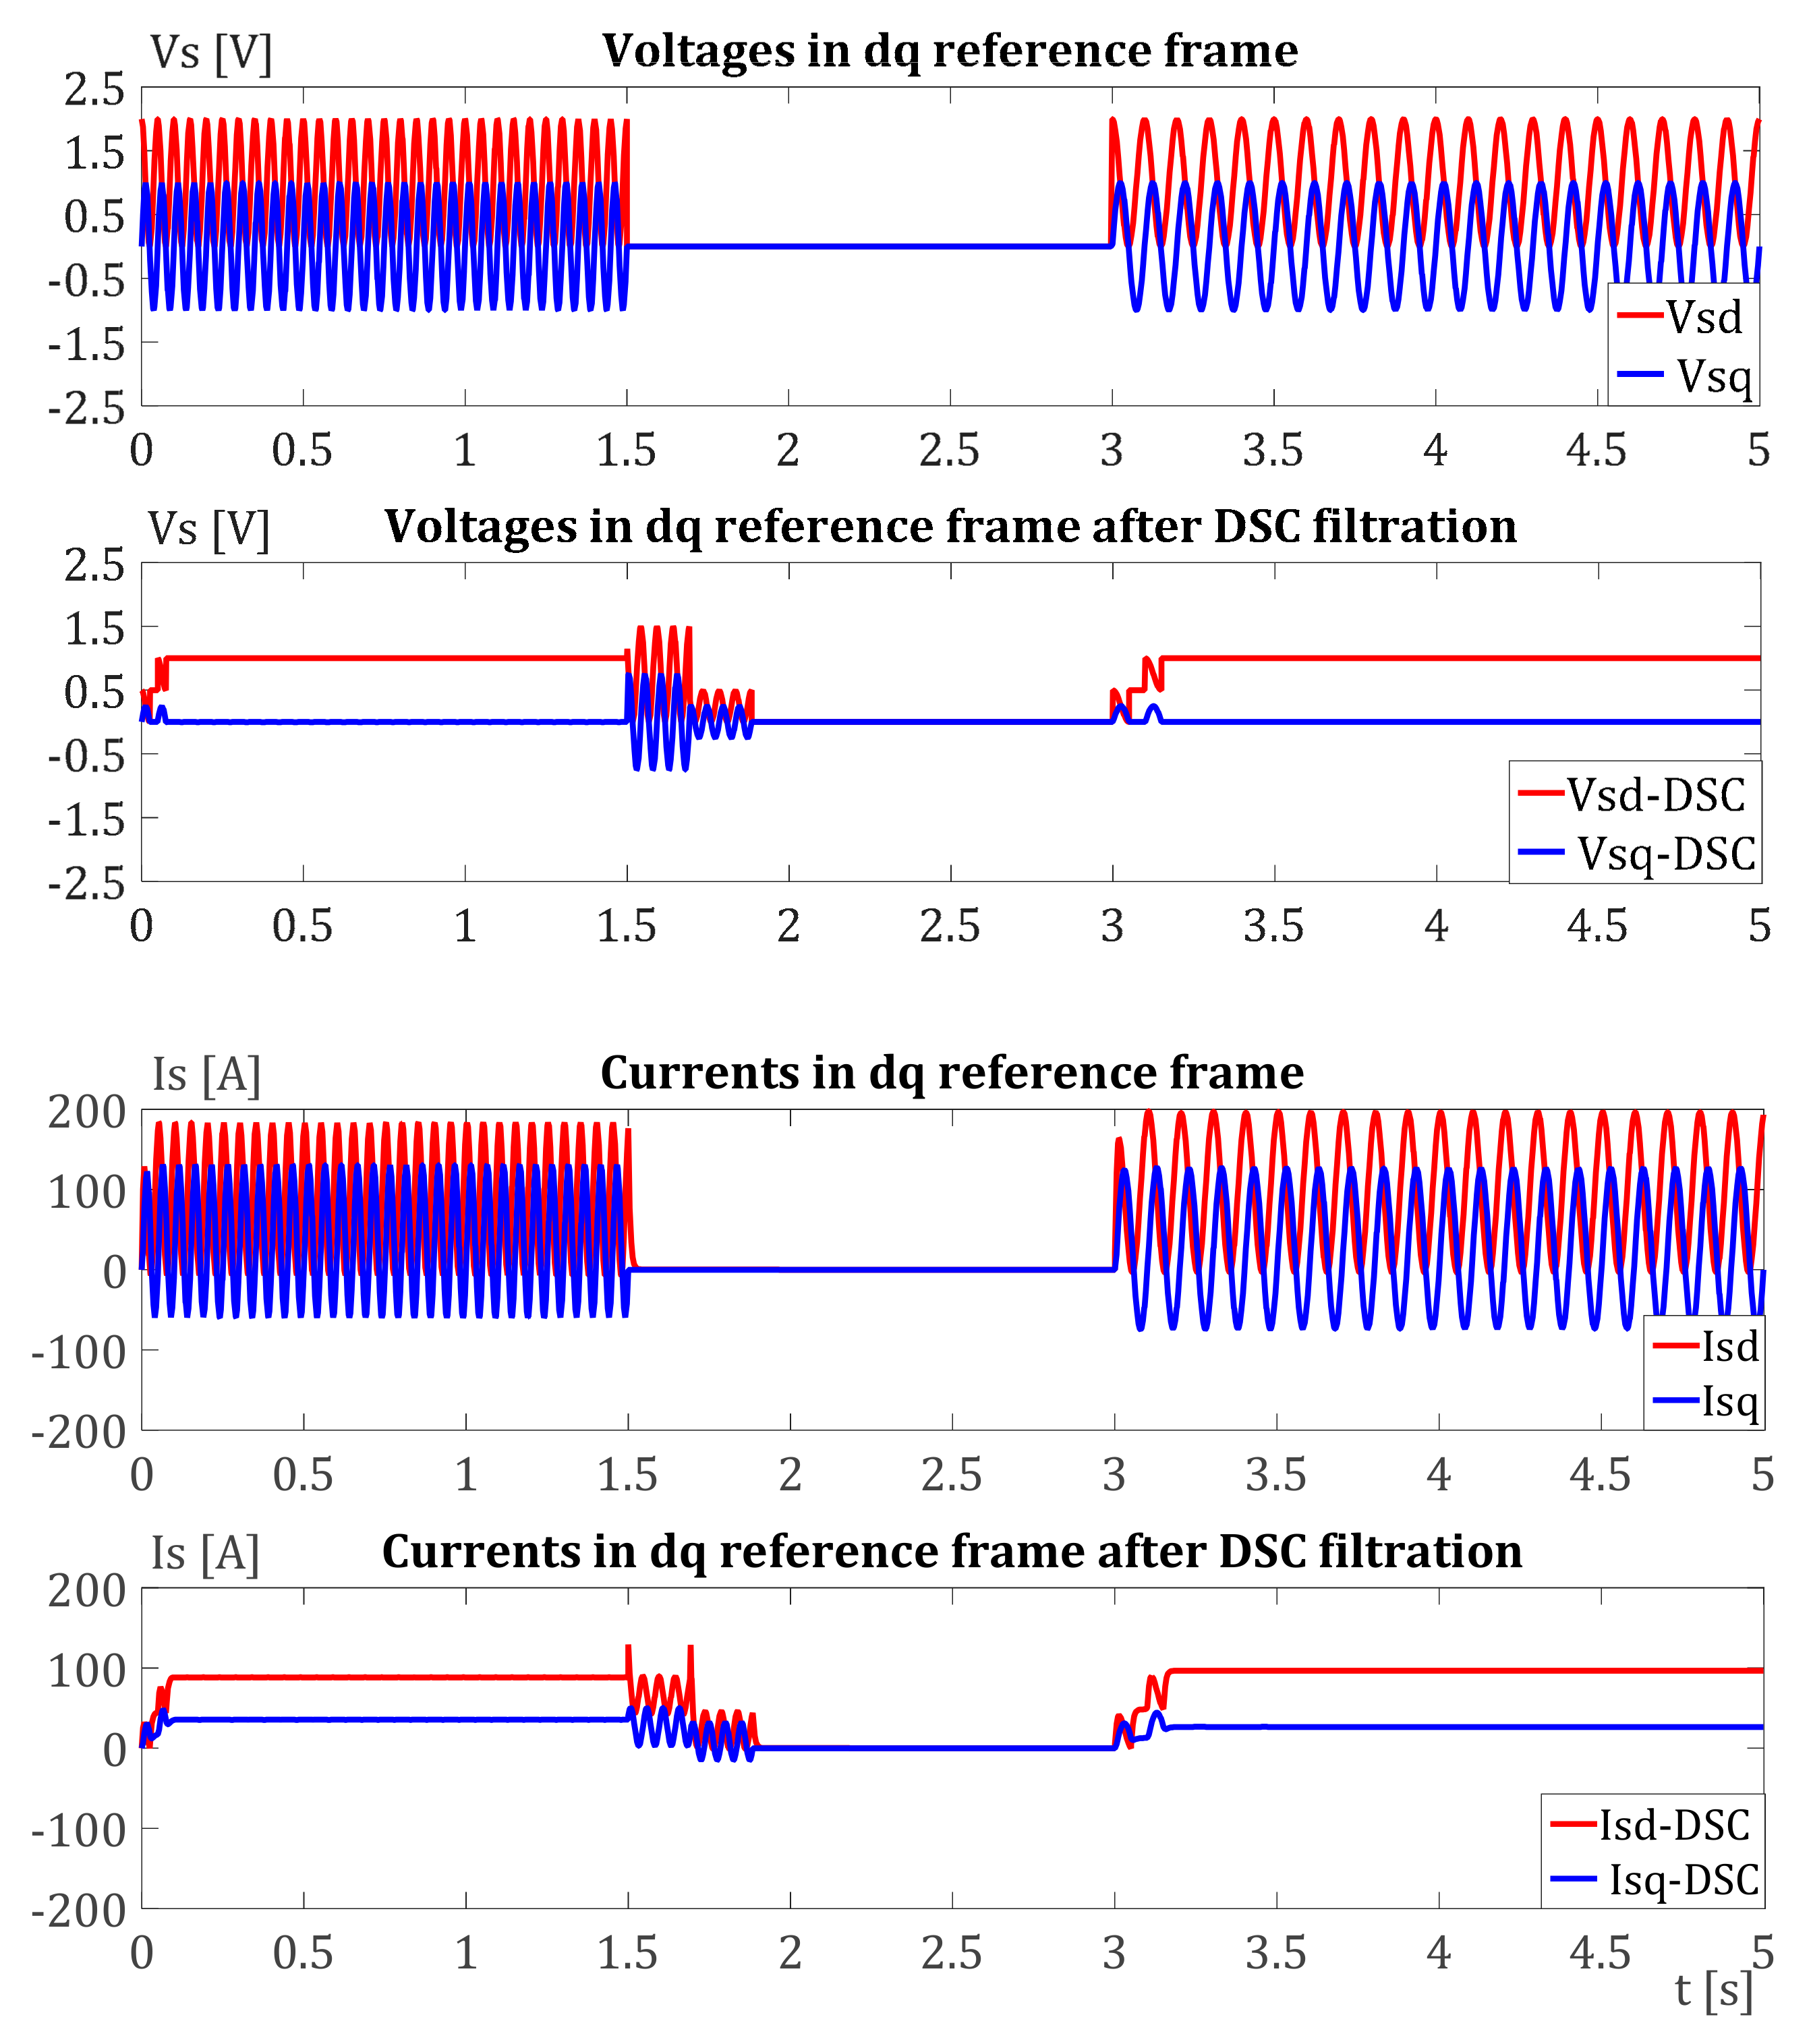
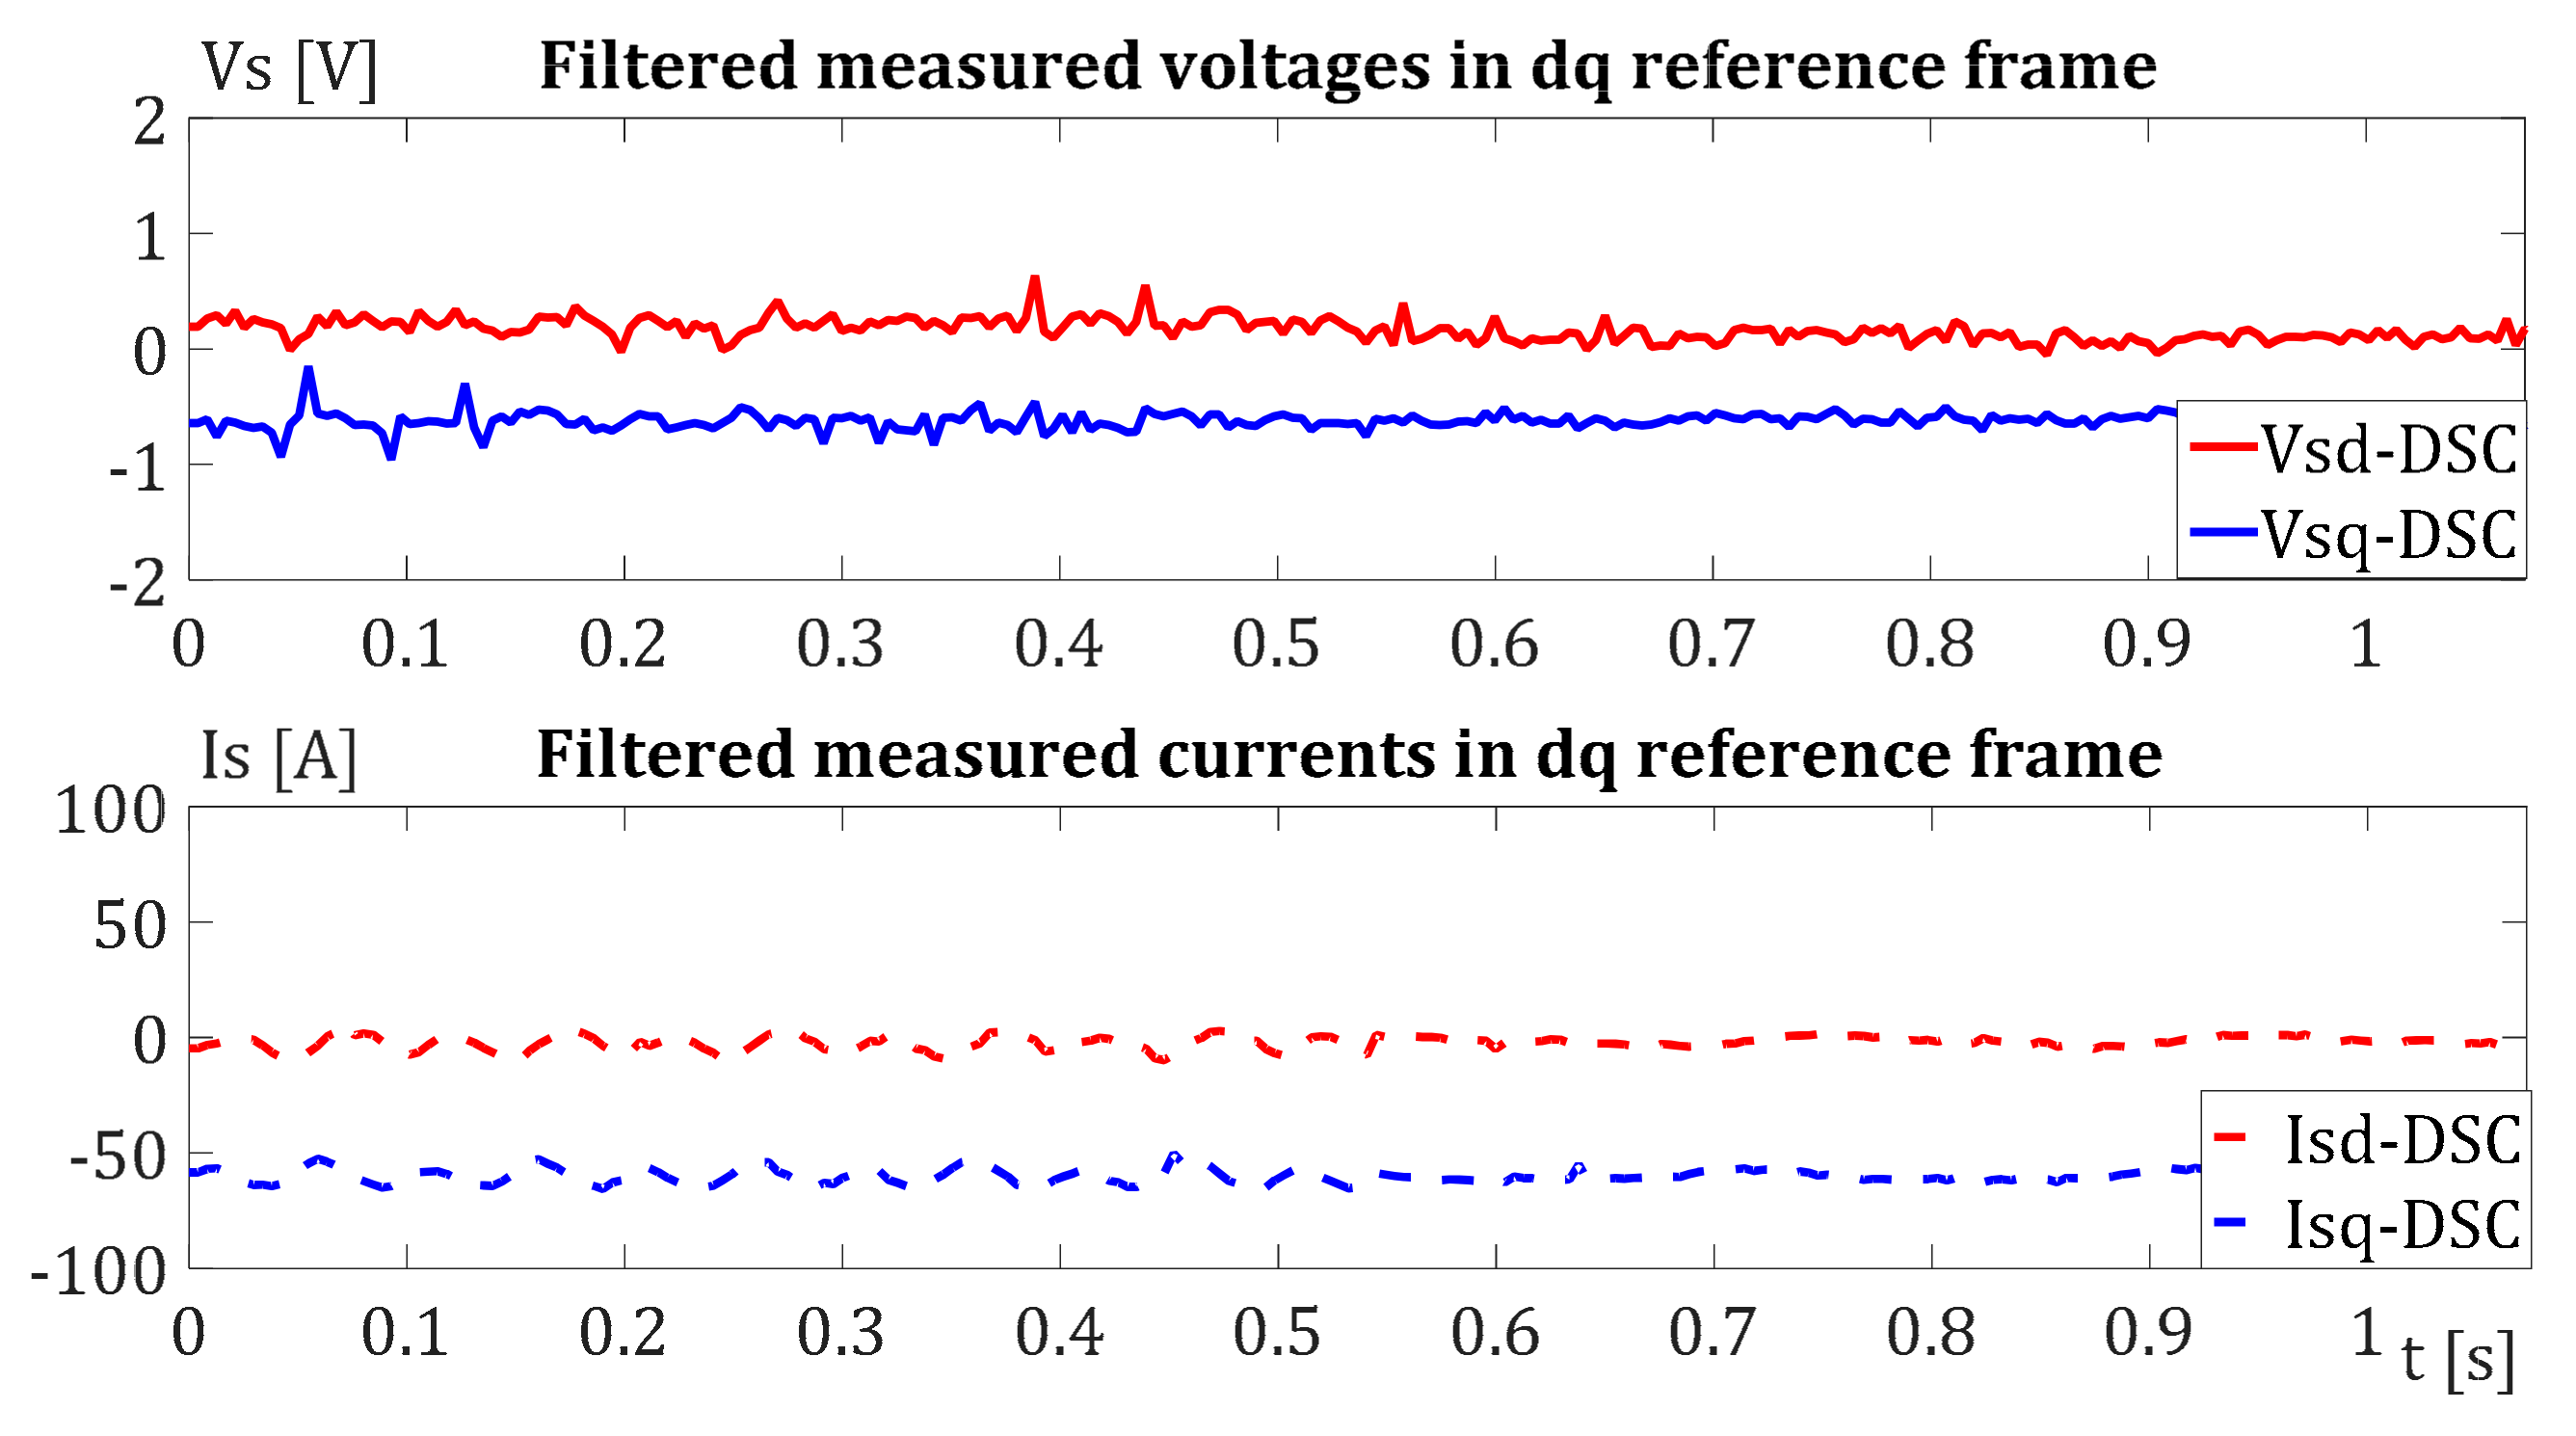
The proposed IM self-commissioning technique is verified first via computer simulations. The IM model is created in the Matlab/Simulink toolbox with parameters set according to the data obtained from the motor manufacturer. The IM model is excited with sinusoidal voltage test signals, with 2 V amplitude and with the DC offset added as suggested in Section 3. The results of computer simulations with the frequency of voltage test signals set to 10 Hz and 5 Hz are shown in Figure 2.
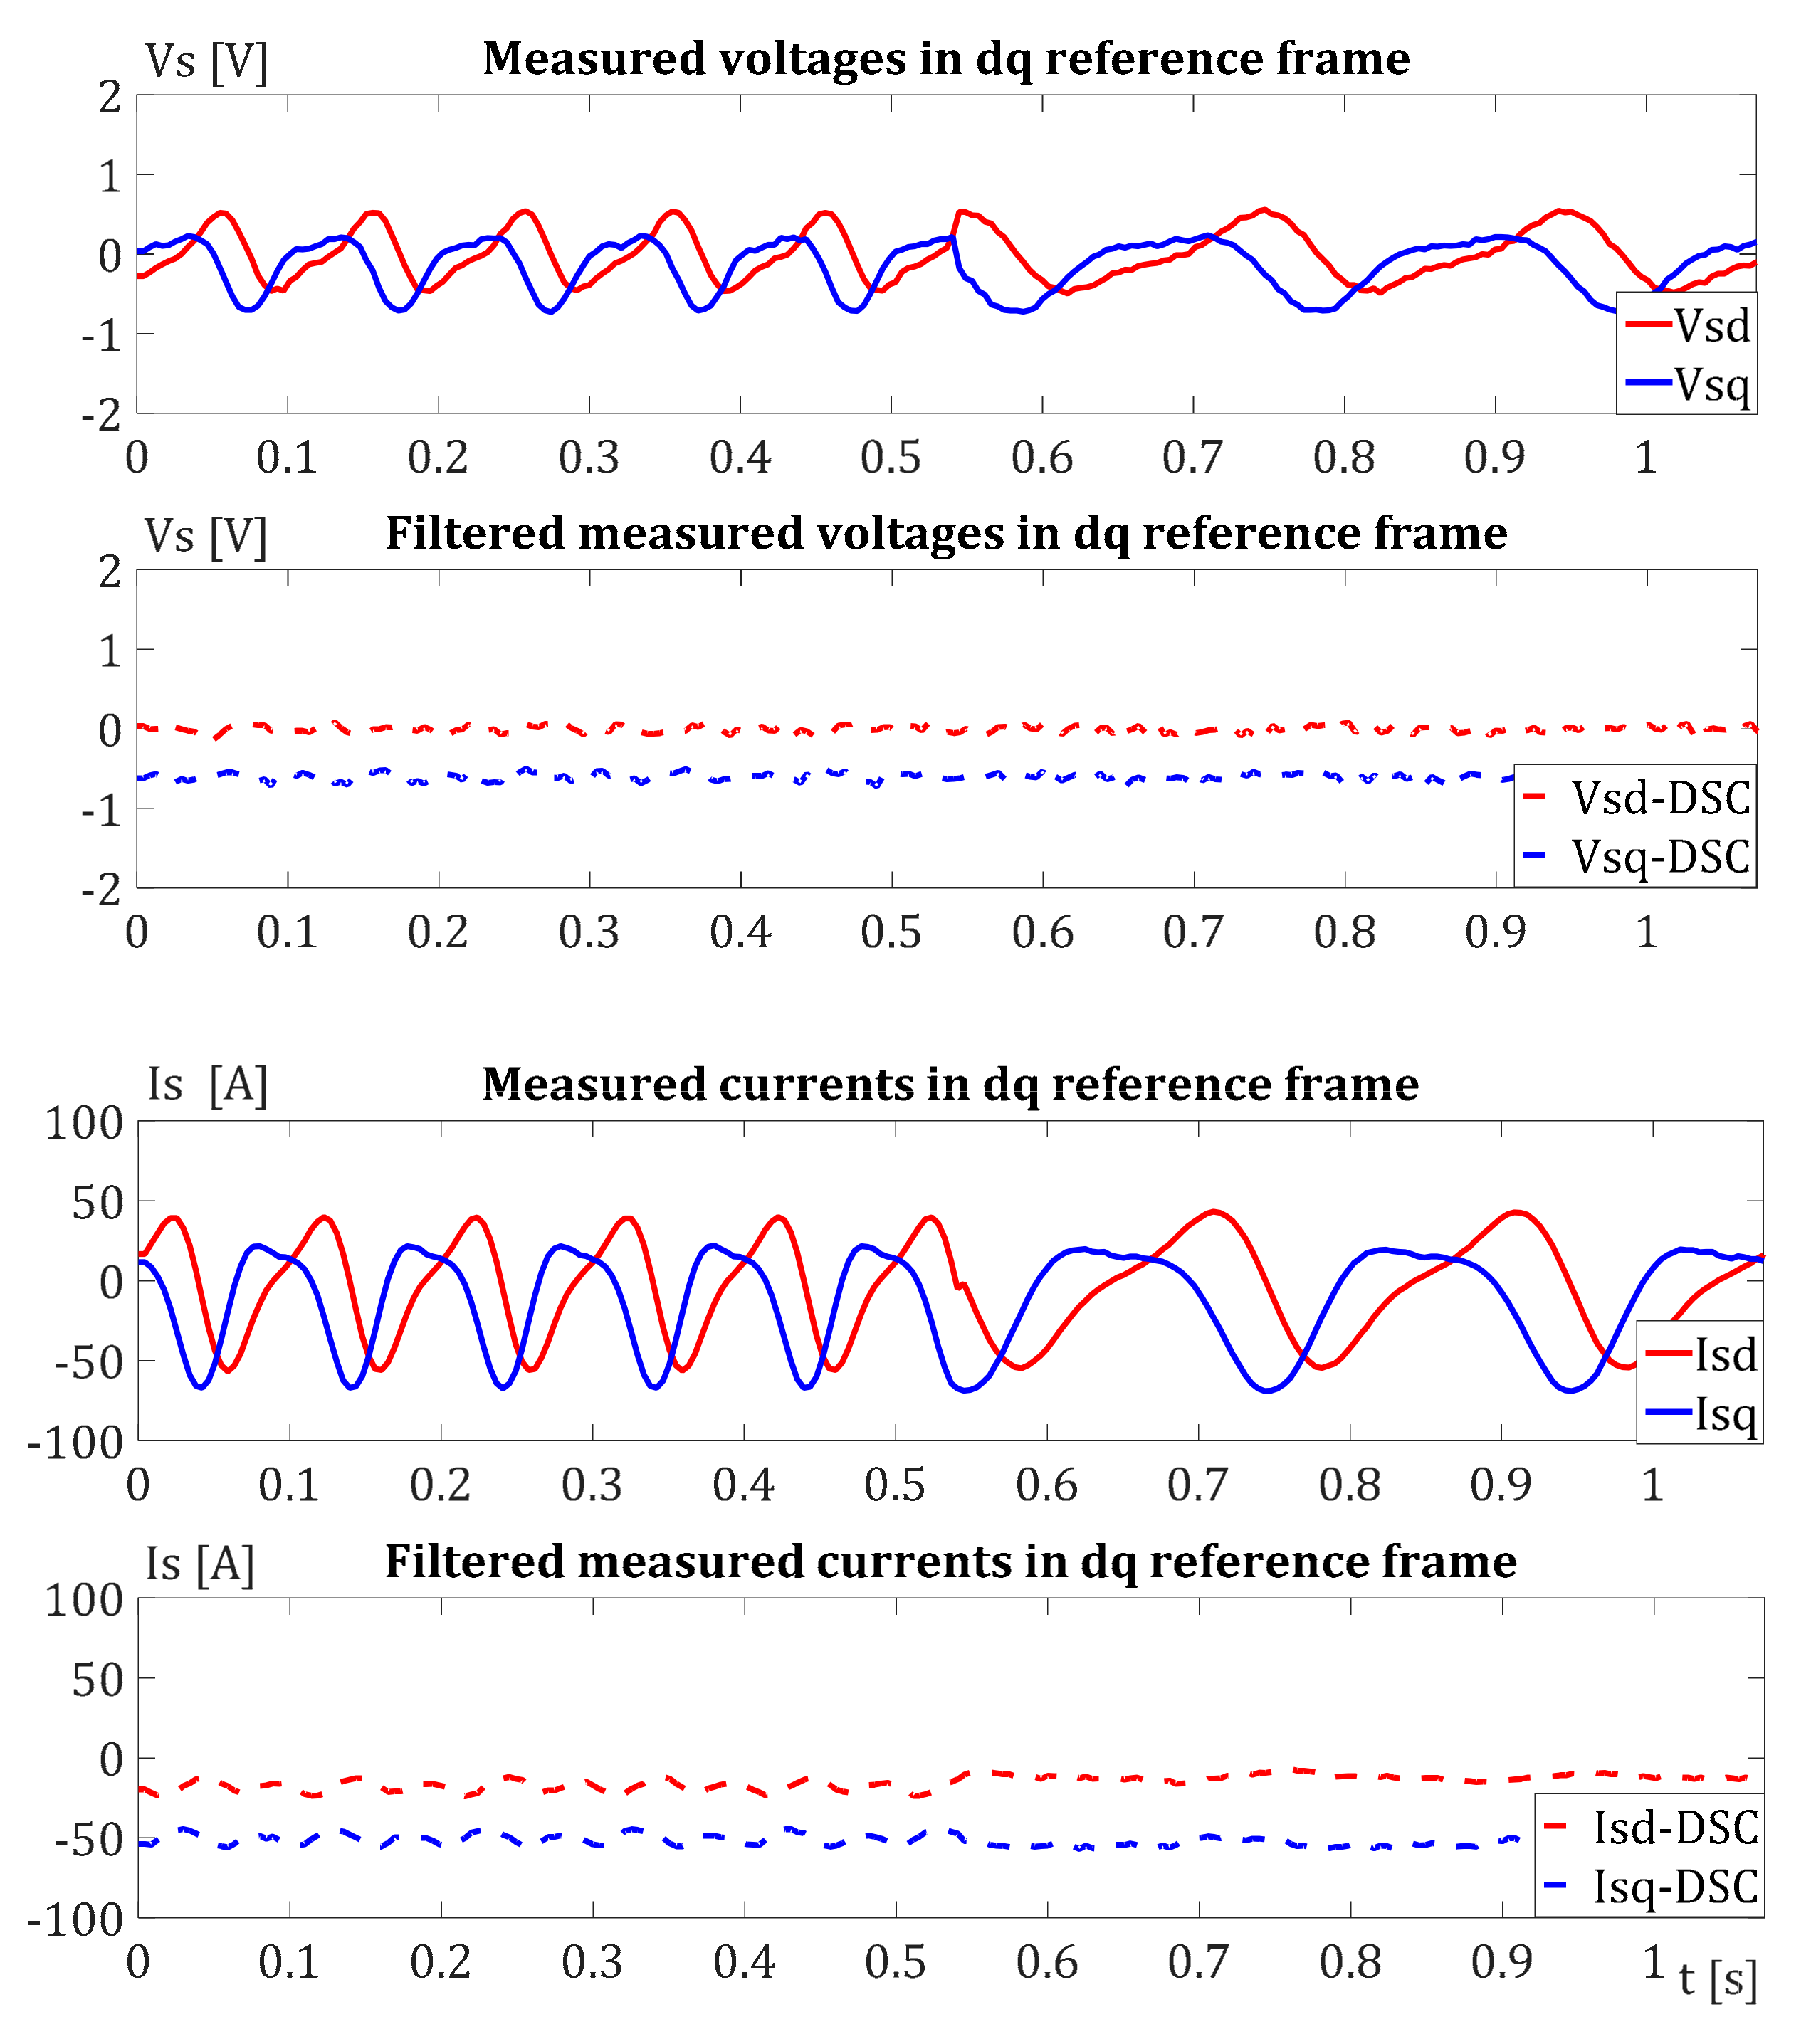
The upper two subplots in Figure 2 present voltages in the dq reference frame before and after the DSC filtration process, while the lower two subplots represent currents. From the waveforms of the filtered voltage and current after the transition between different test signals, the cascade DSC filters demonstrate an unstable response. The main reason for that is the fact that filters continue to add a phase-shifted signal to the original signal, which is repealed in a moment of 1.5 s.
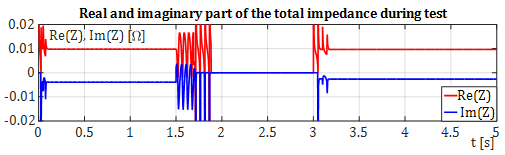
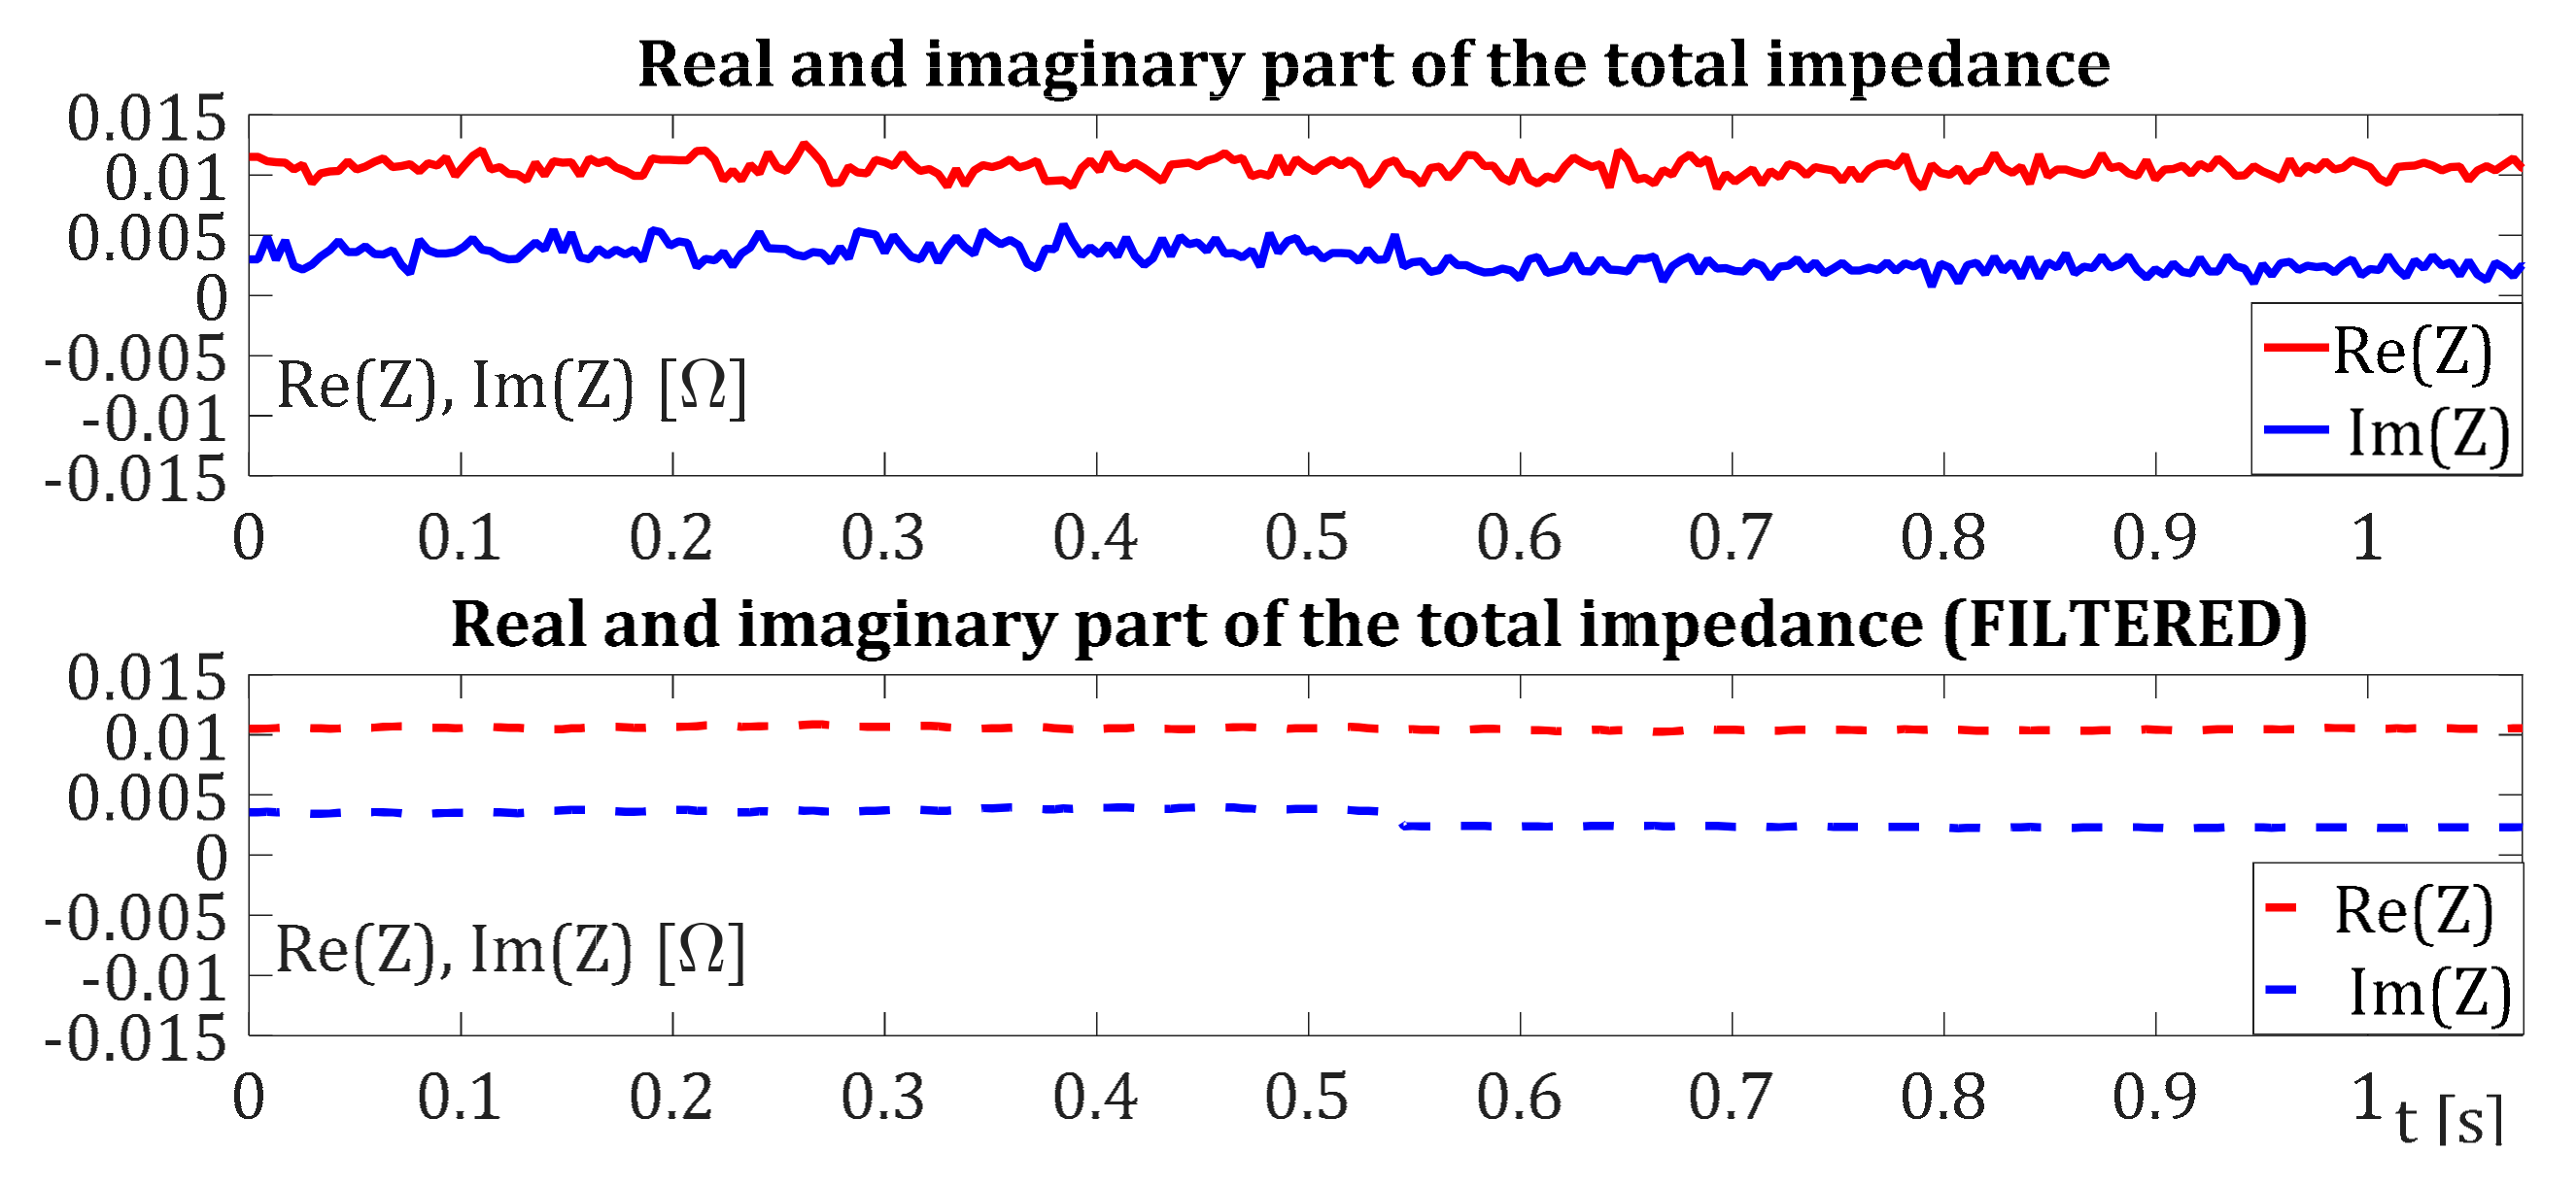
Using signals in Figure 2 and Equations (16) and (17), the waveforms of the real and the imaginary part of IM impedance are created and presented in Figure 3.
All parameters of the IM equivalent circuit, except stator resistance, are calculated in Matlab M-script file using steady-state samples of results shown in Figure 3. After several simulations performed with different frequencies of test signals, three relevant parameters ( R , M , L x ), are calculated and presented in Table 2. The relative errors of calculated parameters with respect to parameters obtained from the manufacturer are also depicted in Table 2.
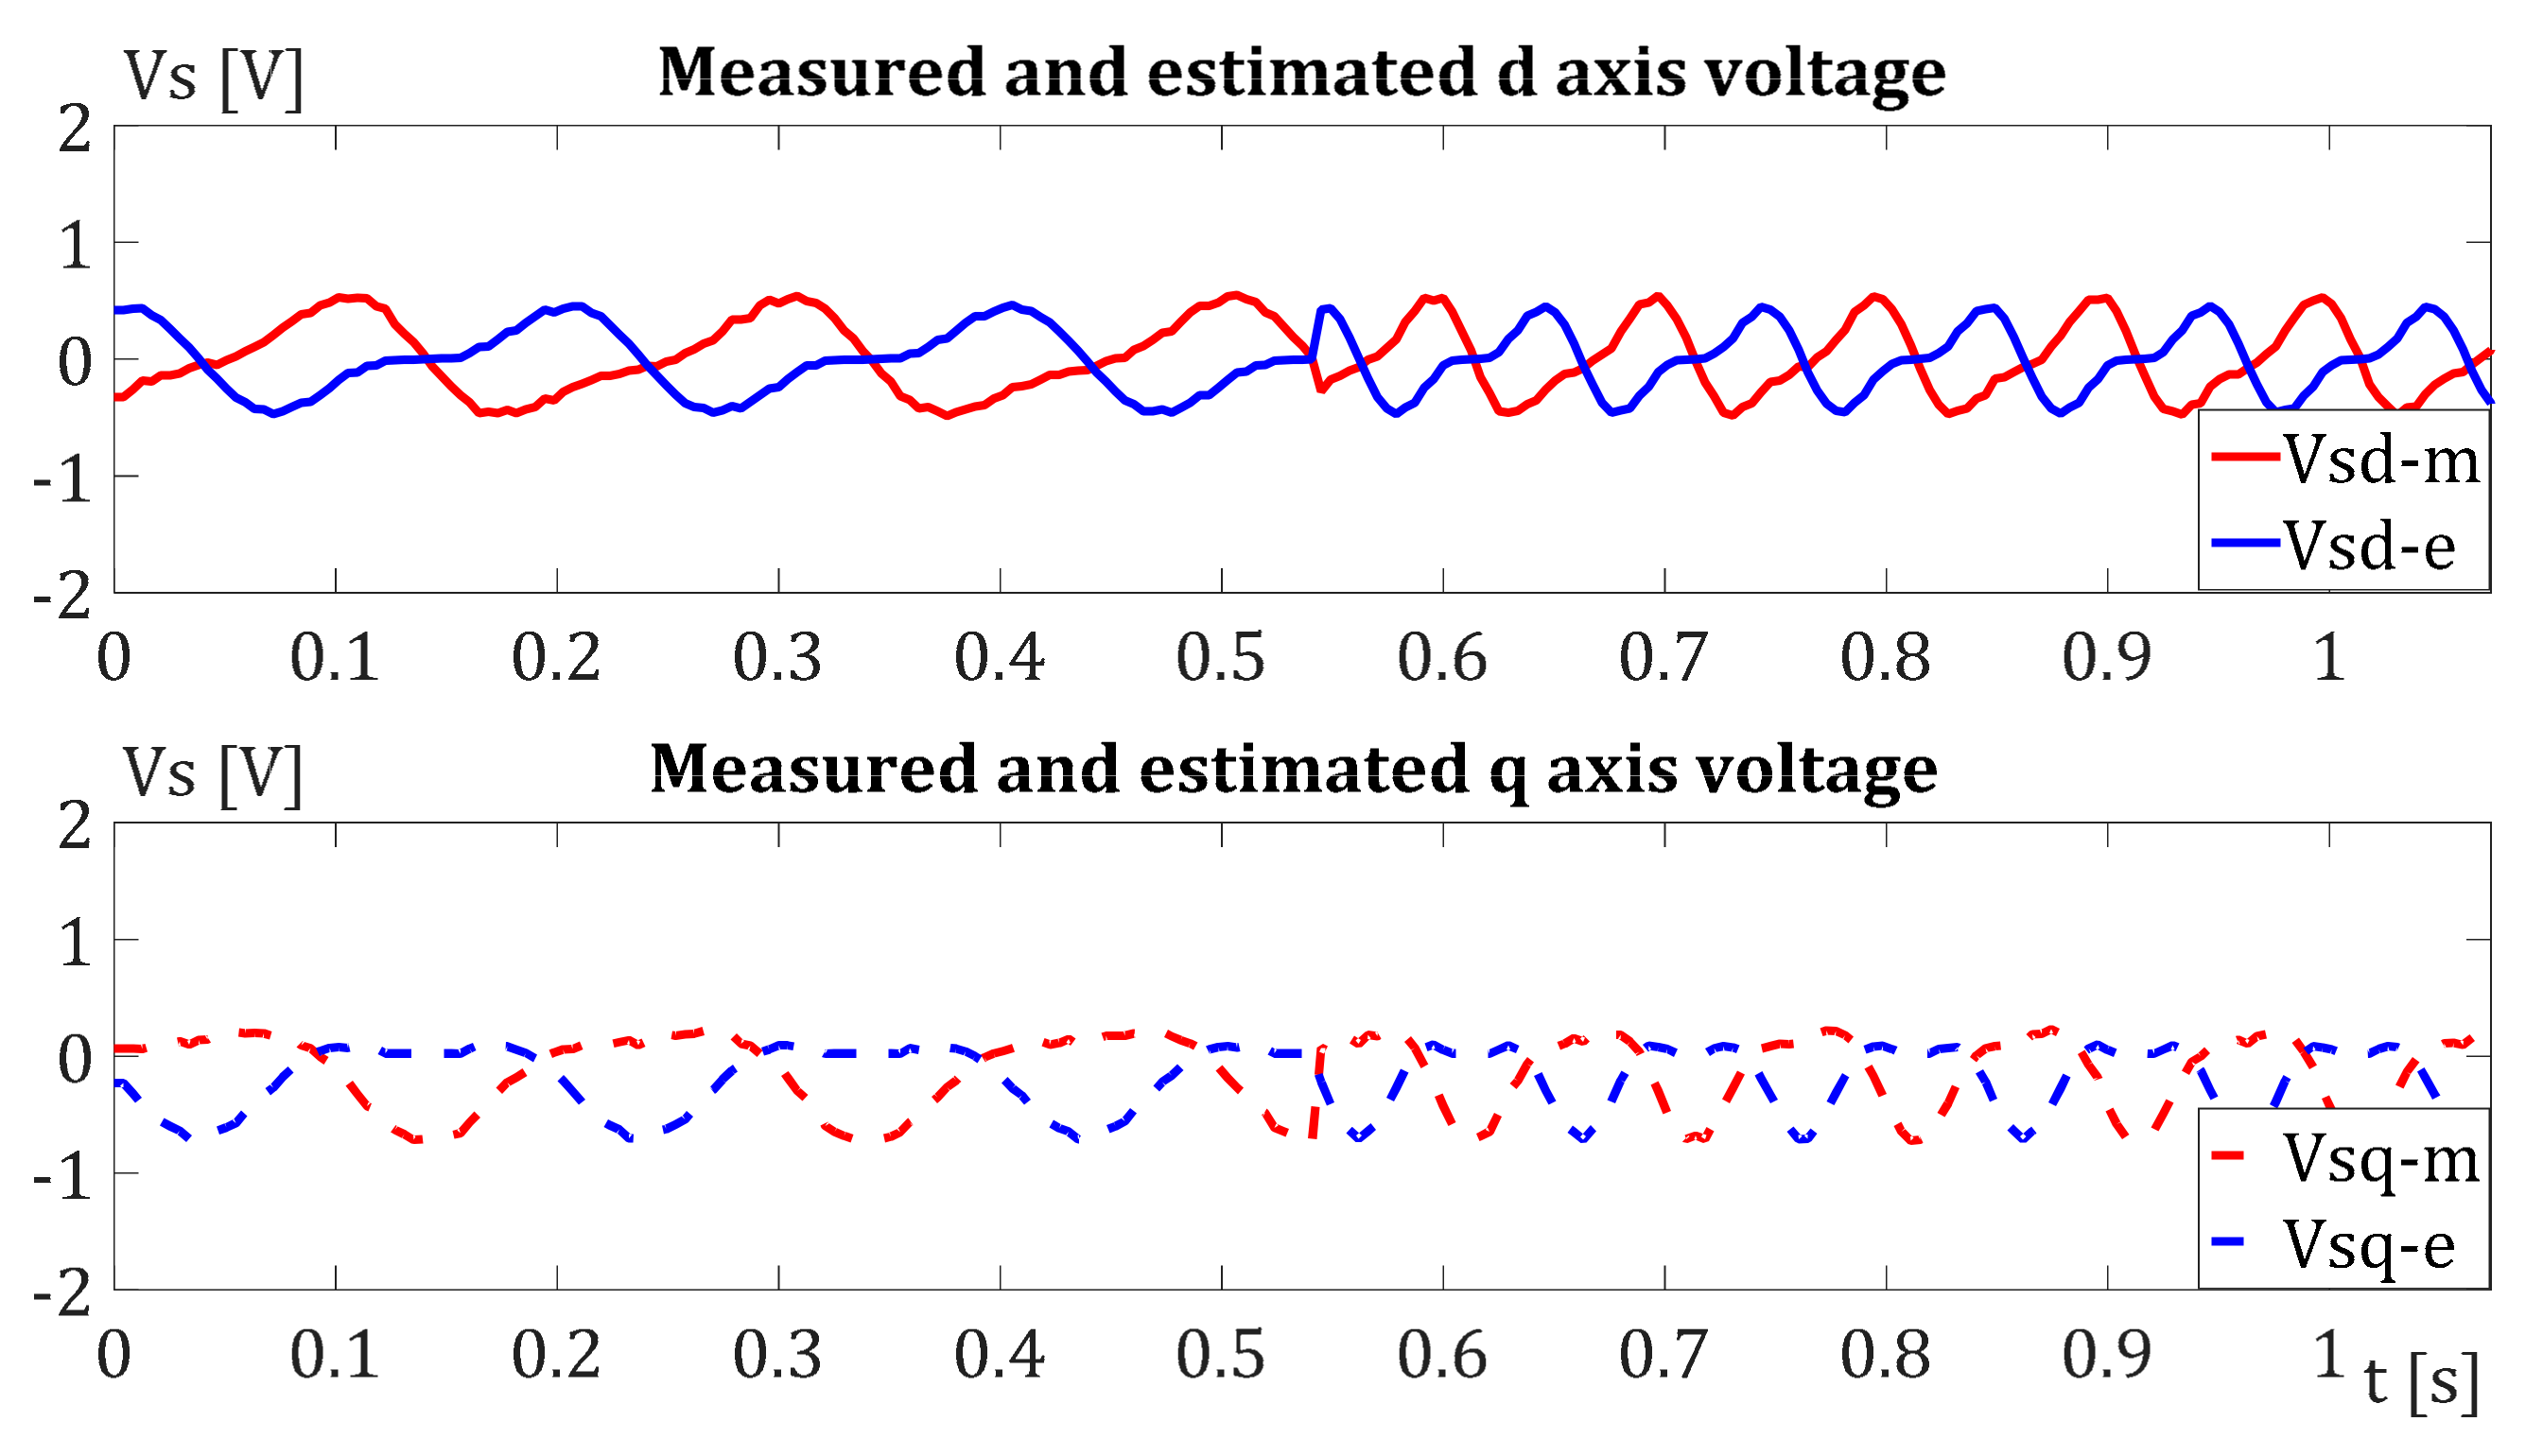
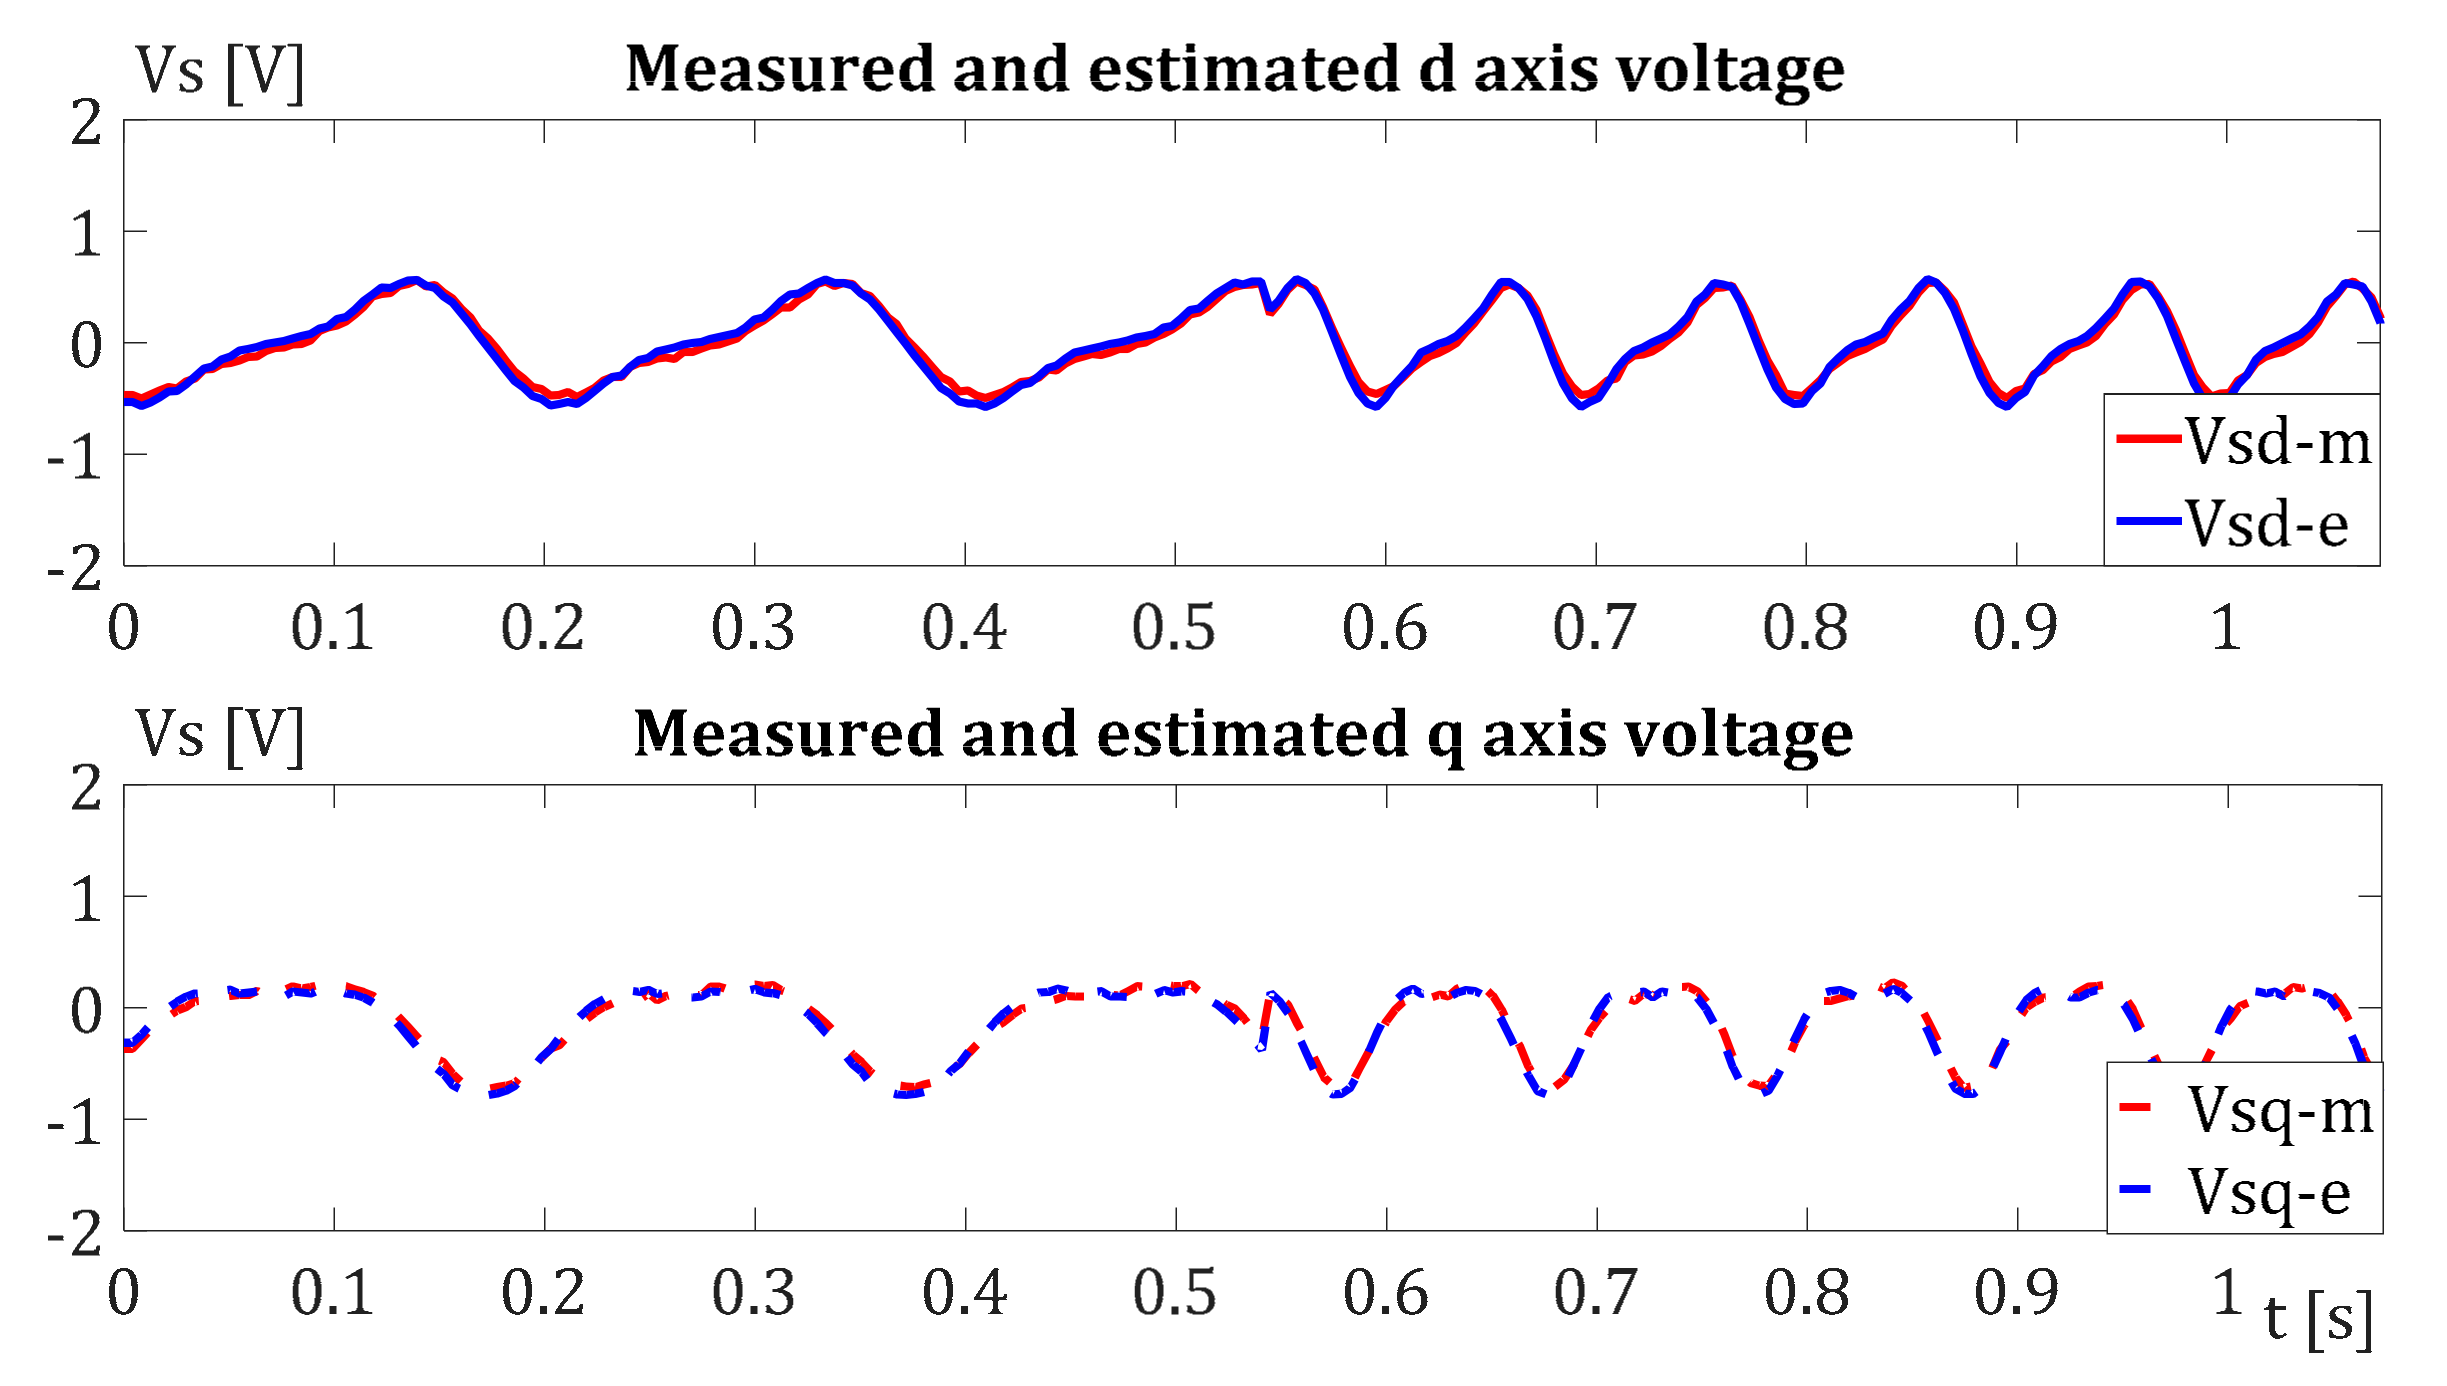
The obtained results of computer simulations certainly encourage the implementation of the proposed self-commissioning technique on a real drive. However, it should be taken into consideration that errors of voltage measurements or estimations are not included in computer simulations. Therefore, in real drive application, the voltage signal error and IM inductance saturation effect have to be considered. The influence of those effects will be discussed in the next chapter, in which the application of this self-commissioning technique on the specific IM traction drive using a low voltage IM is considered.

5. Results

In this section, experimental setup is described, and the results of the proposed IM self-commissioning technique using both voltage and current test signals are provided.

5.1. Experimental Test Workbench

The proposed self-commissioning procedure is tested on low voltage IM used for traction drive, with nameplate data: 5 kW, 48 V, 80 A, 3 phase, 5000 rpm, 170 Hz, PF 0.9, IC H, drive type: S2-60 min.
The test bench used for the verification of the proposed self-commissioning technique is presented in Figure 4. It consists of two identical low voltage IMs of maximum drive current 730 A, mechanically coupled to form a motor-generator group for the purpose of motor loading. Since loading is not necessary in this test, the shafts were decoupled. Power electronics consist of the switched three-phase inverter, which converts the electric energy from DC battery supply to AC using PWM technique with the carrier frequency set to fPWM = 16 kHz. Digital control and the implementation of the technique is performed by using the microcontroller STM32F303. This setup is connected to the DC supply, which mainly consists of four 12 V batteries connected in series to form a stable 48 V motor supply. An additional variable voltage switching DC supply is connected in parallel to regenerate the batteries during the idle state of the drive from the grid. Programming and software verification is performed from the PC terminal equipped with GUI to perform all the necessary actions for the proper control and data recording during the test. Data transmission has two modes of operations, both implemented through the serial link. For online data monitoring, asynchronous data acquisition mode is used. The corresponding mode of data sampling can continuously transmit up to 8 selected variables from the microcontroller to the PC and vice versa, with the maximum transfer rate of 1 ms. Triggering data transmission mode, which can transfer up to 8 variables via an internal buffer (of maximum length 212) in the microcontroller, can only be adopted during the offline acquisition. In that case, data capturing is performed synchronously at the PWM rate or as an integer product of the PWM rate, but the total amount of data is limited. Data diagnostic, dispatching arbitration, and transmission redundancy check are performed at both transmitter-receiver sides through the corresponding serial communication protocol layers.

5.2. Experimental Results with Two Voltage Sinusoidal Test Signals

The experimental system configuration for the implementation of the technique with two sinusoidal voltage test signals is shown in Figure 5. Considering low voltage IM application, where small voltage drops can cause inaccurate measurements, the drive is equipped with a circuit for direct IM phase voltage measurement. Since the used traction drive has voltage estimation options as well, both possibilities are tested and compared through a variety of experiments. Likewise, due to the fact that the proposed self-commissioning technique is using single-phase sinusoidal excitation, the flux amplitude during the self-commissioning cannot be the same and constant as in the case where the same amount of current exists in 3-phase excitation. Therefore, during the drive self-commissioning, the instantaneous IM current is always kept below the rated value, making the saturation effect negligible. Finally, during the initial experiments, a wide range of test signal frequencies was used. However, as the most accurate, results with test frequencies of 30 rad/s and 60 rad/s were singled out and presented in this chapter.
In Figure 6, the operating principle of voltage measurement and estimation system implemented in the used low voltage IM drive is presented. Direct measurement is always a more advisable way to measure IM phase voltages in a drive application, though it is not always an option in a low-cost drive solution having DC bus voltage measurement only. Since the experimental setup is designed for high-performance drive, both possibilities, direct measurement and estimation, are implemented for the determination of voltage in the drive.
Voltage estimator determinates IM phase voltages based on the measured DC bus voltage and current duty cycles of inverter branches signal, using voltage drops of inverter components and inserted dead time as parameters. On the other hand, direct phase voltage measurement is performed using the RC circuit depicted in Figure 6, placed on all three branches of the inverter.
The precision of the estimated voltage depends on a huge number of parameters, as demonstrated in Equations (19) and (20), where subscript x denotes one inverter phase branch.
f o r   i x k T < 0 , V x N k T = T o n x k T + t d T P W M V D C k T V I G B T + V D + V I G B T
f o r   i x k T > 0 , V x N k T = T o n x k T t d T P W M V D C k T V I G B T + V D V D
Some parameters are defined during the programming procedure of the drive as T P W M and t d . Inserted dead time t d has the influence in the estimation of voltage, especially where it is comparable to the switching time of components. The main reason for that is the assumption in which the voltage estimation process considers the edges of voltage infinitely sharp as shown in Figure 7.
Duty cycles of inverter legs are calculated and set by the space vector pulse width modulator (SV PWM) and therefore ready to be used in voltage estimator. The quality of the measured DC bus voltage also has an influence on voltage estimation precision. Voltage drops of inverter components V I G B T and V D have a great influence on the parametric sensitivity of voltage estimator. Voltage drops of components in the inverter are usually determined in data sheets of components’ producer, and they are given in a range depending on components’ working conditions or in the form of components’ characteristics. It is known that operating conditions in traction drive applications vary quickly during work, and in that situation the influence of voltage drops on components is difficult to predict and utilize in a voltage estimator. In the case where the estimation of voltage is an only possible solution, it is advisable to use some self-commissioning procedure for the inverter [27,28,29].
Considering that low voltage IM is used in this paper, it is clear that even a small drift of parameters in voltage estimation procedure will cause an error in estimated voltage and therefore in the estimated parameters as well. Comparison between measured and estimated voltages, when parameters of voltage estimator are detuned, presented in Figure 8.
When the parameters of the voltage estimator are tuned on values that come from a self-commissioning procedure of inverter, the measured and estimated voltages almost match (Figure 9).
The results of the experimental verification of the technique with a sinusoidal voltage test signal implemented with estimated voltage signals are shown in Table 3.
As expected, the results of the experiment with the estimated voltage are quite inaccurate. In conclusion, the self-commissioning technique using estimated IM voltage is not applicable in the case of a specific low voltage IM traction drive used in the experiment.
Due to the fact that the possibility of direct measurement is more accurate than estimation, a series of experiments with a sinusoidal voltage test signal and direct measurement of the voltage signal is implemented. The waveform of voltage and current in the dq reference frame during the test with sinusoidal voltage test signals is depicted in Figure 10.
The amplitude of the voltage test signal during the test is determined in a way to obtain current in windings in a range of rated currents. In the paper [30], it is stated that the choice of voltage amplitude to be applied is critical, and that a possible overvoltage conditions of the machine during the self-commissioning process may easily trigger the overcurrent protection. The easiest way to determine the proper voltage to be applied is to consider the short circuit voltage of the IM. That references of voltage test signals are brought directly to the space vector modulator, avoiding current regulators and creating simple open-loop voltage application as demonstrated in Figure 5.
After realizing Equations (16) and (17), the real and the imaginary waveforms of impedance during the test with sinusoidal voltage test signals are shown in Figure 11. Due to the filtration of voltage and current with DSC filter, as well as calculations between their signals, new noise is created. The simplest solution for that problem is heavy filter implementation. On the lower subplot of Figure 11, the real and imaginary part of impedance after using the heavy filter is presented.
From waveforms shown in Figure 11, it is obvious that the real parts of impedance at different frequencies of test signal have approximately the same value. It implicates that Equation (11) for the calculation of parameter M will be sensitive to the real parts of the total impedance at different test frequencies. In the situation where the real parts of impedance are the same, parameter M will have a value of zero, which further implies that there is no effect of magnetizing inductance on total impedance during the test. The reason for that is the fact that the current through the magnetizing inductance M on different test frequencies does not make a great difference in the real part of the impedance. That is a consequence of the specific construction of the low voltage IM and insufficiently spaced values of test signal frequencies. The technique prohibits the use of very high frequencies, while very low frequency is not suitable for the DSC filtration process due to low memory capacity and high computation burden. This is the problem that will be more distinct in the implementation of the technique with sinusoidal current test signals. The results of the experimental verification of the technique with a sinusoidal voltage test signal are shown in Table 4.

5.3. Experimental Results with Two Current Sinusoidal Test Signals

A common practice that is suggested by authors in literature is the implementation of closed-loop current control during the parameter identification procedures. It is a considered opinion that machine and drive are protected when the current reference is limited to the rated current, which is known from the initialization routine of the drive. Yet, on the other hand, the implementation of the technique with current test signals has some disadvantages, especially where low voltage IM is considered. Due to verification and comparison with the technique with voltage test signals, the experiments with the implementation of technique with sinusoidal current test signal are realized. The experimental system configuration for the implementation of the technique with two sinusoidal current test signals is depicted in Figure 12.
On comparing the experimental system configurations for both techniques, it is obvious that the technique with voltage test signals is less demanding in terms of computation and memory capacity of the microcontroller than the implementation of the technique with current test signals. The waveform of filtered voltage and current in the dq reference frame during the test with sinusoidal current test signals are presented in Figure 13.
From Figure 13, it is obvious that voltage signal has significant distortion even after the DSC filtration process, which is the consequence of the current regulator and their large bandwidth. In that case, the estimation of voltage is useless for the implementation of the technique, and the evaluation experiments with voltage estimation are not performed. Not even measured voltage signal in the dq reference frame after the filtration process is suitable for the calculation of parameters, as is demonstrated in Figure 13. This distortion of the voltage signal is also transmitted to the waveforms of the real and imaginary parts of impedance during the test with sinusoidal current test signals, as is depicted in Figure 14.
In the case of using sinusoidal current test signals, the real and imaginary parts of impedance at different test frequency are inappropriate for further signal processing, and that is the main reason for results presented in Table 5.

6. Discussion

The proposed IM self-commissioning technique based on two sinusoidal voltage test signals represents a unique and direct approach for the calculation of all equivalent circuit parameters improved and adapted to the low voltage IM. This technique is very robust and efficient in the estimation of parameters of a series branch, though it is less precise in the estimation of magnetization inductance, especially for low voltage IM. The simulation results substantiated the proposed self-commissioning technique using sinusoidal voltage test signals with different frequencies. From experimental results it is verified that the cascade DSC filter configuration in combination with a simple heavy filter is a suitable tool for signal processing during this type of self-commissioning technique. Implementation of technique with sinusoidal voltage test signals instead of current test signals is recommended for the self-commissioning process of low voltage traction IM drive. Due to low voltage excitation during the test, the direct measurement of phase voltages is recommended for the implementation of the technique.
Although only low 48 V voltage IM is considered in this paper, the proposed method is also applicable to the industrial IM drives of a conventional voltage level (400 V, 660 V, 6.6 kV…). For comparison purposes, the conventional IM drive with the parameters presented in [8] is considered. Numerical identifiers used within the comparative analysis are R / M and R σ / L x , with the physical interpretation of characteristic angular frequencies. The first one represents the frequency which, applied on IM, provides the impedance balance of magnetizing and rotor branches, while the second one implies the adjustment of optimal power factor in short circuit test [1]. For both, low voltage IM with parameters from Table 3 and standard IM presented in [8], numerical identifiers are of the same order of magnitude, implicating the robustness and universality of calculation procedure (Equations (10)–(12)). However, if this technique is applied on conventional IM, it would not suffer from the influences of inverter nonlinearities and voltage drops on switching components, which were disregarded within the previous analysis. This is contrary to the case study presented in this paper, which requires more careful signal processing. This includes compensation of voltage drops through the utilization of measured terminal variables (phase voltages and currents), non-linearity suppression by imposing DC offset signals and DSC filtering mechanism for the precise harmonic attenuation, all implemented to deal with the method implementation on particular low voltage IM.

7. Conclusions

The main principle of the proposed IM self-commissioning technique based on two sinusoidal test signals is discussed in the paper. Special attention is given to the implementation issues on the low voltage traction IM drive application. Finally, specific technique proposals, which comprise a solution for encountered implementation issues, were obtained and validated through the variety of computer simulations and experimental tests on the low voltage IM traction drive. The advantages and the limitations of the proposed technique were discussed. The usage of measured phase voltages is found to be mandatory in the case of low voltage IM. Likewise, the recommendation is that both test signal frequencies have to be apart, but still within the narrow range determined by the motor rated slip frequency. Nevertheless, the results prove that the improved IM self-commissioning technique can be successfully applied on the low voltage IM traction drive, whose market is constantly expanding in the era of electrical vehicle applications. However, it was shown within the discussion chapter that all the proposed method upgrades, required for low voltage traction IM drive application, are also applicable for medium and high voltage IM drives, improving the method reliability for those drives also.

Author Contributions

Conceptualization, M.V., V.P., and D.O.; methodology M.V. and D.M.; software V.P., validation M.V., V.P., and D.M.; formal analysis M.V. and V.V.; investigation M.V. and V.P.; resources, V.V. and D.M.; writing—original draft preparation, M.V.; writing—review and editing, V.P., D.O., and D.M.; visualization, M.V.; supervision, D.O. and V.V. All authors have read and agreed to the published version of the manuscript.

Funding

This research has been supported by the Ministry of Education, Science and Technological Development through the project no. 451-03-68/2020-14/200156: “Innovative scientific and artistic research from the FTS domain”.

Institutional Review Board Statement

Not applicable.

Informed Consent Statement

Not applicable.

Data Availability Statement

Not applicable.

Conflicts of Interest

The authors declare no conflict of interest.

Nomenclature

V s d ,   V s q Stator voltage components in the d q reference frame;
I s d ,   I s q Stator current components in the d q reference frame;
R s Stator resistance;
R r Rotor resistance;
R σ Equivalent machine resistance ( R s + R );
L m Mutual (magnetizing) inductance;
L r Rotor inductance;
L s Stator inductance;
σ Induction machine total leakage factor;
T o n Duty cycle of one inverter branch;
T P W M Period of PWM carrier signal;
t d Inserted dead time;
V D C Voltage of inverter DC bus;
V I G B T Voltage drop of invertor IGBT component;
V D Voltage drop of inverter flywheel diode.

References

  1. Vas, P. Parameter Estimation, Condition Monitoring and Diagnosis of Electrical Machines, 1st ed.; Oxford University Press: London, UK, 1993. [Google Scholar]
  2. Kumar, R.; Das, S.; Syam, P.; Chattopadhyay, A.K. Review on model reference adaptive system for sensorless vector control of induction motor drives. IET Electr. Power Appl. 2015, 9, 496–511. [Google Scholar] [CrossRef]
  3. Krishnan, R.; Bharadwaj, A.S. A review of parameter sensitivity and adaptation in indirect vector controlled induction motor drive systems. IEEE Trans. Power Electron. 1991, 6, 695–703. [Google Scholar] [CrossRef]
  4. Nordin, K.B.; Novotny, D.W.; Zinger, D.S. The influence of motor parameter deviations in feedforward field orientation drive systems. IEEE Trans. Ind. Appl. 1985, 21, 1009–1015. [Google Scholar] [CrossRef]
  5. Toliyat, H.; Levi, E.; Raina, M. A review of RFO induction motor parameter estimation techniques. IEEE Trans. Energy Convers. 2003, 18, 271–283. [Google Scholar] [CrossRef]
  6. Tang, J.; Yang, Y.; Blaabjerg, F.; Chen, J.; Diao, L.; Liu, Z. Parameter Identification of Inverter-Fed Induction Motors: A Review. Energies 2018, 11, 2194. [Google Scholar] [CrossRef] [Green Version]
  7. Odhano, S.A.; Pescetto, P.; Awan, H.A.A.; Hinkkanen, M.; Pellegrino, G.; Bojoi, R. Parameter Identification and Self-Commissioning in AC Motor Drives: A Technology Status Review. IEEE Trans. Power Electron. 2019, 34, 3603–3614. [Google Scholar] [CrossRef] [Green Version]
  8. Gastli, A. Identification of induction motor equivalent circuit Parameters using the single-phase test. IEEE Trans. Energy Convers. 1999, 14, 51–56. [Google Scholar] [CrossRef]
  9. Kania, J.; Panchal, T.H.; Patel, V.; Patel, K. Self Commissioning: A Unique Feature of Inverter-Fed Induction Motor Drives. In Proceedings of the Nirma University International Conference on Engineering, Gujarat, India, 8–10 December 2011; pp. 1–6. [Google Scholar]
  10. Odhano, S.A. Self-Commissioning of AC Motor Drives. Ph.D. Thesis, Politecnico di Torino, Torino, Italy, 2014. [Google Scholar]
  11. Rajinder, M.S.; Madhusudan, S. Sensitivity Analysis of Induction Motor Performance Variables. In Proceedings of the 1st IEEE International Power Electronics, Intelligent Control and Energy Systems Conference, Delhi, India, 4–6 July 2016; pp. 2931–2936. [Google Scholar]
  12. Kwon, Y.; Lee, J.; Moon, S.; Kwon, B.; Choi, C.; Seok, J. Standstill Parameter Identification of Vector-Controlled Induction Motors Using the Frequency Characteristics of Rotor Bars. IEEE Trans. Ind. Appl. 2009, 45, 1610–1618. [Google Scholar] [CrossRef]
  13. Erturk, F.; Akin, B. A Robust Method for Induction Motor Magnetizing Curve Identification at Standstill. IEEE Access. 2019, 7, 55422–55431. [Google Scholar] [CrossRef]
  14. He, Y.; Wang, Y.; Feng, Y.; Wang, Z. Parameter Identification of an Induction Machine at Standstill Using the Vector Constructing Method. IEEE Trans. Ind. Electron. 2015, 62, 2144–2155. [Google Scholar] [CrossRef]
  15. Lee, S.; Yoo, A.; Lee, H.; Yoon, Y.; Han, B. Identification of Induction Motor Parameters at Standstill Based on Integral Calculation. IEEE Trans. Ind. Appl. 2017, 53, 2130–2139. [Google Scholar] [CrossRef]
  16. Zhang, J.; Kang, L.; Chen, L.; Xu, Z. Parameter Estimation of Induction Machine at Standstill Using Two-Stage Recursive Least Squares Method. Math. Probl. Eng. 2015, 567492, 1–13. [Google Scholar] [CrossRef]
  17. Peretti, L.; Zigliotto, M. Automatic procedure for induction motor parameter estimation at standstill. IET Electr. Power Appl. 2012, 6, 214–224. [Google Scholar] [CrossRef]
  18. Bechouche, A.; Sediki, H.; Abdeslam, O.; Haddad, S. A Novel Method for Identifying Parameters of Induction Motors at Standstill Using ADALINE. IEEE Trans. Energy Conv. 2012, 27, 105–116. [Google Scholar] [CrossRef]
  19. Carraro, M.; Zigliotto, M. Automatic Parameter Identifiction of Inverter-Fed Induction Motors at Standstill. IEEE Trans. Ind. Electron. 2014, 61, 4605–4613. [Google Scholar] [CrossRef]
  20. Wang, K.; Yao, W.; Chen, B.; Shen, G.; Lee, K.; Lu, Z. Magnetizing Curve Identification for Induction Motors at Standstill without Assumption of Analytical Curve Functions. IEEE Trans. Ind. Electron. 2015, 62, 2144–2155. [Google Scholar] [CrossRef]
  21. Holtz, J.; Quan, J. Sensorless vector control of induction motors at very low speed using a nonlinear inverter model and parameter identification. IEEE Trans. Ind. Appl. 2002, 38, 1087–1095. [Google Scholar] [CrossRef]
  22. Hoang, K.D.; Aortih, H.K.A. Online Control of IPMSM Drives for Traction Applications Considering Machine Parameter and Inverter Nonlinearities. IEEE Trans. Transport. Electrific. 2015, 1, 312–325. [Google Scholar] [CrossRef] [Green Version]
  23. Svensson, J.; Bongiorno, M.; Sannino, A. Practical implementation of delayed signal cancellation method for phase-sequence separation. IEEE Trans. Power Del. 2007, 22, 18–26. [Google Scholar] [CrossRef]
  24. Marcetic, D.P.; Tomic, J.J.; Kusljevic, M.D. Unbalanced three-phase distribution system frequency estimation using least mean squares method and positive voltage sequence. IET Sci. Meas. Technol. 2014, 8, 30–38. [Google Scholar] [CrossRef]
  25. Golestan, S.; Guerrero, J.M.; Vasquez, J.C.; Abusorrah, A.M.; Al-Turki, Y. Advanced Single-Phase DSC-Based PLLs. IEEE Trans. Power Electron. 2019, 34, 3226–3238. [Google Scholar] [CrossRef]
  26. Neves, F.; Souza, H.; Cavalcanti, M.; Bradaschia, F.; Bueno, E.J. Digital Filters for Fast Harmonic Sequence Component Separation of Unbalanced and Distorted Three-Phase Signals. IEEE Trans. Ind. Electron. 2012, 59, 3847–3859. [Google Scholar] [CrossRef]
  27. Bolognani, S.; Peretti, L.; Zigliotto, M. Repetitive-Control-Based Self-Commissioning Procedure for Inverter Nonidealities Compensation. IEEE Trans. Ind. Appl. 2008, 44, 1587–1596. [Google Scholar] [CrossRef]
  28. Bojoi, I.R.; Armando, E.; Pellegrino, G.; Rosu, S.G. Self-commissioning of inverter nonlinear effects in AC drives. In Proceedings of the IEEE International Energy Conf. and Exhibition, Florence, Italy, 9–12 September 2012; pp. 213–218. [Google Scholar]
  29. Bedetti, N.; Calligaro, S.; Petrella, R. Self-Commissioning of Inverter Dead-Time Compensation by Multiple Linear Regression Based on a Physical Model. IEEE Trans. Ind. Appl. 2015, 51, 3954–3964. [Google Scholar] [CrossRef]
  30. Odhano, S.A.; Cavagnino, A.; Bojoi, I.R.; Tenconi, A. Induction motor magnetizing characteristic identification at standstill with single-phase tests conducted through the inverter. In Proceedings of the IEEE International Electric Machines & Drives Conference, Coeur d’Alene, ID, USA, 10–13 May 2015; pp. 960–966. [Google Scholar]
Figure 1. The inverse “Γ” equivalent circuit with the sinusoidal voltage test signals of different frequencies.
Energies 14 01700 g001
Figure 2. Results of the computer simulation-dq voltage and currents before and after cascade DSC filter.
Energies 14 01700 g002
Figure 3. Results of the computer simulation for real and imaginary parts of motor impedance.
Energies 14 01700 g003
Figure 4. Coupling of the motor-generator group with 48 V DC power supply (4 series connected 12 V batteries).
Energies 14 01700 g004
Figure 5. Experimental configuration for the implementation of the technique with two sinusoidal voltage test signals.
Energies 14 01700 g005
Figure 6. Principle for the measurement and estimation of voltage in the used low voltage IM drive.
Energies 14 01700 g006
Figure 7. Estimation of one inverter phase branch voltage.
Energies 14 01700 g007
Figure 8. Experimental results for measured and estimated voltage (parameters of voltage estimator detuned).
Energies 14 01700 g008
Figure 9. Experimental results for measured and estimated voltage (parameters of voltage estimator tuned correctly).
Energies 14 01700 g009
Figure 10. Experimental results for voltage and current in the dq reference frame during voltage test signals.
Energies 14 01700 g010
Figure 11. Experimental results for the real and imaginary part of the total impedance during voltage test signals.
Energies 14 01700 g011
Figure 12. Experimental configuration for the implementation of the technique with two sinusoidal current test signals.
Energies 14 01700 g012
Figure 13. Experimental results for filtered voltage and current in the dq reference frame during current test signals.
Energies 14 01700 g013
Figure 14. Experimental results for the real and imaginary part of the total impedance during current test signals.
Energies 14 01700 g014
Table 1. Parameters for delay signal cancellation (DSC) implementation.
Harmonic
Order
k d θ r
1N/2 180 °
2N/4 90 °
3N/8 45 °
4N/16 22.5 °
Table 2. Results of simulations with two sinusoidal voltage test signals.
ω 1 r a d / s ω 2 r a d / s R m Ω M m H L x µ H E R % E M % E L x %
10155.1940.91554.76−2.920.20−0.77
10205.1840.91755.32−3.110.410.24
20305.1840.91955.41−3.110.630.40
20505.1850.91855.14−3.080.510.10
10505.1850.91655.12−3.070.42−0.12
30605.1900.91355.14−3.000.07−0.10
Table 3. The experimental results with two sinusoidal voltage test signals and estimated voltage.
ParameterUnitCalculated Value (CV)Real Value (RV)Error
C V R V 1 · 100
R m Ω 6.18105.195818.96%
M mH 1.12580.912823.33%
L x μ H 50.148355.1760−9.11%
Table 4. The experimental results with two sinusoidal voltage test signals and measured voltage.
ParameterUnitCalculated Value (CV)Real Value (RV) Error
C V R V 1 · 100
R m Ω 5.45835.19585.05%
M mH 0.98960.91288.41%
L x μ H 54.151355.1760−1.86%
Table 5. The experimental results with two sinusoidal current test signals and measured voltage.
ParameterUnitCalculated Value (CV)Real Value (RV) Error
C V R V 1 · 100
R m Ω 6.00135.195815.50%
M mH 1.09670.912820.15%
L x μ H 40.852655.1760−25.96%
Publisher’s Note: MDPI stays neutral with regard to jurisdictional claims in published maps and institutional affiliations.

