Abstract
Increasing traffic volumes in cities leads to common traffic congestions building up, especially during peak hours. To protect city dwellers from excessive fuel exhaust and traffic noise and to prevent drivers from time loss due to overloaded routes, it is important to inform them about real-time traffic conditions and possible delays in advance. Effectively influencing drivers’ decisions to divert from an original route choice in case of traffic hinderance is essential, and application of dynamic travel information in the form of variable message signs (VMSs) is believed to be effective in these terms. The paper examines drivers’ willingness to divert from an initial route choice due to the information provided on VMS boards. Their behavior was analyzed in terms of their response to everyday and artificially elongated travel times displayed on the VMSs. Maximum simulated elongation reached 200% and 300% of the initial state, depending on the characteristics of the pre-peak conditions. To assess the effectiveness of VMSs, the changes in traffic intensities were statistically analyzed. In general, apart from few significant differences, the results revealed drivers’ ignorance of the travel time information provided on the VMS, regardless of the extension of the original times.
1. Introduction
The main concepts of a smart city assume the broadly understood care for the residents’ quality of life in various areas of life. One of the basic ones is the improvement of living surroundings and reliability of travelling. Actions taken in the field of road users’ safety are mostly related to the implementation of effective speed management solutions from a group of traffic-calming measures [1,2]. Improving the comfort and reliability of travel is associated with the implementation of modern intelligent transportation systems (ITS) technologies supporting the management of traffic flows. That is particularly important due to the continuous dynamic development of motorization that contributes to the growing communication problems in cities. To overcome increasing delays and total travel times that drivers spend in a road network, city authorities invest lots of funds in advanced traffic management systems. Modern systems are extensive and consist of several subsystems. One of them is the dynamic travel information subsystem with the provision of actual travel time information for drivers. Two types of dynamic systems are currently widely used: variable message signs (VMSs) and graphical route information panel (GRIP), and the main concern of this article is given to VMS signs.
Variable message signs are part of intelligent transportation systems. The directive of the European Union 2010/40/EU defined ITS as systems in which information and communication technologies are applied in the field of road transport, including infrastructure, vehicles and users, and in traffic management and mobility management, as well as for interfaces with other modes of transport [3]. ITS contributes to the improvement of transport efficiency in a number of situations, i.e., road transport, traffic management, mobility, etc. [4,5]. The goal of the development and application of ITS solutions is to support, control, and manage transport processes.
To date, the effectiveness of ITS has been investigated and confirmed in many respects. The studies of safety considerations [6,7] have shown high potential in accidents and injuries reduction. Improvement of transportation systems performance has been examined [8,9,10], and essential improvements in average operating speed have been proved. Several researchers investigated possible applications of ITS solutions in vehicles to improve traffic conditions and traffic safety and to reduce transport impact on the environment through better vehicle-to-vehicle communication and interaction [11,12,13,14] or by incorporation of speed cameras and section speed systems [15,16,17].
Weather condition information provided on VMS systems was found to be effective in speed reduction in Sweden [18,19], but research results in terms of accidents reduction were disputable [20,21], and it was argued that the net safety effects of such message systems were not conclusive. They concluded that while messages for adverse weather conditions significantly influenced speed reduction, drivers tended to compensate for the speed reduction by increasing their speeds downstream where such adverse conditions did not exist. Research conducted in Leeds, UK [7,22], employed vehicle simulators, but the results were also inconclusive even though they showed the improvement of drivers alertness to the context of the VMS, and consequently their response to a displayed message became more timely under specific conditions.
Variable message signs, being an integral component of ITS, have an important impact on a motorist’s travel behavior, and thus they are a key component in a comprehensive traffic management system. Mostly they are placed at roadside or overhead on roadways and are designed to deliver traffic information covering congestion and accident reports, weather information, lane control, limit speed, etc. They have been widely used to provide information and advice to drivers to increase traffic fluency and reduce time losses. Traffic congestion level and fluency of driving highly influence drivers’ behavior, which in turn might affect their route-choice decisions. Typically, as traffic builds, average speed decreases, and travel time and queue length increase, which in turn causes deterioration of driving. To avoid such conditions, VMS are implemented to redirect traffic flows toward less crowded routes. In these terms, scare literature can be found. Considering travel time information Wang et al. [10] analyzed traffic flow on a given link in an urban road network at a signalized intersection based on traffic stream directions. They showed that inclusion of traffic streams, depending on their directional distribution into analyses, can produce more accurate models of dynamic traffic assignment. Other works devoted to travel time estimation models and techniques evaluated their usage in relation to characteristics such as traffic lights parameters, queue length forming, types of vehicle detectors, or type of measurement data [23,24,25]. Application of numerical simulations have been used to analyze the impact of VMS on the changes of route flow and travel time under recurrent and non-recurrent traffic conditions [26]. It was found that for recurrent congestion VMS can positively influence travelers’ decisions, depending on the route length. In the case of non-recurrent congestion, the influence is additionally related to increased traffic demand. Chatterjee et al. [27] developed logistic regression models relating the probability of route diversion to driver, journey, and message characteristics based on questionnaire data. They found that the incident and the message content are important factors influencing the probability of diversion. However, a survey of drivers’ actual responses to a message activation showed that only one-third of drivers saw the information presented to them, and few of these drivers diverted. They also noticed that the opposite results of the survey data were obtained for another UK city with a newly installed VMS system which showed that the number of drivers diverting due to VMS information was very similar to that expected from the results of the stated intention questionnaire. Quite similar results were obtained by Erke et al. [26]. During their investigations at two sites on motorways, they found that every fifth driver responded to the VMS information and changed their route choice. Even though they noticed a higher number of drivers reducing their speed, they explained that as a chain reaction where one vehicle braked and forced the following vehicles to brake or change lanes in order to avoid collisions. More recent articles investigate the exploitation of vehicular ad-hoc network (VANET) architecture to overcome the problem of congested metropolitan areas [28,29,30]. Conducted studies showed that such systems can effectively reduce traffic level inside cities, exploiting inter-communication among vehicles and supporting infrastructures. Based on vehicle position and speed, drivers using dedicated smartphone applications achieve information on crowded lanes in a short time in order to redirect traffic adequately to avoid overloaded routes.
Previous studies, mostly carried out in developed countries where modern technologies had been developed for many years, have focused on a wide range of ITS solutions, proving their usefulness. In this scope, computer simulations are being increasingly used in research nowadays, and together with questionnaire studies they bring significant contribution to explaining transport problems. However, they cannot replace field research, and there is a lack of investigations conducted in developing countries where ITS solutions have been introduced on a smaller scale.
In this context, keeping in mind that several previous investigations have been conducted into drivers attitudes toward and responses to expressway-based VMSs, we examined the potential and influence of VMSs at inducing motorists to divert during congestion in urban area. For this purpose, research was conducted in Bialystok, a medium-size city in Poland where traffic is managed by a traffic management system. VMSs displaying travel time information are one of the base subsystems designed to divert traffic flows heading for the city center in case of deteriorated traffic conditions. To evaluate effectiveness of this system, we designed investigations in real and simulated on-road conditions.
2. Research Area and Data Acquisition
The tested area included intersections of city arterial streets being managed by the traffic management system (TMS) and consisted of 5 intersections equipped with VMSs. All intersections were located in a crucial part of the city of Bialystok, Poland. Currently, Bialystok is the only city in Poland where operating TMS covers all intersections with traffic lights, providing good driving conditions along alternative routes. VMSs are part of a traffic management system that controls all signalized intersections in the city [31]. On-trip information for travelers is displayed in the form of on-board announcements (Figure 1) and provides travel time information (TTI) to the center area depending on the chosen direction.
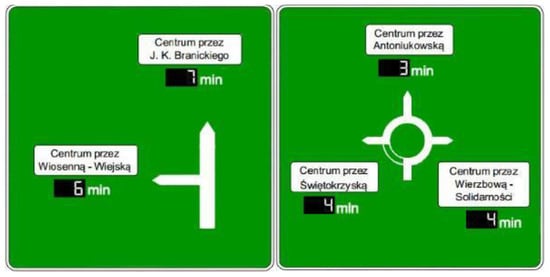
Figure 1.
Structure and travel time information (TTI) displayed on the investigated variable message signs (VMS).
The location of all operating VMSs in the city with the ones chosen to detail analyses, marked in circles, is given in Figure 2.
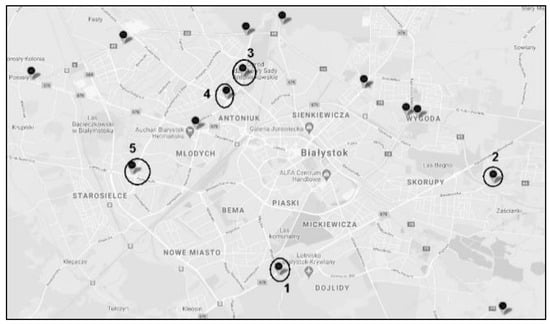
Figure 2.
Location of VMSs in Bialystok.
Each of the signs was located at the inlet of an intersection diverting main traffic flows heading to the city center from highly populated residential districts and outskirts regions. The choice of the specific VMSs was discussed with city traffic engineers. Provided travel time information was actuated on the basis of real travel time measured between the beginning and end point of the specific route with the use of ANPR (automatic number plate recognition) cameras. Any disturbances on a primary route caused by excessive traffic or an accident resulted in an extension of travel time displayed on the VMS. Information on traffic volumes was collected during morning peak hours and further analyzed in relation to the traffic directional distribution. The detailed rush hours range selected for analysis was based on information obtained from the city traffic engineers. This allowed specification of an hour range of two hours between 7:00 a.m. and 9:00 a.m. In general, the posted speed limit within the city borders was 50 km/h, but some segments of main dual carriageway arterials had an elevated speed limit of 70 km/h. The analyzed routes are reflected in Table 1. The length of segments with elevated speed limits constituted around 25–30% of their total lengths, and specific segments with elevated speed limits stretched between two consecutive signalized intersections.

Table 1.
Description of investigated routes managed by VMSs.
3. Methodology
The impact of VMSs on drivers’ behavior change was analyzed on the basis of changes in traffic flow intensity caused by travel time information displayed on the VMS. Assuming effective impact of the information displayed on the VMS and a positive reaction of drivers as a result, a significant part of them should divert the original direction (marked as a main route) into an alternative one, less crowded with shorter travel time (marked as an alternative route). The logical consequence of that would be differences in traffic intensities. Current TTI values during daily work change automatically upon the real travel time measured between beginning–end points. Minimum and maximum displayed TTI values recorded for everyday conditions are presented in Table 1, and they were gathered with the use of existing ANPR cameras. Maximum elongations recorded during peak hours on three consecutive days (Mon–Tue–Wed) varied distinctly depending on the localization, but in each case noted values were very temporary and were not displayed longer than for 10 min (8% of studied period). For the purpose of the research, TTI values were artificially imposed by the traffic operator at 7:00 a.m. and remained unchanged for the next 2 h. Traffic intensity was measured in 15 min intervals. The evaluation procedure was carried out in three steps:
- –
- Everyday conditions. Getting information about traffic flow in three working days (Mon–Tue–Wed) and analyses of the traffic characteristics (hourly volume traffic intensity, quarterly volume traffic, and peak hour factor (PHF)). Verification of significant differences in traffic volumes between those days in the period 7:00–8:00 (Mon–Tue–Wed) and the period 8:00–9:00 (Mon–Tue–Wed).
- –
- Everyday conditions. Evaluation of hourly traffic volume fluctuations within a day and determining the significance of differences between hourly volumes in two consecutive peak hours (between 7:00–8:00 and 8:00–9:00) to establish the nature and magnitude of traffic fluctuations.
- –
- Artificial conditions of TTI. Determining the significance of changes in traffic volumes after the implementation of elongated travel times to investigate the effect of the VMS operation. Setting the length of travel time information displayed on the VMS board at 7:00 was based on reviewed everyday conditions and was further assumed as a phase “0”. Artificially elongated times were assumed to be distinctly longer from the initial times but still should present reliable and reasonable values. In case of too extended values, drivers could treat the information as a hardware/software error instead of accepting the information on actual conditions. The maximum elongation reached 200% (intersections 3 and 4) and 300% (intersections 1, 2, 5) and depended on the initial time in phase “0”. The planned TTI values are presented in Figure 3. Traffic volumes were measured in all set conditions accordingly. Traffic measures were conducted between March and June during the same weather conditions. Weeks with public holidays were excluded from the research to keep similar traffic conditions as much as possible.
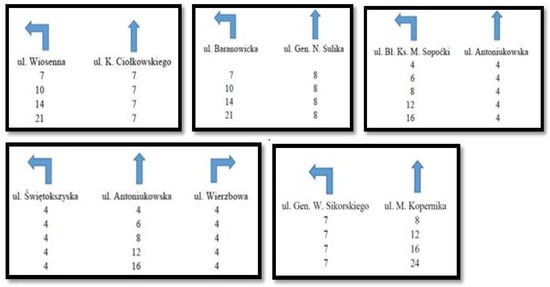 Figure 3. Simulated travel times displayed on the VMSs.
The research question on the basis of the null hypothesis claimed that the mean traffic flow volumes were the same. The alternative hypothesis stated that the mean traffic flow volumes were different, which entails that the changed conditions (TTI) have an impact on the traffic intensity in a specific direction. To determine the statistical significance of differences between means at each stage, analysis of variance was utilized and a 5% significance level was applied. The significance was verified by Fischer–Snedecor test, and Levene’s test was used to verify that assumption of the homogeneity of variances.
4. Research Results and Discussion
4.1. Characteristic of Traffic Flow Volumes Measured in Weekdays in Everyday Conditions
For the purpose of the research, 2 h traffic volume measurements were conducted during working days peak hours (Mon–Tue–Wed). The values reflecting one hour traffic intensity in consecutive rush hours are presented in Figure 4. As can be seen traffic volumes differ distinctly depending on the localization of the VMS, but do not show distinct differences between consecutive days. The highest difference recorded in Kopernika and Sopoćki streets at 8:00–9:00 reached 12%, but as the statistical analyses show (Table 2), the differences were not statistically significant. In other cases the difference did not exceed 6% and were also insignificant.
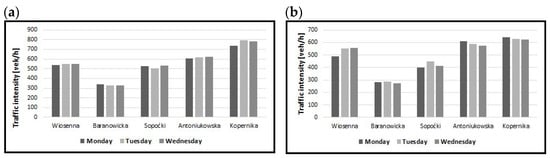
Figure 4.
Hourly traffic intensity on main routes (a) 7:00–8:00 (b) 8:00–9:00.
Table 2.
ANOVA results of daily traffic intensities changes.
The lack of significant differences shows that traffic intensity stabilized on a similar and stable level regardless the day of a week. The explanation for a lack of distinct differences even when they reached 12% may be high fluctuations in traffic flow that can be observed in shorter time intervals. This also indicates that in further analyses measurements could be carried out on any of those days.
4.2. Hourly Traffic Volume Fluctuations Within Peak Hours in Everyday Conditions
It is believed that effective VMSs should redirect traffic flows from crowded directions to less crowded alternatives. Before the artificial values of TTI were set one-hour traffic flow variations in the period between 7:00–8:00 and 8:00–9:00 were checked to avoid biased conclusions arising from natural traffic fluctuations. For this purpose, traffic flow was analyzed in 15-min intervals (Figure 5) on the basis of peak hour factors (PHF) k15 (Figure 6) and average traffic volumes (Qavg). The peak hour factor compares the traffic volume during the busiest 15 min of the peak hour with the total volume during the peak hour. It indicates how consistent traffic volume is during the peak hour.
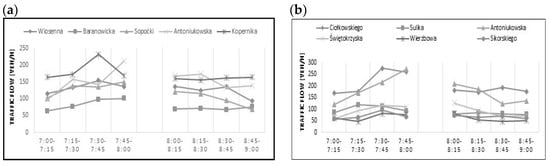
Figure 5.
15-min traffic intensity variations (a) main routes (b) alternative routes.
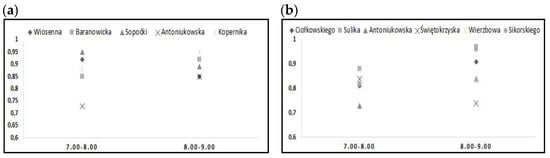
Figure 6.
Peak hour factor (a) main routes (b) alternative routes.
Visible irregularity in main (Kopernika and Antoniukowska streets) and alternative routes (Ciołkowskiego and Antoniukowska streets) correlated with higher upstream traffic and is validated by k15 values. A large discrepancy of PHF values (Figure 6) along with increasing and decreasing trend in traffic volumes in peak hours indicate the randomness of the irregularity phenomena rather than its regularity caused by TTI information displayed on the VMS. This also confirms that everyday traffic volumes are subjected to some natural fluctuations which in most cases are statistically insignificant though (Table 3).
Table 3.
ANOVA results for main and alternative routes.
4.3. Determining the Significance of Traffic Intensities Changes Caused by Variations of TTI Displayed on the VMS
Information on traffic flow intensity variations caused by artificially elongated travel time displayed on the VMS boards present similar trends to those found during everyday operation of the VMSs. In the case of main routes (Figure 7), in the first hour traffic intensity volumes show smooth upward trends which in the second hour change into downward ones. In the case of alternative routes (Figure 8), the pattern of traffic flow variations are in line with those achieved in everyday operations.
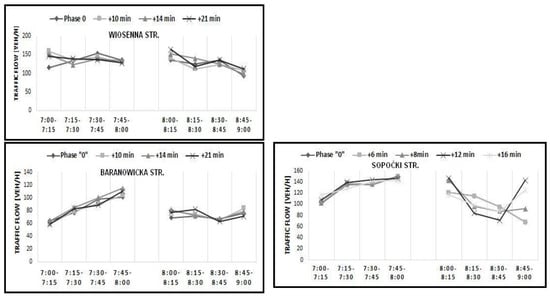
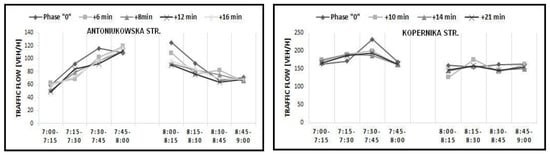
Figure 7.
Traffic flow changes in 15-min intervals on main directions.
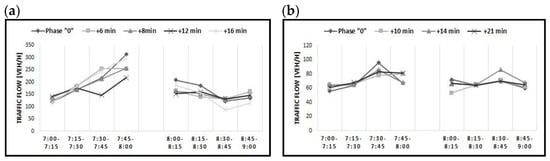
Figure 8.
Samples of traffic flow changes in 15 min intervals on alternative directions (a) Antoniukowska Str. (b) Sikorskiego Str.
To determine the significance of changes of traffic volumes as a result of artificial time extension, the ANOVA analyses was applied. The first step of the analysis contained a comparison of traffic intensities in the first hour of morning rush with different TTI displayed. Then the same procedure was applied for the second hour of morning rush with adequate travel times. Finally, the comparison included traffic flow differences recorded in two consecutive rush hours. The results (Appendix A) show no significant differences between traffic flows either in the first or the second rush hour, regardless of the TTI value. In the group of main routes, the only significant difference was gained in Kopernika route—TTI extended up to 200% and 300% of the initial state brought significant difference between traffic flow intensity in the first and second hour. Box plots represent those changes graphically (Figure 9). Even though the traffic intensities decreased, the reason for that was not diversion of traffic flow into the alternative Sikorskiego route—in that case the changes remain insignificant. It results from Figure 7 and Figure 8 that along with the increase in the traffic intensity in the first hour on Kopernika str, the intensity increases similarly on Sikorskiego str. After the intensity reaches its peak in the third quarter of the first hour, it decreases in both cases. Within alternative routes the differences in traffic flows showed a significant level with the TTI values elongated to 10 min and 14 min (Ciołkowskiego), yet further extension of TTI did not cause such influence. In the case of Sulika, route traffic intensities differed significantly when the TTI was elongated up to 300%. In the case of Ciolkowskiego and Sulika alternative routes, higher local speed limit constituted around 30% of the route length. Hence, it could be expected that this facet should be additional motivation to reroute for drivers facing deteriorated conditions on the main routes. However, the results did not confirm that, and no significant differences in traffic flows changes were stated on those routes. Admittedly, on Ciolkowskiego route we stated a significant difference in the changed traffic intensity, but it is not supported by relevant changes to the main direction (Wiosenna str) so it cannot be the result of the information given of the VMS.
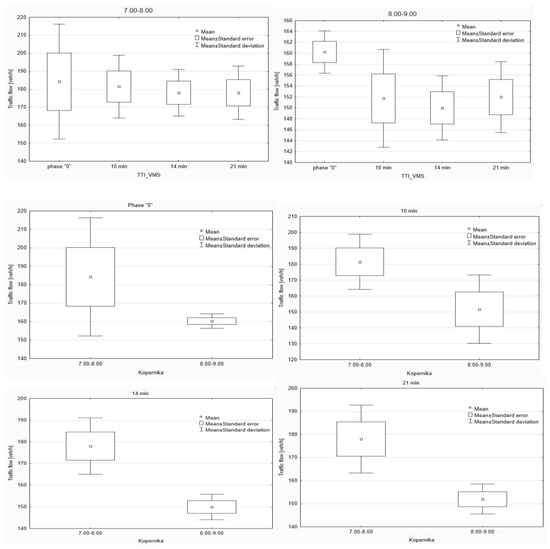
Figure 9.
Box plots for Kopernika route with different TTI values.
Considering achieved ANOVA analyses results, two observations are symptomatic and essential in terms of VMS impact on drivers travel route choice. The first one shows that significant difference for the Sulika route was also stated in phase “0”. This result seems to be random because the significant difference between the first and second hour at phase “0” becomes insignificant for TTI elongated up to 100%, becoming significant again for TTI elongated to 300%. The second revelation is that significant differences are related with the quite intensive traffic flow decreases in the second rush hour, and the decreasing traffic is a natural process evolving from daily traffic flow changes. The results of this study contradict Benson’s [32] and Zhong-Rens et al. [33] findings. Benson found that drivers respond well to simple and reliable information on VMS, while Zhong-Ren stated that 66% of drivers changed their route and their behaviour was correlated with the frequency that a driver encounters an arterial VMS.
The authors’ observations suggest that recorded traffic fluctuations are the result of natural traffic intensity fluctuations in traffic flow rather than changes caused by the impact of VMS information. This conclusion is also supported by the data presented in Figure 7. If elongated TTI would effectively influence drivers’ route choice decisions, then we should observe the decrease of traffic intensity in the first hour along with increase intensity on the alternative route (i.e., Kopernika–Sikorskiego intersection). However, as it can be seen, this does not happen. Traffic intensity increases smoothly to reach its maximum in the third quarter (7:30–7:45) after which it decreases. This trend is equally present in Kopernika (Figure 7) and Sikorskiego routes (Figure 8).
The lack of drivers’ response to the displayed TTI values in everyday conditions cannot be explained by a short display time (it is the case for the longest exposure of TTI in everyday conditions) because in this study each elongated TTI value was displayed for 2 h. A possible explanation for that behavior can be sought in the fact that drivers have no knowledge about the route of the alternative direction (the alternative route is not displayed on the VMS board). Another justification could be that drivers have limited confidence in the information provided, but that should be additionally confirmed in an extended questionnaire survey.
5. Conclusions
Several investigations testing drivers attitudes toward VMS placed on motorways have been conducted so far, but many of them were based on simulator surveys. This paper is based on in situ surveys and focused on the effect of travel time information provided on VMSs on drivers’ route choice in the urban area of a middle-size city. The achieved outcomes are in contradiction to earlier research findings and showed a lack of drivers’ response to the information displayed on the VMSs, regardless of the length of expected travel time. Drivers did not divert, even with the time elongated up to 200% or 300% of the initial state.
The significant changes observed in traffic flow intensities between consecutive morning rush hours resulted from natural fluctuations in daily traffic, not from expected delays on a given direction. Hence, the directing role of VMS investigated in this paper is very questionable, and the use of VMS providing only simple information about expected travel time is insufficient—drivers seem to ignore such a message. The reason for that may also lie in limited drivers’ knowledge about the route of alternative directions. Better route change could be achieved from boards displaying travel time information together with a graphical display of the alternative route. However, recognition of drivers’ behavior in this scope could be additionally confirmed through an extended questionnaire study. Similarly, possible use of mobile applications and drivers’ preferences and attitudes toward traffic information conveyed through VMSs and their propensity to divert under certain situations could be verified.
Author Contributions
Conceptualization, R.Z. and Z.D.; methodology, R.Z.; formal analysis, R.Z.; investigation, R.Z.; resources, Z.D.; writing—original draft preparation, R.Z.; writing—review and editing, R.Z.; visualization, R.Z. All authors have read and agreed to the published version of the manuscript.
Funding
This research was supported by Project No WZ//WB-IIL/1/2020, and it was financially supported by the Ministry of Science and Higher Education, Poland.
Institutional Review Board Statement
Not applicable.
Informed Consent Statement
Not applicable.
Data Availability Statement
The data presented in this study are available on request from the corresponding author. The data are not publicly available due to legal issues—they are confidential data.
Conflicts of Interest
The authors declare no conflict of interest.
Appendix A
Table A1.
ANOVA results for hourly traffic fluctuations (elongated TTI).
Table A1.
ANOVA results for hourly traffic fluctuations (elongated TTI).
| Main Routes | ||||||||||||
| Wiosenna | Baranowicka | Kopernika | Sopoćki | Antoniukowska | ||||||||
| 7:00–8:00 | F = | p = | F = | p = | F = | p = | F = | p = | F = | p = | ||
| 0.2730 | 0.8436 | 0.4078 | 0.7502 | 0.0857 | 0.9665 | 0.0216 | 0.9989 | 0.0017 | 0.9999 | |||
| 8:00–9:00 | 0.2769 | 0.8409 | 0.3715 | 0.7750 | 1.9592 | 0.1740 | 0.1305 | 0.9688 | 0.6113 | 0.6608 | ||
| F = | p = | F = | p = | F = | p = | F = | p = | F = | p = | |||
| Phase “0” | 0.9095 | 0.3770 | 2.4998 | 0.1649 | 2.2171 | 0.1870 | 2.6608 | 0.1596 | 0.0023 | 9629 | ||
| 10 min | 4.566 | 0.0764 | 0.5571 | 0.4836 | 4.3022 | 0.0755 | ||||||
| 14 min | 0.3780 | 0.5612 | 2.0486 | 0.2023 | 15.4229 | 0.0077 | ||||||
| 21 min | 0.1667 | 0.6972 | 1.1357 | 0.3275 | 10.4000 | 0.0180 | ||||||
| 6 min | 4.2852 | 0.0838 | 0.3921 | 0.5542 | ||||||||
| 8 min | 2.5366 | 0.1623 | 0.0008 | 0.9772 | ||||||||
| 12 min | 1.1348 | 0.3277 | 0.3032 | 0.6017 | ||||||||
| 16 min | 5.7907 | 0.0528 | 0.1376 | 0.7233 | ||||||||
| Alternative Routes | ||||||||||||
| Ciołkowskiego | Sulika | Sikorskiego | Antoniukowska | Świętokrzyska | Wierzbowa | |||||||
| 7:00–8:00 | F = | p = | F = | p = | F = | p = | F = | p = | F = | p = | F = | p = |
| 0.0161 | 0.9970 | 0.1021 | 0.9572 | 0.0411 | 0.9883 | 0.2608 | 0.8984 | 0.0944 | 0.9827 | 0.0771 | 0.9881 | |
| 8:00–9:00 | 0.3290 | 0.8044 | 1.043 | 0.4085 | 1.0112 | 0.4215 | 0.4264 | 0.7872 | 0.3752 | 0.8227 | 0.6594 | 0.6295 |
| F = | p = | F = | p = | F = | p = | F = | p = | F = | p = | F = | p = | |
| Phase “0” | 1.8797 | 0.2194 | 7.0617 | 0.0376 | 0.2155 | 0.6588 | 0.8198 | 0.4001 | 0.0806 | 0.7860 | 0.6457 | 0.4522 |
| 10 min | 8.8113 | 0.0250 | 5.4777 | 0.0578 | 3.0636 | 0.1306 | ||||||
| 14 min | 6.3200 | 0.0456 | 5.2086 | 0.0626 | 0.0048 | 0.9465 | ||||||
| 21 min | 1.5796 | 0.2552 | 7.7327 | 0.0319 | 1.5455 | 0.2601 | ||||||
| 6 min | 3.7376 | 0.1013 | 0.0924 | 0.7713 | 1.7444 | 0.2347 | ||||||
| 8 min | 2.2369 | 0.1853 | 0.1609 | 0.7021 | 5.2224 | 0.0623 | ||||||
| 12 min | 1.5087 | 0.2653 | 0.4622 | 0.5219 | 5.1200 | 0.0643 | ||||||
| 16 min | 2.7145 | 0.1505 | 0.2329 | 0.6464 | 4.1136 | 0.0888 | ||||||
References
- Gonzalo-Orden, H.; Pérez-Acebo, H.; Linares-Unamunzaga, A.; Rojo, M. Effects of traffic calming measures in different urban areas. Transp. Res. Proc. 2018, 33, 83–90. [Google Scholar] [CrossRef]
- Lee, G.; Joob, S.; Oh, C.; Choi, K. An evaluation framework for traffic calming measures in residential areas. Transp. Res. Part D Transp. Environ. 2013, 25, 68–76. [Google Scholar] [CrossRef]
- Directive 2010/40/EU of the European Parliament and of the Council of 7 July 2010. Available online: https://eur-lex.europa.eu (accessed on 15 April 2020).
- Blythe, P.; Rackliff, T.; Holland, R.; Mageean, J. ITS applications in public transport: Improving the service to the transport system. J. Adv. Transp. 2000, 34, 325–345. [Google Scholar] [CrossRef]
- Stelzer, A.; Englert, F.; Hörold, S.; Mayas, C. Improving service quality in public transportation systems using automated customer feedback. Transp. Res. Part E Logist. Transp. Rev. 2015, 89, 259–271. [Google Scholar] [CrossRef]
- Lee, S.H.; Cho, H.J. A Study on Safety Impacts for VMS Traffic Information. J. Korea Inst. Intell. Transp. Syst. 2015, 14, 22–30. [Google Scholar] [CrossRef]
- Hamish, A.J.; Merat, N. The effectiveness of safety campaign vms messages—A driving simulator investigation. In Proceedings of the Fourth International Driving Symposium on Human Factors in Driver Assessment, Training and Vehicle Design, Washington, DC, USA, 9–12 July 2007; Available online: https://www.researchgate.net/publication/228598600_the_effectiveness_of_safety_campaign_vms_messages_a_driving_simulator_investigation (accessed on 25 January 2021).
- Kwon, E.; Brannan, D.; Shouman, K.; Isackson, C.; Arseneau, B. Development and Field Evaluation of Variable Advisory Speed Limit System for Work Zones. Transp. Res. Rec. J. Transp. Res. Board 2015, 12–18. [Google Scholar] [CrossRef]
- Gao, F.; Li, S.E.; Zheng, Y.; Kum, D. Robust control of heterogeneous vehicular platoon with uncertain dynamics and communication delay. IET Intell. Transp. Syst. 2016, 10, 503–513. [Google Scholar] [CrossRef]
- Wang, D.; Fengjie, F.; Xiaoqin, L.; Sheng, J.; Dongfang, M. Travel time estimation method for urban road based on traffic stream directions. Transp. A Transp. Sci. 2016, 12, 479–503. [Google Scholar] [CrossRef]
- Wang, Z.; Wu, G.; Barth, M.J. Cooperative Eco-Driving at Signalized Intersections in a Partially Connected and Automated Vehicle Environment. IEEE Trans. Intell. Transp. Syst. 2020, 21, 2029–2038. [Google Scholar] [CrossRef]
- Tian, D.; Li, W.; Wu, G.; Barth, M.J. Examining the Safety, Mobility and Environmental Sustainability Co-Benefits and Tradeoffs of Intelligent Transportation Systems. UC Davis: National Center for Sustainable Transportation. 2017. Available online: https://escholarship.org/uc/item/0m49j95r (accessed on 24 April 2020).
- Jurgen, R. V2V/V2I Communications for Improved Road Safety and Efficiency; SAE: Warrendale, PA, USA, 2012; pp. i–viii. [Google Scholar]
- Pribyl, O.; Blokpoel, R.; Matowicki, M. Addressing EU climate targets: Reducing CO2 emissions using cooperative and automated vehicles. Transp. Res. Part D Transp. Environ. 2020, 86. [Google Scholar] [CrossRef]
- Hoye, A. Speed Cameras, Section Control, and Kangaroo Jumps—A Meta-Analysis. Accid. Anal. Prev. 2014, 73, 200–208. [Google Scholar] [CrossRef] [PubMed]
- La Torre, F.; Meocci, M.; Nocentini, A. Safety effects of automated section speed control on the Italian motorway network. J. Saf. Res. 2019, 69, 115–123. [Google Scholar] [CrossRef]
- Ziolkowski, R. Effectiveness of Automatic Section Speed Control System Operating on National Roads in Poland. Promet-Traffic Transp. 2019, 31, 435–442. [Google Scholar] [CrossRef]
- Karlberg, N.O. Road, weather, action. In Traffic Technology International; AutoIntermediates Limited: Surrey, UK, 2003. [Google Scholar]
- Rama, P.; Kulmala, R. Effects of variable message signs for slippery road conditions on driving speed and headways. Transp. Res. Part F 2000, 3, 85–94. [Google Scholar] [CrossRef]
- Boyle, L.; Mannering, F. Impact of traveller advisory systems on driving speed: Some new evidence. Trans. Res. Part C 2004, 12, 57–72. [Google Scholar] [CrossRef]
- Zhenzhen, Y.; Hongcheng, G.; Shengrong, Z. Simulation analysis for guidance benefit of travel time displayed by variable message signs. IEEE 2011, 5, 123–127. [Google Scholar]
- Cheu, R.L.; Liu, Q.; Lee, D. Arterial Travel Time Estimation Using SCATS Detectors. Appl. Adv. Technol. Transp. 2002, 4, 32–39. [Google Scholar] [CrossRef]
- Elhenawy, M.H.; Chen, H.; Rakha, H.A. Dynamic Travel Time Prediction Using Data Clustering and Genetic Programming. Transp. Res. Part C Emerg. Technol. 2014, 42, 82–98. [Google Scholar] [CrossRef]
- Jamshidnejad, A.; Schutter, B.D. Estimation of the Generalised Average Traffic Speed based on Microscopic Measurements. Transp. A Transp. Sci. 2015, 11, 525–546. [Google Scholar] [CrossRef]
- Shang, H.; Huang, H.; Gao, Z. Impacts of variable message signs on traffic congestion. Sci. China Ser. E Technol. Sci. 2009, 52, 477. [Google Scholar] [CrossRef]
- Erke, A.; Sagberg, F.; Hagman, R. Effects of route guidance variable message signs (VMS) on driver behaviour. Transp. Res. Part F Traffic Psychol. Behav. 2007, 10, 447–457. [Google Scholar] [CrossRef]
- Chatterjee, K.; Hounsella, N.B.; Firminb, P.E.; Bonsall, P.W. Driver response to variable message sign information in London. Transp. Res. Part C Emerg. Technol. 2002, 10, 149–169. [Google Scholar] [CrossRef]
- Zhang, E.; Zhang, X. Road Traffic Congestion Detecting by VANETs. In Proceedings of the 2nd International Conference on Electrical and Electronic Engineering (EEE 2019); Atlantis Press: Paris, France, 2019; Volume 185. [Google Scholar]
- Menelaou, C.; Kolios, P.; Timotheou, S.; Panayiotou, C.G.; Polycarpou, M.P. Controlling road congestion via a low-complexity route reservation approach. Transp. Res. Part C Emerg. Technol. 2017, 81, 118–136. [Google Scholar] [CrossRef]
- Jayapal, C.; Roy, S.S. Road traffic congestion management using VANET. In Proceedings of the International Conference on Advances in Human Machine Interaction (HMI), Kodigehalli, India, 3–5 March 2016; pp. 1–7. [Google Scholar] [CrossRef]
- Ziółkowski, R.; Anszczak-Pycz, M.; Dziejma, Z. Analysis of red light camera violations—A case study in Bialystok. In Proceedings of the 2018 Smart City Symposium Prague (SCSP), Prague, Czech Republic, 24–25 May 2018; pp. 1–6. [Google Scholar] [CrossRef]
- Benson, B.G. Motorist Attitudes about Content of Variable-Message Signs. Transp. Res. Rec. J. Transp. Res. Board 1996, 1550, 48–57. [Google Scholar] [CrossRef]
- Zhong-Ren, P.; Guequierre, N.; Blakeman, J. Motorist Response to Arterial Variable Message Signs. Transp. Res. Rec. J. Transp. Res. Board 2004, 1899, 55–63. [Google Scholar] [CrossRef]
Publisher’s Note: MDPI stays neutral with regard to jurisdictional claims in published maps and institutional affiliations. |
© 2021 by the authors. Licensee MDPI, Basel, Switzerland. This article is an open access article distributed under the terms and conditions of the Creative Commons Attribution (CC BY) license (http://creativecommons.org/licenses/by/4.0/).