Article

Comparison of Selected Methods for the Stator Winding Condition Monitoring of a PMSM Using the Stator Phase Currents

by
Przemyslaw Pietrzak
and
Marcin Wolkiewicz
*
Department of Electrical Machines, Drives and Measurements, Wroclaw University of Science and Technology, 50-370 Wroclaw, Poland
*
Author to whom correspondence should be addressed.
Energies 2021, 14(6), 1630; https://doi.org/10.3390/en14061630
Submission received: 21 February 2021 / Revised: 10 March 2021 / Accepted: 11 March 2021 / Published: 15 March 2021
(This article belongs to the Special Issue Fault Diagnosis of Electrical Machines and Drives)

Abstract

:
Stator winding faults are one of the most common faults of permanent magnet synchronous motors (PMSMs), and searching for methods to efficiently detect this type of fault and at an early stage of damage is still an ongoing, important topic. This paper deals with the selected methods for detecting stator winding faults (short-circuits) of a permanent magnet synchronous motor, which are based on the analysis of the stator phase current signal. These methods were experimentally verified and their effectiveness was carefully compared. The article presents the results of experimental studies obtained from the spectral analysis of the stator phase current, stator phase current envelope, and the discrete wavelet transform. The original fault indicators (FIs) based on the observation of the symptoms of stator winding fault were distinguished using the aforementioned methods, which clearly show which symptom is most sensitive to the incipient fault of the stator winding of PMSMs.

1. Introduction

The many significant advantages of permanent magnet synchronous motors (PMSMs), such as very good dynamic properties, high efficiency, and power density, have led to their frequent use in many drives systems today. Progress in the field of power electronics, microprocessor technology, and materials engineering for permanent magnets contributed to the popularization of PMSM drives in many applications in the automotive, transport, and aviation industries [1]. These motors are also characterized by a quiet operation, long lifetime, and high power factor, resulting in their common use in household appliances and other commercial applications [2].
PMSMs, despite their higher price, are replacing induction motors (IMs), which until now were the most popular in industrial applications. Nevertheless, such high-efficiency motors are exposed to various types of faults, just like other electric motors. As shown in Figure 1, the most common faults of electric motors include stator (36%), rotor (9%), and bearing (41%) faults. However, the percentage share of mechanical damage decreases with increasing rated voltage and power of the motor, in favor of electrical damage, up to 66% of all faults [3].
Stator winding damages in PMSMs are mainly short-circuits, which are usually caused by insulation damage. Insulation damage is a consequence of abrasion or overheating of the winding as a result of electrical or mechanical stresses and excessive motor loads [4]. This type of damage is highly destructive. It begins with a very difficult to detect inter-turn short-circuit (ITSC) in the adjacent turns of the winding, which may quickly damage subsequent coils and become phase-to-phase or phase-to-ground short-circuits.
The consequence of this may be the failure of the motor and an emergency shutdown of the entire drive system. Inter-turn short-circuits may also cause irreversible demagnetization of permanent magnets.
Due to the destructive nature of the stator winding fault of a PMSM, it must be detected at an early stage to prevent the fault spreading, which may result in a significant increase in repair costs. Therefore, the implementation of an appropriate diagnostic system, based on effective algorithms, is essential to prevent complete failure of the drive system, causing losses and delays in the industrial process [5].
When developing an effective diagnostic system, the basic issue is the knowledge of changes in motor operation caused by specific damage and their subsequent monitoring according to the signals available for measurements [6]. Over the years, a number of methods for detecting faults in electrical motors have been developed, including PMSMs [7,8,9,10,11]. However, new, more robust, faster, and more accurate diagnostic algorithms are still being intensively searched for. Currently, the stator phase current and voltage are the basic diagnostic signals in the diagnosis of stator winding faults. Nevertheless, the stator fault may also affect the rotational speed, temperature, back electromotive force, and magnetic flux, as well as internal signals of the control structure, of the PMSM drive system [12,13].
The most common methods for identifying symptoms of damage to the PMSM stator winding are methods based on stator current analysis. The most popular technique is the spectral analysis of the stator phase current using fast Fourier transform (FFT), presented among others in [14,15]. Since the FFT requires the signals to be stationary, a condition that is difficult to meet in speed-controlled drives, other methods have also been used to analyze the stator current of PMSM drives, such as Hilbert–Huang transform (HHT) [16,17], principal component analysis (PCA) [18,19], short-time Fourier transform (STFT) [20,21], continuous wavelet transform (CWT) [22,23], discrete wavelet transform (DWT) [24,25,26], and Wigner–Ville distribution (WVD) [27].
The processing of the phase current signal with the aforementioned methods allows for the extraction of symptoms characteristic for the failure of the stator winding of PMSM drives. These symptoms can be used directly for diagnostic purposes or can be used as a basis for the construction of faults detectors and classifiers.
Nevertheless, an essential and actual problem in the development of electric motor fault detectors and classifiers is the selection of an appropriate signal processing method, ensuring the best possible extraction of the fault symptoms and, thus, achieving the highest possible efficiency in the detection and classification of damage.
It should also be noted that the effectiveness of selected methods of diagnosing motor faults may depend on many different factors, such as the type of the motor, control structure, regulator settings [28], measurement resolution, and acquisition of diagnostic signals. Unwanted disturbances can significantly reduce the effectiveness or even make the fault diagnosis process impossible.
The main goal of this article is to compare the effectiveness and experimentally verify selected methods of stator current analysis under the initial stage of inter-turn short-circuits (ITSCs) of PMSM drives, using frequency domain and time–frequency domain analyses. Classical FFT was used for analysis of the stator phase current signal and stator phase current envelope. Next, the discrete wavelet transform (DWT) was applied to current envelope analysis. Both signal processing methods were tested for a PMSM drive operating under variable speed and load torque.
The article is divided into six sections. Section 2 discusses the symptoms of damage to the stator winding of a PMSM that may be visible in the stator phase current signal and selected methods for its analysis. In Section 3, the test stand and the methodology of experimental research are presented. In Section 4, the experimental results of stator current analysis using the aforementioned methods for detecting the symptoms of ITSCs in the PMSM stator winding are demonstrated, and some fault indicators are proposed. Next, in Section 5, the online operation of the proposed fault indicators according to the analyzed signal processing methods is experimentally validated and evaluated. Final conclusions from the conducted research are presented in Section 6.

2. Symptoms of the Stator Winding Fault in the Phase Current Signal

2.1. Stator Current Data Acquisition for Diagnostic Purposes

The stator phase current is one of the most frequently used signals in the diagnosis of electric motors, including synchronous motors with permanent magnets [29,30,31,32]. Current measurement is cheap, easy, and noninvasive, and it can be performed using current transducers usually applied in drive systems that do not interfere with the operation of the motor.
Damage to the stator winding, specifically an inter-turn short-circuit, causes changes in the stator current amplitude, fluctuations, and unbalance [33]. These changes make it possible to extract the fault symptoms from the stator phase current signal using a variety of diagnostic methods. As outlined in Section 1, some methods are based on the raw current signal and others on the processed signal, using the various mathematical methods described previously. The stages of processing diagnostic information using this approach are shown in Figure 2.
Various types of electric motor faults, including stator winding faults, may also cause changes in selected motor parameters. For this reason, identifying parameters and monitoring them while the system is in operation can be useful for detecting faults [34]. In the case of inter-turn short-circuits, the detection of which is the main subject of this paper, the failure symptom is a decrease in stator resistance value [35].
When the motor is operating in a closed-loop vector control structure, the detection of ITSCs is more difficult. The effect of the fault is to some extent compensated for by the operation of regulators, which makes it difficult to detect the failure at an early stage [13]. Additionally, in the FFT amplitude spectrum, there are frequency components independent of the fault, increasing with the load torque, such as even multiples of the frequency of the supply voltage fs. This phenomenon complicates the isolation of the changes related only to the winding failure.
In the case of frequency domain analysis, carried out mainly using the FFT, an inter-turn short-circuit may cause an increase in the third harmonic (3fs) in the spectrum of the stator phase current [36]. According to [37], the amplitude of the frequency components described by Equation (1) may also increase.
f i t s c 1 = f s ( 1 ± k p p ) ,
where fs is the supply voltage frequency, k represents the consecutive positive integers, and pp represents the number of pole pairs.
Nevertheless, it should be taken into account that an increase in these frequency components can also be caused by eccentricity. In [37] and [38], the authors suggested that, in order to distinguish between an inter-turn short-circuit and an eccentricity, one can use the monitoring of the 17th and 19th harmonious values, as well as sideband frequencies.
Additionally, damage to the stator winding may result in an increase in the slot harmonics, calculated using the following equation [39]:
f i t s c 2 = f s ( 1 ± k N s s p p ) ,
where Nss is the number of stator slots.
Due to the decreasing prices and the increasing computing power of microcontrollers, as well as the increasingly better possibilities of measuring devices and data acquisition (DAQ) cards, ensuring very good resolution, it is still worth paying attention to research on the application of spectral analysis using FFT. Several years ago, the resolution of the converters did not allow for the full potential of this solution to be used, and the limited computing power and memory of microcontrollers made it impossible to implement diagnostic algorithms, especially on low-cost processors.
In the diagnosis of electric motors, the quality of devices used for data acquisition is extremely important. To illustrate this effect, in Figure 3, a comparison of FFT spectra of the stator phase current of the PMSM obtained using different DAQ cards is shown. The tested motor parameters are grouped in Appendix A. The first FFT spectrum was obtained after transforming the stator phase current signal acquired with the use of a DAQ Universal Serial Bus (USB) card (NI-USB-6212 DAQ CARD), with 16 bit resolution. The second one was obtained using a DAQ card with 24 bit resolution (DAQ NI PXI-4492). According to the analysis of these spectra, it is possible to note a significant difference in the noise level. This difference may significantly affect the effectiveness of diagnosis (the possibility of isolating the damage symptom in the early stage of the damage), which significantly depends on the difference in the symptom amplitude values for the undamaged motor and after the failure. For example, the difference between the third harmonic amplitude level and the measurement noise level when using a better-quality DAQ card is about 42,811 dB, while, in the case of a USB card, this value is equal to 20,915 dB. Thus, there is a large discrepancy in the ratio of the noise value level to the signal level despite the same motor state (presented as the signal-to-noise ratio (SNR)).

2.2. Selected Methods for the PMSM Stator Current Signal Preprocessing

As described in Section 1, there are many methods to preprocess the stator phase current signal for motor fault diagnosis and condition monitoring purposes. Nevertheless, it is essential to choose the method that will ensure the best diagnostic effectiveness. This section describes the selected methods of phase current signal preprocessing. Some of them were experimentally verified, and their results are discussed in detail in the subsequent sections.
One of the approaches that may improve the effectiveness of diagnosis compared to the classical spectral analysis of the stator phase current is the calculation of the stator phase current space vector magnitude according to Equation (3) and its spectral analysis using FFT. Following an inter-turn short-circuit, the amplitude of the frequency component 2fs increases in its spectrum. This approach is known under the acronym EPVA (extended Park’s vector approach), and its effectiveness in short-circuit detection has been confirmed among others in [40].
| i s | = i s α 2 + i s β 2 ,
where i, i are components of the stator current vector in a stationary reference frame (α/β).
The increase in the amplitude of the characteristic failure frequencies causes increased fluctuations of the stator phase current amplitude. The Hilbert transform may be used to isolate them, determining the envelope of the stator phase current in accordance with Equation (4).
i s H ( t ) = i s 2 ( t ) + H 2 [ i s ( t ) ] ,
where H[is(t)] is the Hilbert transform of the stator phase current signal [41],
H [ i s ( t ) ] = 1 π + i s ( t ) t τ   d τ .
Unlike the frequency domain diagnostic signal analysis methods, which do not monitor the failure time, time-frequency domain methods such as STFT or wavelet transform (WT) can detect when a failure occurs.
The ITSC faults using STFT can be detected by analyzing the obtained stator phase current spectrogram. The values of the spectrogram depend on the amplitudes of the individual harmonics. After the failure occurs, the value of the spectrogram increases for the failure frequencies characteristic for the amplitude spectrum, but only for the time periods corresponding to the failure [42].
The WT, in turn, allows for noise reduction and the selection of frequency bands on which the analysis is to be focused [43]. Stator winding fault results in an increase in the value of details, which cover the frequency range, in which there are components characteristic for this type of damage [44]. The use of WT for the diagnosis of stator winding damage to PMSM drives is associated with complications resulting from the presence in the spectrum of frequency components independent of the damage, which also penetrate the bands where only damage symptoms should be present. Therefore, research on the application of this signal processing method is still ongoing.
Discrete wavelet transform is based on the dyadic (twofold sampling) division of the scale and the shift (coefficients a and b). Taking into account a = 1 2 j , b = k 2 j , j , k C where C is a set of integers, we get
ψ j , k ( t ) = 2 j 2 ψ ( 2 j t k ) .
The practical form of DWT in numerical calculations is expressed as follows:
D W T j , k ( t ) = n = 0 N 1 x ( n ) ψ j k * ( n ) ,
where ψ j k * ( n ) is the conjugation of function of the form
ψ j , k ( n ) = 2 j 2 ψ ( 2 j n k ) ,
where N is the number of samples determined by the limits of occurrence of the wavelet described by Equation (8).
DWT performs multiresolution wavelet analysis. At each of its stages, the signal can be split into two components. In the case of dyadic division, the bands of these components occupy half of the j-th resolution degree. To obtain these components, a set of filters (low- and high-pass) and the signal sampling operation are used, selecting only even samples [45]. An example of a wavelet decomposition tree for a second-level analysis is shown in Figure 4.
Wavelet transform is frequently compared with FFT. The biggest advantage of wavelet transform is that it is very well suited for the analysis of nonstationary signals, i.e., signals with a parameters varying in time, whereas FFT is a powerful tool for analyzing the components of stationary signals. Diagnostic signals are very often nonstationary signals; therefore, the use of DWT in this field is justified. The second difference is that wavelets are very well localized in both the time and the frequency domain, whereas the FFT is only localized in frequency domain [46].

3. Experimental Setup and Test Scenarios

The object of the experimental verification was a 2.5 kW PMSM operating in a closed-loop control structure (with field-oriented control (FOC)) and powered by a voltage source inverter (VSI). The parameters of the tested motor are listed in Appendix A. This motor was connected via a rigid coupling to the second PMSM with nominal power of 4.7 kW, generating load torque to the tested motor. The test stand is shown in Figure 5a. The motor shown on the left side of the figure is the loading motor, while that on the right is the tested motor. The design of the stator winding of the tested motor was specially prepared to enable controlled short-circuits of a selected number of turns in the stator phase B, which is shown in Figure 5b. In practice, the preparation of the stator winding for the study of the impact of inter-turn short-circuits consisted of leading the appropriate taps corresponding to the specified number of turns from the coil. Direct short-circuits were implemented by connecting the taps on the terminal board with a wire. During the tests, a maximum of four turns in phase B were short-circuited, which accounted for 1.6% of all turns in the phase winding. The tests were carried out without limiting the short-circuit current with an additional resistor in the short-circuit loop. The stator phase currents were measured using LEM LA 25-NP multirange transducers. The output signals from the transducers were entered into the data acquisition system, which was the DAQ NI PXI-4492 (8-channels) measurement card by National Instruments (NI). This card was placed in the NI PXI 1082 industrial computer, which can be seen in Figure 5c. The block diagram of the experimental stand is shown in Figure 6.
Using the described test stand, an experimental verification of the application of FFT to the current signal and the stator phase current envelope analysis, as well as the DWT of the stator current envelope, to detect ITSC in the PMSM stator winding was carried out. The tests were carried out for various values of the load torque in the range of 0−1TN and for various set rotational speeds (frequency of the supply voltage, 50–100 Hz), which allowed examining the influence of motor operating conditions on the extracted ITSC symptoms.

4. Experimental Verification of the Proposed Diagnostic Methods for Detecting Shorted Turns in PMSM Stator Winding

4.1. Application of Spectral Analysis of the Stator Current Signal and the Current Envelope for ITSC Detection

As previously mentioned, the spectral analysis of the signal with the use of FFT is one of the most frequently used methods for diagnosing faults in electric motors [47]. Amplitudes of harmonics with characteristic ITSC fault frequencies are searched for in the FFT spectra, the change of which allows detecting a fault. Figure 7 shows the spectra of the stator current in phase B of the tested motor operating at nominal frequency fs = 100 Hz (N = NN = 1500 rpm) for idle running (Figure 7a) and nominal torque (Figure 7b), for an undamaged winding case and with a changeable number Nsh of modeled ITSCs (from 1–3). In these spectra, a large increase in the amplitude of the third harmonic of the stator current can be observed after the ITSC. The effect of the number of shorted turns Nsh and the load torque TL on the amplitude value of the 3fs component is shown in Figure 8a, while the dependence on the frequency of the supply voltage fs is illustrated in Figure 8b.
From the above results, it can be concluded that the load torque change does not have a significant impact on the value of the third harmonic amplitude in the stator phase current spectrum, which allows the use of this component as a good symptom of ITSC. Nevertheless, in the case of the analysis of the influence of the supply voltage frequency on the level of this amplitude, it can be noted that the greatest sensitivity to damage occurred when the motor operated at the rated frequency fs = fsN = 100 Hz.
In order to isolate the fluctuations caused by the increase in the characteristic failure frequency 3fs, the signal envelope was determined in accordance with Equation (4). The stator current waveforms of phase B and the current envelope for the PMSM undamaged winding and that with a stator winding fault are shown in Figure 9.
Figure 10 shows the spectra of the stator phase current envelope in the B phase of the motor operating at fs = 100 Hz and different numbers of ITSCs physically modeled in this phase of the stator winding. As can be seen in these spectra, a significant increase in the value of the 2fs frequency component can be observed in the case of damage to the stator winding. The effect of the number of shorted turns Nsh and the load torque TL on the level of this amplitude is shown in Figure 11a, while the effect of the supply voltage frequency fs is presented in Figure 11b.
The greatest sensitivity to the increasing number of shorted turns occurs when the motor operates at high rotational speeds, close to the rated value. Similarly to the analysis of the stator phase current spectrum, it can be concluded that the 2fs component and its changes due to damage to the stator winding are a good diagnostic indicator.

4.2. Application of DWT of the Stator Current Envelope for ITSC Detection

At the next stage of the research, the DWT method was tested for ITCS symptoms extraction from the stator current envelope of the PMSM drive. To isolate the symptoms of stator damage of the PMSM drive, the stator phase current envelope signal was re-sampled to obtain an amplitude spectrum in the 0–1024 Hz band, and decomposition to the fifth level was performed. The obtained bands are grouped in Table 1 and shown in Figure 12. The choice of the decomposition level resulted from the values of the characteristic failure frequencies in the FFT spectrum of the stator phase current envelope, which was shown in Figure 10.
In the case of the signal analysis using the wavelet transform, it is essential to select an appropriate type of the wavelet, because the effectiveness of fault detection may depend on the selected wavelet. Several families of wavelets that have proven to be especially useful in this case were proposed in the literature. The Haar wavelet is one of the simplest in microcontroller implementation, because the signal processing needs only products and signed sums [48]. Nevertheless, this type of wavelet has not found an application in fault diagnosis as diagnostic signals are usually complex nonstationary signals. The Daubechies family of wavelets, invented by Ingrid Daubechies, is very popular for analyzing these types of signals. These wavelets are marked dbO, where O is the wavelet order [49]. To avoid overlapping between two adjacent frequency bands, a mother wavelet with a high order has to be used. To separate the different frequency bands, there is an obvious tradeoff between the order of the mother wavelet and the computational cost. This is why intensive study is necessary to adapt the order of the mother wavelet to the requirements [50]. In this study, according to the wavelet responses of different orders of this family, we used the Daubechies wavelet of order 13 (db13), because it ensured the lowest frequency cross-over between adjacent bands.
Figure 13 shows a comparison of approximations and details waveforms for an undamaged motor and one with three shorted turns in the stator winding, for the supply voltage frequency fs = 100 Hz and idle running of the drive, as well as for the rated load torque. After an occurrence of ITSC, a significant increase in the amplitude of the third detail (d3) can be observed, the band of which covers the value of the 2fs component in the spectrum of the stator current envelope.
The root mean square (RMS) value of individual details, calculated in accordance with Equation (9), was adopted as the failure index for this analysis.
i s B D R M S H = 1 n n = 0 n 1 | i s B D H ( n ) | 2 ,
where n is the number of samples for the waveform of each detail.
The influence of the number of shorted turns and the load torque on the RMS value of the third detail of DWT of the stator current envelope for the motor operating at rated speed (fs = 100 Hz) is shown in Figure 14. It can be stated that the fault symptom is highly sensitive to the increasing number of shorted turns, while it also shows the relatively low sensitivity to changing load torque.
The impact of stator winding fault on the percentage increase in the RMS value according to the details and approximations of the wavelet transform of the stator phase current envelope for the motor operating at rated rotational speed (fs = 100 Hz) and rated load torque is shown in Figure 15. After an ITSC occurs, a significant increase in the RMS value of the detail occurs, the frequency band of which covers the characteristic failure frequency 2fs in the stator current envelope spectrum.
The influence of the supply voltage frequency on the RMS value of the third detail of the stator phase current envelope is shown in Figure 16a. As expected, when the 2fs component starts to move beyond the frequency band covering detail number 3 (Table 1), its RMS value changes as shown in Figure 16b. This allows us to conclude that monitoring the values of the third and fourth details allows for the detection of stator winding ITSCs in the entire tested range of motor speeds (supply voltage frequency). It must be added that the determination of fs is very simple to implement and automate, because it is enough to find the frequency component with the greatest amplitude in the spectrum of the stator phase current.
In Figure 17, another failure index is proposed, which was obtained after squaring the third detail of the DWT of the stator phase current envelope. It also allows for observation of changes that are the result of the ITSC in the stator winding, especially when operating at rated load.

5. Testing of the Proposed Fault Indicators of ITSCs in On-Line Operation of the Drive System

In this section, the online operation results of the proposed diagnostic methods and selected fault indicators are discussed and compared. Figure 18 shows the changes in the amplitude of the stator phase current and the previously described fault symptoms for the operation of the motor at the rated speed (fs = 100 Hz) during cyclic instantaneous short-circuiting of three turns in phase B of the stator winding and with variable load torque. The load torque was increased every 0.2 TN in the range from 0 to TN.
From the observation of these waveforms, it can be concluded that each of the fault symptoms obtained with the use of the proposed methods allows for the detection of stator winding faults of the PMSM operating in the drive system with vector control. Importantly, the values of these symptoms are not strongly dependent on the load torque. The greatest changes in the fault symptom at a short-circuit of three turns in the phase B winding in the entire range of load torque changes occurred for the amplitude values of the third harmonic of the stator phase current, the 2fs component in the spectrum of the stator phase current envelope, and the RMS values of the third detail of DWT of the stator phase current envelope. Fault symptoms values after a failure increase by up to 300%. In the case of the last proposed fault symptom, i.e., the squared RMS value of the third detail of DWT of the stator phase current envelope, this increase is smaller, especially in the range of small load torques 0−0.4TN. A detailed analysis of the effectiveness of proposed fault symptoms is discussed later in this section.
Figure 19 shows the changes of the same failure symptoms at constant load torque, rated speed (fs = 100 Hz), and cyclic instantaneous short-circuiting of an increasing number of shorted turns in the range from 1–4. With the increasing number of shorted turns, the values of damage symptoms increase, which confirms the effectiveness of the proposed methods. Nevertheless, these changes become most pronounced in the case of two or more shorted turns.
To more precisely compare and evaluate the effectiveness and sensitivity of the proposed methods to the changes of the load torque and the number of shorted turns, the waveforms of the previously discussed fault indicators were averaged. A filter based on the centered moving average described by Equation (10) was used for the averaging process. The 11th element window was adopted in the filtering algorithm, with five samples on both sides around the center. This process is illustrated in Figure 20.
y f i l t e r e d ( n ) = 1 N k = n ( N 1 ) / 2 n + ( N 1 ) / 2 y ( k ) ,
where N is the window size, n is the sample number of the original fault symptom waveform, k is the sample number in the window, y(k) is the symptom value of the k-th sample in the window, and y(filtered) (n) is the average fault symptom value of the n-th sample.
Next, the ratio of average values for the undamaged motor and for the motor with a stator winding fault was compared, defining the failure detection efficiency index of fault indicators (FIs), calculated according to Equation (11).
F D E F F ( FI ) = S W F S N s h S W F S U n d a m a g e d ,
where SWFSNsh is the value of the stator winding fault symptom with Nsh shorted coils, and SWFSUndamaged is the value of the stator winding fault symptom for an undamaged motor.
The averaged waveform of the third harmonic amplitude value at the cyclic instantaneous short-circuiting of three turns in phase B is shown in Figure 21. The method of calculating the failure detection efficiency indicator is also graphically shown in this figure. This allowed for the exact determination of the actual impact of the damage on the value of this fault indicator. Using the proposed method of certain indicator averaging, it is easy to clearly notice a very large impact of the analyzed winding failure on the analyzed indicator due to its significant increase (by about 310–400%).
Proposing the above index allowed for the comparison of the actual fault impact and the assessment of the usefulness of the discussed diagnostic indicators. These results are summarized in Table 2. From the presented results, it can be concluded that the amplitude of the 3fs component in the stator current spectrum is the most sensitive to stator winding fault in the entire range of the load torque changes. Nevertheless, each of the proposed fault indicators increases at least twofold on average after the failure.
In order to compare the impact of the load torque on the values of the described symptoms during online operation, the standard deviation for the FDEFF index values from the entire tested load torque range was calculated in accordance with Equation (12). These results, together with the ratio of the indicator value at rated load to the value without load, are grouped in Table 3, while, in Table 4, the FDEFF values depending on the number of shorted turns in the B phase of the stator winding are presented.
S = 1 N 1 n = 1 N | F D E F F ( n ) μ | 2 ,
where
μ = 1 N n = 1 N F D E F F ( n ) .
On the basis of the above comparison, it can be concluded that the third harmonic amplitude in the stator phase current spectrum is the best fault indicator, taking into account the entire range of tested load torques. It should be noted, however, that the other proposed fault indicators are also very sensitive to ITSCs of the PMSM winding. The least load-dependent damage indicator is FI d 3 R M S ( i s B ) . On the other hand, the greatest increase in the value of the fault symptoms for one shorted turn occurred in the case of the FI d 3 R M S 2 ( i s B ) indicator.

6. Conclusions

In this paper, ITSC fault symptoms of stator windings in the stator phase current signal of a PMSM drive were discussed, and optimal fault indicators were searched for. The results of experimental tests for three methods of diagnosing this type of damage on the basis of stator current signal analysis were taken into account, using methods belonging to the frequency domain and time–frequency domain. The presented experimental research results confirm the effectiveness of the application of the spectral analysis of the stator phase current, the stator phase current envelope, and the discrete wavelet transform of the current envelope for the detection of ITSCs in the PMSM stator winding at an early stage of failure, even with one shorted turn in the phase, which constitutes 0.4% of all turns in a phase of the tested motor.
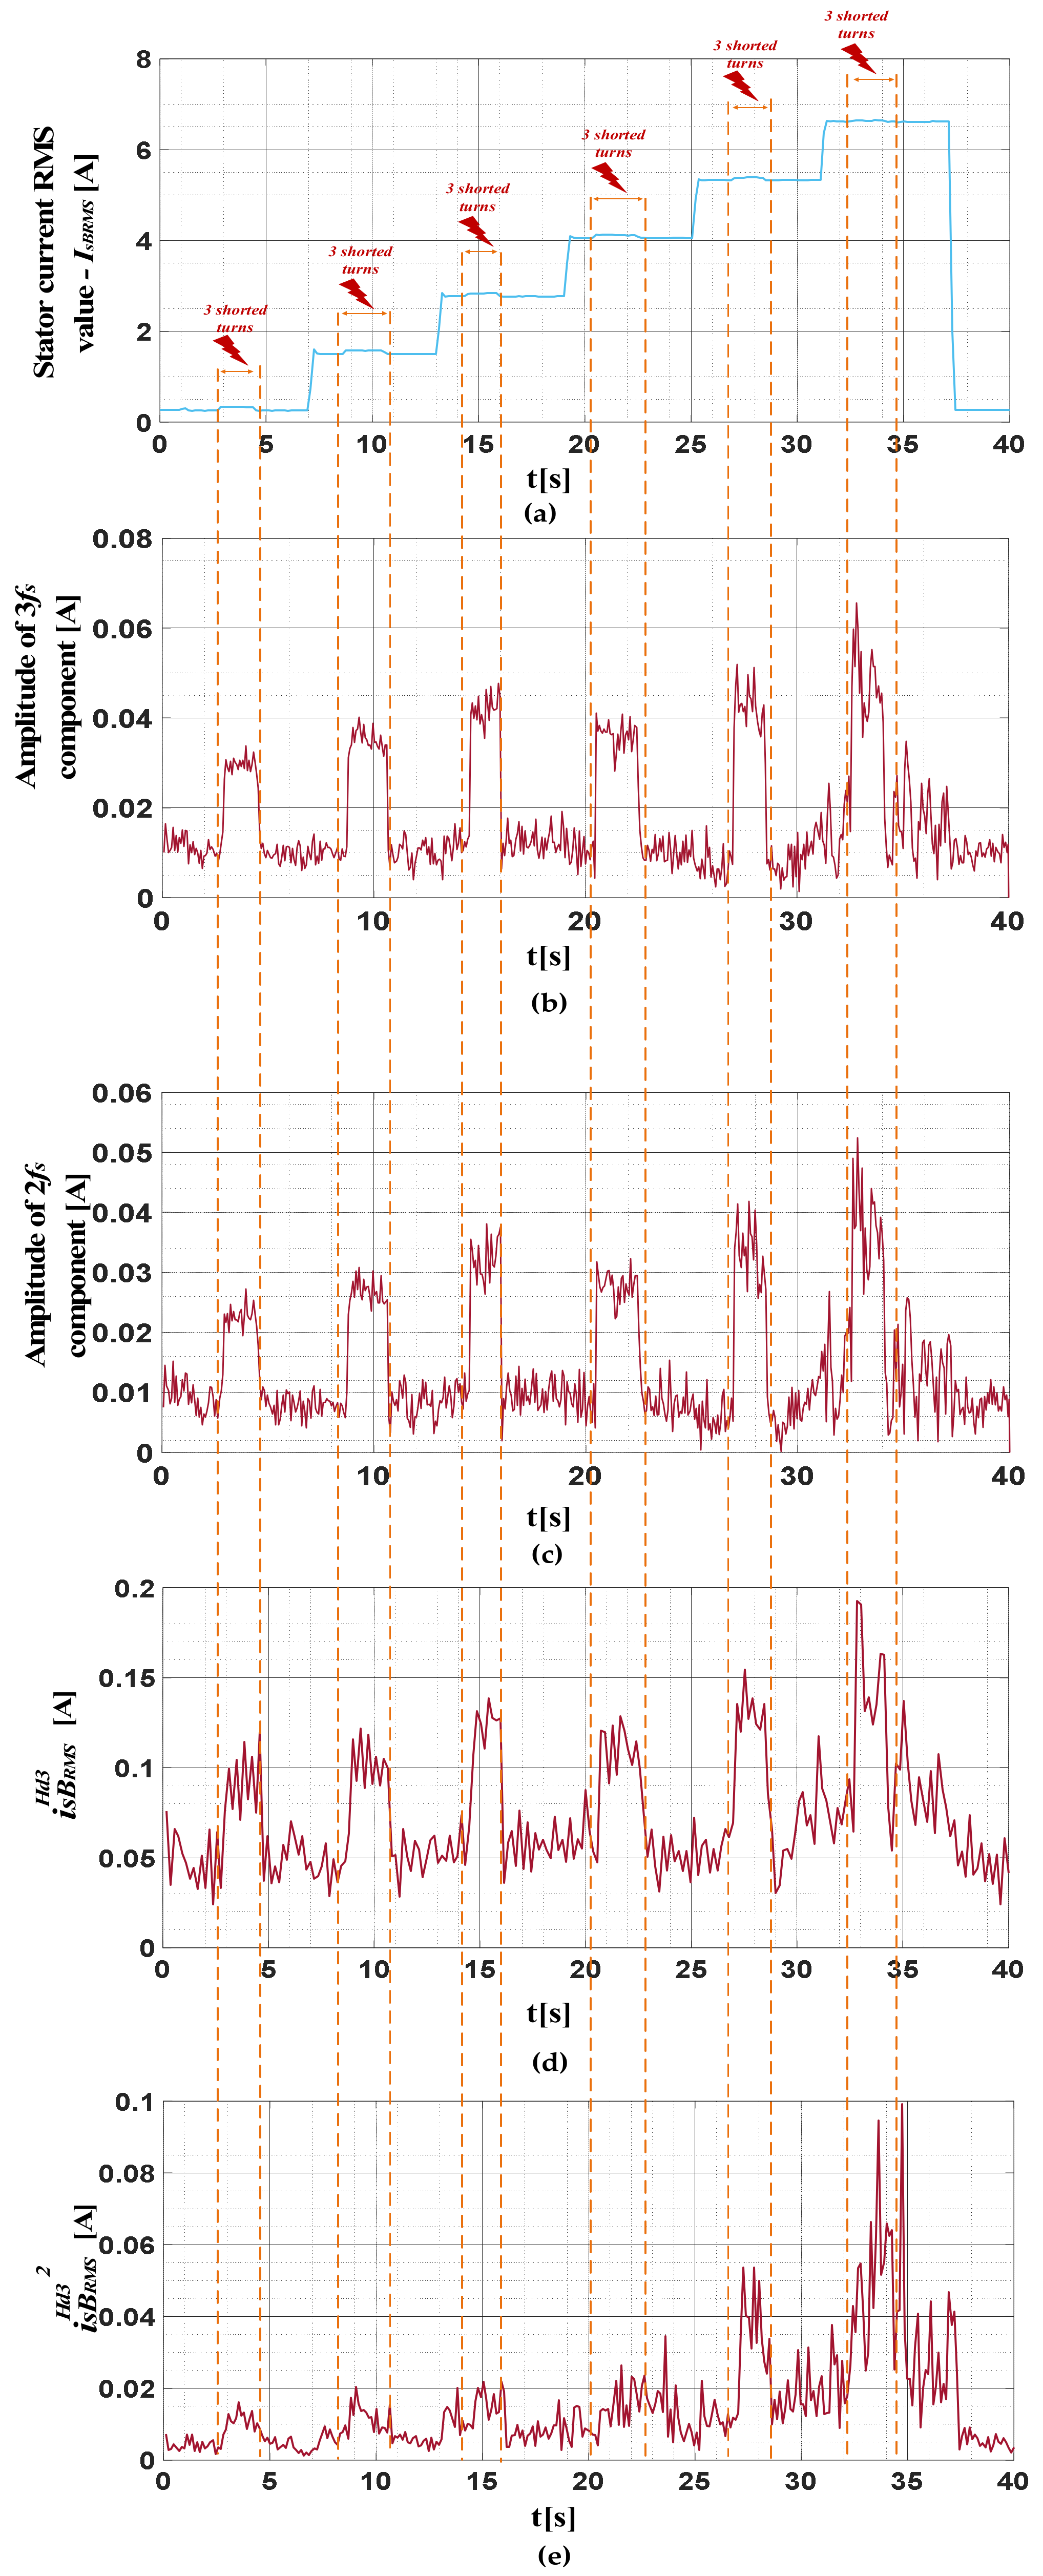
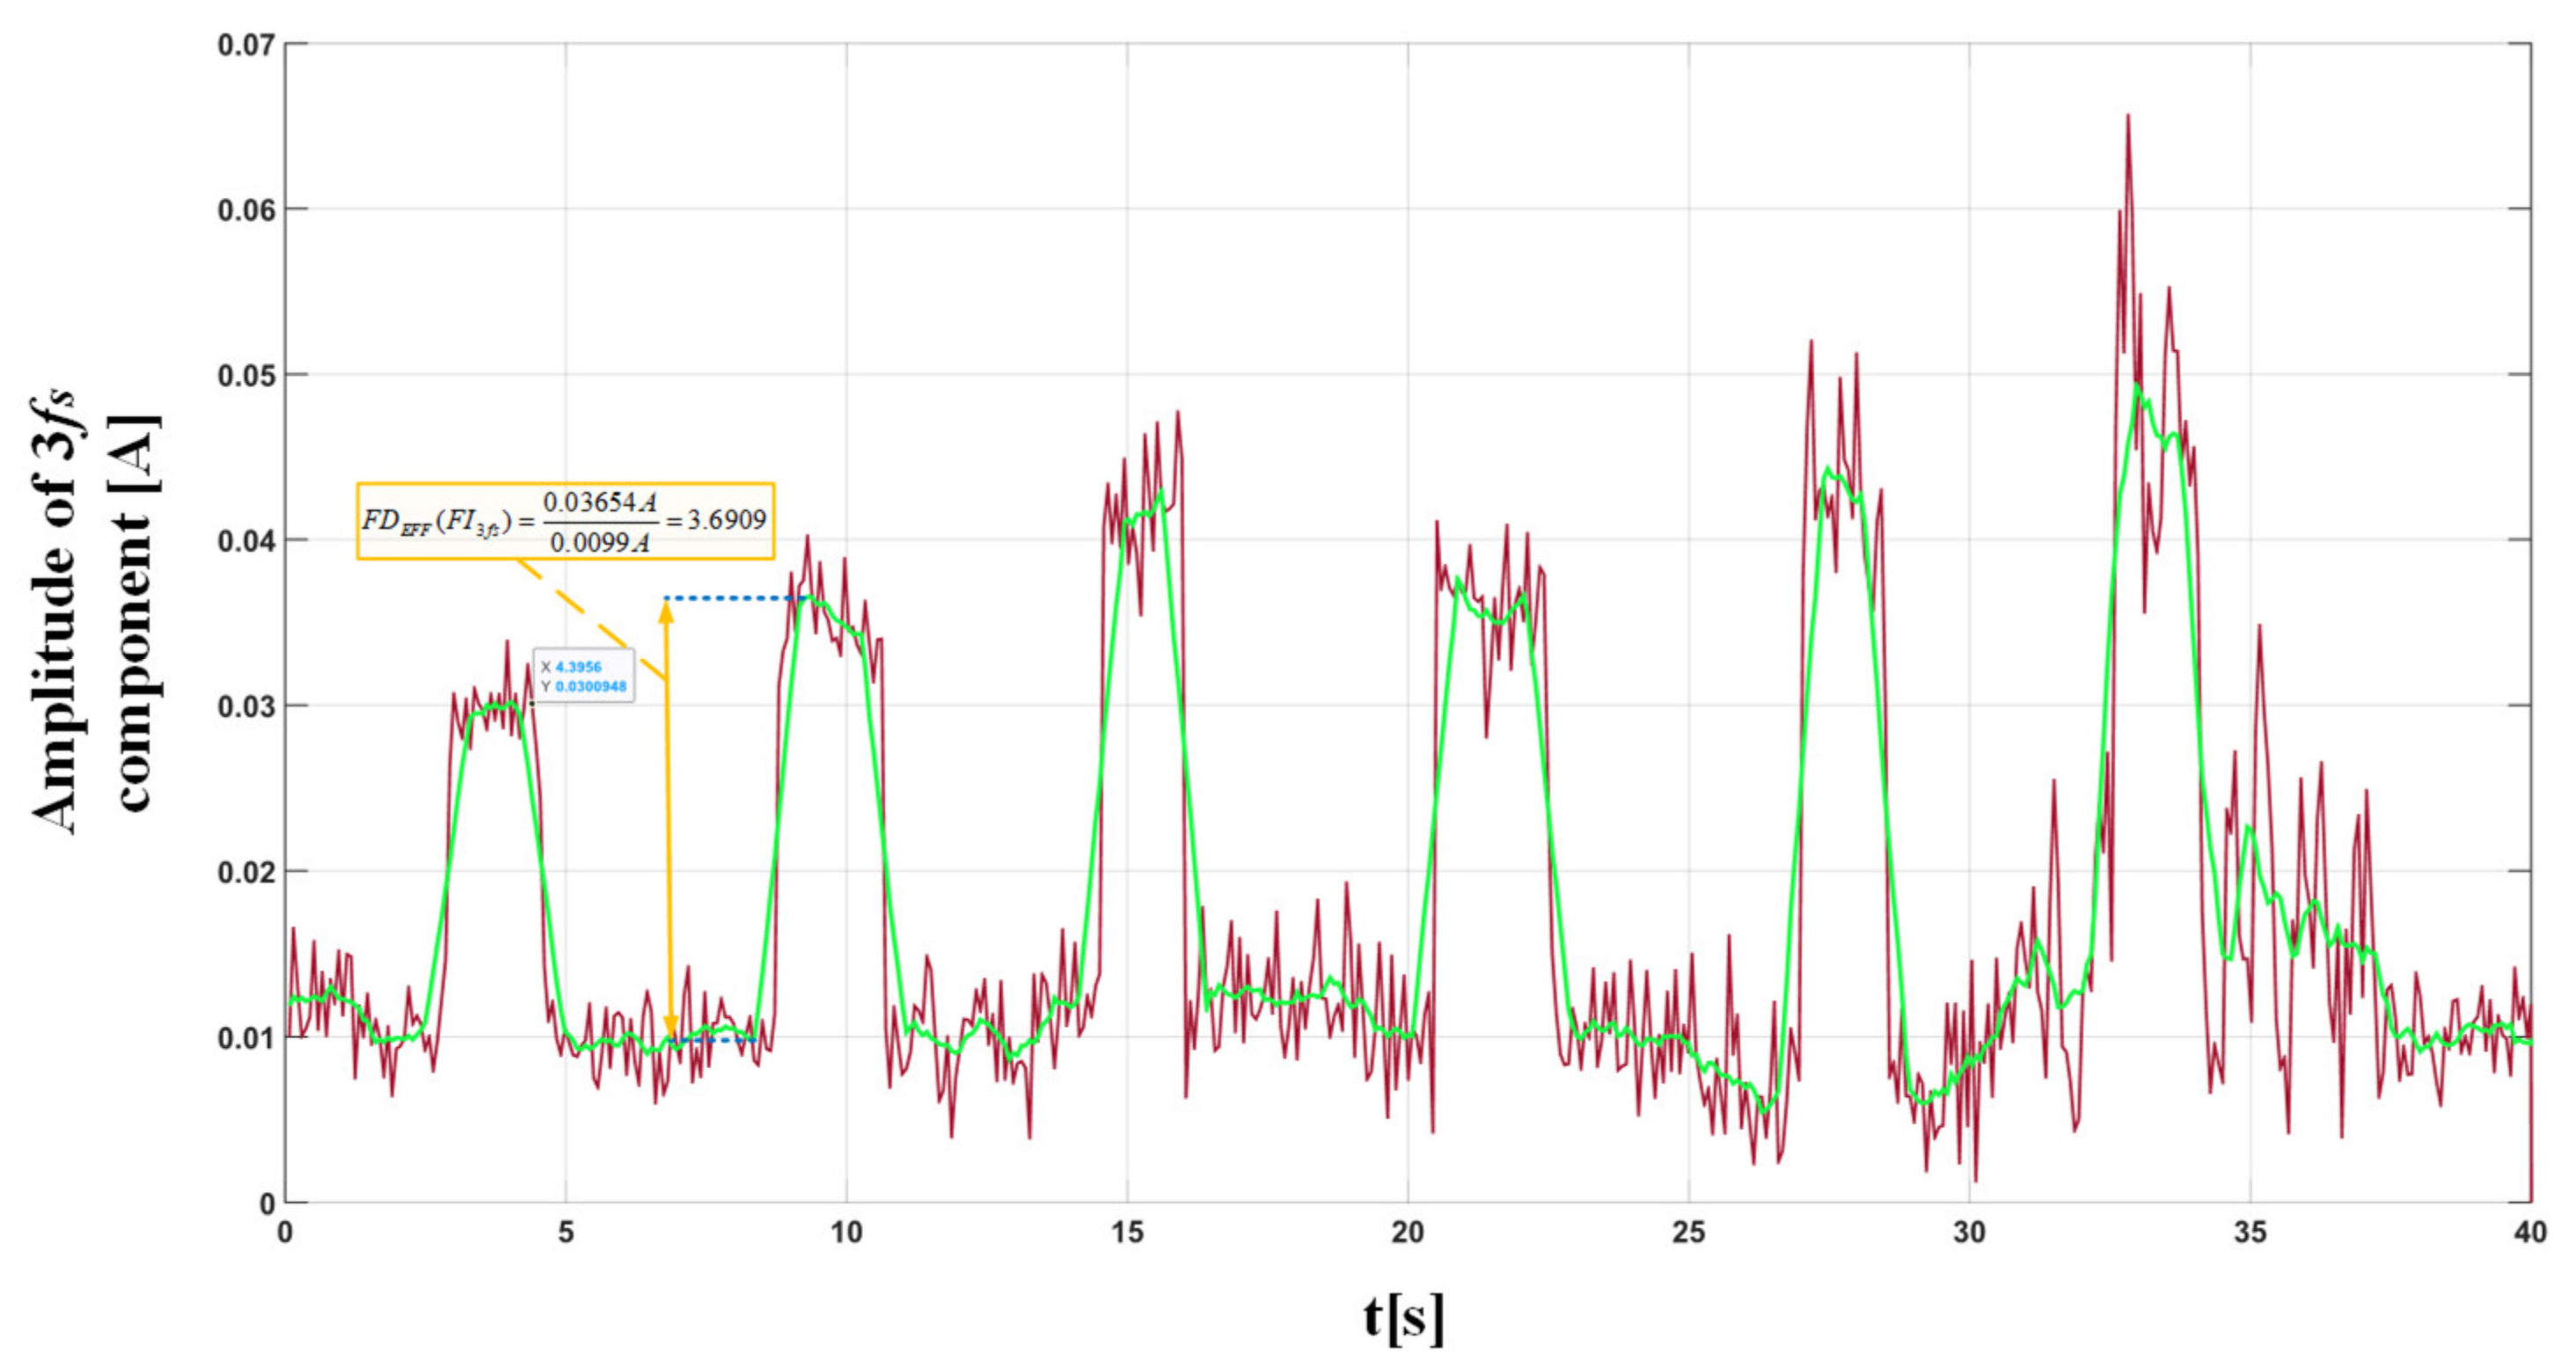
  • In the case of the FFT analysis of the stator phase current, the most significant symptom of damage is an increase in the amplitude of the third harmonic—the 3fs component. The increase in the amplitude of this component causes greater fluctuations in the amplitude of the stator phase current, changing the shape of the stator phase current envelope. The FFT analysis of the envelope showed an increase in the 2fs component in the spectrum after the failure occurred. Monitoring the value of this component allows the detection of any single ITSC. The third of the analyzed methods was the DWT of the phase current envelope. Upon failure, the RMS value of the detail, which includes the 2fs component, increases significantly. It was proven that monitoring the RMS values of the third and fourth details allows detecting stator winding faults in the entire tested range of rotor speeds (supply voltage frequency) and the load torque.
  • The original fault indicators (FIs) based on the observation of the aforementioned ITSC fault symptoms were described, which clearly show which symptom is most sensitive to the incipient fault of the stator winding of PMSM. After comparing the proposed FIs in online operation, it was also found that the FI3fs and FI2fs fault indicators, corresponding to 3fs and 2fs components in the stator phase current FFT and stator phase current envelope spectrum, are the most sensitive to stator winding fault. The least sensitive FI to the change of the motor load, with the simultaneous high sensitivity to damage, is the FId3RMS indicator corresponding to the RMS value of the third detail ( d 3 R M S ) of the DWT of the stator current envelope. The greatest increase in value with only one shorted turn occurred for the proposed damage indicator FI d 3 R M S 2 ( i s B ) corresponding to d 3 R M S 2 ( i s B H ) .
  • The confirmation of the effectiveness of the proposed ITSC fault indicators presented in the article and their detailed comparison may be the basis for the development of virtual diagnostic instruments. The discussed results can also be successfully used in the design of neural detectors and classifiers of damage to the stator windings of PMSM drives.

Author Contributions

Both authors contributed equally to the concept of the paper and proposed the methodology; investigation and formal analyses, P.P. and M.W.; software and data curation, P.P.; measurements, P.P. and M.W.; proposed the paper organization, M.W.; validated the obtained results, M.W. Both authors have read and agreed to the published version of the manuscript.

Funding

This research was supported by the National Science Center of Poland under grant number 2017/27/B/ST7/00816.

Institutional Review Board Statement

Not applicable.

Informed Consent Statement

Not applicable.

Data Availability Statement

Not applicable.

Conflicts of Interest

The authors declare no conflict of interest.

Appendix A

Table A1. Rated parameters of the tested permanent magnet synchronous motor.
Name of the ParameterSymbolValueUnits
PowerPN2500W
TorqueTN16Nm
SpeedNN1500r/min
Stator phase voltageUsN325V
Stator currentIsN6.6A
FrequencyfsN100Hz
Number of pole pairs pp2-
Number of stator turnsNs2 × 125-

References

  1. Slimen, S.D.; Bourogaoui, M.; Sethom, H.B.A. Easy and effective multiple faults detection and localization method for PMSM drives. In Proceedings of the 4th International Conference on Advanced Systems and Emergent Technologies (IC_ASET), Hammamet, Tunisia, 17–20 March 2019; pp. 311–316. [Google Scholar]
  2. Usman, A.; Doiphode, T.; Rajpurohit, B. Stator Winding Faults investigation in Permanent Magnet Synchronous Motor using Motor Signatures: Part I. In Proceedings of the EDPE, 19th International Conference on Electrical Drives & Power Electronics (EDPE), The High Tatras, Slovakia, 4–6 October 2019; pp. 160–168. [Google Scholar]
  3. Jiangbiao, H.; Somogyi, C.H.; Strandt, A.; Demerdash, N.A.O. Diagnosis of Stator Winding Short-Circuit Faults in an Interior Permanent Magnet Synchronous Machine. Department of Electrical and Computer Engineering. In Proceedings of the IEEE Energy Conversion Congress and Exposition (ECCE), Pittsburgh, PA, USA, 14–18 September 2014; pp. 3125–3130. [Google Scholar]
  4. Cira, F.; Arkan, M.; Gümüs, B. A New Approach to Detect Stator Fault in Permanent Magnet Synchronous Motor. In Proceedings of the IEEE International Symposium on Diagnostics for Electric Machines, Power Electronics and Drives (SDEMPED), Guarda, Portugal, 1–4 September 2015; pp. 316–321. [Google Scholar]
  5. Usman, A.; Joshi, B.M.; Rajpurohit, B.S. Review of fault modeling methods for permanent magnet synchronous motors and their comparison. In Proceedings of the IEEE International Symposium on Diagnostics for Electric Machines, Power Electronics and Drives (SDEMPED), Tinos, Greece, 29 August–1 September 2017; pp. 141–146. [Google Scholar]
  6. Skowron, M.; Orłowska-Kowalska, T.; Wolkiewicz, M.; Kowalski, C.T. Convolutional Neural Network-based Stator Current Data-Driven Incipient Stator Fault Diagnosis of Inverter-Fed Induction Motor. Energies 2020, 13, 1475. [Google Scholar] [CrossRef] [Green Version]
  7. Krichen, M.; Elbouchikhi, E.; Benhadj, N.; Chaieb, M.; Benbouzid, M.; Neji, R. Motor Current Signature Analysis-Based Permanent Magnet Synchronous Motor Demagnetization Characterization and Detection. Machines 2020, 8, 35. [Google Scholar] [CrossRef]
  8. Henao, H.; Capolino, G.A.; Fernandez-Cabanas, M.; Filippetti, F.; Bruzzese, C.; Strangas, E.; Pusca, R.; Estima, J.; Riera-Guasp, M.; Hedayati-kia, S. Trends in Fault Diagnosis for Electrical Machines. IEEE Ind. Electron. Mag. 2014, 8, 31–42. [Google Scholar] [CrossRef]
  9. Antonino-Daviu, J.A.; Gyftakis, K.N.; Garcia-Hernandez, R.; Razik, H.; Marques Cardoso, A.J. Comparative influence of adjacent and non-adjacent broken rotor bars on the induction motor diagnosis through MCSA and ZSC methods. In Proceedings of the 41st IEEE Industrial Electronics Society (IECON), Yokohama, Japan, 9–12 November 2015; pp. 1680–1685. [Google Scholar]
  10. Gyftakis, K.N.; Cardoso, A.J.M. Reliable Detection of Stator Interturn Faults of Very Low Severity Level in Induction Motors. IEEE Trans. Ind. Electron. 2021, 68, 3475–3484. [Google Scholar] [CrossRef]
  11. Zidani, F.; Benbouzid, M.E.H.; Diallo, D.; Nait-Said, M.S. Induction motor stator faults diagnosis by a current Concordia pattern-based fuzzy decision system. IEEE Trans. Energy Convers. 2003, 18, 469–475. [Google Scholar] [CrossRef] [Green Version]
  12. Tarchała, G.; Wolkiewicz, M. Performance of the stator winding fault diagnosis in sensorless induction motor drive. Energies 2019, 12, 1507. [Google Scholar] [CrossRef] [Green Version]
  13. Wolkiewicz, M.; Tarchała, G.; Orłowska-Kowalska, T.; Kowalski, C.T. Online Stator Interturn Short Circuits Monitoring in the DFOC Induction-Motor Drive. IEEE Trans. Ind. Electron. 2016, 63, 2517–2528. [Google Scholar] [CrossRef]
  14. Hang, J.; Ding, S.; Zhang, J.; Cheng, M.; Chen, W.; Wang, Q. Detection of Interturn Short-Circuit Fault for PMSM With Simple Fault Indication. IEEE Trans. Energy Convers. 2016, 31, 1679–1699. [Google Scholar] [CrossRef]
  15. Chen, Y.; Liang, S.; Li, W.; Liang, H.; Wang, C.H. Faults and Diagnosis Methods of Permanent Magnet Synchronous Motors: A Review. Appl. Sci. 2019, 9, 2116. [Google Scholar] [CrossRef] [Green Version]
  16. Urresty, J.; Riba, J.; Romeral, L.; Rosero, J.; Serna, J. Stator Short Circuits Detection in PMSM by means of Hilbert-Huang transform and Energy calculation. In Proceedings of the IEEE International Symposium on Diagnostics for Electric Machines, Cargese, France, 31 August–3 September 2009. [Google Scholar]
  17. Alvarez-Gonzalez, F.; Griffo, A.; Wang, B. Permanent magnet synchronous machine stator windings fault detection by Hilbert-Huang transform. In Proceedings of the International Conference on Power Electronics, Machines and Drives, Liverpool, UK, 17–19 April 2018; pp. 3505–3509. [Google Scholar]
  18. Guefack, F.L.T.; Kiselev, A.; Kuznietsov, A. Improved Detection of Inter-turn Short Circuit Faults in PMSM Drives using Principal Component Analysis. In Proceedings of the International Symposium on Power Electronics, Electrical Drives, Automation and Motion (SPEEDAM), Amalfi, Italy, 20–22 June 2018; pp. 154–159. [Google Scholar]
  19. Singh, A.K. Condition Monitoring and Fault Diagnosis Techniques of Electric Machines. In Proceedings of the International Conference on Recent Developments in Control, Automation & Power Engineering (RDCAPE), Noida, India, 10–11 October 2019; pp. 594–599. [Google Scholar]
  20. Benkedjouh, T.; Noureddine, Z.; Rechak, S. Deep Learning for Fault Diagnosis based on short-time Fourier transform. In Proceedings of the International Conference on Smart Communications in Network Technologies (SaCoNeT), El Qued, Algeria, 27–31 October 2018; pp. 288–293. [Google Scholar]
  21. Maqsood, A.; Oslebo, D.; Corzine, K.; Parsa, L.; Ma, Y. STFT Cluster Analysis for DC Pulsed Load Monitoring and Fault Detection on Naval Shipboard Power Systems. IEEE Trans. Transp. Electrif. 2020, 6, 821–831. [Google Scholar] [CrossRef]
  22. Park, C.H.; Lee, J.; Ahn, G.; Youn, M.; Youn, B.D. Fault Detection of PMSM under Non-Stationary Conditions Based on Wavelet Transformation Combined with Distance Approach. In Proceedings of the IEEE International Symposium on Diagnostics for Electric Machines, Power Electronics and Drives (SDEMPED), Toulouse, France, 27–30 August 2019; pp. 88–93. [Google Scholar]
  23. Ping, Z.A.; Juan, Y.; Ling, W. Fault Detection of Stator Winding Interturn Short Circuit in PMSM Based on Wavelet Packet Analysis. In Proceedings of the Fifth International Conference on Measuring Technology and Mechatronics Automation, Hong Kong, China, 16–17 January 2013; pp. 566–569. [Google Scholar]
  24. Hang, J.; Zhang, J.; Xia, M.; Ding, S.H.; Hua, W. Interturn Fault Diagnosis for Model-Predictive-Controlled-PMSM Based on Cost Function and Wavelet Transform. IEEE Trans. Power Electron. 2020, 35, 6405–6418. [Google Scholar] [CrossRef]
  25. Obeid, N.H.; Boileu, T.; Nahid-Mobakarakch, B. Identification and localization of incipient intermittent inter-turn fault in the stator of a three phase permanent magnet synchronous motor. In Proceedings of the IEEE International Symposium on Diagnostics for Electric Machines, Power Electronics and Drives (SDEMPED), Tinos, Greece, 29 August–1 September 2017; pp. 173–180. [Google Scholar]
  26. Heydarzadeh, H.; Zafarani, M.; Akin, B.; Nourani, M. Automatic fault diagnosis in PMSM using adaptive filtering and wavelet transform. In Proceedings of the IEEE International Electric Machines & Drives (IEMDC), Miami, FL, USA, 21–24 May 2017. [Google Scholar]
  27. Rosero, J.; Romeral, L.; Ortega, J.A.; Rosero, E. Short-Circuit Detection by Means of Empirical Mode Decomposition and Wigner-Ville Distribution for PMSM Running Under Dynamic Condition. IEEE Trans. Ind. Electron. 2009, 56, 4534–4547. [Google Scholar] [CrossRef]
  28. Huang, S.; Aggarwal, A.; Strangas, E.; Li, K.; Niu, F.; Huang, X. Robust Stator Winding Faults Detection in PMSMs with Respect to Current Controller Bandwith. IEEE Trans. Power Electron. 2020, 10, 1109. [Google Scholar]
  29. Liang, Y. Diagnosis of inter-turn short-circuit stator Winding fault in PMSM based on stator current and noise. In Proceedings of the IEEE International Conference on Industrial Technology, Busan, Korea, 26 February–1 March 2014; pp. 138–142. [Google Scholar]
  30. Kyeong-Hwa, K. Simple Online Fault Detecting Scheme for Short-Circuited Turn in a PMSM Through Current Harmonic Monitoring. IEEE Trans. Ind. Electron. 2011, 58, 2565–2568. [Google Scholar]
  31. Li, Y.; Liang, Y. The Correlaction Analysis of PM Inter-turn Fault based on Stator Current and Vibration Signal. In Proceedings of the IEEE International Conference on Mechatronics and Automation, Beijing, China, 2–5 August 2015; pp. 1733–1737. [Google Scholar]
  32. Hang, J.; Zhang, J.; Cheng, M. Detection and Discrimination of Open Phase Fault in Permanent Magnet Synchronous Motor Drive System. IEEE Trans. Power Electron. 2016, 31, 4697–4709. [Google Scholar] [CrossRef]
  33. Faiz, J.; Exiri, S.A.H. Short-circuit fault diagnosis in permanent magnet synchronous motors—An overview. In Proceedings of the Intl Aegean Conference on Electrical Machines & Power Electronics (ACEMP), Side, Turkey, 2–4 September 2015; pp. 18–26. [Google Scholar]
  34. Mercorelli, P. Parameters identification in a permanent magnet three-phase synchronous motor of a city-bus for an intelligent drive assistant. Int. J. Model. Identif. Control 2014, 21, 352–361. [Google Scholar] [CrossRef]
  35. Bednarz, S.A.; Dybkowski, M.; Wolkiewicz, M. Identification of the stator faults in the induction motor drives using parameter estimator. In Proceedings of the 18th IEEE International Power Electronics and Motion Control Conference (PEMC), Budapest, Hungary, 26–30 August 2018; pp. 688–693. [Google Scholar]
  36. Refaat, S.S.; Abu-Rub, H.; Saad, M.S.; Aboul-Zahab, E.M.; Iqbal, A. Discrimination of stator winding turn fault and unbalanced supply voltage in permanent magnet synchronous motor using ANN. In Proceedings of the 4th International Conference on Power Engineering, Energy and Electrical Drives, Istanbul, Turkey, 13–17 May 2013; pp. 858–863. [Google Scholar]
  37. Haddad, R.Z.; Strangas, E.G. Fault detection and classification in permanent magnet synchronous machines using Fast Fourier Transform and Linear Discriminant Analysis. In Proceedings of the 9th IEEE International Symposium on Diagnostics for Electric Machines, Power Electronics and Drives (SDEMPED), Valencia, Spain, 27–30 August 2013; pp. 99–104. [Google Scholar]
  38. Zhaoxia, X.; Hongwei, F. Stator Winding Inter-Turn Short Circuit and Rotor Eccentricity Diagnosis of Permanent Magnet Synchronous Generator. In Proceedings of the Control, Automation and Systems Engineering (CASE), Singapore, 30–31 July 2011; pp. 1–4. [Google Scholar]
  39. Rosero, J.A.; Romeral, L.; Cusido, J.; Garcia, A.; Ortega, J.A. On the short-circuiting Fault Detection in a PMSM by means of Stator Current Transformations. In Proceedings of the IEEE Power Electronics Specialists Conference, Orlando, FL, USA, 17–21 June 2007; pp. 1936–1941. [Google Scholar]
  40. Bouchareb, C.; Nait Said, M.S. PMSM Model with Phase-to-Phase Short-Circuit and Diagnosis by ESA and EPVA. Power Eng. Electr. Eng. 2016, 14, 522–530. [Google Scholar] [CrossRef]
  41. Zhang, J.; Tounzi, A.; Benabou, A.; Le Manach, Y. Detection of magnetization loss in a PMSM with Hilbert Huang transform applied to non-invasive search coil voltage. Math. Comput. Simul. 2021, 184, 184–195. [Google Scholar] [CrossRef]
  42. Rosero, J.; Cusido, J.; Espinosa, A.G.; Ortega, J.A.; Romeral, L. Broken Bearings Fault Detection for a Permanent Magnet Synchronous Motor under non-constant working conditions by means of a Joint Time Frequency Analysis. In Proceedings of the IEEE International Symposium on Industrial Electronics, Vigo, Spain, 4–7 June 2007; pp. 3415–3419. [Google Scholar]
  43. Yang, J.; Ye, H.; Zhou, W. A Review of Permanent Magnet Synchronous Motor Fault Diagnosis. In Proceedings of the IEEE Conference and Expo Transportation Electrification, Asia-Pacific, Beijing, China, 31 August–3 September 2014; pp. 1–5. [Google Scholar]
  44. Obeid, N.H.; Battiston, A.; Boileau, T.; Mobarakeh-Nahid, B. Early Intermittent Interturn Fault Detection and Localization for a Permanent Magnet Synchronous Motor of Electrical Vehicles Using Wavelet Transform. IEEE Trans. Transp. Electrif. 2017, 3, 694–702. [Google Scholar] [CrossRef]
  45. Olkkonen, J.T. Discrete Wavelet Transforms–Theory and Applications; InTech: Rijeka, Croatia, 2011. [Google Scholar]
  46. Sifuzzaman, M.; Islam, M.; Ali, M. Application of wavelet transform and its advantages compared to Fourier transform. J. Phys. Sci. 2009, 13, 121–134. [Google Scholar]
  47. Cira, F.; Arkan, M.; Gümüs, B.; Goktas, T. Analysis of Stator Inter-turn Short-circuit Fault Signatures for Inverter-fed Permanent Magnet Synchronous Motors. In Proceedings of the IEEE Industrial Electronics Society (IECON), Florence, Italy, 24–27 October 2016; pp. 1453–1457. [Google Scholar]
  48. Mercorelli, P.; Kubasiak, N.; Liu, S. Multilevel bridge governor by using model predictive control in wavelet packets for tracking trajectories. In Proceedings of the IEEE International Conference on Robotics and Automation, New Orleans, LA, USA, 26 April–1 May 2004; pp. 4079–4084. [Google Scholar]
  49. Dautov, Ç.P.; Özerdem, M.S. Wavelet transform and signal denoising using Wavelet method. In Proceedings of the 26th Signal Processing and Communications Applications Conference (SIU), Izmir, Turkey, 2–5 May 2018; pp. 1–4. [Google Scholar]
  50. Cusidó Roura, J.; Martínez, J.L.R. Transient Analysis and Motor Fault Detection using the Wavelet Transform. In Discrete Wavelet Transforms-Theory and Applications; Juuso, T., Ed.; InTech: Rijeka, Croatia, 2011; pp. 43–60. [Google Scholar]
Figure 1. Fault percentages of various components in (a) low-voltage and (b) high-voltage electric machines.
Energies 14 01630 g001
Figure 2. Typical stages of diagnostic information processing in a permanent magnet synchronous motor (PMSM) drive using the stator current signal.
Energies 14 01630 g002
Figure 3. Comparison of fast Fourier transform (FFT) spectra for the PMSM stator phase current using a Universal Serial Bus (USB) card (NI-USB-6212 data acquisition (DAQ) card) with 16 bit resolution and 24 bit resolution card (DAQ NI PXI-4492) for data acquisition.
Energies 14 01630 g003
Figure 4. Wavelet decomposition tree for second-level multiresolution signal analysis.
Energies 14 01630 g004
Figure 5. (a) Experimental stand; (b) diagram of the derived phase terminals of the stator winding, phase B; (c) industrial PC (NI PXIe-1082) and developed virtual diagnostic tool.
Energies 14 01630 g005
Figure 6. General scheme of experimental setup.
Energies 14 01630 g006
Figure 7. The impact of shorted turn number in the PMSM stator winding on the FFT spectrum of the stator current in phase B: fs = 100 Hz, TL = 0 (a), TL = TN (b).
Energies 14 01630 g007
Figure 8. The impact of shorted turns number in the PMSM stator winding on the level of the amplitude of 3fs frequency component in the stator current spectrum for variable load torque TL (a) and variable supply frequency fs (b).
Energies 14 01630 g008
Figure 9. The stator current waveform of phase B and the current envelope for the PMSM operating at fs = 100 Hz for the undamaged winding (a) and that with a stator winding fault (b) (Nsh = 3).
Energies 14 01630 g009
Figure 10. The impact of shorted turn number in the PMSM stator winding on the FFT spectrum of the stator current envelope in phase B: fs = 100 Hz, TL = 0 (a), TL = TN (b).
Energies 14 01630 g010
Figure 11. The impact of shorted turn number in the PMSM stator winding on the level of the amplitude of 2fs frequency component in the stator current envelope spectrum for variable load torque TL (a) and variable supply frequency fs (b).
Energies 14 01630 g011
Figure 12. Frequency ranges corresponding to the fifth level decomposition of the oversampled signal of the stator phase current envelope.
Energies 14 01630 g012
Figure 13. Time waveforms of approximations and details of discrete wavelet transform (DWT) of the stator phase current envelope for an undamaged motor and with three shorted turns in the stator winding, operating at fs = 100 Hz: without load torque (a); with rated load (b).
Energies 14 01630 g013
Figure 14. The impact of shorted turn number in the stator winding of PMSM and load torque on the root mean square (RMS) value of the third detail of DWT of the stator current envelope.
Energies 14 01630 g014
Figure 15. Percentage increase in the RMS value of individual details and approximations of the DWT of the stator phase current envelope with different degrees of stator winding fault: fs = 100 Hz, for unloaded drive (a) and with rated load (b).
Energies 14 01630 g015
Figure 16. The impact of the shorted turn number in the stator winding and the load torque on the RMS value of the third detail of DWT of the current envelope (a) and the percentage increase in the RMS value according to the individual details and the approximations of the stator phase current envelope with different degrees of stator winding fault in relation to the undamaged motor for the motor operating at fs = 60 Hz and rated load (b).
Energies 14 01630 g016
Figure 17. Waveforms of the square of the third detail of DWT of the stator phase current envelope for an undamaged PMSM and a motor with three shorted turns in the stator winding, operating at fs = 100 Hz (a), and influence of the load torque and the number of shorted turns on the RMS value of this failure index (b).
Energies 14 01630 g017
Figure 18. Waveforms of the proposed fault indicators during cyclic instantaneous short-circuiting of an increasing number of winding turns at variable load torque and rated motor speed (fs = 100 Hz): the RMS value of the stator phase current (a); the amplitude values of the third harmonic of the stator phase current (b); the 2fs component in the spectrum of the stator phase current envelope (c); RMS values of the third detail of DWT of the stator phase current envelope (d); squared RMS values of the third detail of DWT of the stator phase current envelope (e).
Energies 14 01630 g018
Figure 19. Waveforms of the proposed fault indicators during cyclic instantaneous short-circuiting of an increasing number of winding turns from 1–4 at rated speed (fs = 100 Hz) and TL = 0.8 TN: 3fs amplitude values of the stator phase current (a); 2fs component in the spectrum of the stator phase current envelope (b); RMS values of the third detail of DWT of the stator phase current envelope (c); squared RMS values of the third detail of DWT of the stator phase current envelope (d).
Energies 14 01630 g019
Figure 20. Filtering process based on the centered moving average with an 11-element window.
Energies 14 01630 g020
Figure 21. The original and averaged waveform of the 3fs frequency component amplitude value in the stator phase current spectrum, at variable load torque, rated speed (fs = 100 Hz), and cyclic instantaneous short-circuiting of three turns in phase B of the stator winding.
Energies 14 01630 g021
Table 1. Frequency bands obtained after decomposition of the current envelope signal to fifth level.
Name of the ParameterFrequency Band
Detal level 1—d1512 Hz–1024 Hz
Detal level 2—d2256 Hz–512 Hz
Detal level 3—d3128 Hz–256 Hz
Detal level 4—d464 Hz–128 Hz
Detal level 5—d532 Hz–64 Hz
Approximation level 5—a50 Hz–32 Hz
Table 2. Values of the fault detection efficiency of selected fault indicators for various load torques (Nsh = 3).
Stator Winding Fault Indicator (FI)Fault Detection Efficiency Indicator—FDEFFFDEFF-AVG
T = 0T = 0.2TNT = 0.4TNT = 0.6TNT = 0.8TNT = TN
FI 3 f s ( i s B ) 3.06383.69093.59353.74294.55714.00083.7748
FI 2 f s ( i s B ) 2.81703.59523.25663.48604.80473.68863.6080
FI d 3 R M S ( i s B ) 2.19312.38862.14541.88302.37751.8972.1471
FI d 3 R M S 2 ( i s B ) 3.07433.89964.00822.10613.38002.93503.2339
Table 3. Standard deviation values of the FDEFF indicators for the entire tested load torque range and the ratio of its values for motor operation at rated load and without load (Nsh = 3).
Stator Winding Fault Indicator (FI)S F D E F F ( T = T N ) F D E F F ( T = 0 )
FI 3 f s ( i s B ) 0.49181.6334
FI 2 f s ( i s B ) 0.66371.655
FI d 3 R M S ( i s B ) 0.22171.549
FI d 3 R M S 2 ( i s B ) 0.70014.951
Table 4. Values of the fault detection efficiency of selected fault indicators for various degrees of damage to the stator winding.
Stator Winding Fault Indicator (FI)Fault Detection Efficiency Index—FDEFF-Nsh
Nsh = 1Nsh = 2Nsh = 3Nsh = 4
FI 3 f s ( i s B ) 2.21963.69097.41979.1990
FI 2 f s ( i s B ) 2.12582.87675.8859.0113
FI d 3 R M S ( i s B ) 1.32461.77582.7253.2391
FI d 3 R M S 2 ( i s B ) 2.87473.2933.50063.5251
Publisher’s Note: MDPI stays neutral with regard to jurisdictional claims in published maps and institutional affiliations.

