Article

Analysis of the Practical Implementation of Flicker Measurement Coprocessor for AMI Meters †

Faculty of Electrical Engineering, Automatics, Computer Science and Biomedical Engineering, AGH–University of Science and Technology, 30-059 Krakow, Poland
*
Author to whom correspondence should be addressed.
This paper is an extended version of our paper published in the 2020 12th International Conference and Exhibition on Electrical Power Quality and Utilisation—EPQU, Krakow, Poland, 14–15 September 2020.
Energies 2021, 14(6), 1589; https://doi.org/10.3390/en14061589
Submission received: 18 January 2021 / Revised: 1 March 2021 / Accepted: 6 March 2021 / Published: 12 March 2021

Abstract

:
Monitoring power quality (PQ) indicators is an important part of modern power grids’ maintenance. Among different PQ indicators, flicker severity coefficients Pst and Plt are measures of voltage fluctuations. In state-of-the-art PQ measuring devices, the flicker measurement channel is usually implemented as a dedicated processor subsystem. Implementation of the IEC 61000-4-15 compliant flicker measurement algorithm requires a significant amount of computational power. In typical PQ analysers, the flicker measurement is usually implemented as a part of the meter’s algorithm performed by the main processor. This paper considers the implementation of the flicker measurement as an FPGA module to offload the processor subsystem or operate as an IP core in FPGA-based system-on-chip units. The measurement algorithm is developed and validated as a Simulink diagram, which is then converted to a fixed-point representation. Parts of the diagram are applied for automatic VHDL code generation, and the classifier block is implemented as a local soft-processor system. A simple eight-bit processor operates within the flicker measurement coprocessor and performs statistical operations. Finally, an IP module is created that can be considered as a flicker coprocessor module. When using the coprocessor, the main processor’s only role is to trigger the coprocessor and read the results, while the coprocessor independently calculates the flicker coefficients.

1. Introduction

Power quality (PQ) monitoring and evaluation are important topics in modern power systems [1,2]. Works related to measurements and long-term recording of the PQ indicators have become almost a daily practice of distribution and transmission system operators (DSOs, TSOs). They are mainly related to the complaints reported by electric energy consumers but, more and more often, they result from the desire to gain knowledge about the levels of PQ indicators in the power system. This data is a valuable source of information on the technical condition of a particular part of the network, and it can be used to take preventive, modernisation and investment actions. Apart from portable analysers used for ad hoc measurement works, operators are also equipped with continuous monitoring systems based on stationary units. Such analysers are usually placed in key points of the power system.
The ability to measure supply voltage parameters, load emissions, and the location of disturbance sources in a large number of nodes is crucial for the grid’s correct and reliable operation. Currently, PQ analysers are complex digital meters, which can process at least eight signal channels simultaneously in real-time. The measurement of PQ indicators is standardised by the IEC 61000-4-30 [3], which also provides technical guidelines for implementation of the metering algorithms. In consequence, a PQ class A analyser is quite an expensive device, which makes PQ metering in a wide area economically inefficient. Relatively high PQ metering costs prevent their application in household’s energy meters, which in turn makes it difficult to monitor PQ in end users’ nodes. However, in the era of smart grids, there is a need to implement a light flicker measurement device–a flickermeter, for example, Advanced Metering Infrastructure (AMI) meters, whose prices are usually down-regulated to be acceptable for municipal users. Among the different PQ coefficients, the flicker severity is the most complex to implement and greatly determines an AMI meter’s final cost.
The flickering phenomena, manifested mostly in the changes in electric lighting intensity, is an important parameter for the life comfort of people in the lighted rooms [4,5,6]. The flicker measurement can be done by measuring the flux of light, but the only standardised method is to measure the voltage variations and, on this basis, to determine the flicker metrics [7,8]. It should be noted that the UIE/IEC flickermeter [9] simulates the lamp-eye-brain response to the voltage fluctuations in the weighting filter, which parameters have been chosen based on measurements carried out for a coiled filament gas-filled 60 W incandescent lamp [10]. Since different lamp types have different flicker responses [11], there is a potential need for new flickermeters to cope with new lighting technologies [12,13]. Flicker coefficients are also the commonly accepted and standardised way of metering voltage fluctuations on each voltage level. Therefore, the coefficients are widely used by grid operators and define the permissible level of voltage fluctuations in standards, e.g., EN 50160 [14] and grid codes.
In this paper, the implementation of a flickermeter in an FPGA fabric is presented. The objective is to show an implementation method of flicker severity measurement according to the IEC 61000-4-15 [9] standard in a relatively small and cheap integrated circuit. This technique enables a digital meter to be extended to carry the functionality of a flickermeter by adding a hardware coprocessor or an existing flickermeter to be implemented as an IP (intellectual property) core in the FPGA (see Figure 1).
The main idea is to move flicker severity computation to the FPGA fabric, thereby ensuring simple access to the flicker parameters and offloading the main microprocessor.

2. Algorithm of Flickermeter and Implementation Issues

Several attempts have been made to implement a flicker severity measurement algorithm. In [15] the author discusses the realisation of a flickermeter in the time domain in a Matlab/Simulink environment. The model of the analogue UIE/IEC flickermeter in Matlab/Simulink is presented there. In [16] the authors present a discrete model of the IEC 61000-4-15 flickermeter developed for use with the Matlab/Simulink simulation software package. The model duplicates the functional blocks described in the standard and operates in the same way as the standardised instrument to ensure complete consistency of results. Some implementation issues and flicker calculation algorithms are presented in [17,18,19,20,21,22,23,24,25]. Various hardware platforms have been applied for implementing and testing the flickermeter: LabView [5], low-cost embedded systems [26] and digital signal processors [27].
Moreover, some flicker measurement methods that do not follow the IEC recommendations have been investigated. Examples here include the applications of wavelets [28,29,30], artificial neural networks [31], the Walsh–Hadamard transform [32], the Hilbert transform [33], the fast S-transform [34] and the FFT-based method [35]. Algorithms reducing a large amount of evaluation data during measurement by compressing redundant data were also implemented [36].
The international standard IEC 61000-4-15 describes in detail the functional specification and design of a flickermeter. It also specifies that new flickermeter designs should correspond to the flickermeter of class F1. The flickermeter is divided into several functional blocks, as shown in Figure 2.
The standard also describes tests that have to be carried out to check the flickermeter’s compliance. For a PQ meter to qualify as compliant with IEC 61000-4-30, the flicker measurement has to pass the tests given in the IEC 61000-4-15 standard.
Since the standard describes the flickermeter as an analogue device, numerous attempts have been made to digitalise the flickermeter blocks. The main challenge is to obtain discrete transfer functions for filters in blocks 3 and 4. Its implementation in an FPGA raises some additional issues mostly connected to fixed-point operations and sampling frequency reduction. The considered blocks are (see Figure 2):
  • Input gain control block—the block operates as a signal conditioning unit and provides scaling to the reference value. The reference is the half-period RMS value processed by the 1st order digital filter with a 27.3 s time constant. In the digital implementation, this block provides only scaling, which can be performed by automatic gain control (AGC).
  • Square multiplier block—this block, together with the high pass filter in the next block, operate as a demodulator. The FPGA implementation requires the implementation of the integer multiplier.
  • High pass and weighting filters—this block consist of three filters. The first is a high pass filter, which eliminates the DC component of the voltage. The standard suggests that the filter should be of first-order with −3 dB attenuation at 0.05 Hz cut-off frequency. The second filter is a low pass one, and the standard requires a 6th-order Butterworth filter with an attenuation of −3 dB at 35 Hz (for 230 V system). The last filter is a so-called weighting filter. It simulates the spectral nature of the human visual system. The filter is defined by the transfer function:
    G s = k ω 1 s s 2 + 2 λ s + ω 1 2 1 + s / ω 2 1 + s / ω 3 1 + s / ω 4
    where the parameters k, λ, ωi (i = 1…4) are given in the standard and vary for 230 V and 110 V systems. Digital implementation of the filters requires the utilisation of filter design tools in order to evaluate fixed-point parameters. It is possible to use a standard FPGA implementation of IIR filters.
  • Squaring and smoothing—this block performs two functions: it simulates the eye-brain visual channel through a squaring operation and emulates the brain’s memory effect. Such functions can be achieved through the sliding mean operator; however, the standard suggests utilising a 1st-order filter with 300 ms time constant. The output of this block is an instantaneous flicker Pinst. FPGA implementation requires the utilisation of fixed-point squaring and filtering as described above.
  • Statistical analysis—it is the only block that utilises typical digital data processing to obtain short-term Pst and long-term Plt flicker coefficients. The computation is based on the percentile evaluation according to the formula:
    P A = 0.314 P 0.1 + 0.0525 P 1 s + 0.0657 P 3 s + 0.28 P 10 s + 0.08 P 50 s P s t = P A
    where:
    P 50 s = P 30 + P 50 + P 80 / 3 P 10 s = P 6 + P 8 + P 10 + P 13 + P 17 / 5 P 5 s = P 2.2 + P 3 + P 4 / 3 P 1 s = P 0.7 + P 1 + P 1.5 / 3
    and Px is the x-th percentile of the Pinst values logged during a specified time interval, where x is 0.1, 0.7, 1, 1.5, 2.2, 3, 4, 6, 8, 10, 13, 17, 30, 50, and 80, respectively. The interval can vary from 1 to 15 min; however, the IEC 61000-4-30 standard assumes 10 min for a typical flicker severity evaluation. The evaluation of Plt is performed using 12 samples of Pst. Hence the long-term flicker describes the flicker severity for the last two hours according to the formula:
    P l t = 1 N i = 1 N P s t , i 3
    where Plt is the long-term flicker coefficient, Pst,i is the i-th consecutive value of the short-term coefficient, N = 12 is the number of Pst levels taken to compute the Plt coefficient. Due to the sequential nature of the computation, this block is the most difficult to implement in an FPGA.
A typical method of implementing block 5 is to utilise a memory buffer to save all Pinst samples during the interval. Next, the buffer is sorted, and the percentile values are obtained as values of known memory cells in the buffer. Since the implementation of sorting in an FPGA is quite complex, a local soft-processor core is utilised to perform this task. Despite many values to sort, there is usually enough time to run at least a simple sorting algorithm. The details of this operation are described in Section 3. As a result, the percentile values are obtained, meaning the Pst coefficient can be computed according to Equation (2). The computation can be performed by the local processor core, implemented in the FPGA or calculated by the main processor.

3. Rapid Implementation and Hardware Platform

The rapid development approach focuses on model-based design (MBD), where most of the development effort is concentrated in a simulation of the algorithm, while the major parts of the implementation are done automatically. The MBD approach allows focusing on the problem simultaneously, skipping the details of its implementation [25]. The algorithm is tested at the very first design stage, reducing the number of implementation errors. It is also crucial that there are no references to the hardware on which the algorithm is intended to run so far.
The flicker measurement algorithm was developed as Simulink diagram and tuned in Simulink simulator till full compliance with the IEC 61000-4-15 specification. Next, the algorithm can be processed dually, depending on the target hardware platform:
  • To generate C-code finally executed in real-time by a microprocessor, or
  • To generate HDL code applied for building an IP module dedicated to an FPGA.
Figure 3 shows two possible paths for the implementation of rapid prototyping. The first option is the more common one. The generated code is functionally equivalent to the Simulink diagram. The simulation model must be extended by feeding the flickermeter algorithm with real signals and storing the results. These operations are implemented as S-function device driver blocks. The S-function blocks are C-code procedures, which connect the algorithm to real signals: measurements from A/D converters and the memory to store the results. A real-time kernel is used to meet the real-time execution requirements. It was FreeRTOS in our case. The real-time kernel triggers the generated code’s execution at given sampling rates (see Figure 4).
The generated code was executed on ARM Cortex A9 processor running with the 666.66 MHz clock signal. The major part of the algorithm runs at 10.24 kHz sampling rate, which gives 98 microseconds sampling period. Most of the time, the processing of a single sample takes 33 microseconds. However, occasionally the calculation time rises to 48 microseconds. The worst-case execution time is equivalent to 49% of CPU utilisation introduced by single-channel flicker calculations. As usually, at least three flicker channels are required, it may be necessary to apply a multicore processor system to calculate all flicker coefficients. Additionally, the measurement device usually performs other operations related to measurements and provides services required from modern devices, e.g., runs a Modbus TCP server. Therefore, it seems reasonable to shift the most time-consuming calculations to a dedicated unit.
As an alternative to the microprocessor implementation, the flicker severity measurement is implemented through an FPGA module. The module is autonomous and operates independently from the other parts of the metering device. For the purposes of presenting this idea, it is assumed that the metering device contains a main processor that performs basic calculations, e.g., voltage RMS, frequency, etc. (see Figure 1). The processor is also responsible for other non-metering tasks, such as communication or displaying results. Flicker severity coefficients are computed in the external FPGA module to minimise hardware resources and save the main processor’s computational capacity. The module operates as a coprocessor—it performs computational-intensive calculations to supplement the main processor.
It may seem that adding an FPGA to the devices to implement the flickermeter coprocessor is not economically justified because the coprocessor task can be performed by an extra processor, usually cheaper than an FPGA. However, currently, many devices are designed in an FPGA-based system-on- chip configuration. In the SoC approach, the designer decides on the division of the device’s tasks into software-based and hardware-based domains. In this case, the coprocessor can be implemented in free FPGA resources at no cost, or a larger FPGA can be used with little increase in cost, which makes the described approach economically viable. Also, the HDL definition of the flickermeter coprocessor can be a starting point for the mass production of ASIC flickermeter integrated circuits.

3.1. Data Flow

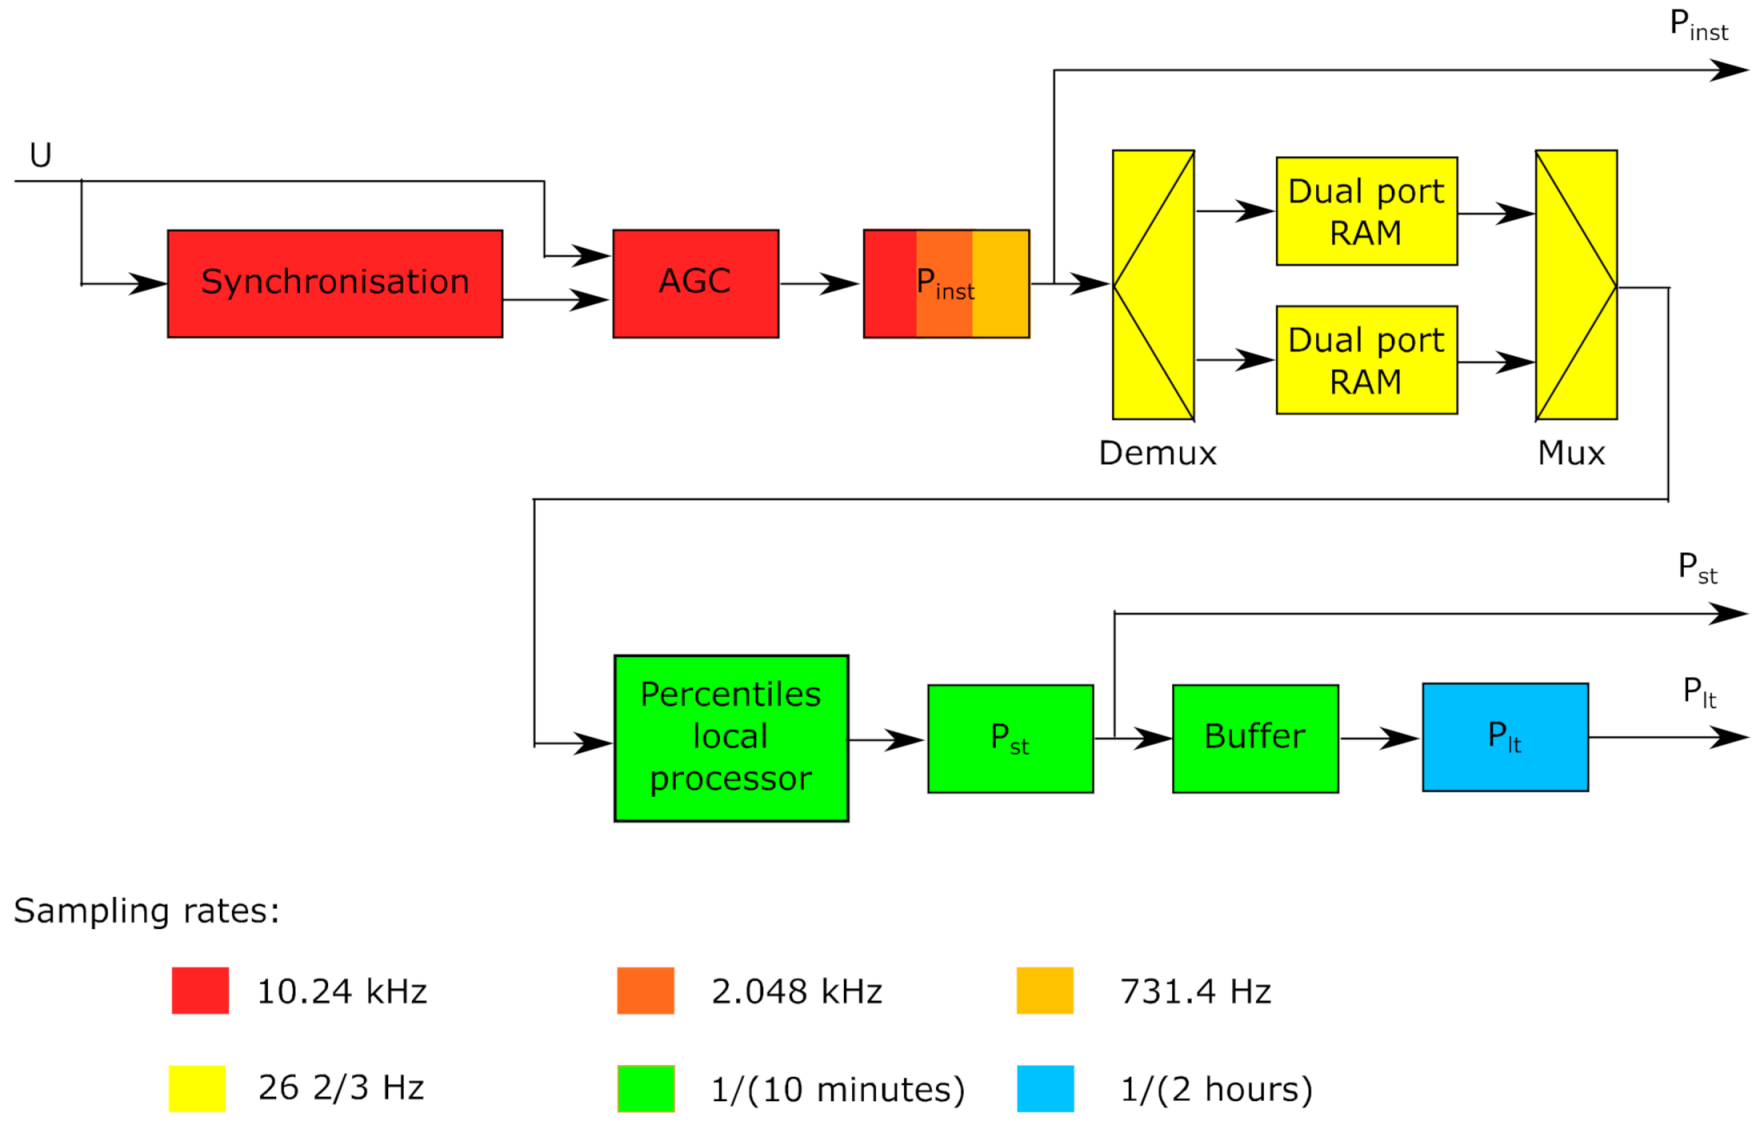
The dataflow of the flicker coprocessor is presented in Figure 4. The colours in Figure 4 represent the constant sampling rates at which operate the stages of the algorithm. The flickermeter algorithm contains low-pass filters, so the data rate can lower as the signal passes the blocks without information losses. The input voltage samples Ua are processed by the AGC block to keep the RMS level of the measured voltage close to a constant reference value without influencing any modulating components. The time constant of the AGC loop is 27.3 s. The synchronisation block is applied to trigger the measurement of the half-cycle RMS values. The Pinst block calculates the instantaneous flicker values (see the next section for details). The synchronisation, AGC and part of the Pinst blocks operate at a 10.24 kHz sampling rate. The final stages of the Pinst calculation chain are down-sampled and operate fourteen times slower. The Pinst samples are stored in the dual-port memory buffers. Each buffer stores 16,000 values with the 26 2/3 Hz frequency during 10 min periods. The buffers operate alternately—one acquires Pinst samples, and the local processor processes the second. The local processor operates as the level classifier and calculates the percentiles required for Pst calculation. The classifier runs every 10 min and is performed by a simple 8-bit soft-processor. In the presented case, a PicoBlaze softcore has been chosen due to its small FPGA resource requirements. Finally, the Pst levels are stored in the buffer (12 samples) and applied to calculate long-term flicker severity Plt.
The Pinst, Pst and Plt values are the coprocessor outputs and can be accessed by the main processor. The aim of the coprocessor is to offload flicker calculations from the main processor. Therefore, the main processor only triggers the measurements, waits to complete the calculations and reads the results.

3.2. Pinst Fixed-Point Algorithm

Flicker calculations were initially modelled in a high-level language Matlab/Simulink environment to develop the FPGA module. Simulink diagrams usually process floating-point data to support a wide dynamic range while simultaneously maintaining data precision. However, in most cases, the floating-point arithmetic is unsuitable for implementation in an FPGA. Floating-point modules, usually compatible with the IEEE-754 specification, require a significant amount of logical resources, increase power consumption and reduce maximum clock frequency. It leads to the conclusion that the cost of the floating-point implementation is too high, and the algorithm has to be converted to fixed-point operations.
The fixed-point numbers can be represented as Qm.n. The m integer value is the number of bits allocated for the two’s complement integer part of the number. The n integer determines the fractional portion. The value of the fixed-point number can be calculated as:
a m 1   a 1 a 0   b 1 b 2   b n ; a i ,   b i = 0 , 1   eqivalent   to 2 m 1 a m 1 + k = 0 m 2 2 k a k + l = 1 n 2 l b l
where:
a m 1   a 1 a 0 are bits of the integer part;
b 1 b 2   b n are bits of the fractional part; and
is the fractional point character.
The selection of the numbers m and n determines the range and the precision of the calculations. It is required that the conversion has to meet some constraints. The obvious one is the capacity of the target FPGA unit. The second constraint is related to multiplication operations. Usually, the FPGA units contain some hardware arithmetic blocks, and in order to minimise the used resources, the arithmetic operations should be compatible with the hardware multipliers and adders. In our case, the FPGA fabric contains digital signal processing blocks that operate as 25 × 18 two’s complement multiplier and a 48-bit accumulator. In order to optimise the capacity of the applied resources, it was assumed that the total number of bits of all signals should not exceed 25 bits, the number of bits to represent gain values should be less than or equal to 18, and the maximum number of bits to store the state of the accumulators should be 48.
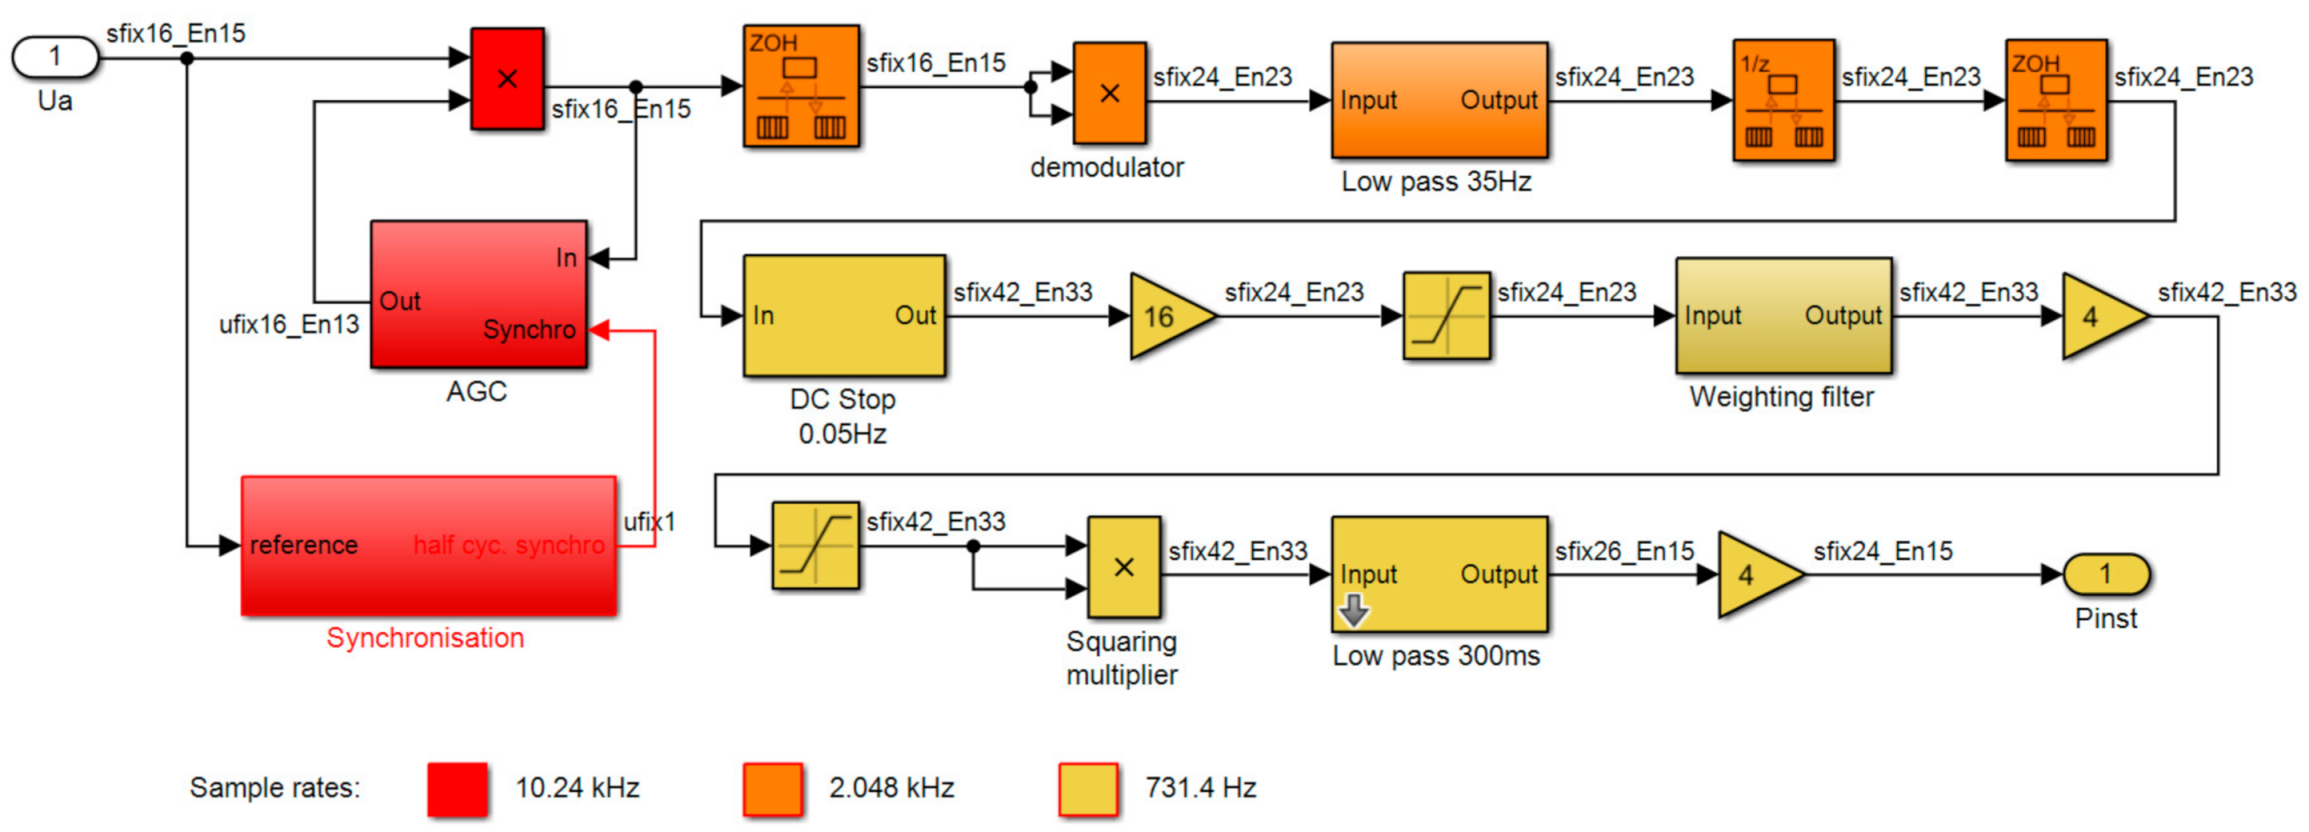
The fixed-point Simulink model of the Pinst calculation block is shown in Figure 5. The drawing shows diagram areas operating with different sampling periods: 10.24 kHz, 2.048 kHz and 741.4 Hz.
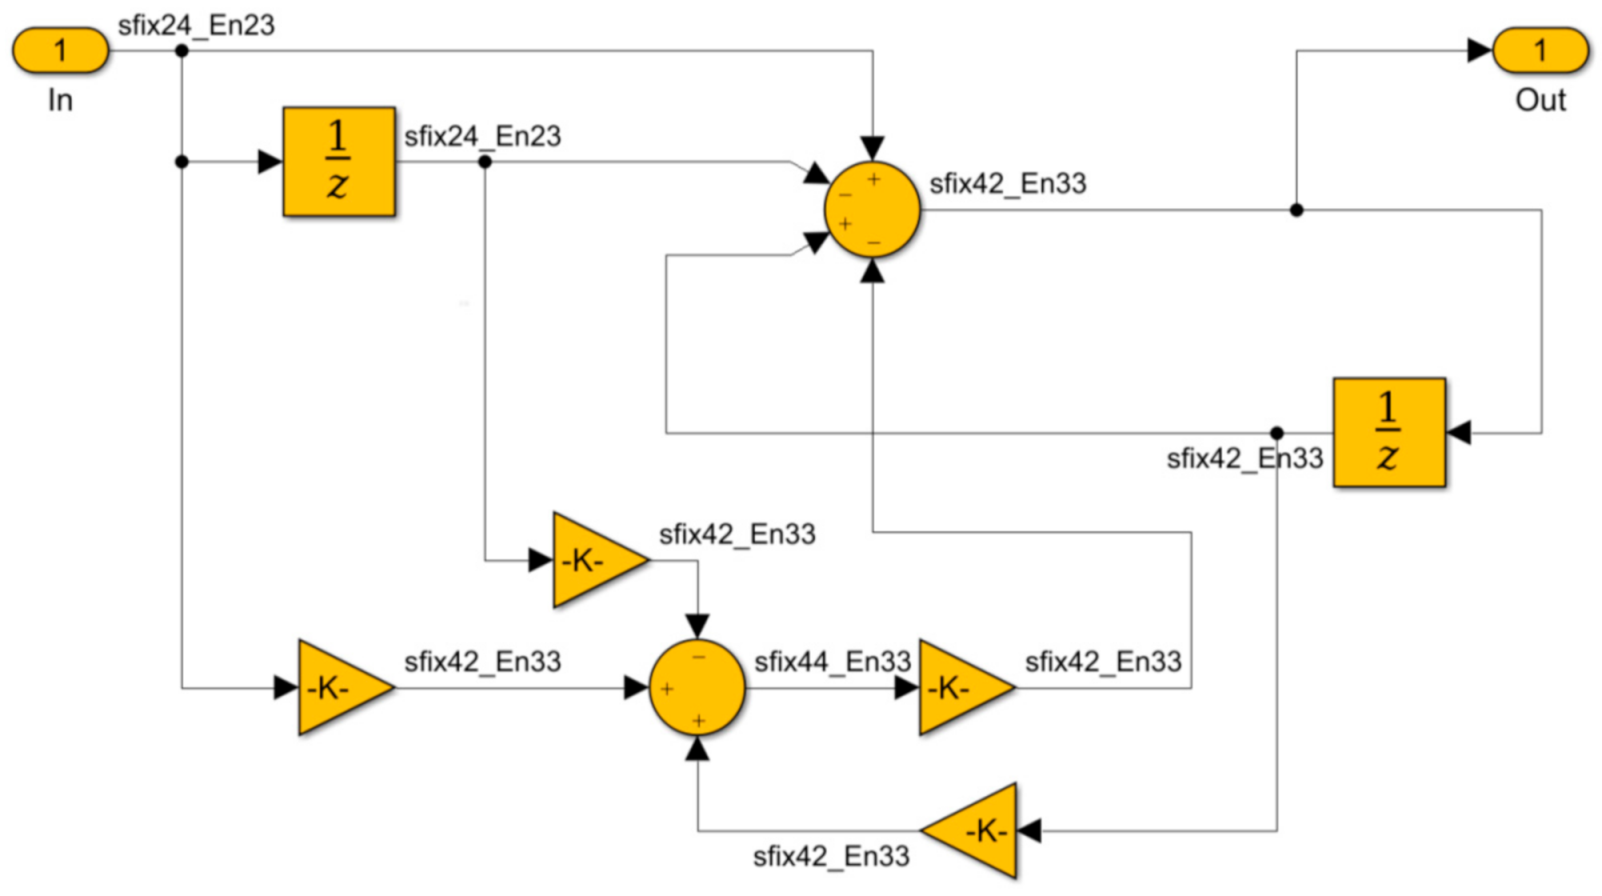
Figure 5 shows that the fixed-point types are represented in the format sfixyy_Enxx, where yy means the total number of bits and xx denotes the fraction length. The blocks included in the main diagram are also converted to fixed-point signals. As an example, the view of the DC Stop 0.05Hz filter is presented in Figure 6.

3.3. Rapid Prototyping

The Synchronization, AGC and Pinst blocks (see Figure 4) are applied to automatic VHDL code generation supported by the Mathworks HDL Coder (Natick, MA, USA). Similarly, Pst calculations are achieved through a Simulink model and used for VHDL code generation. The generated VHDL code, the manually implemented dual-port buffers and the local processor core are used to build the coprocessor IP module. The synthesis process was performed using a Vivado package from Xilinx (San Jose, CA, USA).
The computation of Plt is not considered as a part of the flicker coprocessor. It involves a cube root and a third power evaluation that is resource-demanding and complex to implement in an FPGA. On the other hand, the computation is executed relatively rarely compared to other computations. It seems reasonable to perform the calculation in the main processor as it could have floating-point computation capacity.

3.4. Hardware Platform

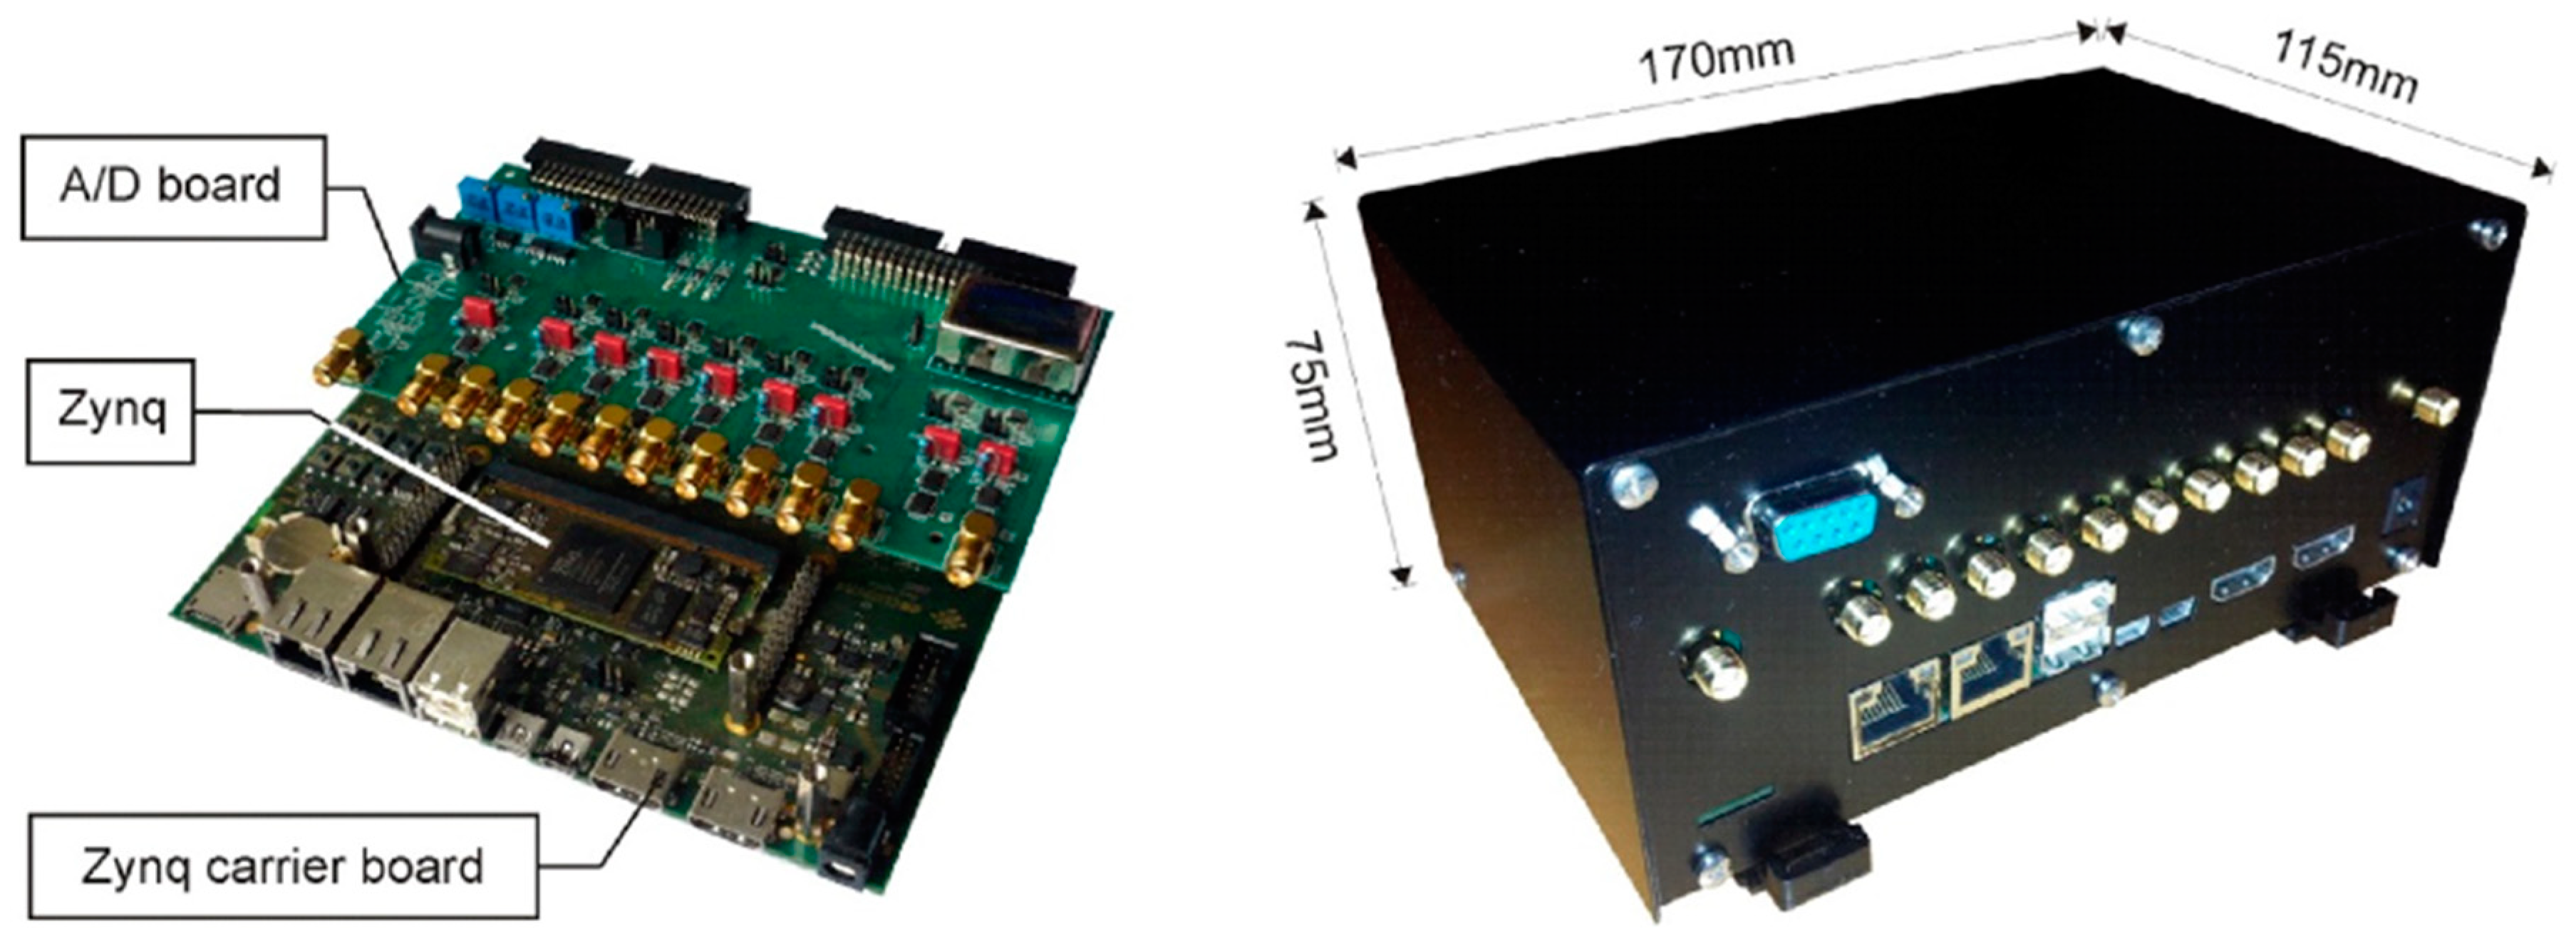
The evaluation board, Mars Starter Kit from Enclustra (Zurich, Switzerland), was selected to be the test hardware platform. The board contains Zynq-integrated circuits from Xilinx equipped with a reconfigurable FPGA fabric with gate, register and RAM resources. The laboratory test platform of the flickermeter is shown in Figure 7. It consists of two boards—the lower one equipped with Zynq and the upper one operating as the interface to analogue inputs.
Resource utilisation required to implement a single metering channel in Zynq 7010, Zynq 7100 and Artix XC7A200t is shown in Table 1. The table presents the number and percentage utilisation of applied Look-Up Tables (LUT), registers, block RAMs, and DSP blocks.

4. Simulation Test Respective to the IEC 61000-4-15 and IEC 61000-4-30

Two series of tests of the flickermeter model were passed. First, the model was simulated in a Simulink environment. Usually, Simulink uses floating-point numbers. In our case, the simulation excitation signals and the data processing algorithm were represented first as floating-point values and then as fixed-point numbers. The floating-point simulations test the correctness of the algorithm. The fixed-point simulations test the accurateness of the floating-point to fixed-point conversion.
The second series of tests were performed in the Hardware-In-the-Loop (HIL) configuration. The fixed-point flickermeter model was translated to the VHDL code and implemented as an FPGA module. Next, the FPGA module was fed by the simulated test signal, processed the data, and returned the simulation environment results. The HIL approach enables the simulation of sensors and tests the final implementation of the flicker measurement algorithm.
In all scenarios, test excitations were generated, respectively, to the IEC 61000-4-15 and IEC 61000-4-30 requirements. According to this standard, the testing procedure shall consist of eight tests, which check the correctness of voltage fluctuations measurement:
  • Sinusoidal/rectangular voltage changes;
  • Rectangular voltage changes and performance testing;
  • Combined frequency and voltage changes;
  • Distorted voltage with multiple zero crossings;
  • Bandwidth test using harmonic and interharmonic sideband modulation;
  • Phase jumps;
  • Rectangular voltage changes with a duty ratio; and
  • Measuring range.
Table 2, Table 3, Table 4, Table 5, Table 6, Table 7, Table 8 and Table 9 present the test results. The tests were performed for the 230 V, 50 Hz system. It is worth mentioning that in all cases, the results of the fixed-point simulation and HIL tests were the same, so only the floating-point and HIL results are given in the tables. The results prove that the coprocessor meets the requirements of the accuracy demanded by the IEC.

4.1. Sinusoidal/Rectangular Voltage Changes

In this test, the total response characteristic from input to output Pinst is checked for sinusoidal and rectangular voltage changes. Table 2 and Table 3 present the normalised flickermeter response (Tables 1b and 2b in IEC 61000-4-15). The Pinst,max has to be 1.00 with a tolerance of ±8%.

4.2. Rectangular Voltage Changes and Performance Testing

This test is sufficient for the purpose of calibration in regular time intervals. The voltage fluctuations are centred around the nominal test voltage 230 V. Table 4 shows the Pst values during the rectangular voltage changes (as defined in Table 5 in IEC 61000-4-15). The required Pst value has to be 1.00 with a tolerance of ±5%.

4.3. Combined Frequency and Voltage Changes

The results of the combined frequency and voltage changes tests are given in Table 5. The calculated Pinst,max shall be 1.00 with a tolerance of ±8% (as defined in Section 6.4 in IEC 61000-4-15).

4.4. Distorted Voltage with Multiple Zero Crossings

Pinst,max of the test (Section 6.5 in IEC 61000-4-15) was 0.9986 during the floating-point simulation and 1.0657 during the HIL test (relative error, respectively: −0.14%, 6.57%). It complies with the requirement that Pinst,max should remain in the range of 1.00 ± 8%.

4.5. Harmonics with Sideband

The bandwidth test using harmonic and interharmonic sideband modulation determines the highest frequency fv,max, for which Pinst,max is 1.00 with a tolerance of ±8% (as defined in Section 6.6 in IEC 61000-4-15). fv,max has to be at least 450 Hz. The test signal contains the system frequency (50 Hz) component modulated by superposing two spectral components with frequencies fi and fv, which are 10 Hz apart, as presented in Table 6. The two modulating voltages shall have an equal relative amplitude of (Ui/U). The measured input bandwidth of the flicker is at least 550 Hz.

4.6. Phase Jumps

For this test, the voltage consists of a sequence of phase jumps. Each phase jump shall occur at the positive zero crossing after 1 min, 3 min, 5 min, 7 min and 9 min (±10 s) from the beginning of a 10 min observation period. The calculated 10 min Pst has to match the required Pst given in Table 7 with a tolerance of ±5% or ±0.05, whichever is bigger (as defined in Section 6.7 in IEC 61000-4-15).

4.7. Rectangular Voltage Changes with a Duty Ratio

The final excitation verifies the reaction to the rectangular voltage changes with a 20% duty cycle. The expected value of the Pst is 1.00 with a tolerance of ±5% (as defined in Section 6.8 in IEC 61000-4-15). The Pst value simulated in floating-point mode was 0.9974, and the result of the fixed-point HIL experiment was 1.0010 (relative error, respectively: −0.26%, 0.10%).

4.8. Pst measuring Range

In order to become the class A IEC 61000-4-30 standard compliant unit, the analyser has to be tested for the Pst range from 0.2 to 10.0. Table 8 and Table 9 present the comparison of the floating-point algorithm and the HIL test results for the rectangular voltage fluctuations, which result in Pst equal to 0.2, 0.5, 1.0, 2.0, 5.0 and 10.0. The expected value of the Pst has a tolerance of ±5% (based on IEC 61000-4-15).
The presented results prove that by subjecting the coprocessor to the tests outlined in the IEC via a simulation-based on Matlab and HIL tests, the coprocessor meets the requirement of the accuracy demanded by the IEC. For the FPGA-based implementation, it is crucial that fixed-point tests meet all the requirements.

5. Field Tests

The real-time measurements were performed for comparative analysis of the developed algorithm and its hardware implementation. The commercial PQ analysers and the developed flickermeter coprocessor module were connected in parallel. The list of used PQ analysers is shown in Table 10.
The PQ analysers are certified Class A according to IEC 61000-4-30 and comply with the requirements of IEC 61000-4-15 for flicker metering. The price range of the analysers is from 2000 € to 19,000 €.
The measurement point is a large institutional municipal energy consumer located in the urban area. The analysers were connected to the low voltage side of a supply transformer 15/0.4 kV. The flickermeter coprocessor and PQ analysers were connected, as shown in Figure 8.
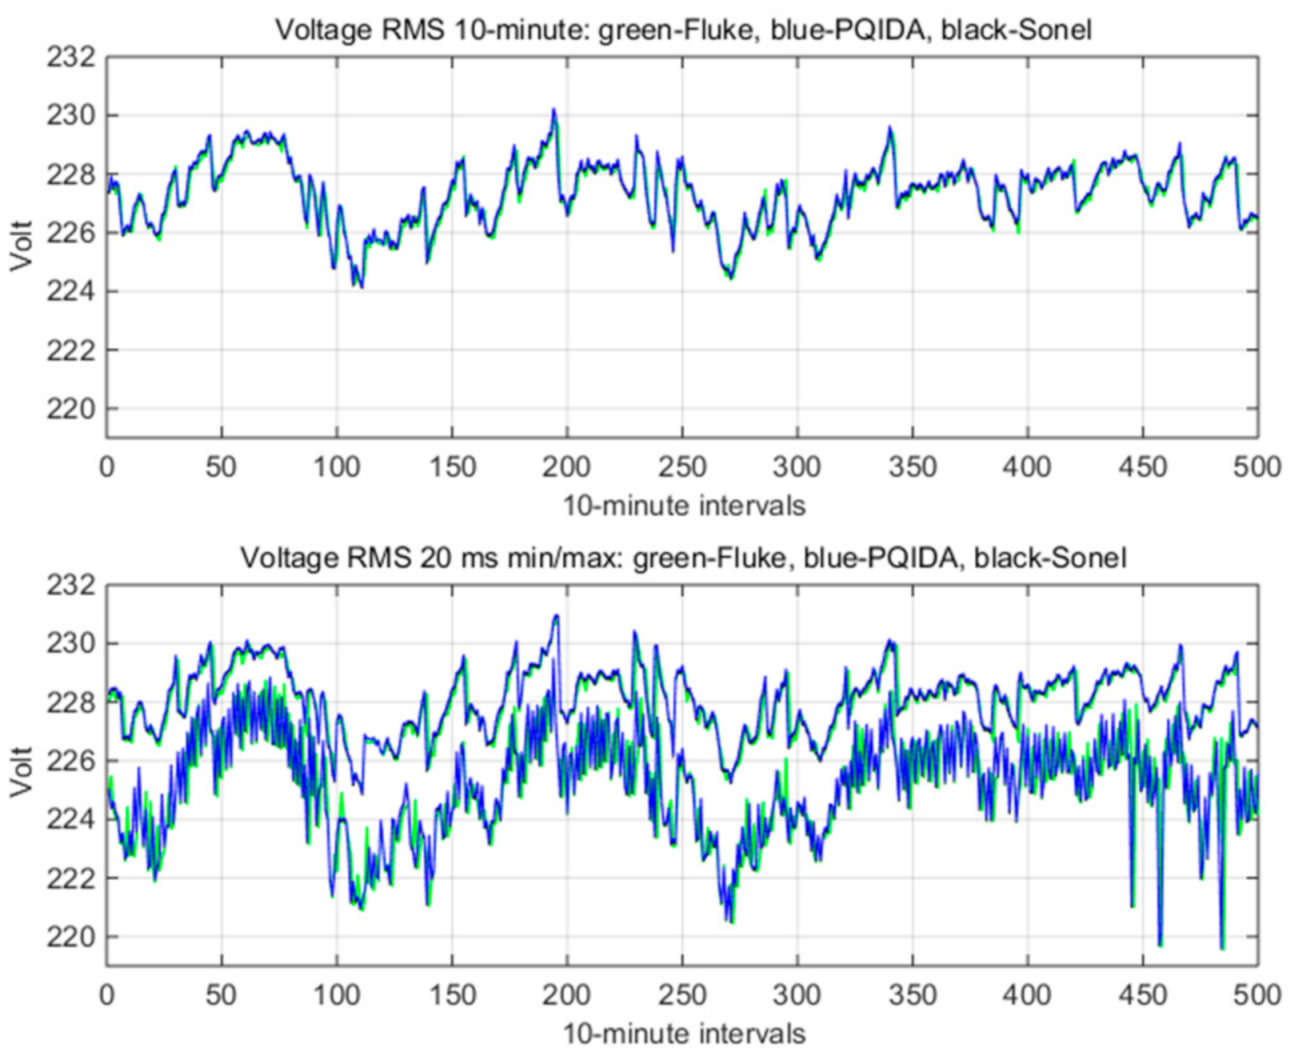
Figure 9 presents the RMS voltage and its variation. The RMS values are aggregated in the 10-min interval, while min/max RMS values are aggregated for one voltage cycle. The changes in the RMS and the difference between maximum and minimum values indicate voltage fluctuations.
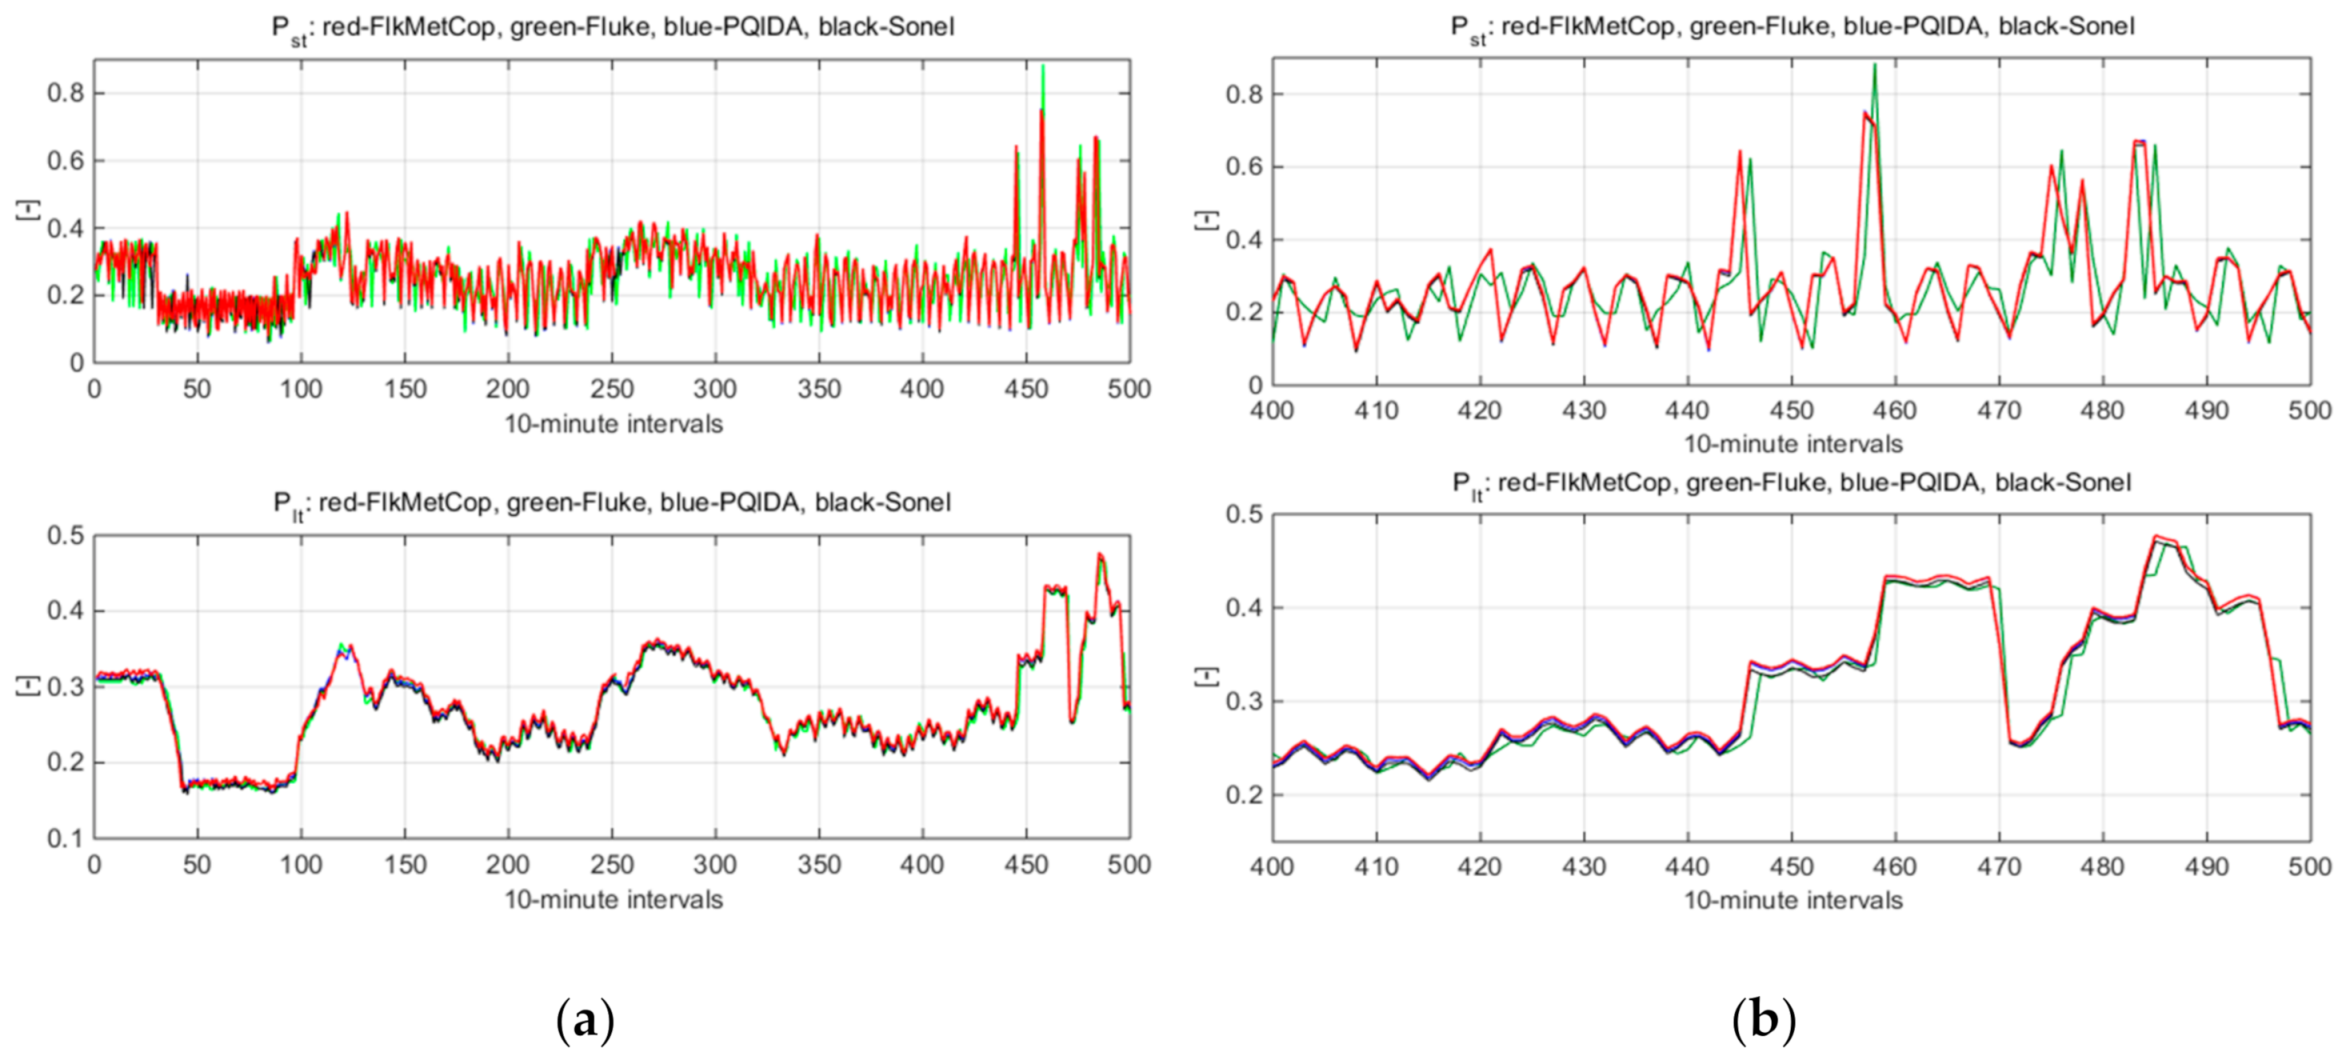
Figure 10 presents the Pst and Plt measurements. It can be observed that the results of the flicker coprocessor follow flicker indicators calculated and recorded by the commercial PQ analysers. The Pst and Plt values recorded by the flicker coprocessor, analyser PQI-DA and PQM0-703 are very similar; hence the waveforms overlap.
Statistical measures (values) are calculated in the process of analysis and evaluation of the recorded power quality indicators. It also applies to the flicker severity coefficients Pst and Plt, the Plt especially. For example, according to EN 50160 [14], a 95% value or percentile CP95 value is calculated for Plt. Table 11 and Table 12 present the statistical measures calculated for the Pst and Plt coefficients’ values, respectively, presented in Figure 10. The calculated values of the flicker coprocessor’s statistical measures are similar to the values obtained for the PQ analysers. However, it can be seen that there are few visible differences in readings, incidentally exceeding 5% of the relative error, between individual analysers. It may be caused by the measuring algorithm inaccuracy that appeared when measuring real signals or too long of a time since the last calibration. A more accurate assessment of this phenomenon would require the use of a reference signal calibrator. However, it is not the main focus of this paper.

6. Discussion and Conclusions

This article presents a method of implementing a flicker measurement algorithm as an IP core within a reconfigurable digital circuit. The method covers not only the implementation but also redesigning the algorithm to process fixed-point signals and generate VHDL code. The simulation, HIL and field tests provided evidence of the correct operation of the IP module.
The module can operate in PQ meters as a kind of coprocessor, offloading time-consuming flicker calculations from the main processor. By analogy to military terminology, the module operates in a fire-and-forget mode. The main processor only triggers the calculations and reads the results when data processing is completed. The presented use case is only an example. The module can be integrated with a meter in different ways, e.g., as a separate application-specific integrated circuit (ASIC) chip or as a part of an existing FPGA fabric. Modern specialised integrated circuits dedicated to PQ measurements measure values such as RMS, THD, asymmetry, harmonics, energy, power, power factor and detect sag and swell events, but they lack flicker measurement [37]. The presented IP core is a natural extension of this class of integrated circuits.
The number of the FPGA resources required by the coprocessor prevents implementation in the simplest and cheapest integrated circuits, in particular when multichannel flicker measurement is considered. However, the capacity of the reconfigurable circuits increases while the cost decreases. Moreover, ASIC technology can be considered for high-volume mass production. On the other hand, there is still scope to optimise the final design and decrease resource occupation. Voltage samples can be pre-processed and sent to the flicker coprocessor by the main processor, which removes the need for synchronisation and reference RMS computation blocks. Multichannel operations can be simulated by means of serialising each channel’s samples and performing the computation sequentially. The implementation of these functionalities depends on the available capacity of the main processor and its peripherals.
Moving computation-intense tasks to specialised chips is a well-known approach. Applying it to the PQ metering together with increasing hardware solutions could facilitate the designs of power grid metering systems. It allows low-cost PQ metering functionalities to be available for AMI meters.

Author Contributions

Conceptualisation and methodology: K.K., A.F., K.P. and K.C.; software: K.K. and K.P.; validation and investigation: K.C., K.P. and A.F.; resources and data curation: K.K., K.C. and A.F.; writing—original draft preparation: K.K. and K.C.; writing—review and editing: A.F. and K.P.; visualisation: K.K. and A.F.; formal analysis: K.P.; supervision: K.K.; project administration: K.C.; funding acquisition: A.F. All authors have read and agreed to the published version of the manuscript.

Funding

This research was funded by The National Centre for Research and Development, project number Gospostrateg 1/385085/21/NCBR/2019—Development of distributed energy in energy clusters (KlastER).

Institutional Review Board Statement

Not applicable.

Informed Consent Statement

Not applicable.

Data Availability Statement

Not applicable.

Conflicts of Interest

The authors declare no conflict of interest.

References

  1. Kołek, K.; Firlit, A.; Piatek, K.; Chmielowiec, K. Flicker Measurement Coprocessor for AMI Meters. In Proceedings of the 2020 12th International Conference and Exhibition on Electrical Power Quality and Utilisation EPQU, Kraków, Poland, 14–15 September 2020. [Google Scholar] [CrossRef]
  2. Lumbreras, D.; Gálvez, E.; Collado, A.; Zaragoza, J. Trends in Power Quality, Harmonic Mitigation and Standards for Light and Heavy Industries: A Review. Energies 2020, 13, 5792. [Google Scholar] [CrossRef]
  3. IEC International Electrotechnical Commission. IEC 61000-4-30 (edition 1.0: 2003, COR1/2006; edition 2.0: 2008; edition 3.0: 2015, COR1:2016). In Electromagnetic compatibility (EMC)—Part 4–30: Testing and Measurement Techniques—Power Quality Measurement Methods; IEC International Electrotechnical Commission: Geneva, Switzerland, 2016. [Google Scholar]
  4. Brundrett, G.W. Human sensitivity to flicker. Lighting Res. Technol. 1974, 6, 127–143. [Google Scholar] [CrossRef]
  5. Fregosi, D.; White, L.; Green, E.; Bhattacharya, S.; Watterson, J. Digital Flickermeter design and implementation based on IEC Standard. IEEE Energy Convers. Congr. Expo. 2010, 4521–4526. [Google Scholar] [CrossRef]
  6. Kowacs, P.A.; Piovesan, E.J.; Werneck, L.C.; Fameli, H.; Zani, A.C.; Da Silva, H.P. Critical flicker frequency in migraine. A controlled study in patients without prophylactic therapy. Cephalalgia 2005, 25, 339–343. [Google Scholar] [CrossRef] [PubMed]
  7. Bodington, D.; Bierman, A.; Narendran, N. A flicker perception metric. Lighting Res. Technol. 2015, 48, 624–641. [Google Scholar] [CrossRef]
  8. Gil-de-Castro, A.; Moreno-Munoz, A.; Larsson, A.; de la Rosa, J.; Bollen, M. LED street lighting: A power quality comparison among street light technologies. Lighting Res. Technol. 2012, 45, 710–728. [Google Scholar] [CrossRef] [Green Version]
  9. IEC International Electrotechnical Commission. IEC 61000-4-15 (edition 1.0: 1997, AMD1/2003; edition 1.1: 1997+AMD1/2003 CSV; edition 2.0: 2010, COR1:2012—Corrigendum 1, ISH1:2017—Interpretation Sheet 1. In Electromagnetic Compatibility (EMC)—Part 4–15: Testing and Measurement Techniques—Flickermeter—Functional and Design Specifications; IEC International Electrotechnical Commission: Geneva, Switzerland, 2017. [Google Scholar]
  10. Wiczynski, G. Inaccuracy of Short-Term Light Flicker Pst Indicator Measuring with a Flickermeter. IEEE Trans. Power Deliv. 2012, 27, 842–848. [Google Scholar] [CrossRef]
  11. Chmielowiec, K. Flicker effect of different types of light sources. In Proceedings of the 11th International Conference on Electrical Power Quality and Utilisation (EPQU), Lisbon, Portugal, 17–19 October 2011; pp. 1–6. [Google Scholar] [CrossRef]
  12. Drapela, J.; Langella, R.; Testa, A.; Grappè, J. A real life light flicker case-study with LED lamps. In Proceedings of the 18th International Conference on Harmonics and Quality of Power (ICHQP), Ljubljana, Slovenia, 13–16 May 2018; pp. 1–6. [Google Scholar] [CrossRef]
  13. Hanzelka, Z.; Chmielowiec, K.; Firlit, A.; Swiątek, B. New challenges for voltage quality studies. Prz. Elektrotechniczny 2013, 89, 17–25. [Google Scholar]
  14. CENELEC European Committee for Electrotechnical Standardization. EN 50160 Voltage Characteristics of Electricity Supplied by Public Electricity Networks (Edition: 2010, A2:2019, A3:2019); CENELEC European Committee for Electrotechnical Standardization: Brussels, Belgium, 2019. [Google Scholar]
  15. Drapela, J. A time domain based flickermeter with response to high frequency interharmonics. In Proceedings of the 2008 13th International Conference on Harmonics and Quality of Power ICHQP, Wollongong, Australia, 28 September–1 October 2008. [Google Scholar] [CrossRef]
  16. White, L.; Bhattacharya, S. A Discrete Matlab-Simulink Flickermeter Model for Power Quality Studies. IEEE Trans. Instrum. Meas. 2010, 59, 527–533. [Google Scholar] [CrossRef]
  17. Ruiz, J.; Lazkano, A.; Aramendi, E.; Leturiondo, L. Analysis of sensitivity to the main parameters involved in the digital implementation of the UIE flickermeter. In Proceedings of the 2000 10th Mediterranean Electrotechnical Conference. Information Technology and Electrotechnology for the Mediterranean Countries, Lemesos, Cyprus, 29–31 May 2000; Volume 2, pp. 823–826. [Google Scholar] [CrossRef]
  18. Hooshyar, A.; El-Saadany, E. Development of a Flickermeter to Measure Non-Incandescent Lamps Flicker. IEEE Trans. Power Deliv. 2013, 28, 2103–2115. [Google Scholar] [CrossRef]
  19. Bucci, G.; Fiorucci, E.; Landi, C. A Digital Instrument for Light Flicker Effect Evaluation. IEEE Trans. Instrum. Meas. 2018, 57, 76–84. [Google Scholar] [CrossRef]
  20. Chen, M.; Lu, C.; Lin, C. Implementation of a integrated algorithm for voltage variation and flicker measurements. In Proceedings of the 2010 IEEE Instrumentation & Measurement Technology Conference Proceedings, Austin, TX, USA, 3–6 May 2010; pp. 1467–1471. [Google Scholar] [CrossRef]
  21. Caldara, S.; Nuccio, S.; Spataro, C. Digital techniques for flicker measurement: Algorithms and implementations analysis. In Proceedings of the 1999 16th IEEE Instrumentation and Measurement Technology Conference, Venice, Italy, 24–26 May 1999; Volume 2, pp. 656–661, IMTC/99, (Cat. No.99CH36309). [Google Scholar] [CrossRef]
  22. Stepan, P.; Bubla, V.; Kukacka, L.; Kraus, J. Implementation of flicker meter in power quality analyzers. In Proceedings of the PCIM Europe 2015 International Exhibition and Conference for Power Electronics, Intelligent Motion, Renewable Energy and Energy Management, Nuremberg, Germany, 19–21 May 2015; pp. 1–8. [Google Scholar]
  23. Budovsky, I.; Hammond, G. Precision Measurement of Power Harmonics and Flicker. IEEE Trans. Instrum. Meas. 2005, 54, 483–487. [Google Scholar] [CrossRef]
  24. Eldery, M.; El-Saadany, E.; Salama, M. A Simple Energy Operator Computational Method for Voltage Flicker Assessment. IEEE Trans. Power Deliv. 2006, 21, 1743–1750. [Google Scholar] [CrossRef]
  25. Kołek, K.; Piątek, K. Rapid algorithm prototyping and implementation for power quality measurement. EURASIP J. Adv. Signal Process. 2015, 19. [Google Scholar] [CrossRef] [Green Version]
  26. Colnago, G.; Macedo, J.; de Freitas Vieira, J. Implementation of a light Flickermeter in a low cost embedded system. IET Sci. Meas. Technol. 2015, 9, 522–531. [Google Scholar] [CrossRef]
  27. Huoy, S.; Jamuar, S.; Sidek, R.; Marhaban, M. Digital Signal Processing Based Waveform Generator for Flickermeter Calibration Test System. In Proceedings of the 2006 4th Student Conference on Research and Development, Shah Alam, Malaysia, 27–28 June 2006; pp. 108–111. [Google Scholar] [CrossRef]
  28. Lin, T.; Tsuji, M.; Yamada, E. Wavelet approach to power quality monitoring. In Proceedings of the IECON’01. In Proceedings of the 27th Annual Conference of the IEEE Industrial Electronics Society, (Cat. No.37243), Denver, CO, USA, 29 November–2 December 2001; Volume 1, pp. 670–675. [Google Scholar] [CrossRef]
  29. El-Gawad, A. Suggested flicker monitoring system based on wavelet transform. In Proceedings of the 2013 22nd International Conference and Exhibition on Electricity Distribution CIRED 2013, Stockholm, Sweden, 10–13 June 2013. [Google Scholar] [CrossRef] [Green Version]
  30. Li, Z.; Shen, J.; Wei, P.; Li, T. A Voltage Fluctuation and Flicker Monitoring System Based on Wavelet Transform. In Proceedings of the 2008 Workshop on Power Electronics and Intelligent Transportation System, Guangzhou, China, 2–3 August 2008; pp. 310–314. [Google Scholar] [CrossRef]
  31. Szlosek, M.; Swiatek, B.; Hanzelka, Z. Application of neural networks to voltage fluctuations measurement—Neural networks flickermeter. In Proceedings of the 2008 International School on Nonsinusoidal Currents and Compensation, Lagow, Poland, 10–13 June 2008. [Google Scholar] [CrossRef]
  32. Ranganathan, P.; Kavasseri, R. Flickermeter Design: An Improved Method to evaluate Short term Flicker Severity Index (Pst) using Walsh Hadamard Transform (WHT). In Proceedings of the 2010 Asia-Pacific Power and Energy Engineering Conference, Chengdu, China, 28–31 March 2010. [Google Scholar] [CrossRef]
  33. Legarreta, A.; Figueroa, J. An IEC 61000-4-30 class A—Power quality monitor with a flicker meter based on Hilbert transform. In Proceedings of the 2011 11th International Conference on Electrical Power Quality and Utilisation, Lisbon, Portugal, 17–19 October 2011. [Google Scholar] [CrossRef]
  34. Yao, W.; Tang, Q.; Teng, Z.; Gao, Y.; Wen, H. Fast S-Transform for Time-Varying Voltage Flicker Analysis. IEEE Trans. Instrum. Meas. 2014, 63, 72–79. [Google Scholar] [CrossRef]
  35. Wei, K.; Xiangwu, Y.; Lixia, Z. A modified digital measuring method on flickering. In Proceedings of the 2003 Asia-Pacific Conference on Environmental Electromagnetics, CEEM 2003, Hangzhou, China, 4–7 November 2003; pp. 621–625. [Google Scholar] [CrossRef]
  36. Haitao, G.; Peng, X.; Jin, T.; Shihui, H.; Rugang, W.; Quan, Z. Voltage Flicker Detection Based on Probability Resampling. Energies 2020, 13, 3350. [Google Scholar] [CrossRef]
  37. Analog Devices Web Site. ADE9000 Data Sheet. High Performance, Multiphase Energy, and Power Quality Monitoring IC. 2020. Available online: https://www.analog.com/media/en/technical-documentation/data-sheets/ADE9000.pdf; https://www.analog.com/en/products/ade9000.html (accessed on 31 December 2020).
Figure 1. Configuration of a flickermeter as a part of a PQ measurement device.
Energies 14 01589 g001
Figure 2. Functional diagram of the IEC flickermeter.
Energies 14 01589 g002
Figure 3. Two possible paths for the implementation of rapid prototyping.
Energies 14 01589 g003
Figure 4. Dataflow of the flickermeter coprocessor.
Energies 14 01589 g004
Figure 5. Fixed-point flickermeter Simulink diagram.
Energies 14 01589 g005
Figure 6. Fixed-point filter Simulink diagram.
Energies 14 01589 g006
Figure 7. Laboratory test platform of the flickermeter.
Energies 14 01589 g007
Figure 8. Simplified diagram of the test power system.
Energies 14 01589 g008
Figure 9. Changes in the RMS voltage (phase L1): the top graph—aggregated 10-min RMS values; the bottom graph—min/max 20 ms RMS values.
Energies 14 01589 g009
Figure 10. Measurements of Pst and Plt (phase L1) from three PQ analysers (Fluke 1760TR, PQI-DA, PQM-703) compared with the flicker coprocessor: (a) the entire measurement period; (b) zoom of the selected fragment.
Energies 14 01589 g010
Table 1. Resource utilisation of a single flickermeter channel.
LUTsRegistersBlock RAMDSP Blocks
Zynq 70106202
35.24%
1403
3.99%
25
41.67%
51
63.75%
Zynq 71006202
1.24%
1403
0.25%
25
3.31%
51
2.52%
Artix 7 XC7A200t4597
3.42%
1542
0.57%
25
3.38%
71
9.60%
Table 2. Response to sinusoidal voltage fluctuations.
Fluctuation Frequency [Hz]Voltage Fluctuation ∆U/U [%]Pinst,max
Floating-Point SimulationRelative
Error
HIL Fixed-Point TestRelative
Error
0.52.3250.9987−0.13%0.9952−0.48%
1.51.0670.9983−0.17%0.9874−1.26%
8.80.2500.9986−0.14%1.03393.39%
200.7040.9988−0.12%1.00230.23%
251.0370.9972−0.28%0.9862−1.38%
33 1/32.1280.9976−0.24%0.9850−1.50%
Table 3. Response to rectangular voltage fluctuations.
Fluctuation Frequency [Hz]Voltage Fluctuation ∆U/U [%]Pinst,max
Floating-Point SimulationRelative
Error
HIL Fixed-Point TestRelative
Error
0.50.5090.9991−0.09%0.98950.33%
3.50.3420.9965−0.35%1.00240.17%
8.80.1960.9991−0.09%1.0347−0.09%
18.00.4460.9968−0.32%0.9845−1.02%
21.50.5920.9981−0.19%0.9945−0.98%
25.00.7640.9984−0.16%0.9840−0.46%
28.00.9150.9991−0.09%0.99720.57%
30.50.8470.9988−0.12%1.01600.33%
33 1/31.6711.00010.01%1.02400.17%
Table 4. Rectangular voltage changes and performance testing.
Rectangular Changes Per Minute [CPM]Voltage Fluctuation ∆U/U [%]Pst
Floating-Point SimulationRelative
Error
HIL Fixed-Point TestRelative
Error
12.7150.9935−0.65%1.00330.33%
22.1911.00200.20%1.00170.17%
71.4500.9988−0.12%0.9991−0.09%
390.8940.9994−0.06%0.9898−1.02%
1100.7221.00050.05%0.9902−0.98%
16200.4070.9981−0.19%0.9954−0.46%
40002.3430.9990−0.10%1.00570.57%
Table 5. Combined frequency and voltage changes.
Fluctuation Frequency [Hz]Voltage Fluctuation ∆U/U [%]Pinst,max
Floating-Point SimulationRelative
Error
HIL Fixed-Point TestRelative
Error
49.75230.0001.00640.64%1.03063.06%
50.25228.812
Table 6. Bandwidth test using harmonic and interharmonic sideband modulation.
fi/fv
[Hz]
Uv/U = Ui/U
[%]
Pinst,max
Floating-Point SimulationRelative
Error
HIL Fixed-Point TestRelative
Error
140/1503.6110.9902−0.98%0.9392−6.08%
190/2000.9941−0.59%1.05265.26%
240/2500.9911−0.89%0.9496−5.04%
290/3000.9941−0.59%1.05505.50%
340/3500.9913−0.87%0.9866−1.34%
390/4000.9941−0.59%1.03153.15%
440/4500.9914−0.86%0.9867−1.33%
490/5000.9945−0.55%1.05315.31%
540/5500.9915−0.85%0.9961−0.39%
Table 7. Results of the phase jumps tests.
Phase Jump Angle ΔβRequired PstPst
Floating-Point SimulationRelative
Error
Absolute
Error
HIL Fixed-Point TestRelative
Error
Absolute
Error
+30 deg0.9130.8710−4.60%−0.0420.9041−0.97%−0.009
−30 deg0.9130.95644.75%0.0430.95394.48%0.041
+45 deg1.0601.08792.63%0.0281.0582−0.17%−0.002
−45 deg1.0601.10203.96%0.0421.07081.02%0.011
Table 8. Response to rectangular voltage fluctuations—floating-point tests.
Rectangular Changes per Minute [CPM]HIL Floating-Point Test Relative Errors
Reference Pst = 0.2Reference Pst = 0.5Reference Pst = 2Reference Pst = 5Reference Pst = 10
10.70%0.14%−0.29%0.62%−1.37%
21.11%0.71%−0.57%1.82%−4.20%
70.11%−0.04%−0.11%0.23%−2.48%
390.07%−0.02%−0.07%−0.09%−0.81%
1100.17%0.07%0.05%0.04%−1.07%
1620−0.08%−0.18%−0.20%−0.20%−0.92%
40000.00%−0.08%−0.13%−0.36%−1.26%
Table 9. Response to rectangular voltage fluctuations—HIL fixed-point tests.
Rectangular Changes per Minute [CPM]HIL Fixed-Point Test Relative Errors
Reference Pst = 0.2Reference Pst = 0.5Reference Pst = 2Reference Pst = 5Reference Pst = 10
1−0.07%0.07%−1.71%−3.37%−3.94%
20.34%−0.21%−4.31%3.31%−0.93%
70.12%−0.10%0.24%0.09%−0.38%
39−0.63%0.75%−0.84%−0.86%0.07%
110−0.56%0.85%−0.97%−0.81%−0.03%
1620−0.87%0.53%−1.00%−0.80%0.21%
40002.20%−0.73%0.62%0.45%1.19%
Table 10. PQ analysers were used for comparative analysis.
PQ AnalyserManufacturer
Fluke 1760TRFLUKE Corporation, Everett, WA, USA
PQM−703Sonel S.A., Swidnica, Poland
PQI-DAA. Eberle GmbH & Co., Nuremberg, Germany
ION7650Schneider Electric, Rueil-Malmaison, France
Table 11. Statistical measures calculated for the recorded Pst values by the PQ analysers and flicker coprocessor.
Statistical ValuesPst
Fluke 1760TRPQI-DASonelAverage ValueFlicker Coprocessor
Max0.8870.7550.7400.7940.751
CP99 (99%)0.4680.5270.5280.5080.533
CP95 (95%)0.3800.3800.3700.3770.382
CP50 (50%)0.2590.2600.2600.2600.264
CP05 (5%)0.1090.1060.1100.1080.116
Table 12. Statistical values calculated for the recorded Plt values by the PQ analysers and flicker coprocessor.
Statistical ValuesPlt
Fluke 1760TRPQI-DASonelAverage ValueFlicker Coprocessor
Max0.4690.4770.4710.4720.477
CP99 (99%)0.4290.4340.4290.4310.434
CP95 (95%)0.3540.3580.3530.3550.360
CP50 (50%)0.2760.2770.2730.2750.280
CP05 (5%)0.1720.1720.1690.1710.175
Publisher’s Note: MDPI stays neutral with regard to jurisdictional claims in published maps and institutional affiliations.