1. Introduction
Distributed generation (DG) based on renewables is constantly gaining popularity and importance because of growing energy demand, environmental concerns, and, in some conditions, financial profitability. The use of DG allows local energy production and thus it decreases the losses in transmission lines. It is also increasingly flexible and reliable, and as a result, the voltage profile is often improved [
1,
2].
However, increasing the volume of DG also arises new challenges for electrical power system operations such as adequate protection methods, operational issues, power quality issues, and one of the most critical, the problem of unintentional islanding. It is worth noting that unintentional islanding, especially in the case of photovoltaic inverters, is an issue that can be, and actually is, observed by end consumers/prosumers of distribution systems operators. It is not an uncommon situation when a photovoltaic inverter in a rural district [
3], disconnected from the main grid, is not detecting off-grid operation due to the high density of DG sources in the surroundings. Therefore, an island is spontaneously created. In this environment, either every photovoltaic (PV) inverter should use an effective islanding detection method or a system of islanding detection should be applied.
Detection of unintentional islanding is a mandatory condition for DG sources. According to [
4,
5], an island is formed when one or more DG sources, disconnected from the utility system, remain operational. This can result in insufficient grounding, safety hazards, and damage to electrical infrastructure. The IEEE 929-1988 standard [
6] requires disconnection of DG while in an islanding state. The IEEE 1547 standard [
5] introduced a required maximal islanding detection delay of 2 s. After detecting the islanding state, the DG source should be turned off.
In [
7], criteria that should be considered for designing effective islanding detection methods were proposed. The first assumed condition being that an islanding method should be able to detect unintentional islanding in a wide range of operational conditions and it should not operate incorrectly for non-islanding disturbances. Moreover, an islanding detection method should be low-cost, simple, and applicable to existing infrastructure.
There are numerous methods of islanding detection and they can be divided into three main groups: passive, active, and communication-based. In this work, two approaches are proposed and tested: the passive method that uses only one phasor measurement unit (PMU) and a hybrid of a passive and communication-based method that uses two PMUs. Laboratory results confirmed that both of the methods were able to detect the islanding state. Distinguishing the islanding state from other events that can be observed both from the main grid and from inside of a microgrid has been achieved by taking into account the shape of the signal. The main contribution of this work is the validation of the proposed, phasor-based, islanding detection methods in a microgrid built in a laboratory. The laboratory environment is the closest emulation to an actual DG power system. Many literature reports are based only on software simulations, and experiments in actual DG are very restricted for obvious reasons.
Synchrophasor-based measurements provide highly accurate information about voltage and current in both the static and dynamic state of system operation. The islanding state detection time of both proposed methods is shorter than 300 ms. The proposed methods could be easily used with commercial PMUs but they could also be implemented as a functionality within a PV inverter.
The paper is divided into six sections:
Section 1 introduces the concept of islanding detection.
Section 2 provides a literature review of islanding detection methods.
Section 3 describes synchrophasor measurements and phasor calculation as used in this paper.
Section 4 describes the laboratory setup and obtained results.
Section 5 presents a proposed methodology for islanding detection using synchrophasor data.
Section 6 concludes the work.
2. Islanding Detection Methods
2.1. Passive Methods
Methods of islanding detection that use information about voltage parameters at the point of common coupling (PCC) are called passive methods [
8,
9,
10,
11,
12,
13]. If the change of observed parameter exceeds the chosen threshold islanding is detected. For passive methods, the main challenge is a correct selection of thresholds [
14,
15,
16]. These methods are popular because of their simplicity, and because they do not introduce any disturbances into the grid. Unfortunately, if the monitored parameter change is insignificant, it is possible that islanding would not be detected. The range of observed parameters for which the islanding is not detectable is called the non-detection zone (NDZ) [
5].
Figure 1 shows a concept of the NDZ.
One of the simplest and very popular methods is over/under voltage (UOV) and over/under frequency (UOF). Others are the rate of change of frequency (ROCOF) which is based on real power unbalance and rate of change of voltage (ROCOV) based on reactive power mismatch [
16]. In [
17], a problem of the analytical formulation of the NDZ is discussed. Additionally, the authors presented requirements for the inverters protection system. In [
18], new thresholds for islanding detection were proposed to minimize the NDZ. In [
19], a comparison of islanding for synchronous and inverter-based generations was performed. The authors proposed a passive method based on the dynamic behavior of a load for islanding detection which can discriminate islanding and non-islanding events under the single DG and multiple DG systems. In [
20], a method based on the concept of the main bus is proposed. This method uses the voltage index to detect islanding operations for large power mismatches.
2.2. Active Methods
Active methods are the answer to the problem of the NDZ. These methods are based on monitoring the change of the chosen grid parameters after intentionally introduced disturbance. Although these methods can have nearly zero NDZs, they can be very complex and may cause power quality issues [
21]. Dedicated active methods are used for specific distributed sources connected to the PCC. In the case of photovoltaic inverters, a current signal is injected into the grid, which causes a power mismatch in the system [
19].
There are numerous active islanding detection methods. Some of them are phase shift methods for the inverter-based DG’s [
14,
16], the slip mode frequency shift method (SMS) [
16], a reactive power export error detection, and an adaptive logic phase shift [
21].
Recently, Murugesan et al. in [
22] suggested a method based on d-axis current injection, and in [
23], he proposed a method based on q-axis current controller, which resulted in an islanding detection time within 178 ms. In [
24], a method based on the injection of predefined patterns of small periodic step changes in the active power was introduced. A method was developed assuming that multiple inverters are working in parallel inside a microgrid. In [
25], the authors proposed a feedback-based method that uses information about a reference d-axis current and the active power output.
In [
26], the authors introduced a method based on a frequency disturbance triggered d-axis current injection scheme. An impedance-based parameter is formulated to check the status of the microgrid operation. The islanding detection parameter is a function of Thevenin’s impedance seen at the inverter DG terminals side.
2.3. Communication-Based Methods
The third group of methods operates on the basis of communication between the DGs and the main grid [
27,
28]. Communication-based methods have zero NDZs, but they are costly and they need integration of information from the islanded DG and main grid operator. These methods use Power Line Communication (PLC) and Supervisory Control and Data Acquisition (SCADA) systems.
In [
29], an anti-islanding method based on the positive feedback control in the d-q frame is proposed. In [
30], a method based on wireless sensor networks is proposed. Data including voltage phasors, frequency, and rate of change of frequency (ROCOF) were used. The method was shown to be reliable and detection time was shorter than the required 2 s.
2.4. Synchrophasor Measurement-Based Methods
Another approach to islanding detection is based on synchrophasor measurement as is proposed in [
30,
31,
32]. These methods can be classified as passive or a hybrid of passive and communication-based. It depends on the location of the measurement device with respect to the island.
Recently, a number of phasor-based islanding detection methods were proposed. In [
33], a phaselet-based algorithm was introduced. Negative sequence phasor components of voltage and current were employed to determine the islanding. A method proposed in [
34] utilizes the phase angle between the positive sequence current and the voltage as the main criterion for islanding. Another interesting approach was presented in [
35] where authors use parameters such as voltage, rate of change of voltage, frequency, rate of change of frequency, voltage phase angle difference, and the rate of change of the voltage phase angle difference between the utility and the islanded grid. In [
7], an islanding detection technique for inverter-based distributed generation based on local synchrophasors was introduced. In this approach, the rate of change of voltage is monitored using a micro-PMU.
3. Synchrophasor Measurements
Synchrophasors are measured with PMUs, also called D-PMUs in the distribution network, located across the network. Phasor data, i.e., phasor (in polar or Cartesian coordinates), frequency, and ROCOF, are collected in real-time and are accurately time-tagged.
Figure 2 presents a PMU model.
The synchrophasor is a phasor representation of the sinusoidal signal.
The sinusoidal signal is determined by:
where:
a(
t) is the time-varying amplitude,
ω0 = 2π
f0 is a nominal pulsation in rad/s,
f0 is a nominal frequency in Hz, and
φ(t) is a time-varying phase in radians, the phasor is given by [
36]:
Figure 3 presents the convention of phasor representation.
The phasor should be estimated 10, 25, or 50 times per second for nominal frequency f0 = 50 Hz.
Time-varying (instantaneous) frequency fin of (1) is given by:
and ROCOF is defined as
There are many phasor calculation methods, which may vary in accuracy, susceptibility to disturbances, or response time. In this paper, a fully compliant method based on the flat-top Finite Input Response (FIR) filters [
37,
38] is used.
Phasors were calculated with the use of the flat-top FIR filters [
37] based on time signals acquired at 0.1 MHz sampling frequency and next resampled to 800 Hz sampling frequency.
The flat-top windows were cosine windows defined as [
37]
where M is the window’s order and
aM[m] are the coefficients of the M order window. The window
wM[n] (5) length is
L = 2
N + 1 and it is symmetrical:
Window coefficients used for phasor estimation were as follows: a5 = [1.004854; 2.007611; 1.917918; 1.451047; 0.666862; 0.130977]. Phasors were calculated in the time interval equal to 10 periods of nominal frequency which was 200 ms and reported with nominal 50 Hz frequency.
The algorithm of islanding detection, under evaluation, compared measurements from the inside and the outside of the island, as it was proposed in [
38]. Phasor data from these measurements were compared to determine islanding conditions.
4. Laboratory Experiment, Setup, and Results
4.1. Laboratory Setup
The source of the power in the system in which the experiment was carried out was a 30 kW synchronous generator, synchronized with the network in the laboratory. An experiment was conducted in the electric machines laboratory in AGH-UST in Kraków, Poland. The resistive load (R
load) or inductive load (IM) was parallelly connected to the laboratory system. The resistive load was a three-phase 6 kW resistor. The inductive load was realized by an induction motor with a rated power of 7.5 kW. The induction motor was loaded with a power of 6 kW, the load was realized with a DC generator. The general view of the laboratory setup is shown in
Figure 4.
The islanding in both load cases could be simulated for the same value of load power. The laboratory setup schematic is shown in
Figure 5.
The entire process of measurements during the experiments required the following sequence of actions:
synchronization of the synchronous generator with the network,
switching on the load,
balancing the system,
switching on the islanding of the system.
4.1.1. Synchronization of the Synchronous Generator with the Network
Figure 6 shows a diagram of the measuring system used to synchronize the generator with the power network. The following instruments were used for manual synchronization of the generator with the network: grid and generator voltage frequency meter (Hz), grid and generator RMS voltage meter (V1, V2), and a voltmeter measuring the instantaneous grid and generator voltage difference (V3).
By adjusting the excitation current of the generator, the voltage values indicated by the voltmeters V1 (generator) and V2 (grid) were equalized. Voltmeter V3 measured the instantaneous difference between the generator and grid voltages, resulting from the phase shift of these voltages. Connecting the generator to the power network was done by the S2 switch when the voltage difference dropped to zero. If the synchronization performed was accurate, then active and reactive power flow between the generator and the network would equal zero.
4.1.2. Switching on the Load
Rload (switch S4) or IM load (switch S3), was connected parallelly to the system, depending on the variant of the experiment. Of most significance to the proper course of the experiment, was the balancing of the power distribution in the system with connected loads.
4.1.3. Balancing the System
In the case of a resistive load, balancing of the system consisted of regulating the active power of the synchronous generator so that it equaled the load power. Power regulation was realized by varying the armature voltage of the DC motor driving the synchronous generator. If the active power measured with the PQ meter at the power grid connection point equaled zero, then the system could be considered balanced.
In the case of an inductive load (induction machine), full balancing of the system required adjustment of both active and reactive power. Active power was regulated in the same way as in the previous case. To balance reactive power in the system, the excitation current of the synchronous generator was regulated. If both active and reactive power at the grid connection point equaled zero, the system was considered balanced. Experiments were carried out for three cases in each load variant:
full balancing of the islanding system,
the active power of the generator was slightly higher than the load power,
the active power of the generator was slightly lower than the load power.
4.1.4. Switching on the Islanding of the System
The laboratory system was put into islanding by turning off the S1 switch, after completing all the above activities in accordance with the assumptions of the case. Voltage waveforms in the power network and islanding system were recorded simultaneously using PMUs.
As a platform for building PMU functionality, the National Instruments cRIO-9024 platform was used, which is presented in
Figure 7. cRIO-9024 is a real-time (RT) system with a Field Programmable Gate Array (FPGA) module. The system used contained two voltage and one current measurement module. The ADCs resolution was 24 bits and sampling frequency was 10 kS/s.
Voltage and current signals were measured synchronously, according to one of the module’s oscillation clock.
Figure 8 shows the block diagram of the measurement system used. Measured data was transferred through the FIFO queue with direct memory access to the RT System. Afterward, data was stored.
4.2. Results
Figure 9 shows voltages and currents measured in the three-phase laboratory system.
Table 1 presents the observed parameters for different system configurations, both balanced and unbalanced. The “Unbalanced system +” case was when the power produced by the generator was higher than the power consumed by the loads inside an island, and the “Unbalanced system −“case was the opposite. i.e., when the power produced by the generator was lower than the power consumed by the loads installed inside an island. The results were the differences between the values measured with two PMUs, one installed inside and one outside the island (respectively PMU1-PMU2). In this case, the hybrid of the passive and communication-based methods was used. Amplitude deviation |ΔU|, frequency deviation |Δ
f|, and maximal value of ROCOF max{|ROCOF|} while in the islanding state were presented. The amplitude deviation ΔU and frequency deviation Δ
f were differences between the values at the point of islanding state occurrence
t0 and at
t1 =
t0 + 200 ms. The maximal value of ROCOF was chosen from the time interval [
t0,
t1]. As expected, frequency change |∆
f| was one order higher for the unbalanced system than for the balanced system. Significant changes of |ΔU| and max{|ROCOF|} were observed.
Table 2 presents observed parameters for different system configurations, both balanced and unbalanced. The “Unbalanced system +” case was the same as presented in
Table 1. However, the results were measured with only one PMU installed inside the island (PMU1). In this situation, the classical passive method was used. Amplitude deviation |ΔU|, frequency deviation |Δ
f|, and maximal value of ROCOF max{|ROCOF|} while in the islanding state were presented. As previously, the amplitude deviation ΔU and the frequency deviation Δ
f were the differences between values at the point of islanding state occurrence
t0 and at
t1 =
t0 + 200 ms. The obtained results confirmed that max{|ROCOF|} was more sensitive to the islanding state than other measured parameters. As expected, frequency change |∆
f| was one order higher for the unbalanced system than for the balanced system. This parameter can be a useful indicator of the islanding state. For every tested case, |ΔU| parameter did not reach significant values. Measured values of amplitude change were observed in the electrical grid during its normal operation. For amplitude and frequency, the signal fluctuations caused by the islanding state were relatively small. These changes could be easily identified as natural deviations in the electrical system. At the same time, max{|ROCOF|} increased three times in the islanding state. Thus, max{|ROCOF|} was the most reliable indicator of the islanding state. No significant difference in the performance of the parameters was observed between the operations with both types of load.
Figure 10 presents the islanding state of the balanced system with resistive load R
load.
Figure 11 shows the islanding state of the balanced system with the induction motor IM as a load.
Figure 10 and
Figure 11 present the differences in the parameters between the values measured with the two installed PMUs: one inside and one outside the island (PMU1-PMU2).
Figure 10 and
Figure 11 that present the differences of PMU1-PMU2, clearly show the moment of islanding occurrence.
The hybrid method uses special features of the PMU-based measurement system, which was capable of comparing the two synchronously measured values in a reliable manner. It allowed us to avoid misreading fluctuations of observed parameters that came from the outside of the island with the actual islanding phenomenon. For comparison,
Figure 12 depicts the observed parameters using one PMU.
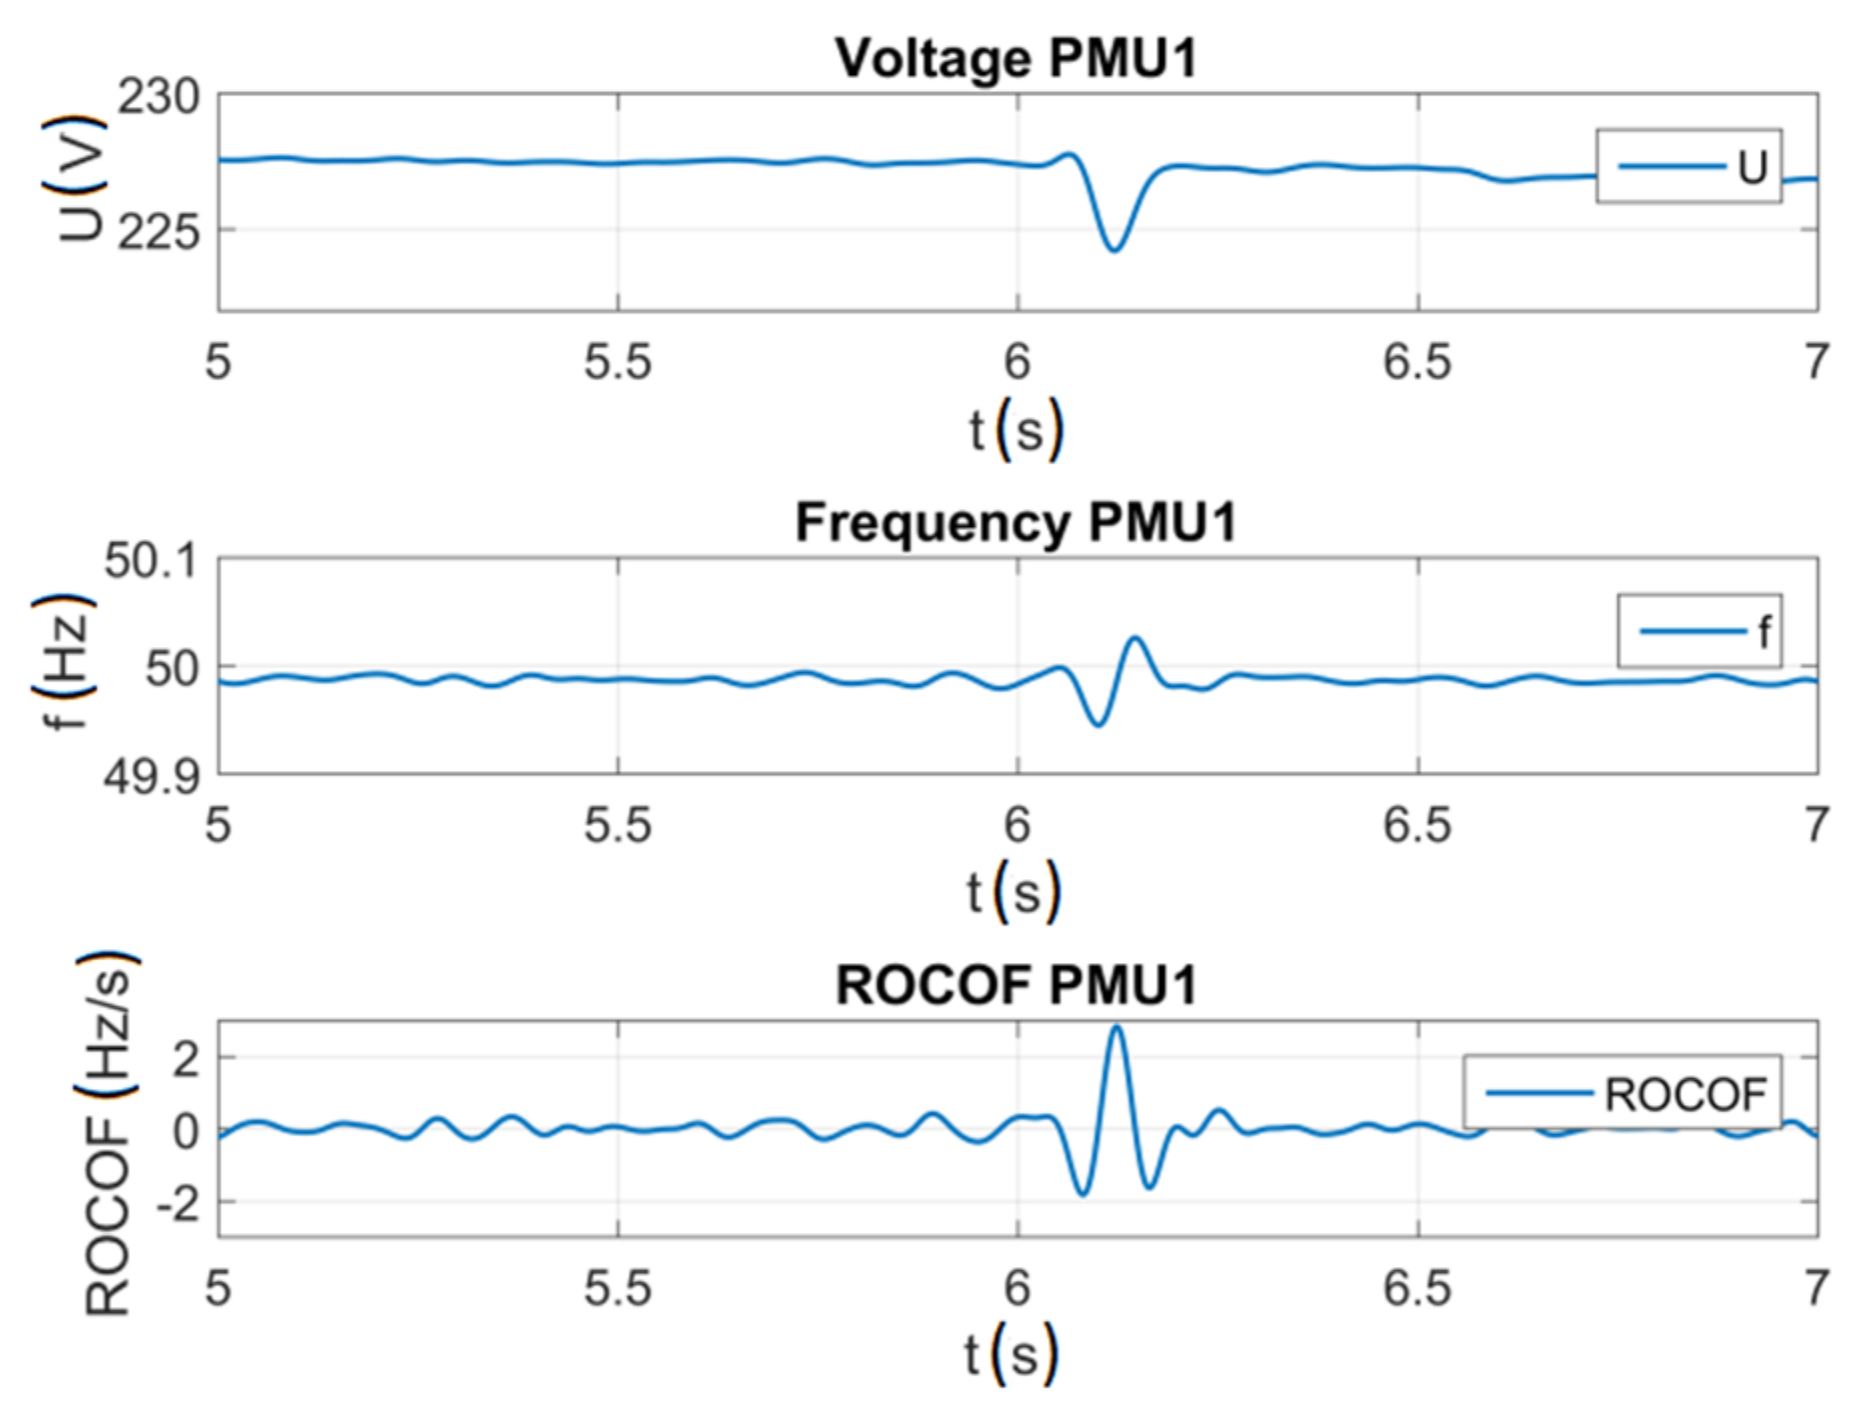
An interesting approach to deal with the problem of the NDZ when only one PMU is used, like in a passive method, is the observation of shapes of all three characteristics.
Figure 12 shows that when the actual islanding state happens, all three parameters change.
Figure 13 shows a situation when at the beginning, both R
load and IM are operating inside the island, and then, R
load is disconnected in time t
0. In this case only, |ΔU| is changed significantly, and |Δ
f| and max{|ROCOF|} deviation was relatively small or even negligible.
Figure 14 shows the event that comes from the outside of the island, from the electric grid side.
These figures show that a significant change was happening while the island was still connected to the main grid. As the main grid stabilized the island, significant changes of all parameters |ΔU|, |Δf| and max{|ROCOF|} came back to their pre-event values.
5. Synchrophasor-Based Islanding Detection Method
5.1. Algorithm
Taking the above observations into consideration, it was possible to develop an algorithm for islanding state identification.
Figure 15 shows the proposed algorithm’s block diagram. The algorithm was divided into three steps of islanding state detection. The first one compared |ΔU| and |Δ
f| parameters with thresholds
τ1 and
τ2 respectively. The second one compared the most significant parameter max{|ROCOF|} with threshold
τ3.
In the last step, continuity of the voltage deviation was verified by comparing ||ΔU|(t0) − |ΔU|(t0 + 200 ms)| with τ4 threshold. All thresholds should be chosen for the specific island in a specific environment, after preliminary tests conducted before connecting the island to the grid.
5.2. Thresholds
To choose thresholds, a set of simulation studies were performed. The simulation tests were performed in the configuration of the system similar to the laboratory setup presented in
Figure 5. The power source connected to the system was a synchronous generator with a power of 37 MW, which cooperated with the power grid to which a parallel energy load was connected. A series of three simulations for different line impedance values and the character of the energy receiver was conducted. In each series, the power of the receiver varied from 5 MW to 100 MW.
Figure 16,
Figure 17,
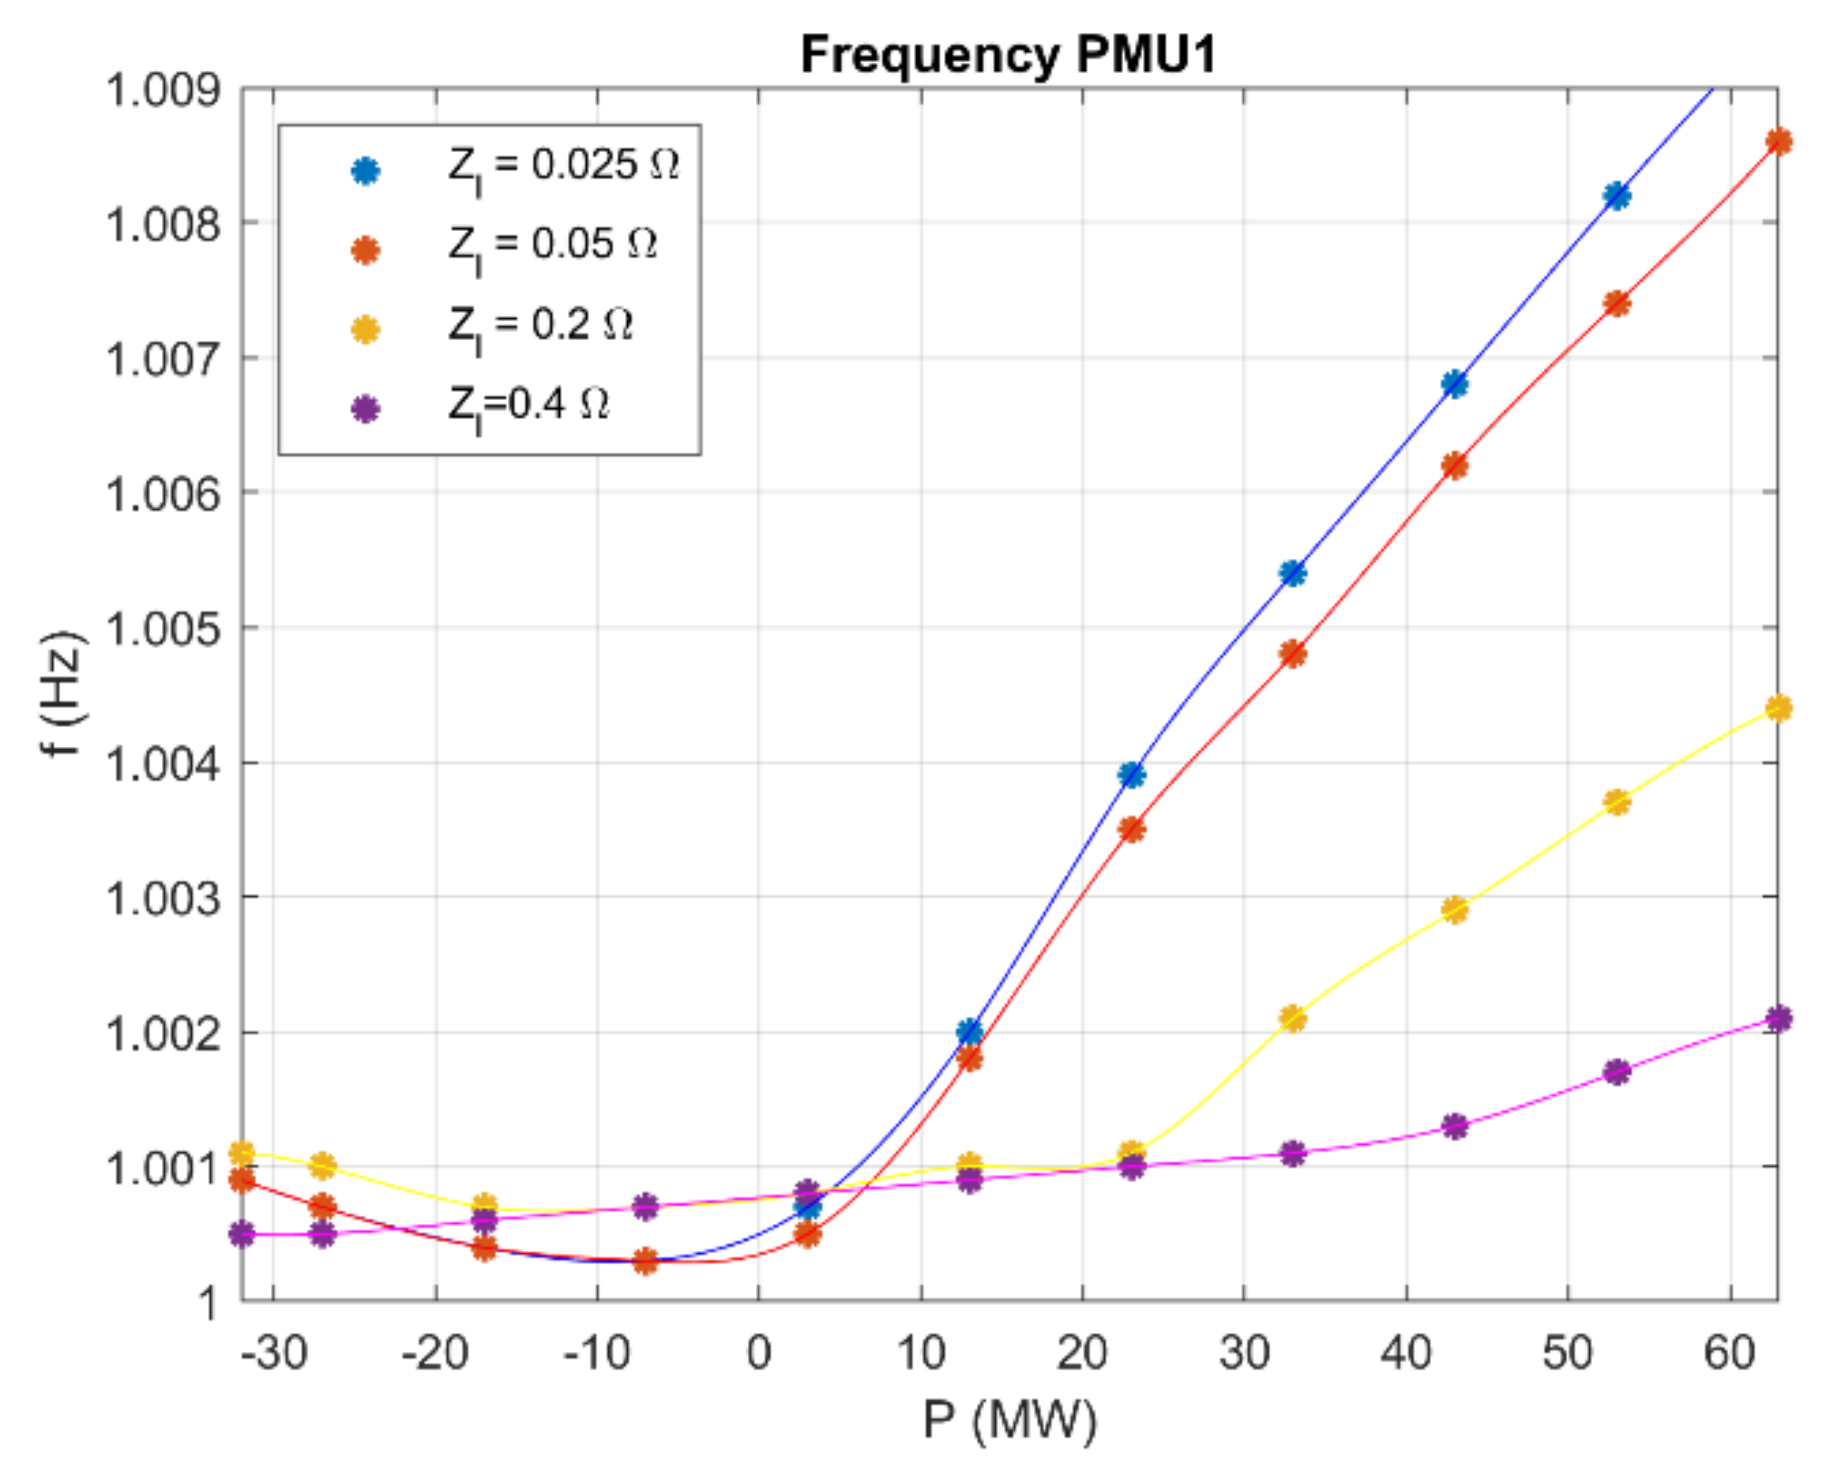
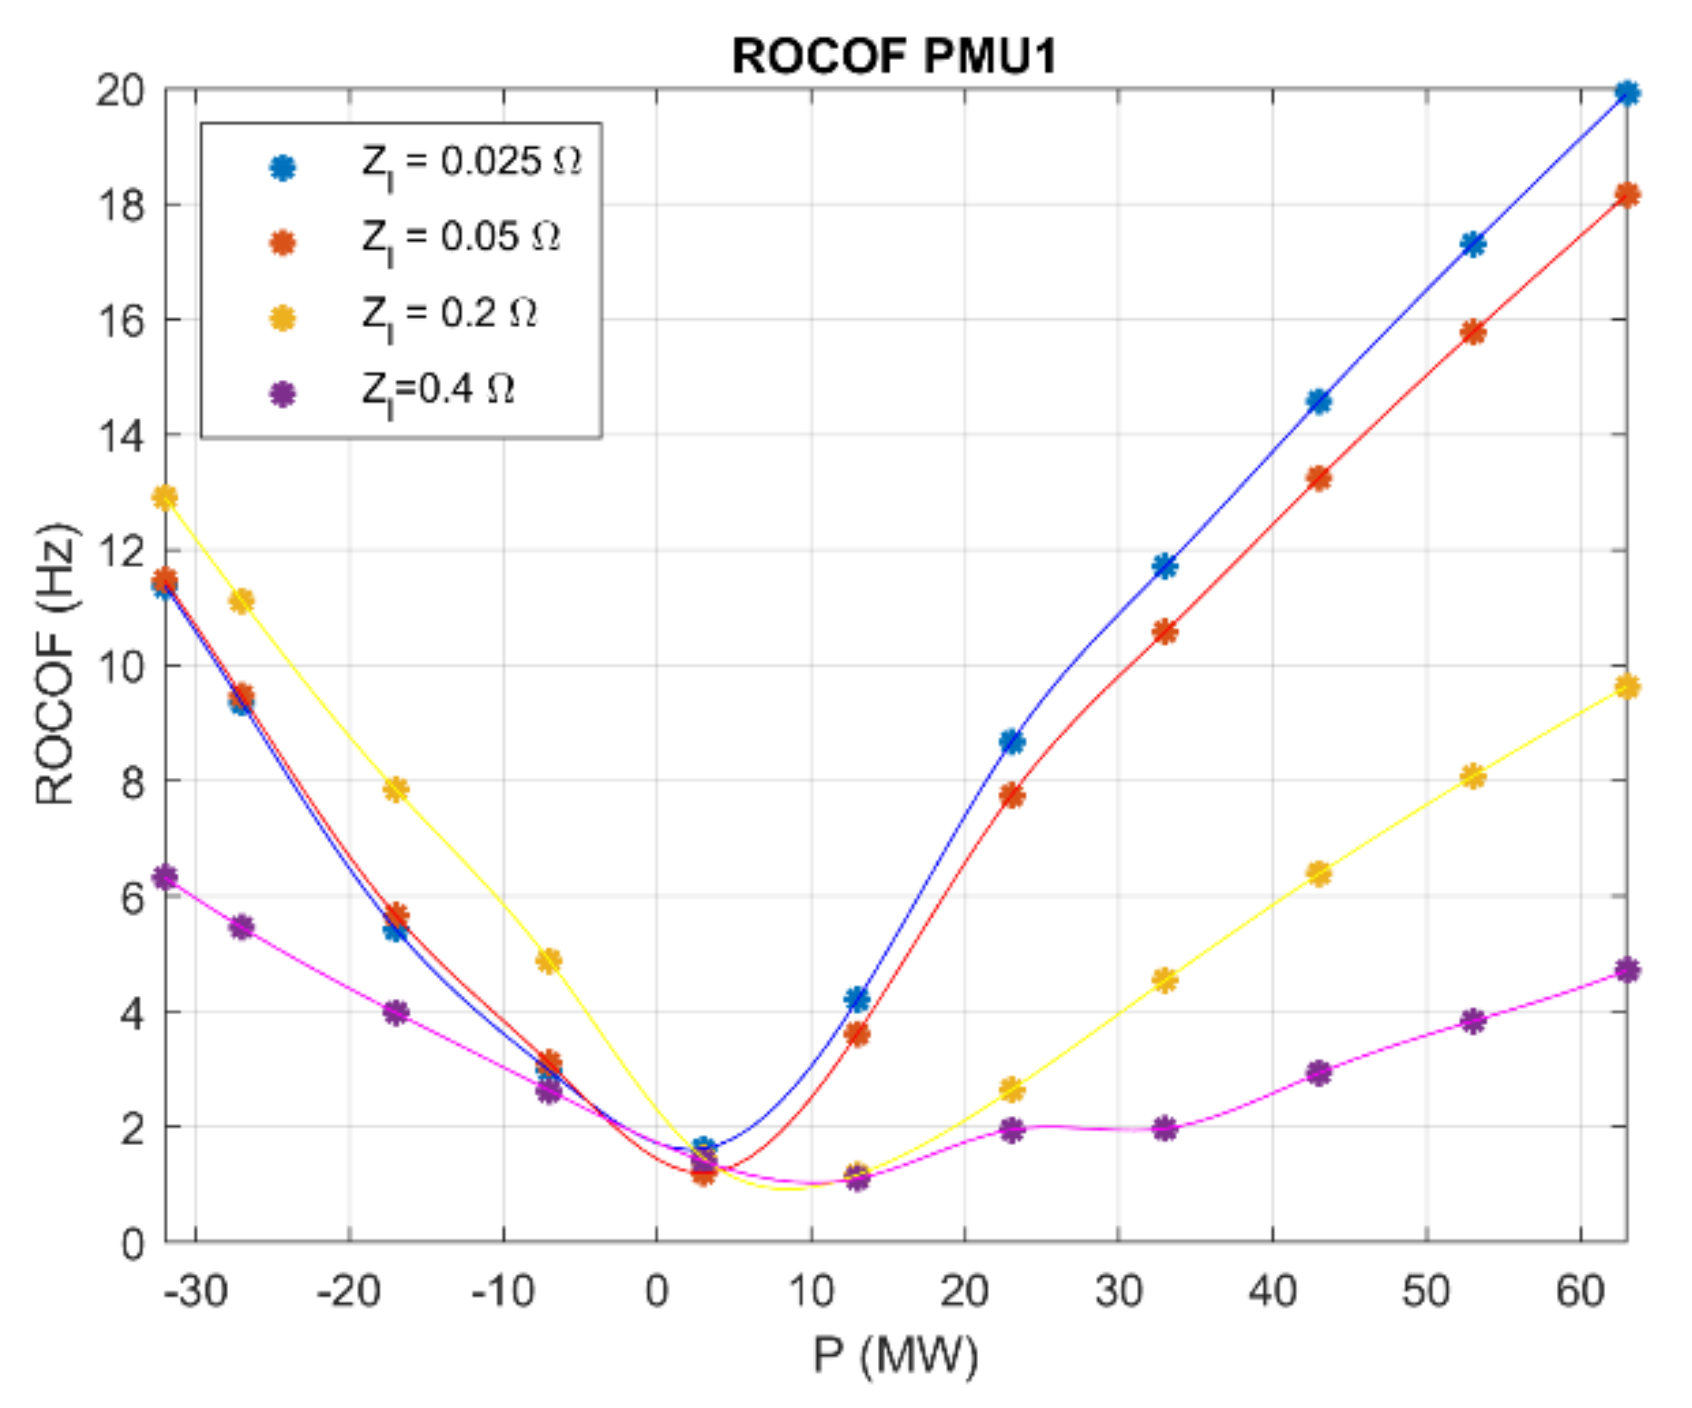
Figure 18 show the characteristics of the amplitude deviation |ΔU|, frequency deviation |Δ
f| after islanding, and the maximal value of ROCOF max{|ROCOF|} while islanding in the function of active power P respectively.
The value of active power P was a relation between the synchronous generator’s power and the power of the receiver. Characteristics showed that different values of line impedances Zl changed the values of the measured parameters. Impedance Zl = 0.025 Ω corresponded to the line impedance of the laboratory experiments.
In
Figure 16, it is shown that for amplitude deviation |ΔU| in a perfectly balanced system the smallest observed change equaled 1.47% of the nominal value. Taking into account simulation results along with the experimental results, thresholds
τ1 = 1.15 V (0.5% of nominal value) and
τ4 = 1.15 V were chosen. The chosen value was lower than the value of the smallest frequency deviation from simulations and higher than the voltage change caused by the disconnection of R
load during laboratory experiments. It is shown in
Figure 13 that in considering voltage amplitude while R
load is disconnected from the grid, the observed change equaled 1.1 V.
In
Figure 17 it is shown that the smallest frequency deviation |Δ
f| for a perfectly balanced system was 0.07% of the nominal value. The smallest frequency deviation |Δ
f| acquired both from the laboratory experiment and simulation equaled 0.03 Hz (0.03% of the nominal). That proved that frequency is the least valuable indicator of islanding. Threshold
τ2 = 0.3 Hz (0.6 % of the nominal value), which is higher than the frequency deviation, was chosen to avoid the misdetection of islanding creating a NDZ for frequency deviation |Δ
f|.
In
Figure 18, it is shown that the smallest maximal value of ROCOF max{|ROCOF|} while islanding for performed simulations was 1.62 Hz/s. Threshold
τ3 = 0.5 Hz/s was chosen to be smaller than the smallest maximal value of ROCOF max{|ROCOF|} while islanding for performed simulations and laboratory experiments.
5.3. Results
Table 3 presents the first trip time, which was the time when one of the thresholds of the proposed method using two PMUs was exceeded. In the second column, the detection time is shown and in the third column, the condition
τ4 is checked. Times of the first trip were smaller than 103 ms for all the cases.
Table 4 presents the first trip time of the proposed method using one PMU. Times of the first trip were smaller than 73 ms for all the cases.
In [
33], a comprehensive and thorough comparison of different islanding detection methods was presented. This comparison showed that for the most recent methods of islanding detection [
31,
32,
33], depending on the nature of the perturbations introduced, detection time stayed in the range of 100 ms to 900 ms. Taking into account the times of the first trip and remembering about the threshold
τ4 for all of the tested cases, the method was able to detect islanding in times shorter than 300 ms.
6. Conclusions
In this work, two types of islanding detection methods were tested: a passive method that uses only one PMU device and a hybrid approach of a passive and communication-based method that uses two PMUs. For both approaches, the conducted laboratory tests proved that a PMU is a useful instrument for islanding detection.
A dedicated testing environment for islanding detection in a microgrid was built in a laboratory that consisted of a synchronous generator, passive loads, and an induction motor. This microgrid was synchronized with the power network in the laboratory. The PMU was implemented in line with the National Instrument cRIO-9024 platform.
The hybrid method which uses two measurement points turns out to be more effective than a purely passive approach. With the use of PMU1 and PMU2, the observed parameters were clear indicators of the islanding incidence.
Nevertheless, two measurement points create higher operating costs, and like in any other communication-based method, they need cooperation with the distribution grid operator.
In the case of the passive approach, the tests showed that the best method for islanding detection is a simultaneous observation of phasor, frequency, and ROCOF. Distinguishing the islanding state from other events, that can be observed both from the main grid and from the inside of an island, has been achieved by taking into consideration the shape of the signal.
A critical point of anti-islanding protection in a microgrid scale is the fast detection of the main grid loss. For the presented test criteria, the maximal islanding detection delay, for both approaches, is shorter than 300 ms.
Author Contributions
Conceptualization, S.B., T.L., A.B. and K.D.; data curation, S.B. and T.L.; formal analysis, S.B. and K.D.; funding acquisition, S.B.; investigation, S.B. and T.L.; project administration, S.B. and A.B.; validation, T.L., A.B. and K.D.; writing—original draft, S.B. and T.L.; writing—review & editing, S.B., T.L., A.B. and K.D. All authors have read and agreed to the published version of the manuscript.
Funding
The research reported in this manuscript has been funded through ERA-NET Smart Grid Plus SMARTGRIDPLUS-3/1/2019.
Institutional Review Board Statement
Not applicable.
Informed Consent Statement
Not applicable.
Data Availability Statement
Conflicts of Interest
The authors declare no conflict of interest.
References
- Barczentewicz, S.; Bień, A.; Lerch, T.; Duda, K. Laboratory Evaluation of Phasor Based Islanding Detection Method. In Proceedings of the 2020 12th International Conference and Exhibition on Electrical Power Quality and Utilisation-(EPQU), Cracow, Poland, 14–15 September 2020; pp. 1–6. [Google Scholar]
- Acharaja, N.; Mahat, P.; Mithulananthan, N. An analytical approach for DG allocation in primary distribution network. Int. J. Electr. Power Energy Syst. 2006, 28, 669–678. [Google Scholar] [CrossRef]
- Fan, W.; Kang, N.; Hebner, R.; Feng, X. Islanding Detection in Rural Distribution Systems. Energies 2020, 13, 5503. [Google Scholar] [CrossRef]
- Klempka, R. Distributed system for electrical power quality improvement. Prz. Elektrotech. 2009, 85, 166–173. [Google Scholar]
- IEEE 1547. 1-2020. IEEE Standard Conformance Test. In Procedures for Equipment Interconnecting Distributed Energy Resources with Electric Power Systems and Associated Interfaces; IEEE: Piscataway, NJ, USA, 2020. [Google Scholar]
- IEEE 929-1988. IEEE Recommended Practice for Utility Interface of Residential and Intermediate Photovoltaic (PV) Systems; IEEE: Piscataway, NJ, USA, 1988. [Google Scholar]
- Karimi, M.; Farshad, M.; Hong, Q.; Laaksonen, H.; Kauhaniemi, K. An Islanding Detection Technique for Inverter-Based Distributed Generation in Microgrids. Energies 2021, 14, 130. [Google Scholar] [CrossRef]
- Lerch, T.; Barczentewicz, S. Islanding Detection of Wind Power Plant with Doubly Fed Induction Generator. In Proceedings of the 2018 International Symposium on Electrical Machines (SME), Andrychow, Poland, 10–13 June 2018. [Google Scholar]
- IEEE 929–2000. Recommended Practice for Utility Interconnected Photovoltaic (PV) Systems; IEEE: Piscataway, NJ, USA, 2000. [Google Scholar]
- Raza, S.; Arof, H.; Mokhlis, H.; Mohamad, H.; Azil Illias, H. Passive islanding detection technique for synchronous generators based on performance ranking of different passive parameters. IET Gener. Transm. Distrib. 2017, 11, 4175–4183. [Google Scholar] [CrossRef]
- Lin, Z.; Xia, T.; Ye, Y.; Zhang, Y.; Chen, L.; Liu, Y.; Tomsovic, K.; Bilke, T.; Wen, F. Application of wide area measurement systems to islanding detection of bulk power systems. IEEE Trans. Power Syst. 2013, 28, 2006–2015. [Google Scholar] [CrossRef]
- Jang, S.I.; Kim, K.H. An islanding detection method for distributed generations using voltage unbalance and total harminic distrotion of current. IEEE Trans. Power Deliv. 2004, 19, 745–752. [Google Scholar] [CrossRef]
- Teodorescu, R.; Liserre, M.; Rodriguez, P. Grid Converters for Photovoltaic and Wind Power System; John Wiley & Sons, Ltd.: Chichester, UK, 2011; pp. 93–96. [Google Scholar]
- Smith, G.A.; Onions, P.A.; Infield, D.G. Predicting islanding operation of grid connected PV inverters. Proc. IEE Electr. Power Appl. 2000, 147, 1–6. [Google Scholar] [CrossRef]
- Hung, C.C.; Chen, C. Automatic phase shift method for islanding detection of grid connected photovoltaic inverter. IEEE Trans. Energy Convers. 2003, 18, 169–173. [Google Scholar] [CrossRef]
- Almas, M.S.; Vanfretti, L. RT-HIL Implementation of the Hybrid Synchrophasor and GOOSE-Based Passive Islanding Schemes. IEEE Trans. Power Deliv. 2016, 31, 1299–1309. [Google Scholar] [CrossRef]
- Uros, M.; Demetris, C.; Petros, A.; Gabriela, H. Impact of inverter-based generation on islanding detection schemes in distribution networks. Electr. Power Syst. Res. 2021, 190, 106610. [Google Scholar]
- Gupta, P.; Bhatia, R.S.; Jain, D.K. Active ROCOF Relay for Islanding Detection. IEEE Trans. Power Deliv. 2017, 32, 420–429. [Google Scholar] [CrossRef]
- Xing, X.; Chun, H.; Danni, L. A new passive islanding detection approach considering the dynamic behavior of load in microgrid. Int. J. Electr. Power Energy Syst. 2020, 117, 105619. [Google Scholar]
- Kim, M.-S.; Haider, R.; Cho, G.-J.; Kim, C.-H.; Won, C.-Y.; Chai, J.-S. Comprehensive Review of Islanding Detection Methods for Distributed Generation Systems. Energies 2019, 12, 837. [Google Scholar] [CrossRef]
- Warin, J.; Allen, W.H. Loss of mains protection. In Proceedings of the 1990 ERA Conference Circuit Protection for industrial and Commercial Installation, London, UK, 17 January 1990; pp. 4.3.1–4.3.12. [Google Scholar]
- Murugesan, S.; Murali, V. Hybrid Analyzing Technique Based Active Islanding Detection for Multiple DGs. IEEE Trans. Ind. Inform. 2019, 15, 1311–1320. [Google Scholar] [CrossRef]
- Murugesan, S.; Venkatakirthiga, M. Active Unintentional Islanding Detection Method for Multiple PMSG based DGs. IEEE Trans. Ind. Appl. 2020, 56, 4700–4708. [Google Scholar] [CrossRef]
- Sivadas, D.; Vasudevan, K. An Active Islanding Detection Strategy with Zero Non detection Zone for Operation in Single and Multiple Inverter Mode Using GPS Synchronized Pattern. IEEE Trans. Ind. Electron. 2020, 67, 5554–5564. [Google Scholar] [CrossRef]
- Bakhshi-Jafarabadi, R.; Sadeh, J. New voltage feedback-based islanding detection method for grid-connected photovoltaic systems of microgrid with zero non-detection zone. IET Renew. Power Gener. 2020, 14, 1710–1719. [Google Scholar] [CrossRef]
- Ganivada, P.K.; Jena, P. Frequency Disturbance Triggered D-Axis Current Injection Scheme for Islanding Detection. IEEE Trans. Smart Grid 2020, 11, 4587–4603. [Google Scholar] [CrossRef]
- Ropp, M.; Aaker, E.; Haigh, K.; Sabbah, J. Using power line carrier communication to prevent islanding. IEEE Photovolt. Spec. Conf. 2002, 1675–1678. [Google Scholar]
- Wilson, X.; Guibin, Z.; Chun, L.; Wencong, W.; Guangzhu, W.; Jacek, K. A power line signaling based technique for anti-islanding protection of distributed generators-Part I: Sheme and analysis. IEEE Trans. Power Deliv. 2007, 22, 1758–1766. [Google Scholar]
- Ye, Z.; Walling, R.; Garces, L.; Zhou, R.; Li, L.; Wang, T. Study and Development of Anti-Islanding Control for Grid-Connected Inverters; Nat. Renew. Energy Lab.: Golden, CO, USA, May 2004; NREL/ SR-560-36243. [Google Scholar]
- Katyara, S.; Hashmani, A.; Chowdhary, B.S.; Musavi, H.B.; Aleem, A.; Chachar, F.A.; Shah, M.A. Wireless Networks for Voltage Stability Analysis and Anti-islanding Protection of Smart Grid System. Wirel. Pers. Commun. 2021, 116, 1361–1378. [Google Scholar] [CrossRef]
- Cardenas, J.; Mikhael, G.; Kamiński, J.; Voloh, I. Islanding detection with phasor measurement units. In Proceedings of the 2014 67th Annual Conference for Protective Relay Engineers, College Station, TX, USA, 31 March—3 April 2014; pp. 229–241. [Google Scholar]
- Barczentewicz, S.; Borkowski, D. Synchrophasor based islanding detection method. In Proceedings of the 2015 International School on Nonsinusoidal Currents and Compensation (ISNCC), Łagów, Poland, 15–18 June 2015. [Google Scholar]
- Kolli, A.T.; Ghaarzadeh, N. A novel phaselet-based approach for islanding detection in inverter-based distributed generation systems. Electr. Power Syst. Res. 2020, 182, 106226. [Google Scholar] [CrossRef]
- Muda, H.; Jena, P. Phase angle-based PC technique for islanding detection of distributed generations. IET Renew. Power Gener. 2018, 12, 735–746. [Google Scholar] [CrossRef]
- Subramanian, K.; Loganathan, A.K. Islanding Detection Using a Micro-Synchrophasor for Distribution Systems with Distributed Generation. Energies 2020, 13, 5180. [Google Scholar] [CrossRef]
- IEEE/IEC 60255-118-1-2018. IEEE/IEC International Standard—Measuring Relays and Protection Equipment—Part. 118-1: Synchrophasor for Power Systems—Measurements; IEEE/IEC: Piscataway, NJ, USA, 2018. [Google Scholar]
- Duda, K.; Zieliński, T.P.; Barczentewicz, S. Perfectly Flat-Top and Equiripple Flat-Top Cosine Windows. IEEE Trans. Instrum. Meas. 2016, 65, 1558–1567. [Google Scholar] [CrossRef]
- Duda, K.; Zieliński, T.P. FIR Filters Compliant with the IEEE Standard for M Class PMU. Metrol. Meas. Syst. 2016, 23, 623–636. [Google Scholar] [CrossRef]
Figure 1.
Non-detection zone for over/under voltage (UOV) and over/under frequency (UOF) passive islanding detection method. Based on ref. [
7].
Figure 1.
Non-detection zone for over/under voltage (UOV) and over/under frequency (UOF) passive islanding detection method. Based on ref. [
7].
Figure 2.
Phasor Measurement Unit model. Based on ref. [
34].
Figure 2.
Phasor Measurement Unit model. Based on ref. [
34].
Figure 3.
Convention of phasor representation. Based on ref. [
36].
Figure 3.
Convention of phasor representation. Based on ref. [
36].
Figure 4.
General view of the laboratory setup.
Figure 4.
General view of the laboratory setup.
Figure 5.
Laboratory setup. SG—synchronous generator, EN—electricity network, IM—induction motor, Rload—resistive load, PQ—measurement of active and reactive power, PMU1, PMU1—phasor measurements units, PCC—a point of common coupling.
Figure 5.
Laboratory setup. SG—synchronous generator, EN—electricity network, IM—induction motor, Rload—resistive load, PQ—measurement of active and reactive power, PMU1, PMU1—phasor measurements units, PCC—a point of common coupling.
Figure 6.
Synchronization system.
Figure 6.
Synchronization system.
Figure 7.
cRIO-9024 platform for the PMU implementation.
Figure 7.
cRIO-9024 platform for the PMU implementation.
Figure 8.
Measurement system block diagram.
Figure 8.
Measurement system block diagram.
Figure 9.
Measured three-phase voltage and current.
Figure 9.
Measured three-phase voltage and current.
Figure 10.
Voltage amplitude U, frequency f, and ROCOF while islanding of the balanced system with Rload for PMU1-PMU2.
Figure 10.
Voltage amplitude U, frequency f, and ROCOF while islanding of the balanced system with Rload for PMU1-PMU2.
Figure 11.
Voltage amplitude U, frequency f, and ROCOF while islanding of the balanced system with IM for PMU1-PMU2.
Figure 11.
Voltage amplitude U, frequency f, and ROCOF while islanding of the balanced system with IM for PMU1-PMU2.
Figure 12.
Voltage amplitude U, frequency f, and ROCOF while islanding for the balanced system with IM for PMU1.
Figure 12.
Voltage amplitude U, frequency f, and ROCOF while islanding for the balanced system with IM for PMU1.
Figure 13.
Voltage amplitude U, frequency f, and ROCOF while Rload is disconnected in time t0 for PMU1.
Figure 13.
Voltage amplitude U, frequency f, and ROCOF while Rload is disconnected in time t0 for PMU1.
Figure 14.
Voltage amplitude U, frequency f, and ROCOF during system event for PMU1.
Figure 14.
Voltage amplitude U, frequency f, and ROCOF during system event for PMU1.
Figure 15.
Block diagram of shape-based islanding identification technique (τ1, τ2, a threshold for minimal deviation of observed parameters, τ3—a threshold for max{|ROCOF|}, τ4—the threshold for a time of deviation).
Figure 15.
Block diagram of shape-based islanding identification technique (τ1, τ2, a threshold for minimal deviation of observed parameters, τ3—a threshold for max{|ROCOF|}, τ4—the threshold for a time of deviation).
Figure 16.
Amplitude deviation |ΔU| after islanding in the function of active power P for impedance Zl = {0.025; 0.05; 0.2; 0.4} Ω.
Figure 16.
Amplitude deviation |ΔU| after islanding in the function of active power P for impedance Zl = {0.025; 0.05; 0.2; 0.4} Ω.
Figure 17.
Frequency deviation |Δf| after islanding in the function of active power P for impedance Zl = {0.025; 0.05; 0.2; 0.4} Ω.
Figure 17.
Frequency deviation |Δf| after islanding in the function of active power P for impedance Zl = {0.025; 0.05; 0.2; 0.4} Ω.
Figure 18.
Maximal value of ROCOF max{|ROCOF|} while islanding in the function of active power P state for impedance Zl = {0.025; 0.05; 0.2; 0.4} Ω.
Figure 18.
Maximal value of ROCOF max{|ROCOF|} while islanding in the function of active power P state for impedance Zl = {0.025; 0.05; 0.2; 0.4} Ω.
Table 1.
Laboratory experiment results for PMU1-PMU2.
Table 1.
Laboratory experiment results for PMU1-PMU2.
| | |∆U| (V) | |∆f| (Hz) | Max{|ROCOF|} (Hz/s) |
|---|
| Balanced System |
| Rload | 4.76 | 0.03 | 0.71 |
| IM | 4.63 | 0.07 | 0.92 |
| Unbalanced System + |
| Rload | 2.81 | 0.24 | 1.84 |
| IM | 3.12 | 0.24 | 1.97 |
| Unbalanced System − |
| Rload | 5.76 | 0.11 | 1.19 |
| IM | 5.76 | 0.31 | 1.63 |
Table 2.
Laboratory experiment results for PMU1.
Table 2.
Laboratory experiment results for PMU1.
| | |∆U| (V) | |∆f| (Hz) | Max{|ROCOF|} (Hz/s) |
|---|
| Balanced System |
| Rload | 2.1 | 0.05 | 0.71 |
| IM | 3.4 | 0.08 | 0.98 |
| Unbalanced System + |
| Rload | 1.8 | 0.98 | 1.93 |
| IM | 1.9 | 0.45 | 1.73 |
| Unbalanced System − |
| Rload | 3.1 | 0.28 | 0.85 |
| IM | 3.9 | 0.28 | 1.86 |
Table 3.
Times of islanding detection with the proposed method for PMU1-PMU2.
Table 3.
Times of islanding detection with the proposed method for PMU1-PMU2.
| | First Trip Time (ms) | Verification τ4 |
|---|
| | Balanced System |
| Rload | 86 | Passed |
| IM | 64 | Passed |
| | Unbalanced System + |
| Rload | 102 | Passed |
| IM | 33 | Passed |
| | Unbalanced System − |
| Rload | 73 | Passed |
| IM | 75 | Passed |
Table 4.
Times of islanding detection with the proposed method for PMU1.
Table 4.
Times of islanding detection with the proposed method for PMU1.
| | First Trip Time (ms) | Verification τ4 |
|---|
| | Balanced System |
| Rload | 65 | Passed |
| IM | 76 | Passed |
| | Unbalanced System + |
| Rload | 73 | Passed |
| IM | 29 | Passed |
| | Unbalanced System − |
| Rload | 73 | Passed |
| IM | 74 | Passed |
| Publisher’s Note: MDPI stays neutral with regard to jurisdictional claims in published maps and institutional affiliations. |
© 2021 by the authors. Licensee MDPI, Basel, Switzerland. This article is an open access article distributed under the terms and conditions of the Creative Commons Attribution (CC BY) license (https://creativecommons.org/licenses/by/4.0/).


