1. Introduction
Steadily increasing electricity prices [
1] associated with increasing electrical energy consumption [
2,
3,
4], the necessity for the reduction of greenhouse gas emissions included in EU policies regarding climate protection [
5,
6] and rapid technological development in power electronics and numerous programmes in EU member states, supporting the development of renewable energy sources (RESs) and low-carbon technologies, mean that in recent years the exponential trend of installed photovoltaic (PV) micro-installation capacity has been observed.
For Poland, regarding the Renewable Energy Directive 2009/28/EC [
7], a national overall target for the share of RESs in gross final energy consumption in 2020 amounting to 15% was specified. In November 2016, the European Commission published its “Clean Energy for all Europeans” package [
8]. As a part of this package, the Commission adopted a legislative proposal for a recast of the Renewable Energy Directive. In December 2018, after a final compromise among the EU institutions, the revised Renewable Energy Directive 2018/2001/EU (RED II) [
9] entered into force. In the RED II document [
9], the overall EU target for RES consumption by 2030 was raised to 32%. In order to meet EU obligations, the expansion of RESs in Poland was placed high on the public agenda.
Therefore, in years 2014–2020, the Polish National Fund for Environmental Protection and Water Management developed several priority programmes [
10,
11,
12,
13,
14,
15] addressed to Polish families, which provide financial support for construction of photovoltaic micro-installations on the rooftops of their houses. One of those priority programmes, “My Electricity” [
11,
12,
13,
14,
15], which is one of the biggest financial support programmes in Europe, with a budget over EUR 240 million, has contributed to the connection of over 1.2 GWp in photovoltaic micro-installations to low-voltage networks since its beginning in September 2019 [
14]. Total registered applications by the Polish National Fund for Environmental Protection and Water Management for co-financing of PV micro-installations in two editions of the programme exceeded 260,000. Over 650 MWp of PV micro-installations were connected to the network, with an average power of 5.7 kWp [
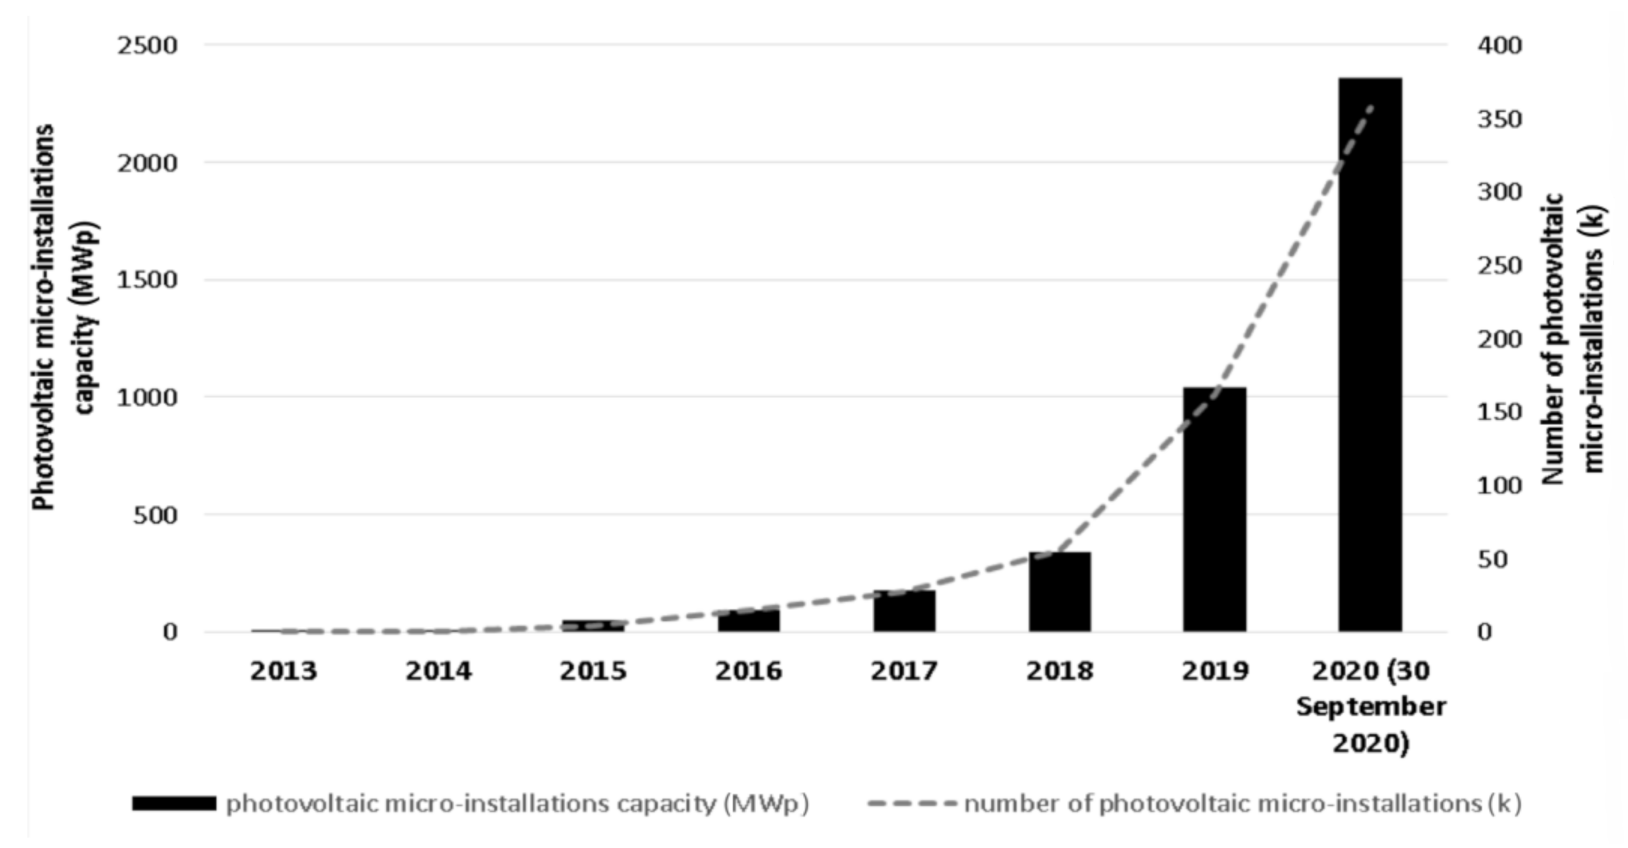
15]. Despite the closure or restriction of activities in some sectors of the economy due to the COVID-19 pandemic, the PV industry has not slowed down, quite the contrary. Installed capacity in Poland at the end of 2020 exceeded 3.5 GW, whereas at the end of 2019 it was almost 1.5 GW. This means an annual increase of over 150%. Poland has become the 4th market in the EU and aspires to be in the top 10 of global markets. In
Figure 1 is shown the cumulative diagram of total installed capacity and the number of photovoltaic micro-installations in Poland in years 2013–2020 (till 30 September 2020).
Due to the observed huge growth of installed photovoltaic micro-installations in Poland, in some low-voltage networks, energy from PVs became the main factor determining the energy flow direction, voltage levels and their imbalance. This mainly concerns rural low-voltage networks, which are characterised by low-load profile in noon hours (high generation hours), long low-voltage feeders (up to 1 km) and small cross-sections of conductors (predominantly these are bare aluminum conductors of 50 mm
2). As a result, in combination with a high simultaneous energy generation coefficient (often close to 1), photovoltaic micro-installations significantly increase the RMS (root-mean-square) voltage at the point of common coupling above 253 V, a permissible limit for the low-voltage networks specified in [
17], which trips the micro-installations’ overvoltage protection system. This is often the main reason for complaints to distribution system operators (DSOs) from surprised prosumers who expect full production of electricity from photovoltaic micro-installations on a sunny summer day.
Besides voltage rise, photovoltaic micro-installations can also cause other negative impacts on distribution networks. In references [
18,
19,
20], there are listed the most common issues of PV distributed generation, which include:
Phase voltage and current imbalance (mainly regarding single-phase PV micro-installations);
Reverse power flow (radial electrical networks have been designed to withstand unidirectional power flow, so reverse power flow can lead to distribution line overload and can also be problematic for protection devices);
Increased power losses (which applies to a situation where reverse power flow occurs in radial low-voltage networks for which downgrading of the cross-section of conductors along feeders was applied);
Current distortion (current harmonics distort the waveform of supply voltage, which can lead to malfunction of protection devices and also cause increased power losses in power lines and transformers).
The photovoltaic inverter is the heart of any photovoltaic micro-installation responsible for the DC-AC conversion of current and voltage, therefore, many concerns are focused on its operation, because its design quality may have significant influence on the safety, performance and reliable operation of the power system and power quality at the point of common coupling in low-voltage networks. In order to ensure appropriate operation of photovoltaic inverters, in the point of view of transmission system operators (TSOs) and DSOs, including limiting the phenomenon of increasing the RMS voltage caused by the generation of electrical energy, a number of requirements have been formulated for micro-installations, which are specified in the EU network code NC RfG [
21], the standard EN 50549-1:2019 [
22] and the internal document of Polish DSOs [
23], which are presented and described in
Section 2.
An important provision of the EU network code NC RfG [
21], regarding the process of connecting type A power-generating modules (in Poland, these are modules with a capacity up to 200 kW, including micro-installations), is the requirement put on prosumers of submitting to DSOs the so-called “equipment certificate”. This is a document issued by an entity with accreditation given by the national affiliate of the European co-operation for Accreditation (EA), confirming that a given power-generating module meets the requirements of the EU network code NC RfG [
21]. However, this provision will apply in Poland after 27 April 2021, due to the present lack of developed rules and procedures for such certification. Up to this date, declarations of conformity issued by the equipment manufacturer are valid. This situation, during the transitional period, can mean that manufacturers, driven by the desire for a quick profit, can issue “empty” declarations of conformity to get access and sell their products in EU member states.
Furthermore, in references [
24,
25,
26,
27,
28,
29], different desired requirements of PV inverters are discussed. Reference [
24] reviews and analyses existing voltage control methods to improve voltage regulation and to increase hosting capacity in low-voltage networks. The authors of the paper propose a coordinated voltage control method, where the local controllers of each PV inverter use reactive power control mode Q = f(U) and, if necessary, the active power curtailment P = f(U) based on the local voltage measurement and the predetermined settings calculated by the supervision control unit. Performed simulations showed that the advantage of this method is that the calculated reactive power and the active power droop settings allow a fair contribution of each PV inverter to the voltage regulation. In reference [
25], the authors review various reactive power control methods and propose a centralised reactive power management and coordination of modified reactive power control mode Q = f(U) for allocating the reactive power to PV systems. Performed simulations showed that the proposed method can regulate voltages better than the regulation based on non-centralised reactive power control using standard Q = f(U) characteristics. In reference [
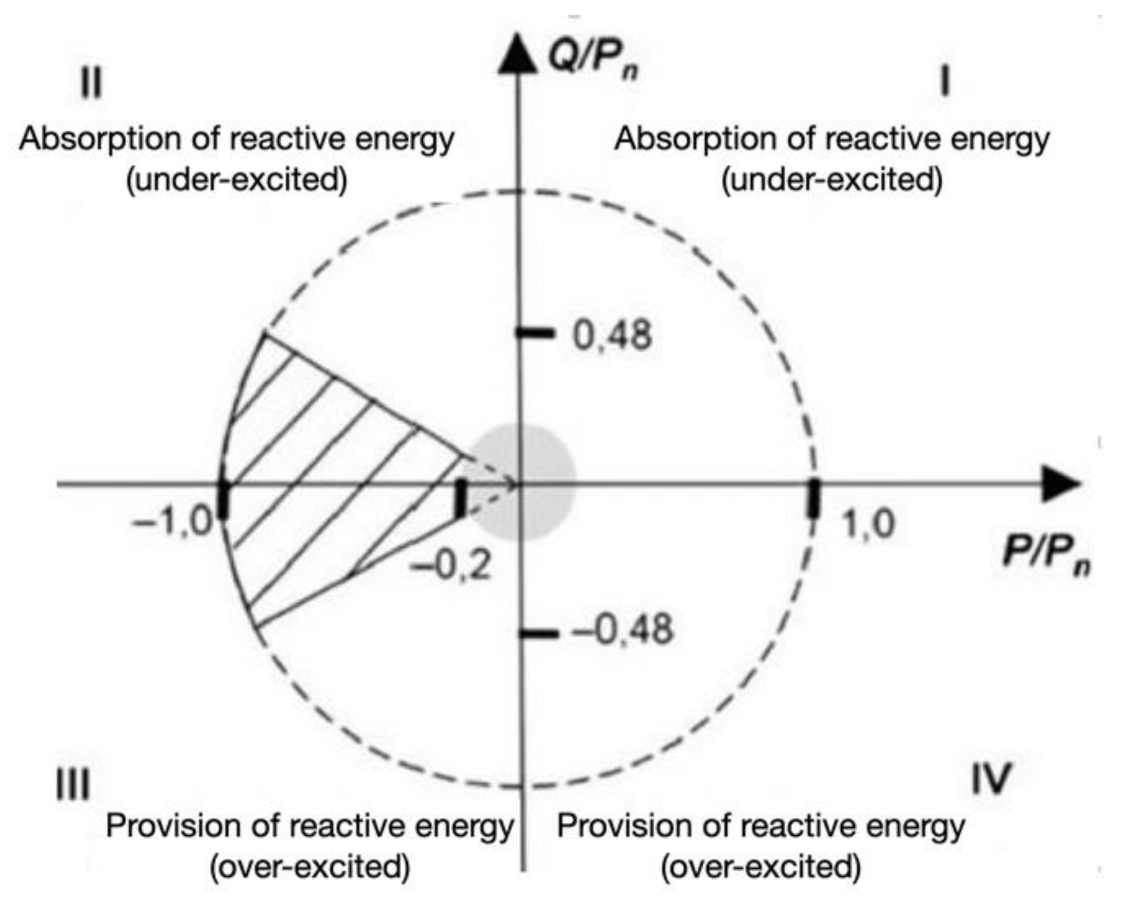
26], the authors give an overview on the necessary features of grid-connected inverters, which according to the German grid codes, should contribute to:
Reactive power exchange and voltage control;
Under-voltage ride through (UVRT) support in case of balanced faults;
Defined behavior in case of unbalanced faults;
Post-fault active power recovery.
Performed simulations showed that the implemented abovementioned additional abilities of the grid-connected inverters improved power quality at the point of connection and contributed to their safety and smooth operation. In reference [
27], the authors, in terms of the Horizon 2020 InterFlex project, conducted research on increasing micro-installation hosting capacity in low-voltage networks by activating reactive and active power control characteristics in PV inverters. The authors conducted theoretical and practical analysis in three selected low-voltage networks located in the Czech Republic. The obtained results showed that activating the abovementioned characteristics can increase hosting capacity from 20% to 60% depending on feeder electrical parameters and micro-installation placement along the feeder. The Czech Republic DSO plans to take action to implement control functions in its network code. In reference [
28], the authors propose a control system for PV inverters to increase the UVRT immunity in a high X/R network ratio. Performed simulations showed that the injection of active power into the network during voltage sag operation improves the voltage profile at the point of PV inverter connection. In reference [
29], the authors review various national grid code requirements for UVRT immunity (e.g., Poland, Spain, Germany, Italy and the United Kingdom). The authors noticed that requirements for UVRT immunity vary from country to country. A common feature is that almost all of the selected countries have defined the minimum recovery time and duration of PV inverters staying connected to the network during fault occurrence. The authors also concluded that inverter manufacturers are facing numerous challenges in the design and implementation of active and reactive power control methods to fulfil different (for each country) UVRT requirements. In reference [
30], the authors propose a new passive islanding detection technique based on the rate of change of voltage (ROCOV) and the ratio of voltage and current magnitudes (VOI) in order to detect all kind of events and distinguish them from islanding conditions. The authors performed simulations of islanding events and non-islanding events, such as a single-phase or three-phase to ground fault, a sudden connection of loads and capacitor bank switching on. The obtained results showed that the proposed method can correctly distinguish islanding conditions from other events that can occur in the network. The authors also highlight that the proposed method can be easily implemented in PV inverters or in protection systems of distribution networks.
The authors of this paper would like to highlight that there is a small and insufficient number of publications that describe and analyse practical research on requirements of PV inverters with accordance to the EU network code NC RfG [
21] and the standard EN 50549-1:2019 [
22]. Only in reference [
31] have the authors carried out similar research, but limited only to the active power response to overfrequency in a power system (which is briefly described in
Section 3.1). This is only one of many other requirements that are specified in documents [
21,
22]. Due to this fact, the authors have decided to fill this gap and conduct practical experiments on selected PV inverters according to the most important requirements presented in documents [
21,
22], the fulfilment of which should contribute to the reliable and safe operation of transmission and distribution electrical networks.
3. Photovoltaic Inverters, Experimental Platform Setup and Test Results
This study is performed on three PV inverters of two manufacturers, both from outside the EU. These were low-price devices (ca. EUR 450 for the single-phase and ca. EUR 900 for the three-phase PV inverter), which are quite popular and widely available on Polish and EU markets. They were made available for the purpose of this research by a local PV installer and prosumer, and both had some doubts about their quality and performance and were unable to judge these on their own. All tested inverters were labelled with CE marking and had a declaration of conformity with the EU network code NC RfG [
21] and the standard EN 50549-1:2019 [
22]. Inverters X and Y were configured to operate in accordance with the Polish Grid Code (user interface settings: Grid Code → Poland). A third inverter, Z, was uninstalled from the prosumer photovoltaic installation site which was configured by the authorised installer and connected to the low-voltage network in 2020. The list of tested photovoltaic inverters is presented in
Table 3.
The experimental platform for photovoltaic inverter tests was built in the Power Quality Laboratory of AGH University of Science and Technology in Cracow, Poland, based on the technical report IEC TR61000-3-15:2011 [
35], specifying the low-frequency electromagnetic compatibility testing method for dispersed generation systems, and other similar experimental platforms presented in publications [
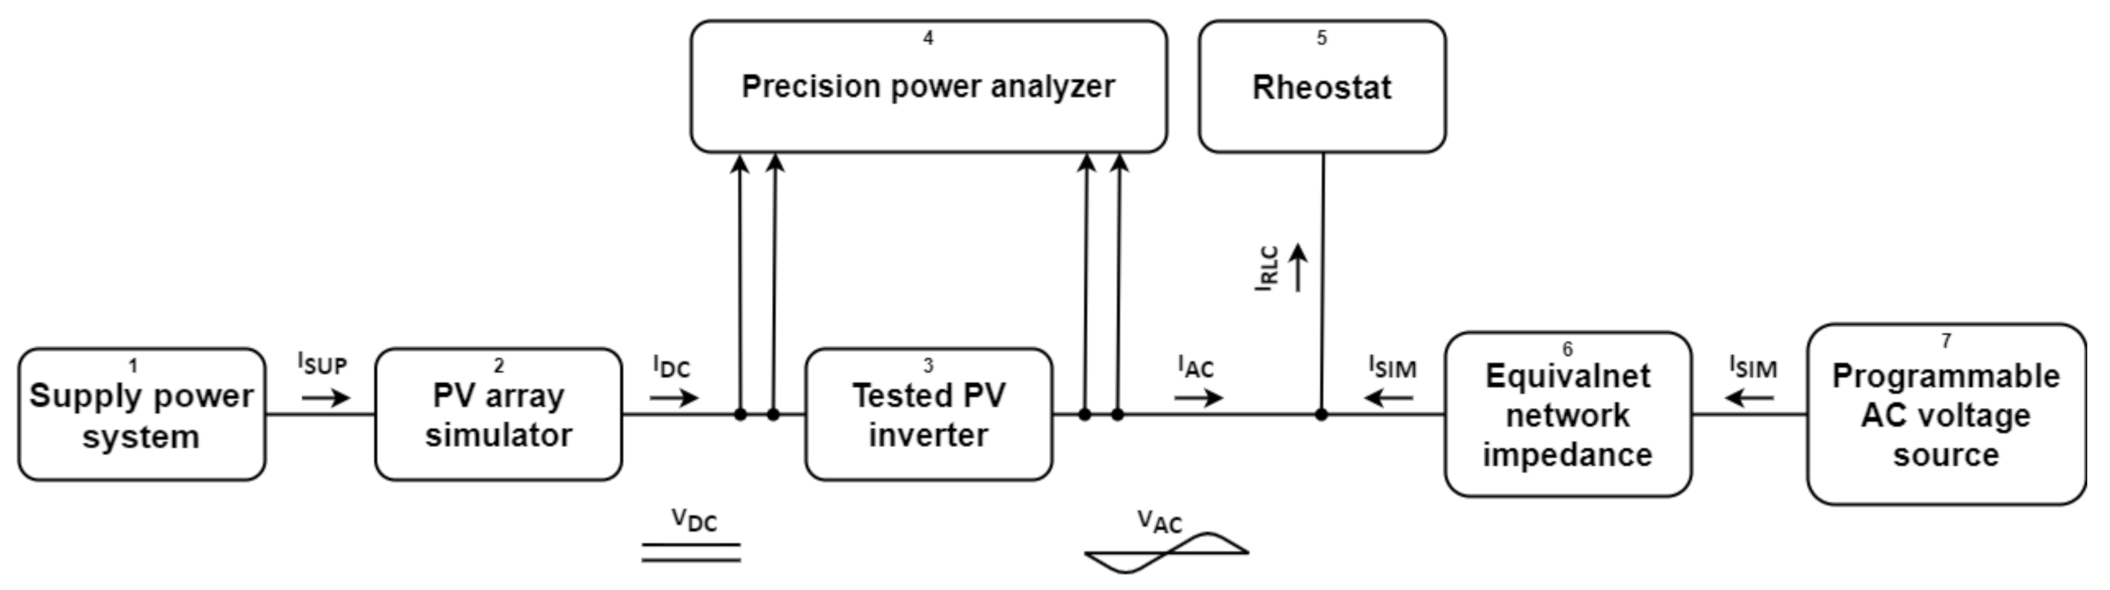
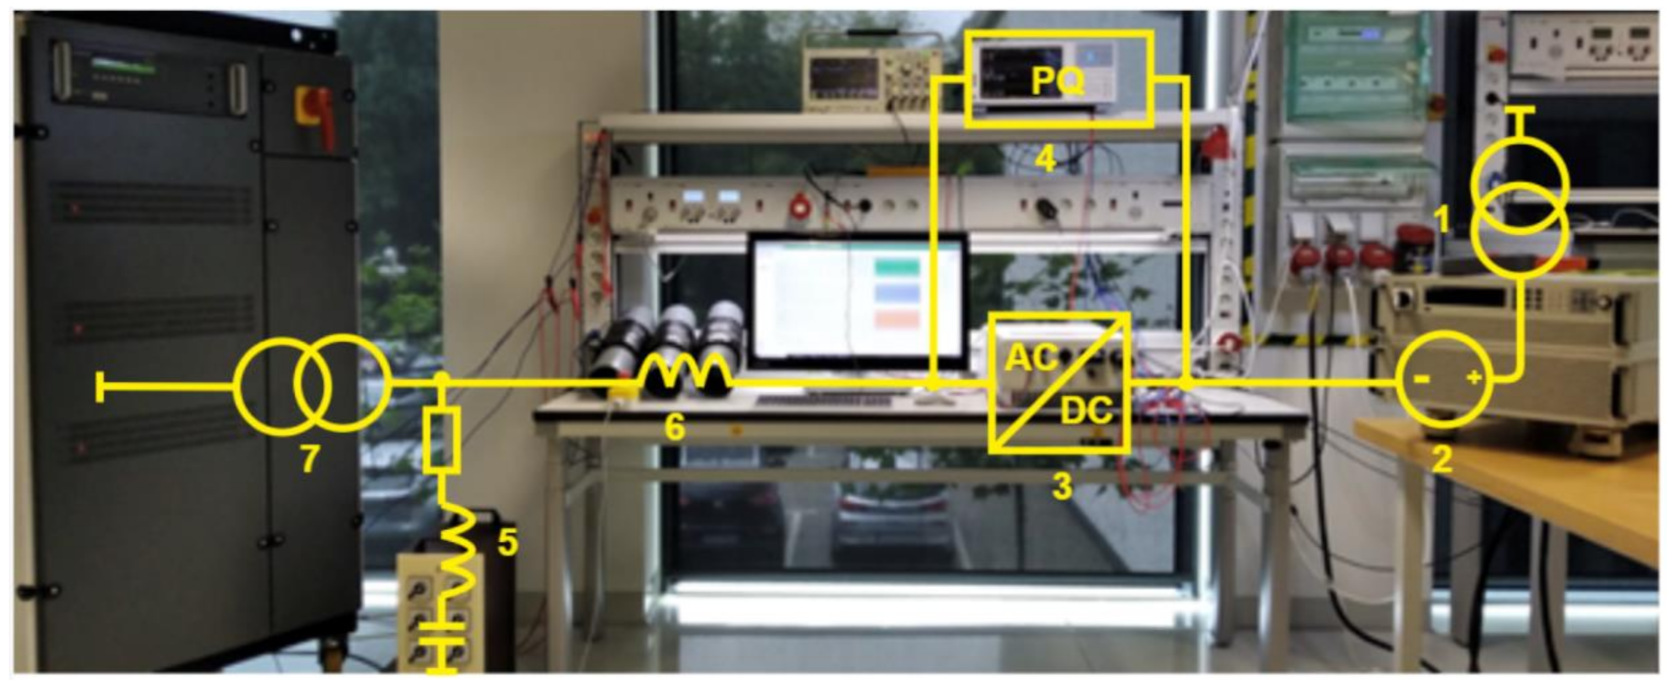
36]. The experimental platform block diagram is shown in
Figure 7.
The tested photovoltaic inverter (3) is supplied on the DC side by the photovoltaic array simulator (2) (DC source with adjustable current–voltage I = f(U) characteristics). The inverter AC side is connected via a grid impedance element (6), with the resistance equal to 320 (mΩ) and the inductance equal to 1.43 (mH), to the electrical network simulator (7), a programmable AC source 3 × 230 V, which allows for adjusting the voltage and the frequency at its output.
An additional element of the experimental platform is the regulated passive load (rheostat) (5), whose role is to balance the power generated by the tested inverter, thus it protects the electrical network simulator (7) from the power flow towards that device. On both sides of the tested inverter, powers, voltages and currents are measured using the power analyser Yokogawa WT5000 (4). A picture of the experimental platform is shown in
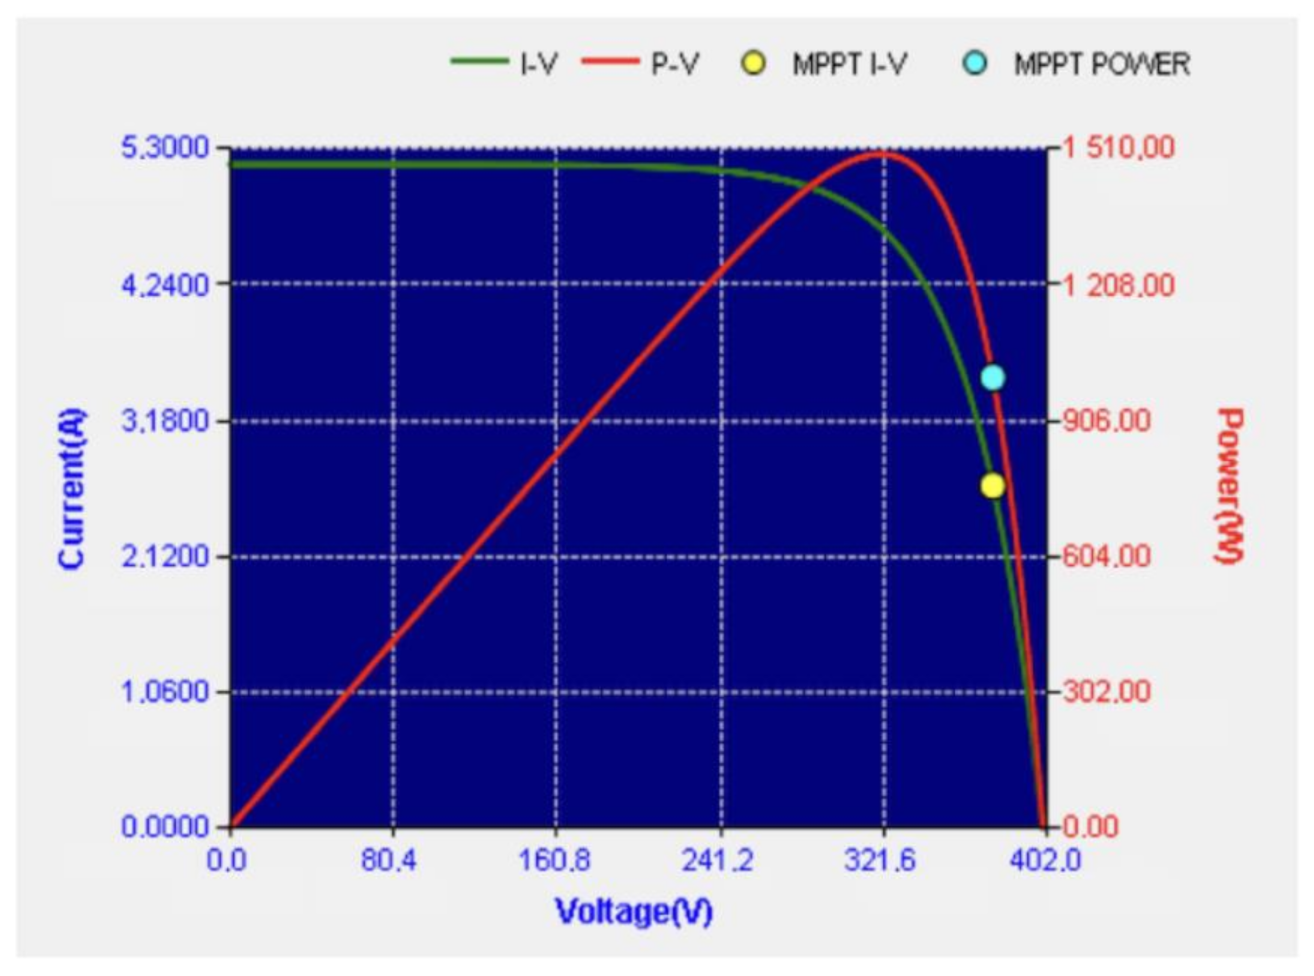
Figure 8 and an example of the current–voltage I = f(U) characteristic is shown in
Figure 9.
3.1. Test 1—Inverter Response to a Frequency Increase
The signal from the photovoltaic array simulator was supplied to the DC terminals of tested inverters in the form of current–voltage I = f(U) characteristics corresponding to the DC active power of the photovoltaic array P
PV = 1.5 kW (for a single-phase inverter, X) and P
PV = 1.25 kW (for three-phase inverters, Y and Z). Then, after the inverters reached the steady state, corresponding to the maximum possible active power generation resulting from the previously set DC active power of the photovoltaic array P
PV, the frequency of the electrical network simulator was changed in the range of 50.0 to 51.9 Hz with a step of 0.1 Hz. For each frequency step, the values of test settings of frequency and DC power P
DC and measured results, AC active power P
AC, inverter efficiency η
e (2) and the maximum power point tracking (MPPT) efficiency η
MPPT (which was calculated by the photovoltaic array simulator) were measured and are collected in
Appendix A:
Table A1 (for the single-phase inverter X),
Table A2 (for the three-phase inverter Y) and
Table A3 (for the three-phase inverter Z).
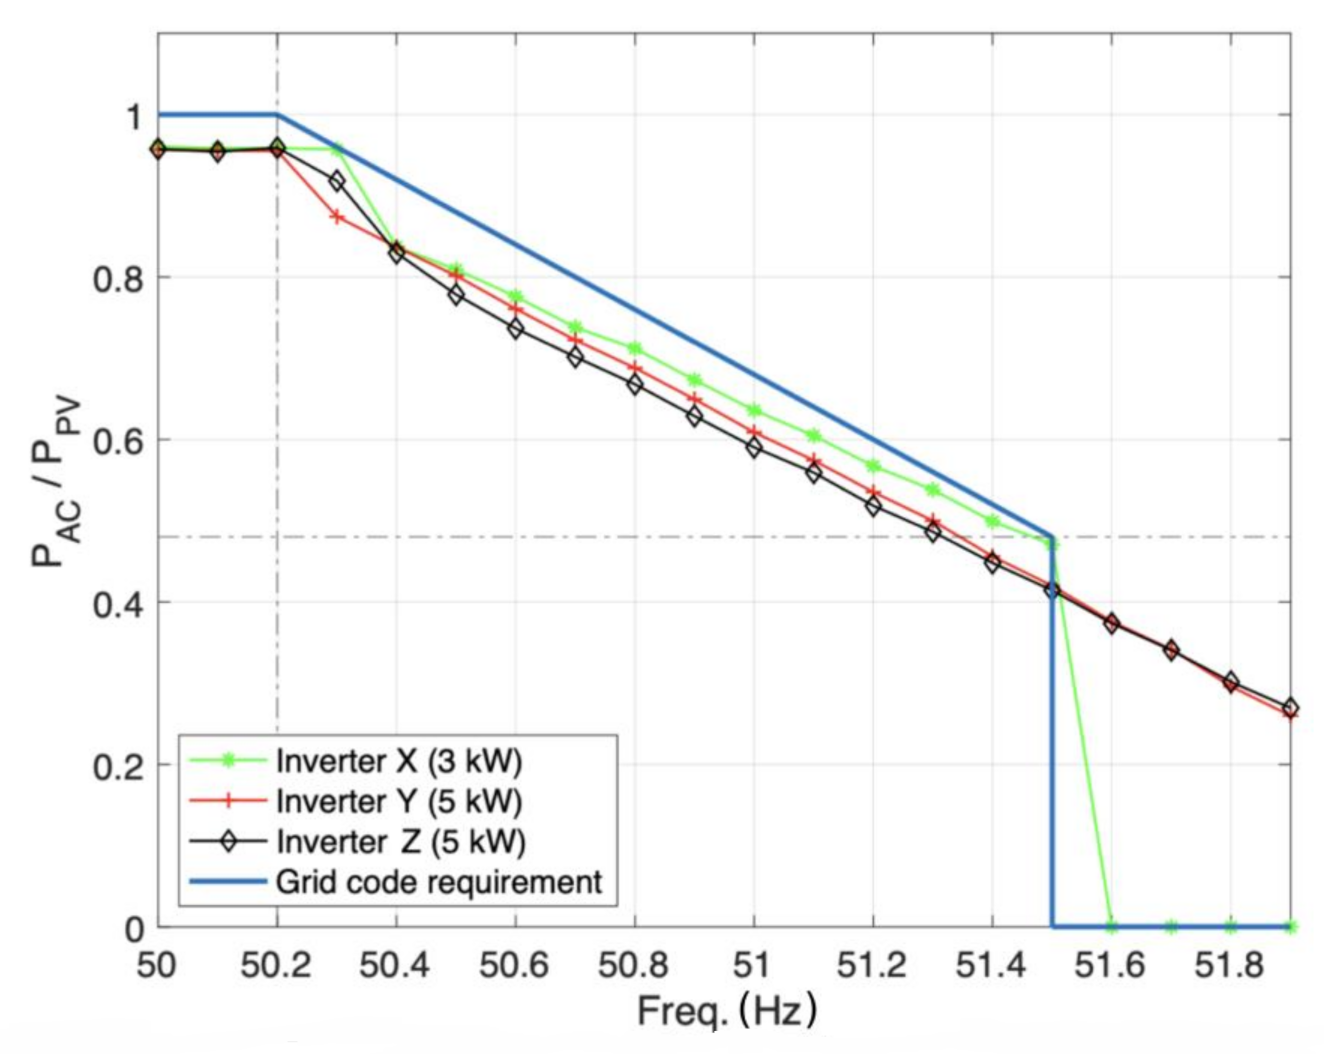
Figure 10 presents the active power response to overfrequency of all tested photovoltaic inverters X, Y, Z.
The η
e efficiency is calculated from the relationship:
The obtained results, which are collected in
Table A1,
Table A2 and
Table A3 and presented in
Figure 10, indicate that all tested inverters responded to an increase in the frequency above 50.2 Hz with a decrease in the active power generation. Active power reduction in the range of 50.2–52 Hz corresponds to the requirements of the EU network code NC RfG [
21]. For frequencies starting from 51.5 Hz, inverter X turned off, while inverters Y and Z continued to reduce active power generation according to the set 5% programmable droop. The operation of all three inverters is in accordance with the requirements of EU network code NC RfG [
21] and the standard [
22], because the minimum requirements presented in
Table 1 allow an inverter to operate at frequencies greater than 51.5 Hz (there are no requirements for the operation time for frequencies greater than 51.5 Hz). The operation of the PV inverter X is not in accordance with the internal Polish DSOs’ document [
23], because it requires a PV inverter to continuously operate with overfrequency equal to 52 Hz.
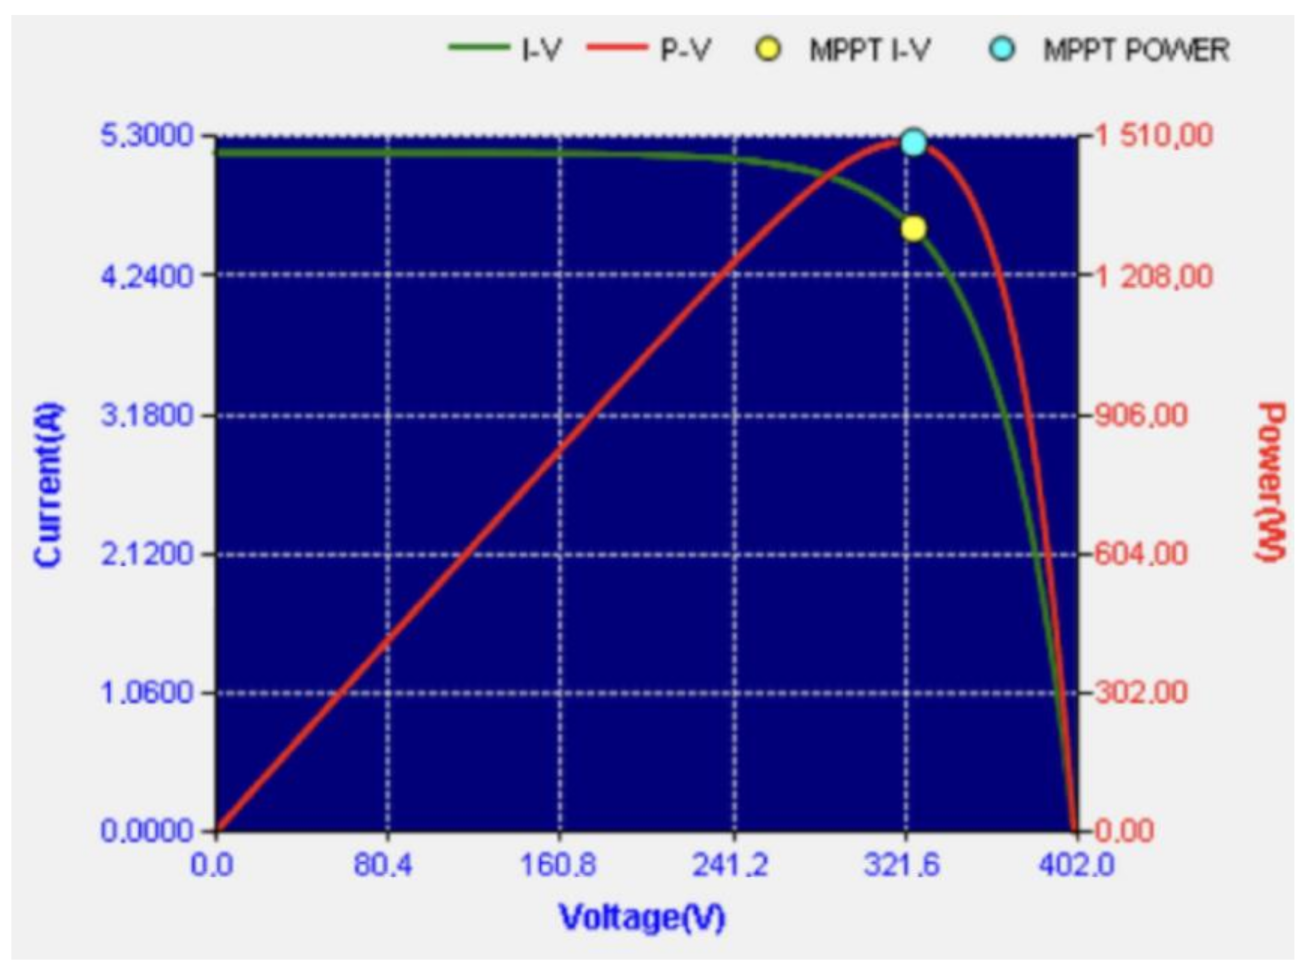
The results presented in
Table A1,
Table A2 and
Table A3, especially the maximum power point tracking (MPPT) efficiency η
MPPT, show that limiting the active power generation with the increase in frequency is realised by shifting the operating point beyond the maximum active power point on the current–voltage I = f(U) characteristic. An example of such an observation is presented in
Figure 11.
A similar test, although limited to the frequency response, was conducted by Mastny et al. [
30], who investigated six PV inverters from two manufacturers, two single-phase (with nominal power of 3.6 kW) and four three-phase PV inverters (with nominal power in the range of 3–10 kW). The experiment results showed that only one inverter fully complied with the EU network code NC RfG [
21]. The remaining five inverters fulfilled the EU network code NC RfG [
21] only partially or not at all. Their abnormal operation involved unfounded automatic disconnection from a network (one three-phase PV inverter), incorrectly performed frequency droop characteristic (four three-phase PV inverters) and a sudden drop in generated active power (one single-phase PV inverter and one three-phase PV inverter). One of the authors’ conclusions is an urgent need for developing a certain verification mechanism for a large number of PV inverters that are connected to the electrical network.
3.2. Test 2 Inverter Response to a Voltage Increase
The signal from the photovoltaic array simulator was supplied to the DC terminals of tested inverters in the form of current–voltage I = f(U) characteristics corresponding to the DC active power of the photovoltaic array P
PV = 1.5 kW (for a single-phase inverter, X) and P
PV = 5 kW (for three-phase inverters, Y and Z). The DC active power of the photovoltaic array P
PV corresponded to 50% and 100% of the inverter nominal active power for the single-phase inverter X and the three-phase inverters Y and Z, respectively. Then, after the inverters reached the steady state, corresponding to the maximum possible AC active power generation resulting from the photovoltaic array DC active power P
PV, the RMS voltage of the electrical network simulator was changed in the range of 230 to 260 V with a step of 5 V. For each voltage step, the values of DC power P
DC, AC active power P
AC, reactive power Q
AC, inverter efficiency η
e and the maximum power point tracking (MPPT) efficiency η
MPPT (which was calculated by the photovoltaic array simulator) were measured and are collected in
Appendix B:
Table A4 (for the single-phase inverter X),
Table A5 (for the three-phase inverter Y) and
Table A6 (for the three-phase inverter Z).
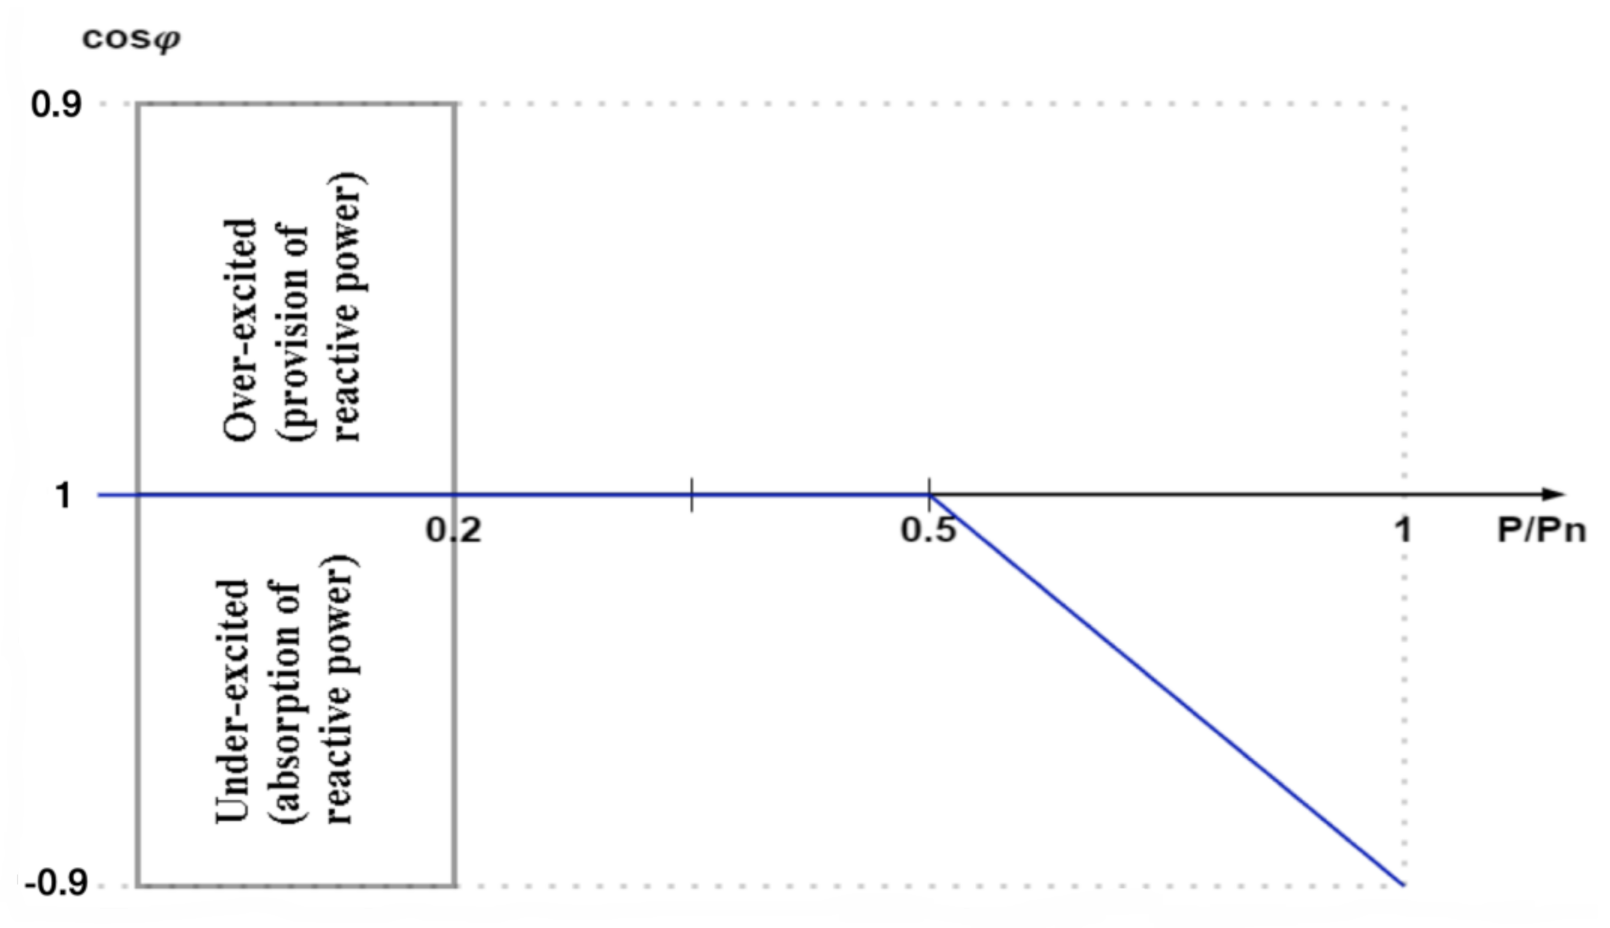
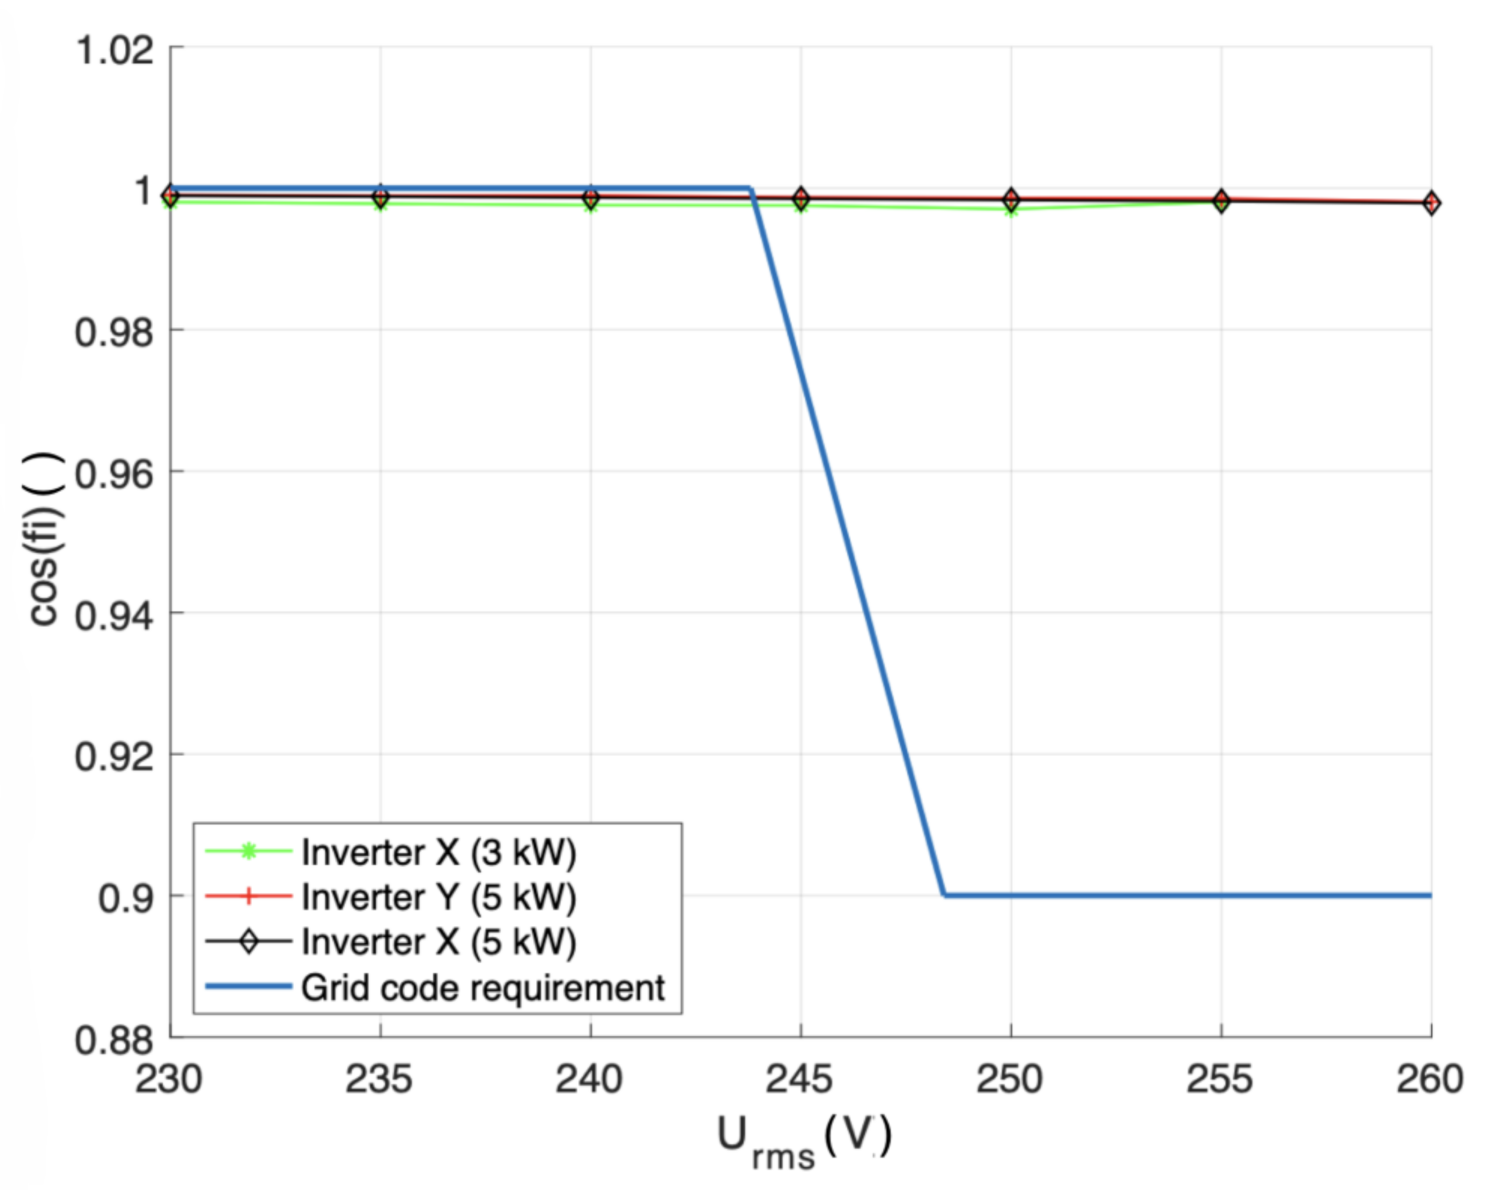
Figure 12 presents the power displacement factor cosφ response to a voltage increase for all tested photovoltaic inverters X, Y, Z.
The obtained results, which are collected in
Table A4,
Table A5 and
Table A6 and presented in
Figure 12, indicate that none of tested inverters responded correctly to the voltage increase by activating one of the permissible reactive power control modes, Q = f(U) or cosφ = f(P). The ability of inverters to operate in one of the mentioned reactive power control modes is very important for prosumers and DSOs, because it would decrease the number of automatic inverter shutdowns caused by overvoltage system protection activation and it would also decrease the number of consumer complaints.
3.3. Test 3—Inverter Active Power Generation Gradient After Automatic Reconnection After Tripping
The signal from the photovoltaic array simulator was supplied to the DC side of the tested three-phase inverters Y and Z in the form of current–voltage I = f(U) characteristics corresponding to the DC active power of the photovoltaic array P
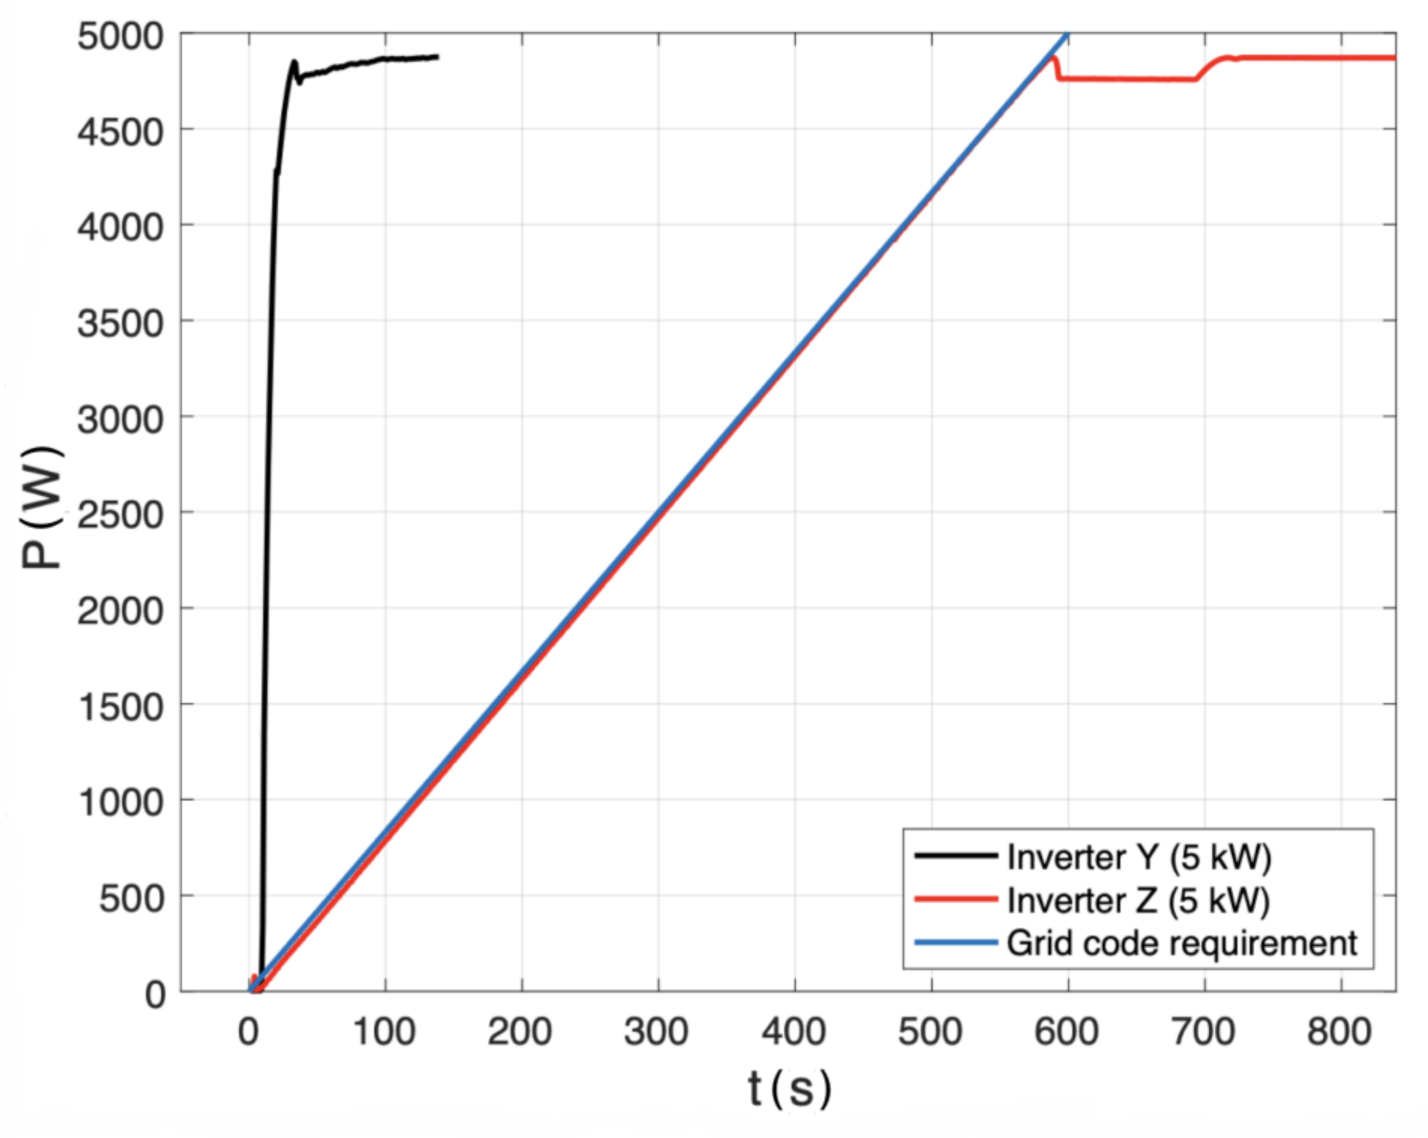
PV = 5 kW (which is equal to 100% of the inverter nominal active power). The total output AC active power measurements were carried out using a PQBOX-300 power quality analyser with 1 s mean RMS voltage and current aggregation time in order to measure the maximum active power gradient increase. The obtained results are shown in
Figure 13.
According to the requirements presented in the EU network code NC RfG [
21] and the standard [
22], the permissible active power generation gradient growth shall not exceed 10% of the inverter nominal active power per minute. This means that the inverter nominal AC active power shall be achieved in 10 min. As can be seen in
Figure 13, this requirement was only met by the inverter Z. The inverter Y reached its nominal AC active power in just 28 s, which does not fulfil the EU network code NC RfG [
21] and the standard [
22].
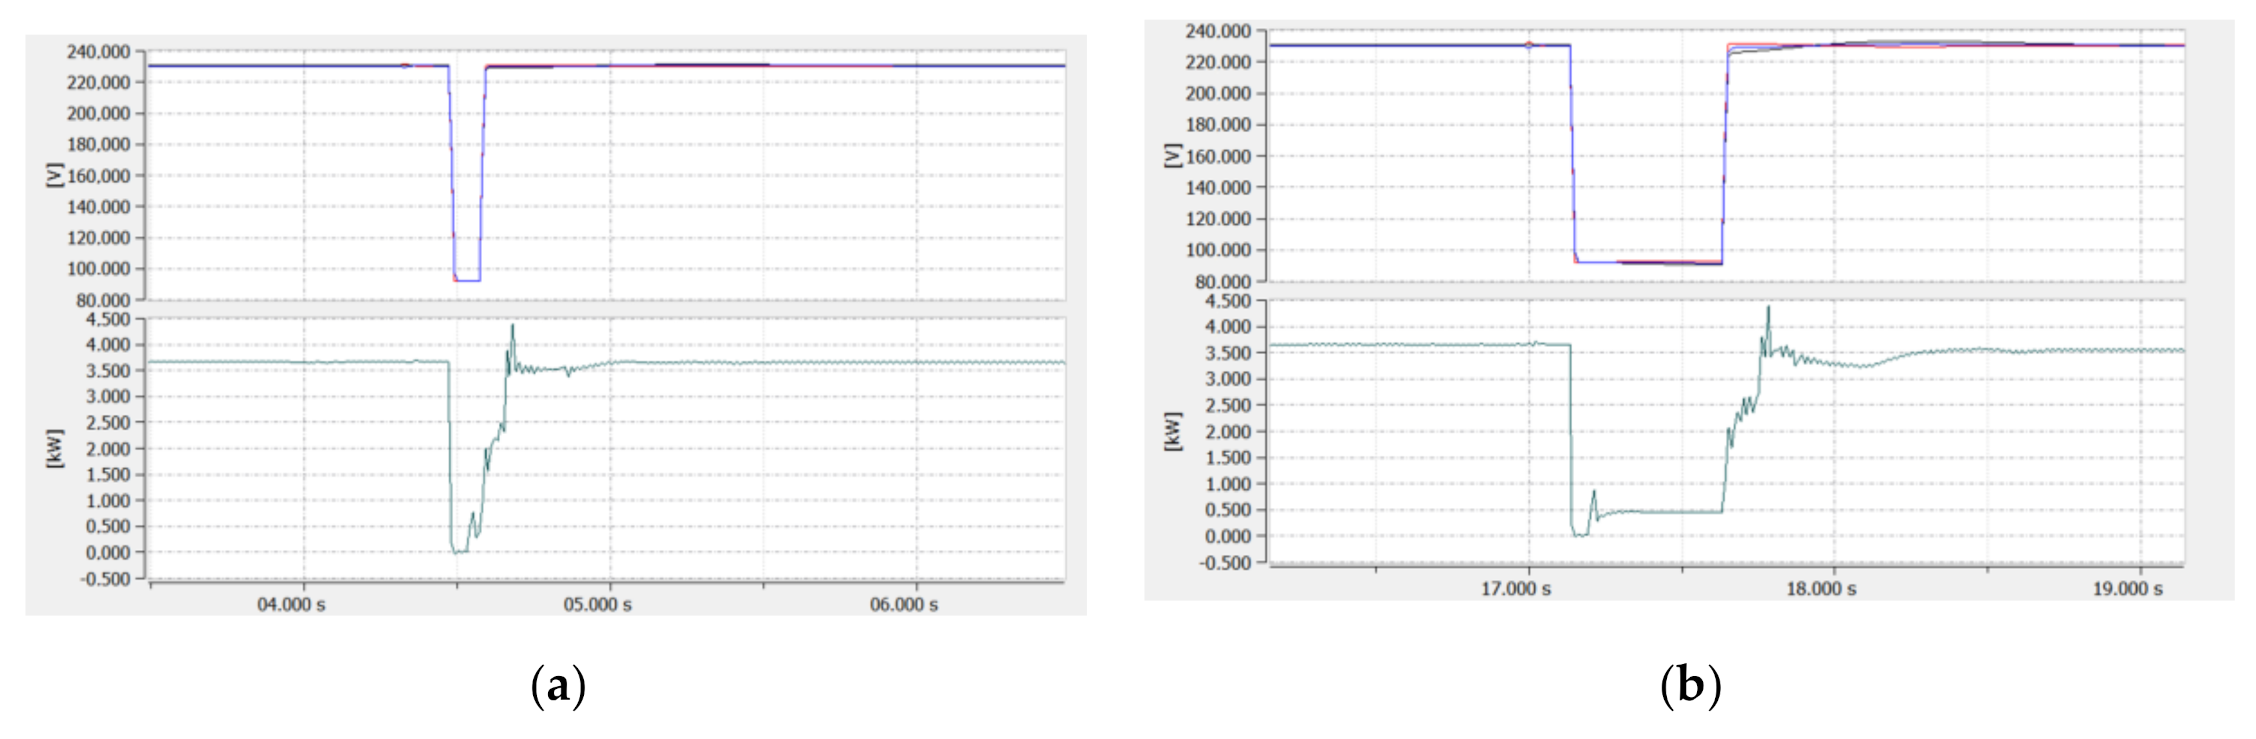
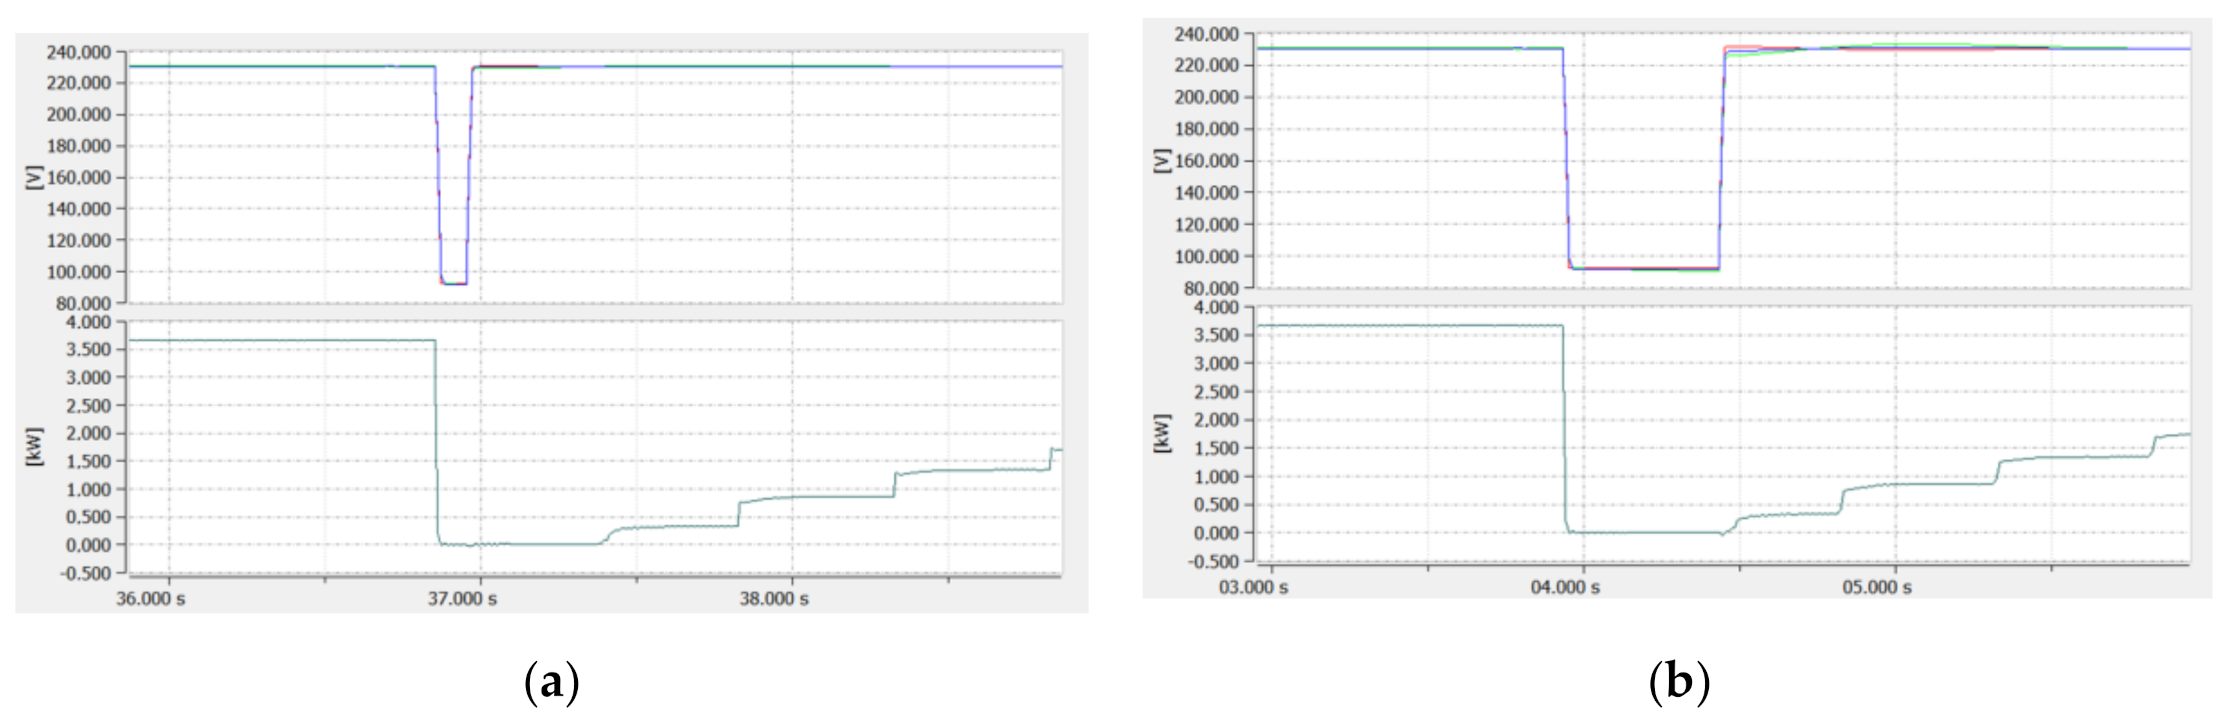
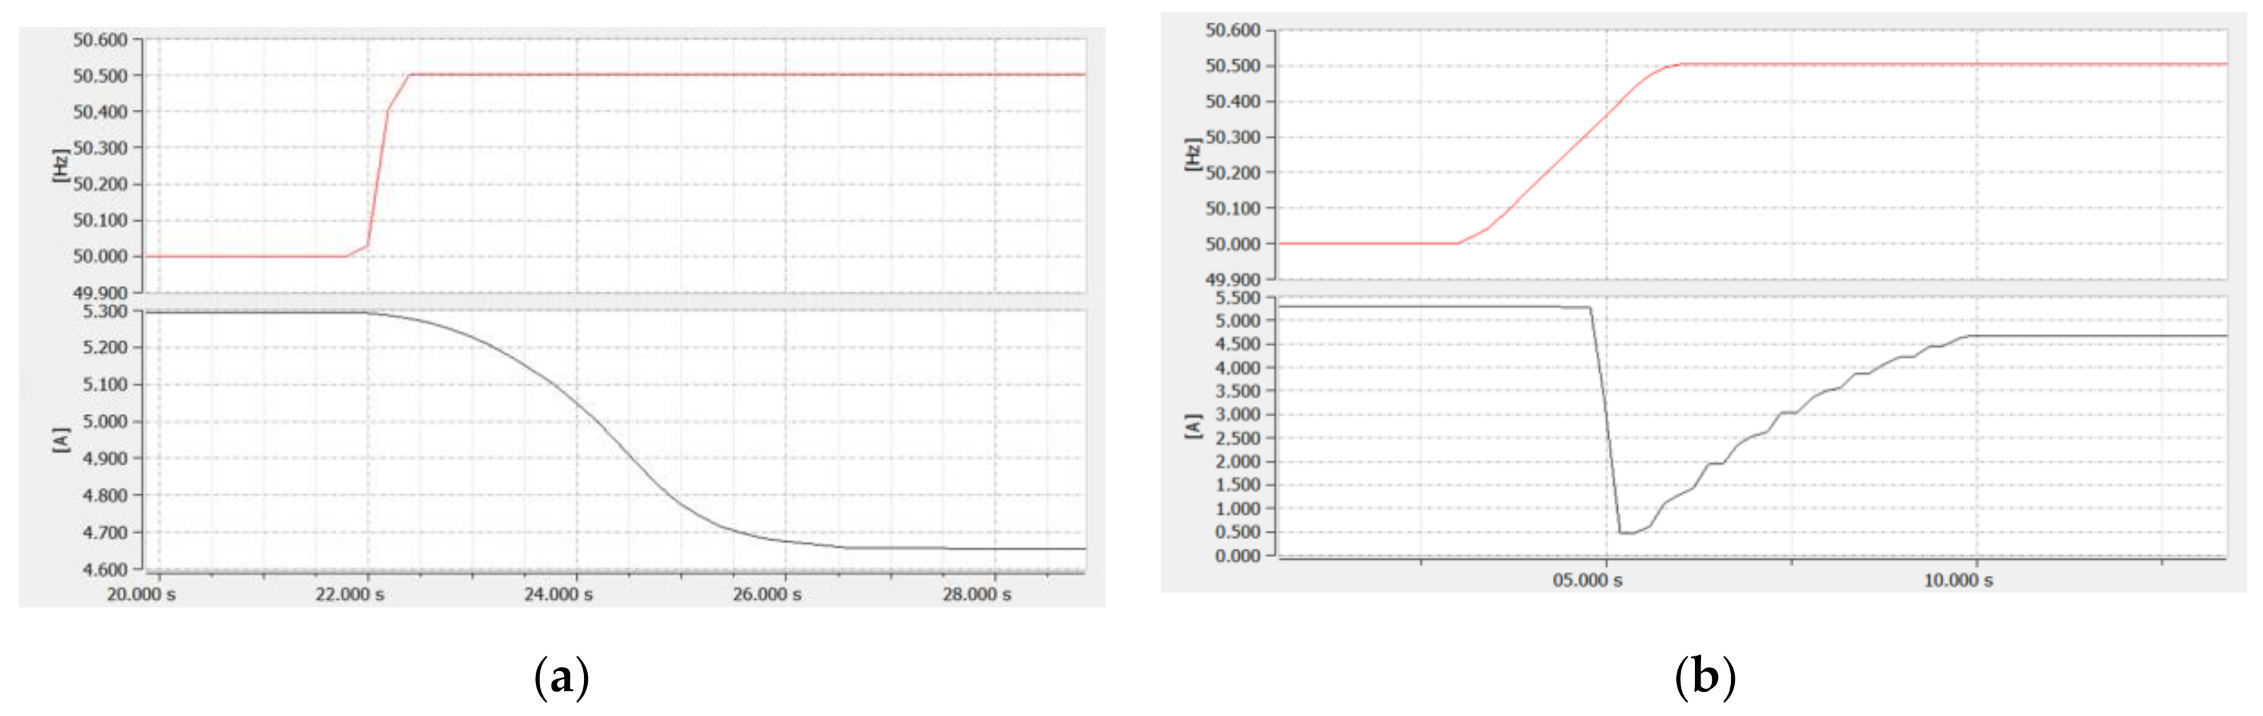
3.4. Test 4—Inverter Immunity to Disturbances—Under-Voltage Ride Through (UVRT)
The under-voltage ride through (UVRT) requirement was checked for the inverters Y and Z. During the test, the signal from the photovoltaic array simulator was connected to the DC side of the tested inverters in the form of current–voltage I = f(U) characteristics corresponding to the DC active power of the photovoltaic array P
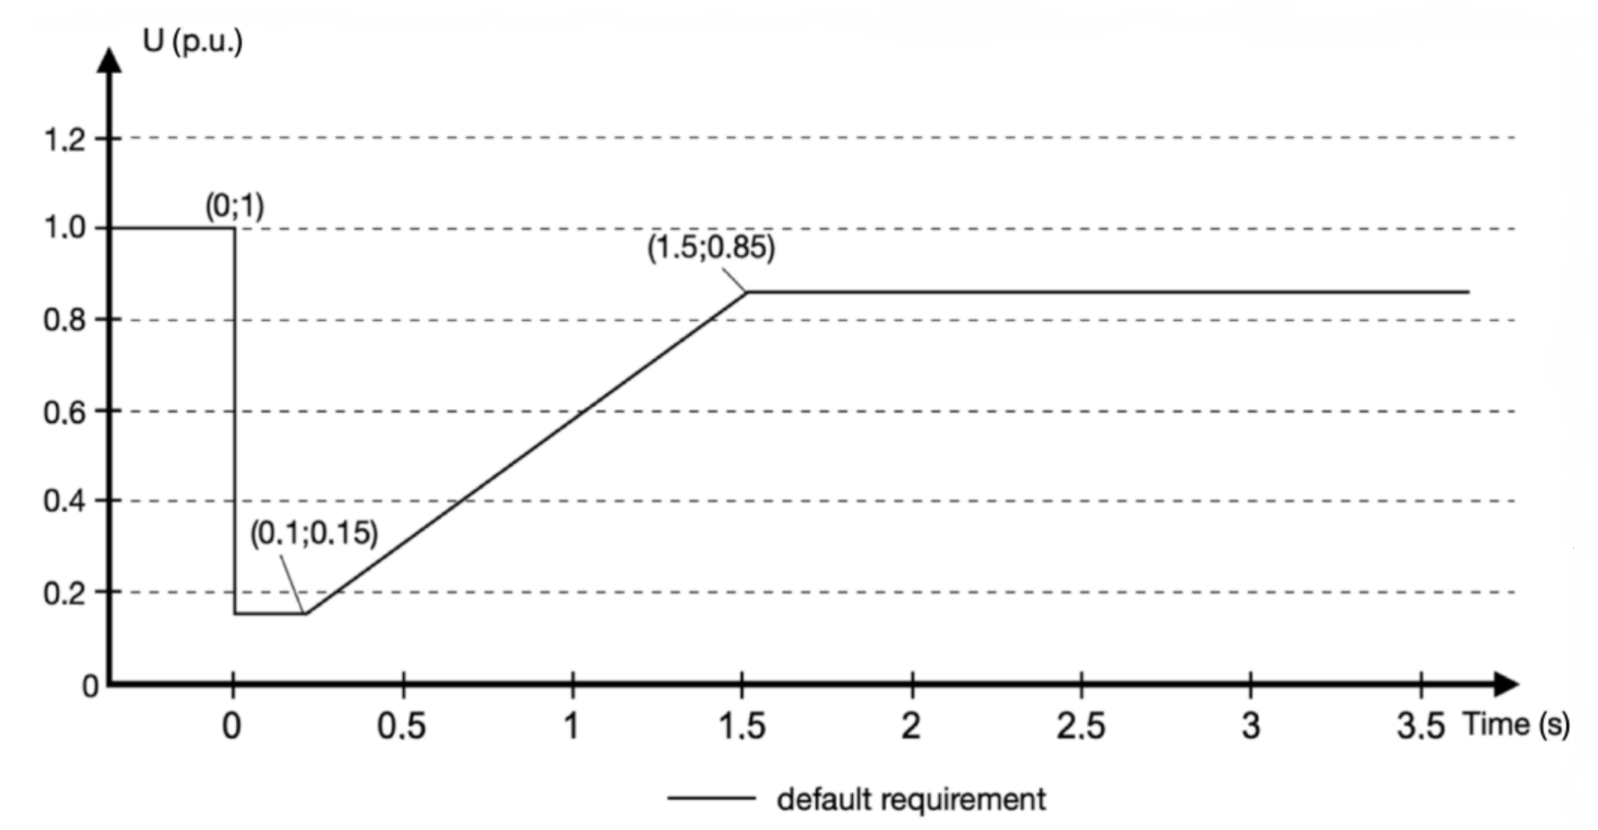
PV = 3.75 kW (which is equal to 75% of the inverter nominal active power). The total output AC active power measurements were carried out using a PQBOX-300 power quality analyser with 10 ms RMS aggregation time. Recordings of AC voltages and output AC power during generated 60% depth voltage sag lasting 100 ms and 500 ms, i.e., events which were expected to be demanding for the inverters but located above the curve in
Figure 6, are presented in
Figure 14 and
Figure 15.
It can be seen that during both voltage sags, power generation of each inverter was reduced to zero, despite the fact that the residual voltage of the sag was 40% of the nominal voltage. This means that the power generation was stopped for a moment, however, none of the inverters was disconnected from the network or indicated any incorrect operation. After voltage returned to the nominal value, inverter Y during both voltage sags resumed full pre-fault power generation in less than 0.25 s, which fulfils the requirement resulting from the EU network code NC RfG [
21] and the standard [
22]. In turn, inverter Z did not meet this requirement for both voltage sags, since it needed approximately 10 s for resumption to 90% of pre-fault power, which is not as required by [
21,
22].
It is worth noting that the EU network code NC RfG [
21] and the standard [
22] do not define the active power generation drop during sag periods. As can be seen in
Figure 14, despite the fact that power generation dropped to zero, operation of the inverter Y complies with the documents [
21,
22], where they only define how fast power generation should be resumed, but do not mention the maximum level of power generation drop. The authors can imagine a situation of a deep voltage sag on a high-voltage power line (e.g., caused by a lightning strike) that could cause the sudden and simultaneous power generation drop of thousands of photovoltaic micro-installations. That circumstance could lead to the situation that occurred in the United Kingdom (UK) on 9 August 2019 described in
Section 2.3.
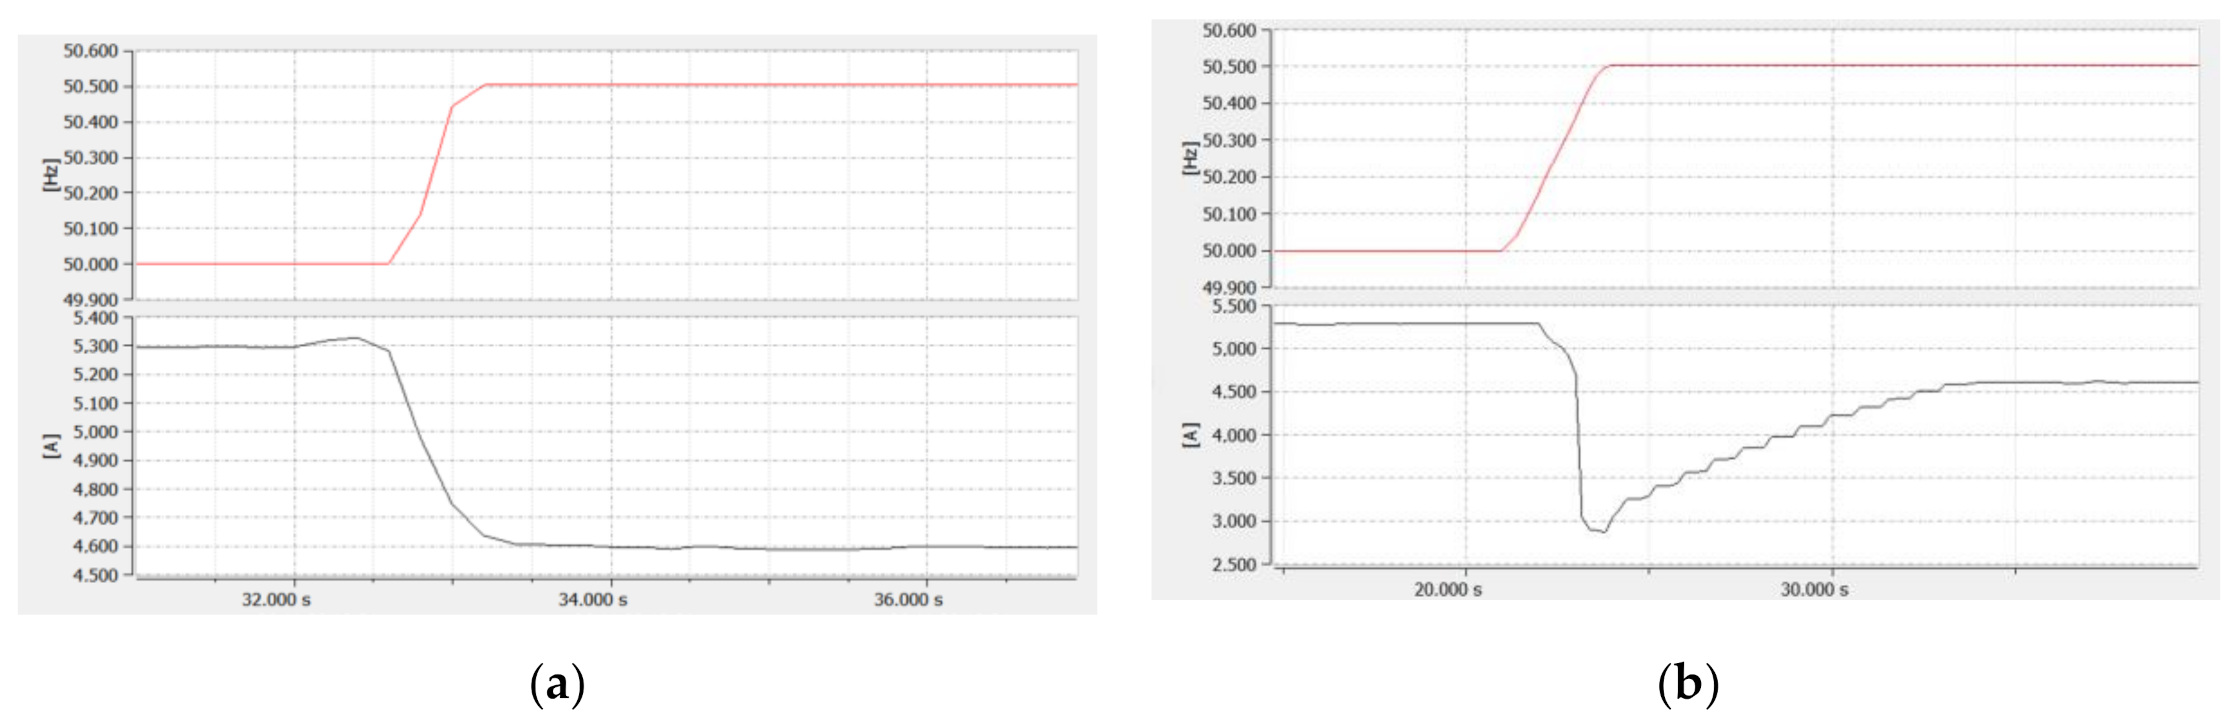
3.5. Test 5—Inverter Immunity to Disturbances—Rate of Change of Frequency (ROCOF)
The ROCOF immunity was checked for the inverters Y and Z. During the test, the signal from the photovoltaic array simulator was connected to the DC side of the tested inverters in the form of current–voltage I = f(U) characteristics corresponding to the DC active power of the photovoltaic array P
PV = 3.75 kW (which is equal to 75% of the inverter nominal active power). The frequency and phase current (corresponding to active power) measurements were carried out using a PQBOX-300 power quality analyser with a 200 ms aggregation window. Inverters’ responses to 0.5 Hz changes of frequency lasting 500 ms and 2500 ms, which correspond to 1 Hz/s and 0.2 Hz/s, respectively, are presented in
Figure 16 and
Figure 17.
It can be seen that the rate of 0.5 Hz/500 ms (equal to 1 Hz/s) of change of frequency does not negatively affect the operation of the tested inverters. They continue power generation with a slight reduction as required by the EU network code NC RfG [
21] and the standard [
22]. The observation is different when the 0.5 Hz frequency change duration is longer over time, e.g., 2500 ms (equal to 0.2 Hz/s). For that case, both inverters reduce their power generation over 90% and need from 5 s to 5 min for power recovery. During the tests, none of the inverters was disconnected from the network or indicated any incorrect operation.
4. Conclusions
The paper presents selected PV inverters’ requirements concerning photovoltaic micro-installation operation in low-voltage distribution networks in Poland and the EU. The laboratory test results of three, imported but widely available in the EU, low-price PV inverters are presented. The conducted tests have proven that, despite precisely defined technical requirements, the current formula for the connection procedure of PV micro-installations allows the connection of PV inverters that do not meet the requirements of the EU network code NC RfG [
21], applicable standard [
22] and internal DSOs’ document [
23]. Detailed results are as follows:
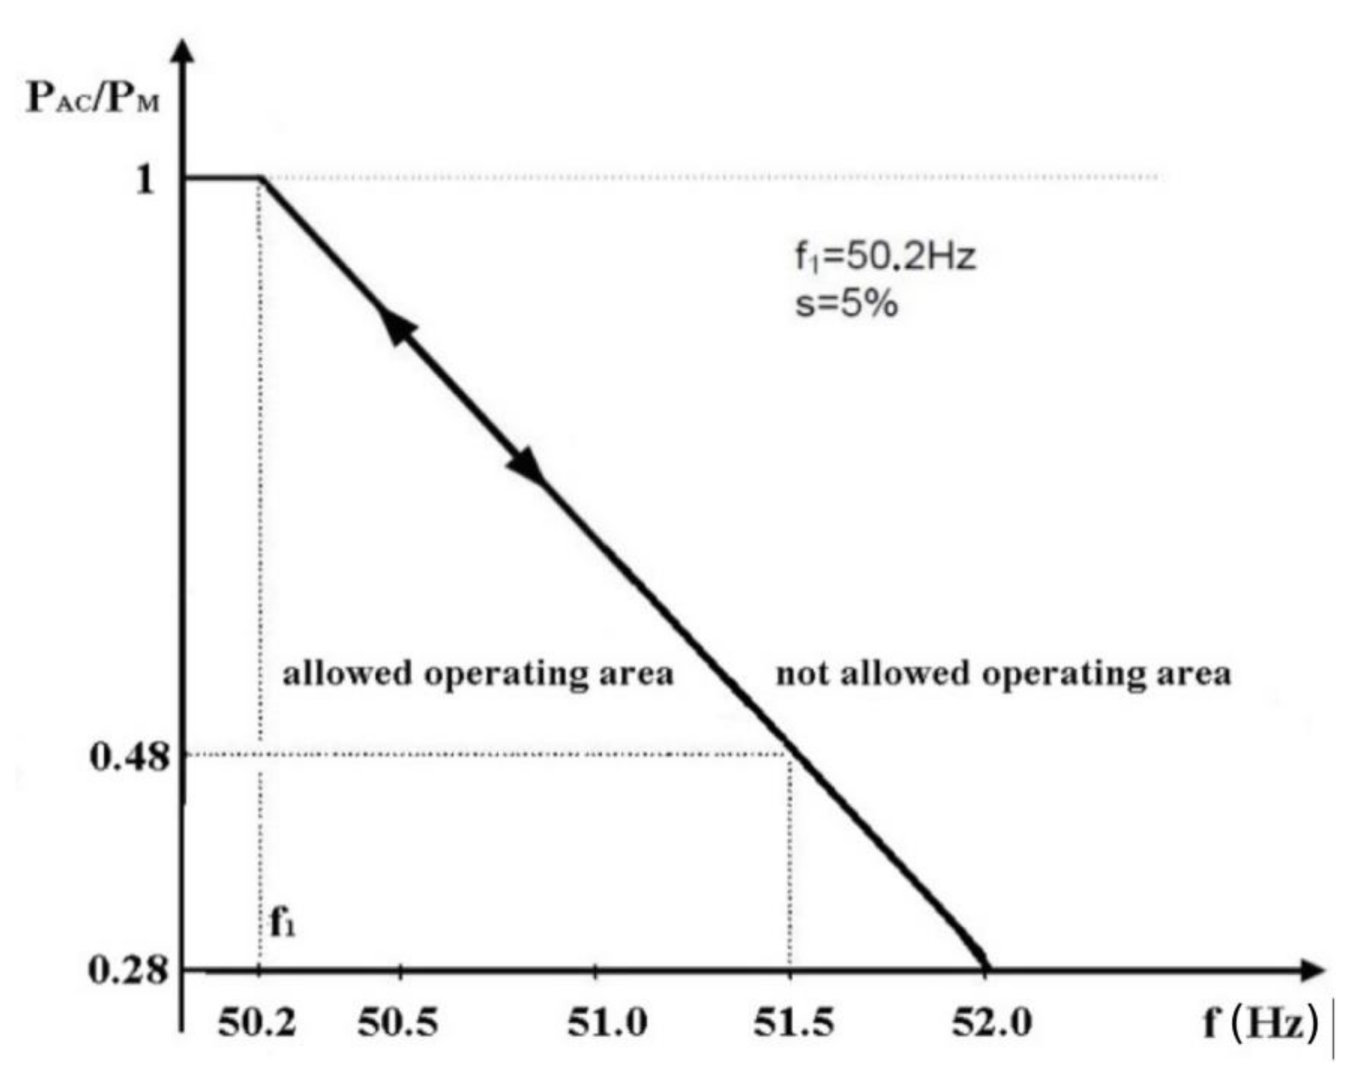
all tested PV inverters (X, Y, Z) meet the EU network code NC RfG [
21] requirement of operation in the active power output reduction mode (at the frequency threshold f
1 = 50.2 Hz and the programmable droop s = 5%) in response to an increase in the network frequency (
Figure 10);
one tested PV inverter (X) does not meet the Polish DSOs’ requirement [
23] of operation in increased network frequencies (in the range of 51.5–52 Hz,
Table 2), but it fulfilled the requirement of the EU network code NC RfG [
21] (
Table 1);
all tested PV inverters (X, Y, Z) do not meet the Polish DSOs’ requirement [
23] of activating one of the permitted reactive power control modes against voltage level increase (
Figure 12);
one tested PV inverter (Y) does not meet the EU network code NC RfG [
21] requirement of maintaining permitted power generation gradient after tripping (
Figure 13);
one tested PV inverter (Z) does not meet the EU network code NC RfG [
21] requirement regarding under-voltage ride through (UVRT) immunity (it needed about 10 s to recover 90% of pre-fault power while 1 s is required,
Figure 15);
all tested PV inverters (X, Y, Z) meet the EU network code NC RfG [
21] requirement regarding the rate of change of frequency (ROCOF) (
Figure 16 and
Figure 17).
The authors also noticed and would like to highlight that the EU network code NC RfG [
21] does not define the level of maximum active power generation drop during sag periods which, in the future, could be dangerous to sustaining the safety and reliable operation of a power system with a high concentration of PV micro-installations.
One of the main reasons why such PV inverters are still available on the market is the currently lack of the verification of photovoltaic inverters by independent accredited entities in terms of fulfilment of the requirements of the EU network code NC RfG [
21], the standard [
22] and the internal Polish DSOs’ document [
23]. In addition, lacking the reactive power control modes, which could limit the voltage rise phenomenon, has a negative impact on the low-voltage network’s ability to absorb the energy produced from photovoltaic micro-installations, which results in more frequent photovoltaic inverter automatic shutdowns due to overvoltage protection system activation.
In order to reduce the number of PV inverter connections that do not fulfil the EU network code NC RfG [
21], the standard EN 50549-1:2019 [
22] and internal DSOs’ requirements [
23], the authors propose the following requirements:
every PV inverter to be connected to the grid should be delivered with a valid certificate of compliance with the requirements considered in this paper and issued by the accredited EU entity;
these declarations should clearly indicate the pre-set values of the PV inverter’s protection system (its thresholds and tripping times) and the selected pre-set reactive power control mode, so as to give no doubts about expected inverter performance;
the criteria for immunity verification of the inverter to a given grid disturbance, included in regulatory documents, should not only be focused on the assessment of whether the object maintains a connection to the grid, but should directly relate to its ability to maintain undisturbed generation during and after disturbance occurrence;
DSOs from EU member states should develop and implement procedures of on-site PV inverter performance checks that could be applied during PV installation commissioning or complaint procedures.
There is no doubt that EU member states and DSOs, especially in the presently observed exponentially growing scale of PV micro-installation connections, should as soon as possible develop and implement at least the abovementioned actions that would contribute to eliminating from the EU market PV inverters that are not adapted to operate in EU power systems. One can only assume the scale of the problem and its future negative consequences (for consumers, TSOs and DSOs in the EU) in the current situation where the EU market has been flooded in recent years with PV inverters of unconfirmed and questionable performance.


