Article

Tackling Complexity of the Just Transition in the EU: Evidence from Romania

by
Roxana Voicu-Dorobanțu
1,
Clara Volintiru
1,*,
Maria-Floriana Popescu
1,
Vlad Nerău
2 and
George Ștefan
2
1
The Faculty of International Business and Economics, The Bucharest University of Economic Studies, 010374 Bucharest, Romania
2
The Faculty of Theoretical and Applied Economics, The Bucharest University of Economic Studies, 010374 Bucharest, Romania
*
Author to whom correspondence should be addressed.
Energies 2021, 14(5), 1509; https://doi.org/10.3390/en14051509
Submission received: 3 February 2021 / Revised: 1 March 2021 / Accepted: 3 March 2021 / Published: 9 March 2021
(This article belongs to the Special Issue Political Economy of Energy Policies)

Abstract

:
The process of reaching carbon neutrality by 2050 and cutting CO2 emissions by 2030 by 55% compared to 1990 as per the EU Green Deal is highly complex. The energy mix must be changed to ensure long-term environmental sustainability, mainly by closing down coal sites, while preserving the energy-intensive short-term economic growth, ensuring social equity, and opening opportunities for regions diminishing in population and potential. Romania is currently in the position of deciding the optimal way forward in this challenging societal shift while morphing to evidence-based policy-making and anticipatory governance, mainly in its two coal-mining regions. This article provides possible future scenarios for tackling this complex issue in Romania through a three-pronged, staggered, methodology: (1) clustering Romania with other similar countries from the point of view of the Just Transition efforts (i.e., the energy mix and the socio-economic parameters), (2) analyzing Romania’s potential evolution of the energy mix from the point of the thermal efficiency of two major power plants (CEH and CEO) and the systemic energy losses, and (3) providing insights on the socio-economic context (economic development and labor market transformations, including the component on the effects on vulnerable consumers) of the central coal regions in Romania.

1. Introduction

Europe is moving decisively forward with energy transition in pursuit of its goal of carbon neutrality by 2050. However, clean energy has to be backed by an equally important commitment to ensuring the security of energy supplies and equitable alternatives for the communities that are economically hit by this transition. The Just Transition Mechanism represents the EU’s 150-billion-euro effort to ensure that the transition toward a climate-neutral economy happens “in a fair way, leaving no one behind” [1]. Given the economic and strategic complexities faced by member states, we argue that such a financing tool has to be pointed in the right direction, targeting key specific issues at a national and local level. To do so, this article presents a diagnostic methodology tested on the case study of Romania. We build on both national and local level data and showcase both specific factors and broader regional trends related to energy-mix, energy production capacity, energy efficiency, pollution, and employment.
Cities, regions, and countries have started to track various indicators reflecting the life of their communities. This process leads to better-informed decisions in the public space. It also renders governments more accountable to their constituencies for their performance in office. Such tracking of indicators is furthered by the transition to smart cities as data becomes more readily available and transparency becomes the norm. This is not always possible for less developed regions, where both solutions and data are harder to find. Evidence-based policy-making is further limited by the need to integrate, apart from data, complex and shifting perspectives of stakeholders.
As we argue in this article, a necessary step forward in the Just Transition policy-making process is to involve real-time management of decisions including corrections and simulations of large-scale collaborative models such as anticipatory governance. Defined as “a broad-based capacity extended through society that can act on a variety of inputs to manage emerging knowledge-based technologies while such management is still possible” [2], anticipatory governance allows for current long-range actions. This stage-process zooms in and out, from micro-communities to macro-supranational, continent-wide, as is the case with the European Union and its long-term sustainability planning. The Just Transition framework prescribes national governance behavior, but the targets are to be achieved only by looking at the local communities’ specificities.
The complexity of such a process comes from the multitude of actors involved, the possible evolutions of the environment and the ecosystems (natural, business), and the high rise in uncertainty. Thus, anticipatory decision-making, understood as a data-driven process, becomes necessary in order to tackle such a task. Anticipatory studies, particularly in sustainability governance [3], relate to how various future paths link and shape current policies. Although our analysis focused on the Just Transition Mechanism in which decisions are made at the supranational or intergovernmental level, anticipatory governance at the local level is still needed to allow for the optimal implementation of the Just Transition.
Central and Eastern Europe (CEE) is facing the dual challenge of energy transition and economic catch-up with older member states [4]. The tension between energy transition and economic development is obviously not specific to CEE, as it can also be found in Latin America [5] or Asia [6]. Still, in CEE, it informs the implementation of energy transition instruments such as the Just Transition Mechanism.
In adopting the Green Deal [7,8,9,10], developmental divides between older and newer member states (NMS) are a weakness. Despite the Just Transition Fund, considering their structural vulnerabilities and economic dependency [11], the green transition’s effect could have a more significant negative impact on NMS.
Therefore, it is imperative to account for these regional specificities in CEE countries like Romania. Without pretending to go fully anticipatory, in a classical manner, our diagnostic analysis represents a first step in the development of an evidence-based policy-making for the Just Transition of coal regions in Romania.
With a significant increasing contribution of renewables and nuclear energy, Romania will have to decommission by 2040 all of its currently installed thermal power generating capacity, which is theoretically possible according to recent simulations [12]. However, there is still an ongoing discussion about the transition’s socio-economic impact and how the domestic energy needs will be met. Our data analysis shows both the urgency of the transition in terms of pollution and the low energy efficiency of the existing coal-based energy production plants. We nevertheless acknowledge that, given the complexity of the situation, politics will play a significant role.
Th rest of this article is structured as follows. Section 1 engages with the literature on energy transition in the EU, and Section 2 presents our methodological steps (including the aim of the study). Section 3 contains the data analysis, structured on a three-pronged approach of an extensive comparative clustering analysis of all member states on the parameters that are relevant to the Just Transition process as well as the two in-depth case studies on energy production plants and regional transitional challenges in the coal-regions of Romania. Finally, Section 4 concludes by discussing the relevance of our findings to the broader evidence-based decision-making process at the national and European level.

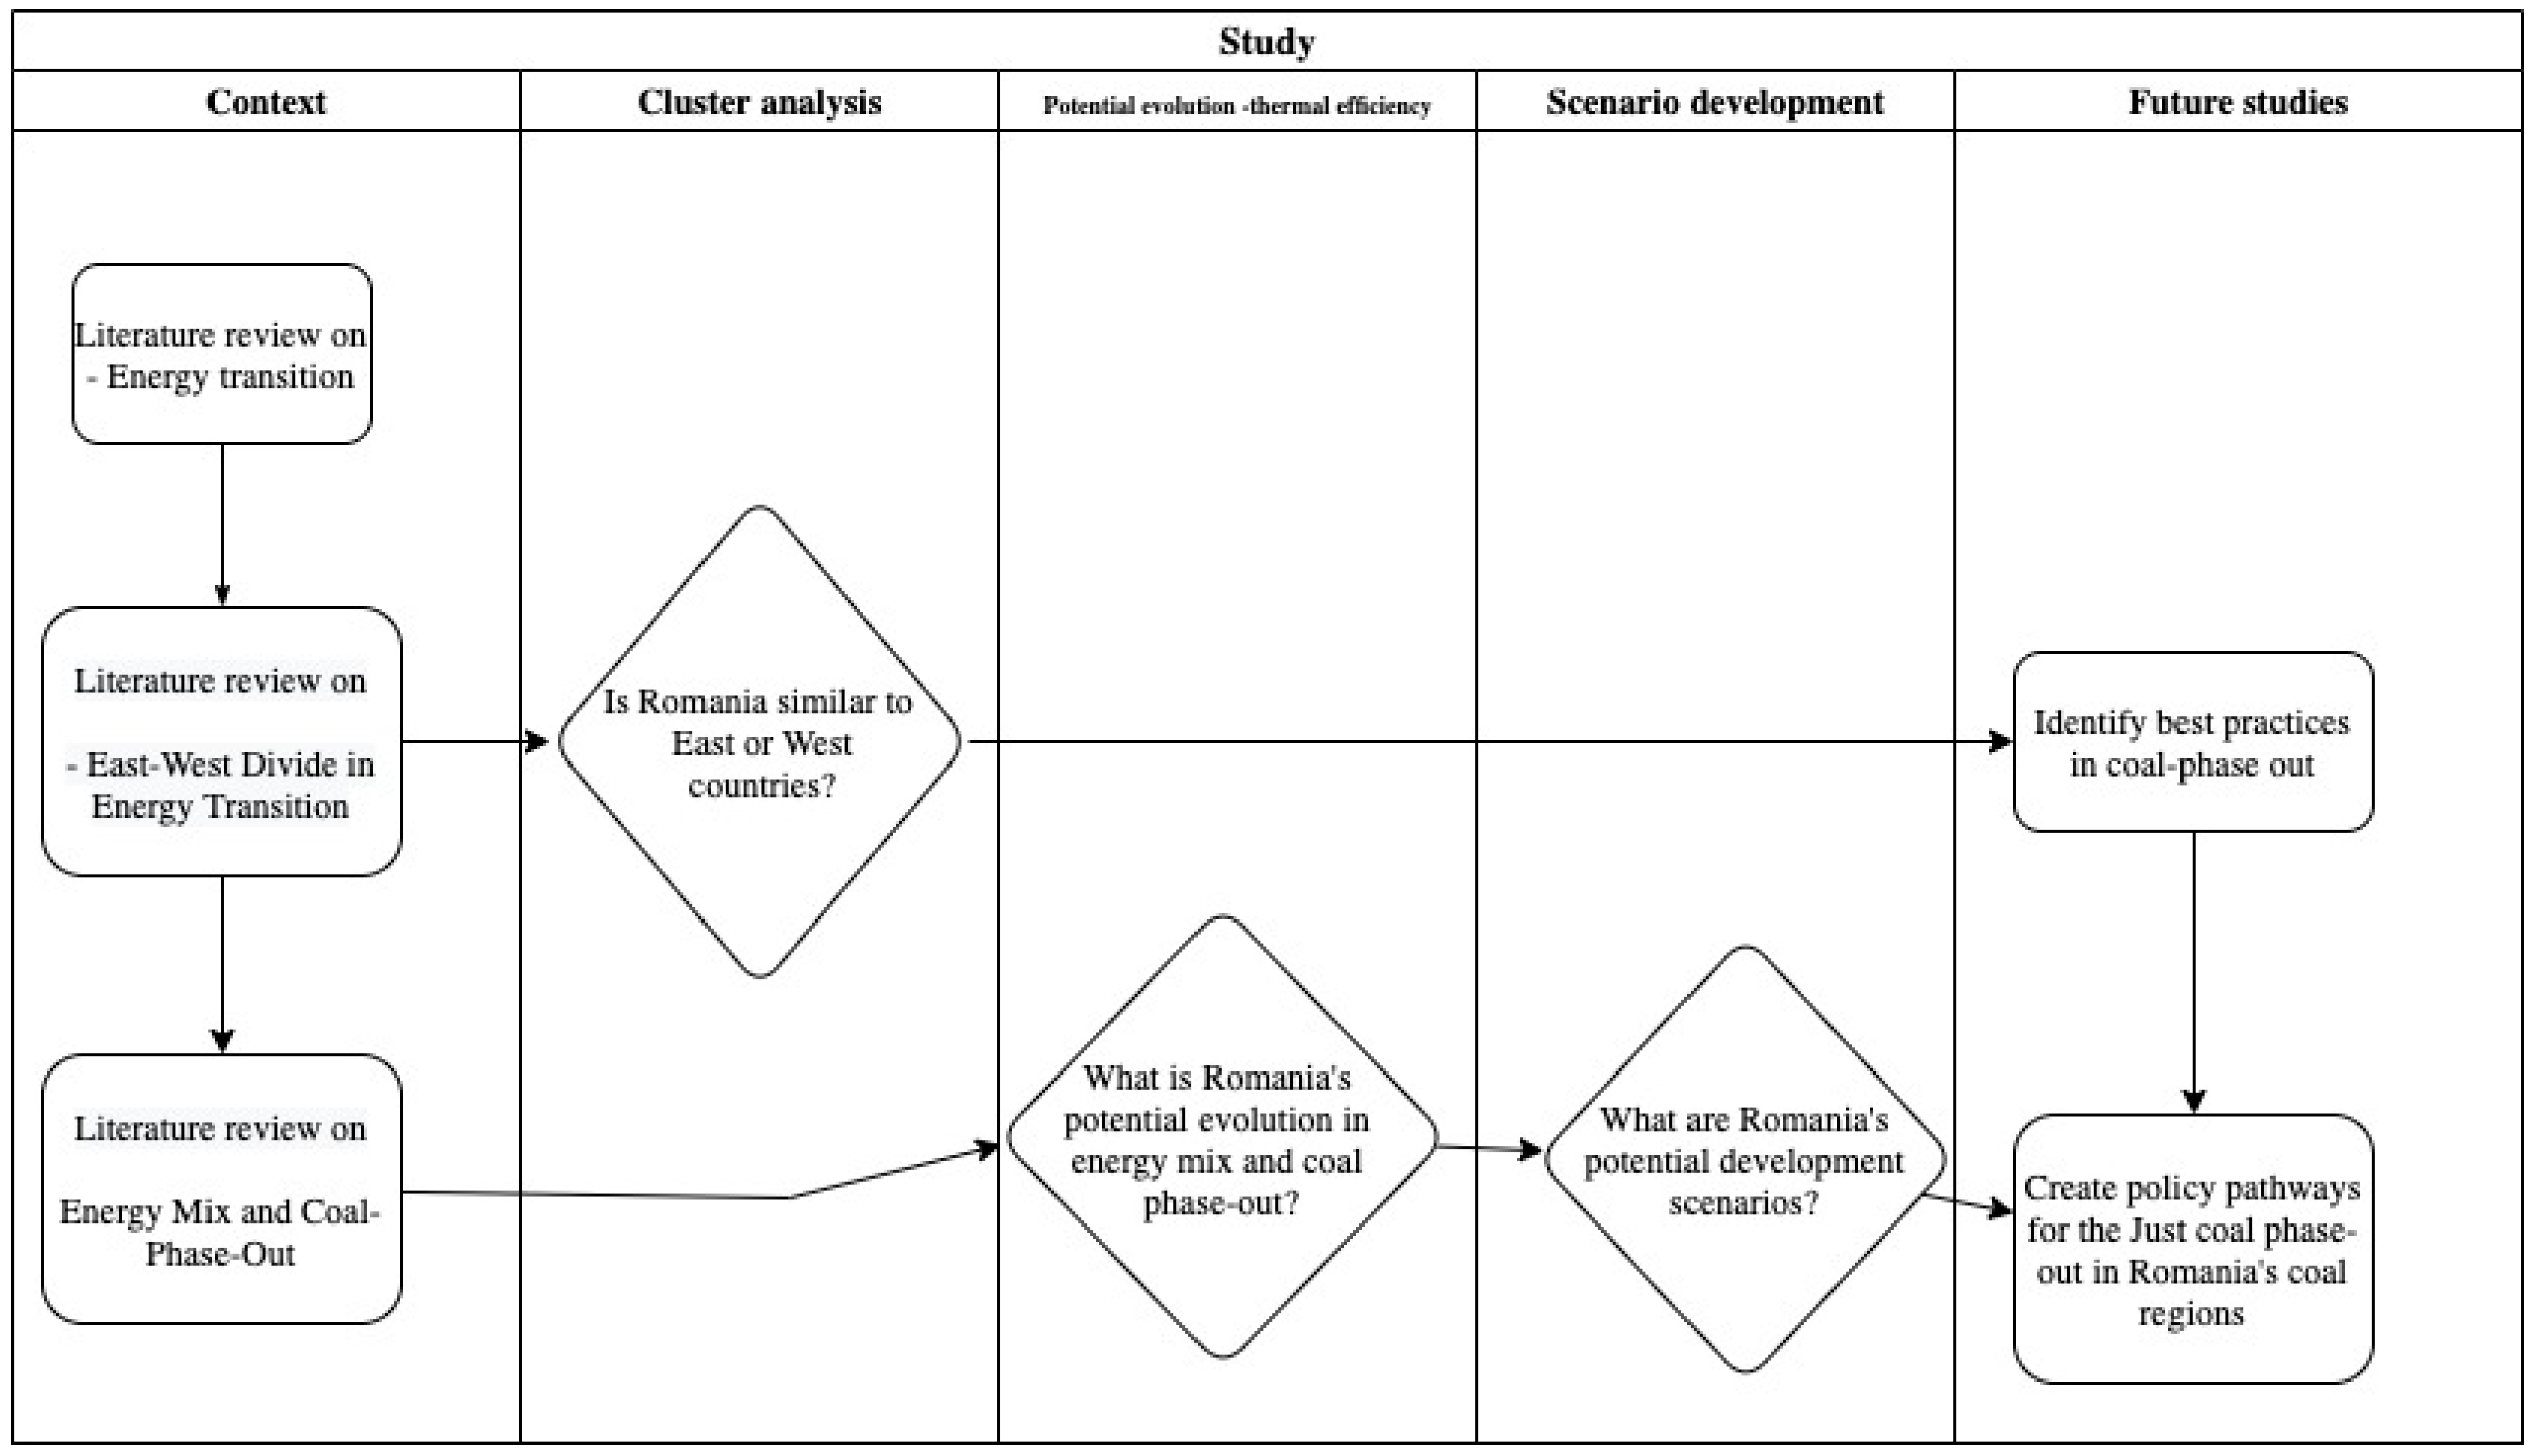
1.1. The Complex Issue of Energy Transition—Literature Review

The EU has piloted a series of policy reforms over recent years and is now pursuing a much more comprehensive program in the form of the Green Deal—essentially defined as “a new growth strategy”. With the Just Transition Fund, which is a vital instrument for the delivery of the European Green Deal, and its €40 billion behind it, it aims to mobilize at least €150 billion investments over 2021–2027 in the most affected regions, divided in three pillars [13]. It requires an ambitious approach to reshape the way we live and work within the EU [9]. This, in turn, requires concrete evidence on the capabilities and vulnerabilities in both the energy sector and, more broadly, in terms of the socio-economic perspective of local communities.
The Green Deal builds upon a desiderate for a reformed European society, which functions resiliently in congruence with nature, fosters innovation and individual freedoms, and mitigates the risk of various speeds of development. However, this transition is by far one of the most complex endeavors the Union had to take. The reason for this complexity is given by the heterogeneity of the actors involved (Member States do not have similar circumstances concerning sustainability or economic development), the diversity in approaches to societal shifts, and in the speed to change the current societal configurations. The literature on societal shifts (or socio-technical transitions) relies on two pillars: (1) the multi-level perspective (MLP), from the seminal works of Rip and Kemp (1998) [14], followed by the consistent developments by Geels (2002) [15], (2004) [16], (2005) [17] (with Schot, 2007 [18] and 2008 [19]), (2010) [20], (2011) [21], (2014) [22], (2019) [23], and (2) the works of Hagel, Seely Brown, and Davison (2009) [14] and Denning, Hagel, Seely Brown and Davidson (2012) [24] regarding the Shift Index. Both pillars (with their respective criticisms) provide multi-level approaches with three levels:
  • The MLP distinguishes between niches, socio-technical regimes, and a socio-technical landscape. It also talks about transition as a regime shift, relying on inter-level interactions [21].
  • The Shift Index relates to three composite indices: foundations, flows, and impact. The indices act as waves for change, as the authors see the interactions in a sinuate evolution, in which the processes overlap and the momentum is driven by all three forces [25].
As of 2021, the MLP has not been analyzed for Romania and constitutes the next step in our research, while the Shift Index was evaluated for this country in Voicu-Dorobantu et al. (2011) [26], Paraschiv et al. (2012) [27], and Voicu-Dorobantu (2015) [28].
Energy policy has to be informed by evidence related to (1) energy supply and security, (2) environmental impact and pollution, and (3) competitiveness and economic development [12]. We used all three dimensions in the clustering and scenario analysis in the following sections. We briefly illustrate in the following paragraphs how each of these analytical dimensions was explored in the case of Romania and the CEE region.

1.1.1. East–West Divide in the Energy Transition

CEE has distinctive features that make it more vulnerable to energy transition. It has an enormous energy intensity and associated greenhouse gas (GHG) emissions [29,30]. As we show in this article, air pollution scored the highest in Europe for countries in this region. CEE countries rely much more heavily on coal-fired power stations than Western Europe in terms of energy production. This dual imminence of the transition due to pollution and poor alternatives for the current quantity of coal-based energy production constitutes the region’s energy transition conundrum. In comparison, environmental transition in the region has been more readily accepted [31] given the relatively limited industrial exploitation of their territories.
Energy dependency is reinforced by relative poverty in the region, as it is only in the newer member states from CEE that there are regions with lower than half the EU average GDP level. It is essential to understand that in a context of insufficient institutional capacity, as many of the CEE countries are facing, the implementation of labor reconversion programs is rendered more difficult. Their historical economic pathway [32,33] and their “dependent capitalism(s)” [34,35,36,37] add another layer of difficulty to diversifying employment and developing higher added value jobs. Low regional competitiveness [38] also means that there are fewer internal migration and labor reconversion perspectives.
Technological solutions and availability of alternative energy production are challenging in general [39], but for CEE countries, given their low innovation capacity and R&D spending [40], this becomes an even greater challenge. The incumbent commodity, the revenues, and the market margin can be substituted by innovations [41]. The energy sector uses a blend of many energy service technologies, making socially ideal solutions possible because it preserves flexibility in energy supply [42]. In this sense, progress in energy technology is powered by a convergence of individual technologies to provide a certain energy utility and spillover of information (i.e., the use of tech beyond its first location) [43]. Regarding the Green Deal’s objectives, local companies have to have the innovative capacity to adapt to and adopt new non-polluting technologies or processes [44]. This is especially challenging for lagging regions in Romania and other CEE countries, given the companies’ weak connectivity to knowledge-transfer networks [45] and domestic eco-innovation capacity [26].
The classical difference between core and peripheral economic growth [46] is also valid in the case of energy poverty [47], provided that in the countries of southeastern Europe, the influence of this problem is considerably higher [48]. Ultimately, customers can bear the burden of electricity supplies in a stable and secure scheme as well as the transition to a less carbon model. The challenge is how to meet these aims while simultaneously maintaining open markets that provide customers with fair pricing and protect the most vulnerable [49]. The Energy Union builds on previous Commission documents and seeks to position “citizens at its core” by investing in the transition and reducing bills using emerging technology, encouraging full market engagement, and protecting disadvantaged customers [50].

1.1.2. Energy Mix and Coal Phase-Out

Coal is sometimes viewed as the cornerstone of the economies of coal-mining areas. Looking more carefully, it is clear that coal is not only an enormous burden on the environment and human health, but that mining and burning coal also raises the cost of public resources. As a result of industrial expansion, areas with large coal industries have become associated with air pollution, soil depletion, and socio-economic loss. However, we should also consider that mining is a traditional activity, and the coal industry has shaped local history, identity, and jobs, transforming them into assets for various other sectors such as renewable energy. This shaping allows for relevant opportunities for regional development and job creation, even as the world gradually moves away from fossil fuels due to their negative impact on health and the environment.
Although coal remains a key fuel in the European energy mix as it represents a fifth of the EU electricity generation mix and three-quarters of CO2 emissions from the EU electricity sector, according to Bruegel [51], the transition to cleaner sources of energy and advanced technology is imperative to fulfill the EU’s promise to reduce CO2 emissions by at least 55% by 2030 and to become the world’s first climate-neutral region by 2050.
The European coal industry employs about half a million workers in direct and indirect operations (185,000 workers in coal mines, 53,000 workers in coal power plants, and 215,000 jobs in indirect activities related to the coal supply chain) [52]. It is projected that by 2030, around 160,000 direct jobs will be lost. Based on a carefully orchestrated restructuring phase in which green energy plays a central role, regional growth would generate new job opportunities. In order to ensure that no region is left behind in this process of transition, the Commission has also initiated the “Initiative for Coal Regions in Transition,” which works as an open forum that has brought together all interested actors in sharing information and exchanging experiences in a bottom-up approach to a just transition. Specially designed as a non-legislative feature of the “Clean Energy for all Europeans” package [53], the forum aims to mitigate the social effects’ of low-carbon transition. Nevertheless, coal remains a significant political bottleneck in the EU’s decarbonization process; therefore, this subject is tackled more in the following sections.
Among the EU countries, the largest coal reserves are in Poland, Romania, the Czech Republic, Spain, and Germany [54]. Western European member states have been facing the challenges of the energy transition head-on, and as such, they have implemented a series of measures designed to counter its negative impact and comply with the coal-phase out process [55,56]. The interconnected essence of coal mining and coal-fired generation is consistent with the fact that coal is historically a source of electricity linked to its domestic output capacity. For example, the figures from 1991 show that whereas Poland had 116% of self-sufficiency in coal (self-sufficiency being calculated as the percentage of domestic production in the national coal use [57,58]) and a 78% share of coal in the total primary energy use, the United Kingdom (87%) and Germany (95%), with a self-sufficiency in coal of 87%, respectively 95%, had 29%, respectively 33% share of coal in the total primary energy use [59]. These behaviors were observed across Europe even considering the lack of rivalry between coal mines since the late 1950s when imported non-domestic coal prices plummeted sharply [60,61,62]. In these difficult times, many Western European countries kept their coal mines open due to their reserves and local historical lifestyles. The Polish coal mining has recently become globally uncompetitive [63] and Germany is more committed than ever before to the coal phase-out [55,62]. Now, only newer member states in Europe rely on coal for 20% to 50% of their total energy needs: Bulgaria, the Czech Republic, Greece, Poland, Romania, and Slovakia.
Coal-based energy production is not only very polluting, but also highly inefficient [64]. Many of the coal-production facilities are technologically outdated, having been built in the communist period. Therefore, the frequency of coal power plants with the lowest efficiency (around or below 30%) is higher in eastern European countries [54]. However, coal is not an efficient fuel production base, as even the most recent production facilities in Germany still only have a 39% energy production efficiency [54]. In contrast, high-power plant efficiencies in coastal sites in northern Europe are also due to the availability of cold water for power plant cooling [54]. The desertification of coal-regions in Romania only adds to the low energy efficiency of the two plants we assessed in this article.
The perspective of mass unemployment in the coal-regions is one of the primary reasons behind delays in the transition process [65]. As such, delaying the coal-phase out process ensures a natural exit of the coal-related employees into retirement. However, Oei et al. (2020) [56] showed that despite the negative impact on coal-regions in Germany, in terms of losses in output, income, and population, a more rapid phase-out would also result in a quicker recovery, based on Germany’s internal migration and demographic changes.
Measures involved both targeted local interventions for communities—in terms of socio-economic costs [56,66], and national-level policies and strategies—to ensure their energy supply [59,67,68]. At this intersection between national and local measures lies the necessity and added-value of the in-depth national diagnostic of the energy systems’ political economy. Michael Metzger et al. [69] recently pointed out that national governments need to develop their energy systems with both a higher degree of flexibility and operations planning. We argue that evidence-based policy-making can best address emerging vulnerabilities of the energy systems and the energy transition.

1.1.3. A Brief Overview of the Romanian Context

Romanian energy production facilities (including coal-based power units) were mainly constructed before 1990, starting with the 1970s (similar to many other post-communist countries, like Poland or Hungary), and the oldest facilities are approaching the end of their lifetime [70]. The main coal basins are located in the Jiului Valley (Gorj County, southwest region) and Hunedoara County (west region). However, during the past 30 years, mining activity has started to decline, especially in Jiului Valley. As Barbu (2020) [70] showed, during 1997–2017, the number of mining perimeters in operation reduced from 16 mining perimeters of 163.35 km2 to four mining perimeters of 22.3 km2.
Nowadays, most active coal mines are located in two development regions (namely the South Vest Oltenia Region and the Vest Region) and concentrated in Hunedoara and Gorj Counties, which are responsible for 97% of the electricity produced from coal.
Hunedoara County has an industrial tradition since it was part of the Austro-Hungarian Empire, but the communist period transformed this county into a real center of heavy industry. The county’s economic model was centered around the extractive and processing industry mainly due to its rich coal resources and steel production. Jiu Valley, a region located in Hunedoara County on the border with Gorj County, famous for its coal production, had at the end of the communist period a population of about 140,000 people, of which about 45,000 were coal workers, across 15 mines. Currently, the Jiu Valley population has decreased significantly, as has the number of coal workers, which now numbers around 11,000. The current situation of the county can be most eloquently explained by the evolution of Hunedoara, which became the largest mono-industrial city in the country during the communist period, its population growing from 4800 inhabitants in 1930 to 90,000 inhabitants at the fall of communism, and the steel plant in Hunedoara had at that time 20,000 employees. ArcelorMittal bought the steel plant, and at the beginning of 2020, before the outbreak of the pandemic, it registered only 640 employees. The reduction of the extractive activity and the obsolescence of the economic model around which the whole county was focused (heavy industry) eventually caused the decline in the county’s population and the strong emergence of the phenomenon of ”shrinking cities.”
Gorj County had a population, at the last census conducted in 2012, of about 373,000 inhabitants. Of these, a proportion of 52.5% lived in rural areas and 47.5% in urban areas, and thus it can be concluded that agriculture still plays a somewhat important role in the county’s economy. Over 50% of the active workforce is engaged in activities in the agricultural and industrial sectors. Extractive activities and electricity production dominate the county’s industry. There are significant lignite resources in the Rovinari and Motru Basins, a region where the lignite mines are located, which supply the Oltenia Energy Complex with raw materials. Both Hunedoara County and Gorj County suffer from the depopulation process. The massive migration of the population over the last 20 years to neighboring counties, primarily to regional university centers such as Timiș County for people from Hunedoara County and Dolj County in the case of Gorj County has led to changes in the demographic structure of the region. This change is evident across the entire Jiu Valley, especially from the perspective that young people who chose to study in university centers in neighboring counties rarely, at the end of their studies, returned to their native counties. This declining trend in both the number of students and teachers has had a significant negative impact on the region’s economic development as the labor market is concentrated around the mining sector and does not offer too many other sectoral opportunities.
Within Romania’s energy production mix, the coal-based energy production represented, at the end of 2019, around 23–24% of the total (mainly lignite, more than 90%), increasing significantly during the winter months. At the end of 2019, the most widely used primary resource was hydropower (approx. 27% of total), followed by coal and nuclear energy (19%). Additionally, in 2019, oil and gas produced around 16% of the total, while renewable resources like wind and photovoltaic generated more than 14% of the total energy [71].
Regarding the electricity production mix, the following aspects have to be considered:
  • During 2017–2019, the installed power decreased from 24,714 MW at the beginning of 2017 to 20,696 MW at the end of 2019; Romania lost more than 4000 MW in this period primarily due to the reduction of coal (−1453 MW) and oil and gas (−2553 MW) during the three years, while biomass and photovoltaic slightly increased. Complementarily, hydropower and wind power decreased.
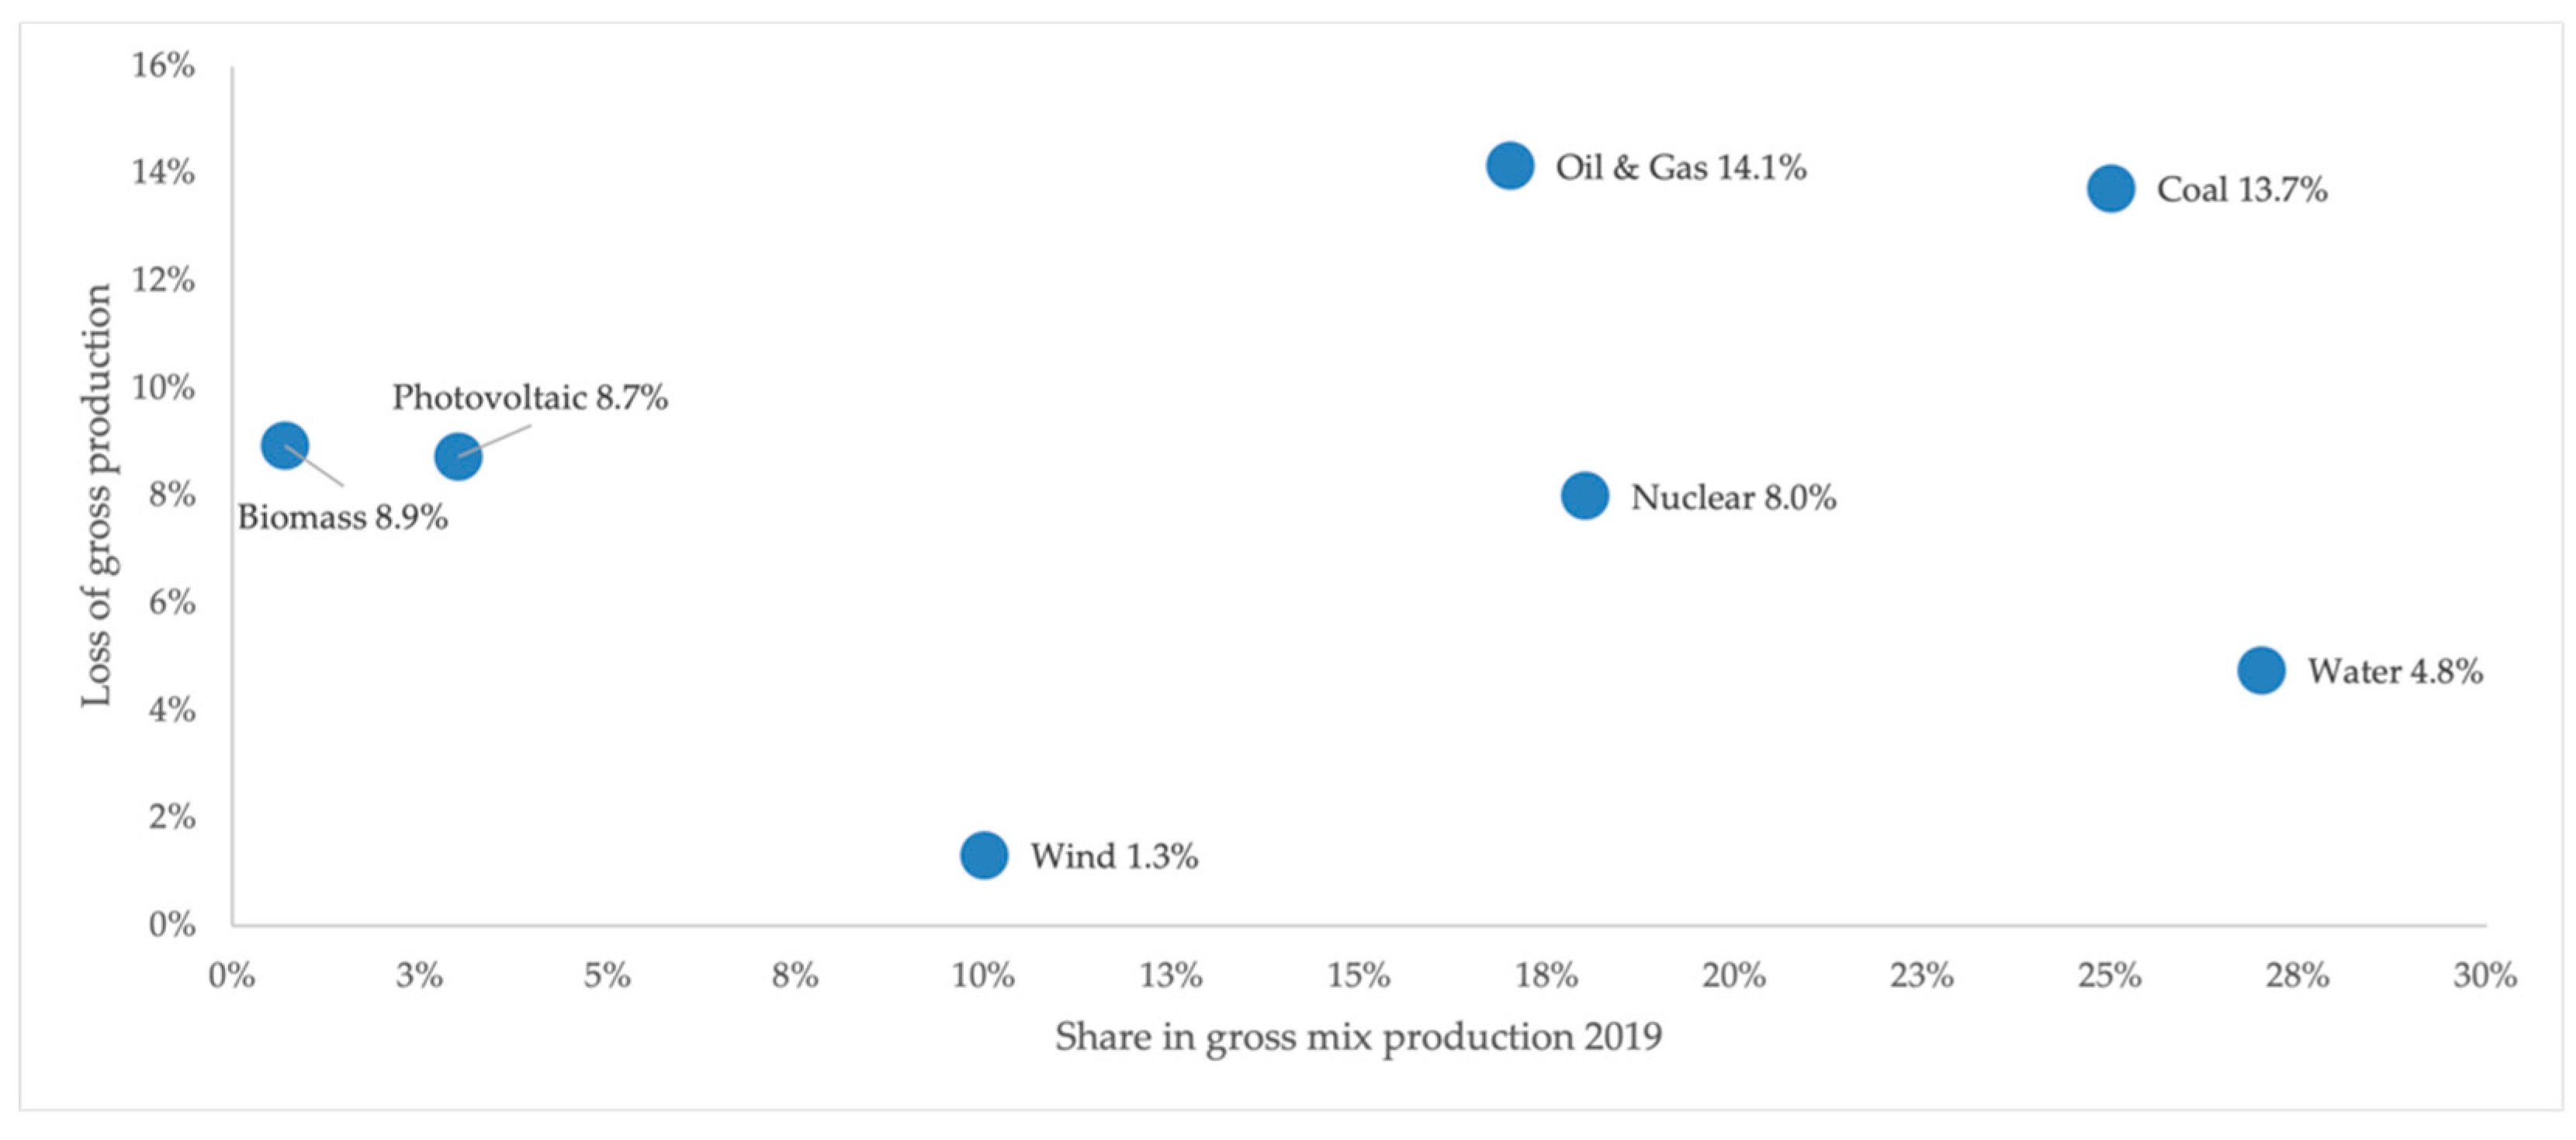
  • In 2019, compared to 2018, the variation of production by types of resources decreased in the most primary sources of power, with values between 0.94% for nuclear production and 13.56% for oil and gas production. At the same time, there were essential increases in production from renewable sources, respectively wind (+7.14%), biomass (+27.56), and photovoltaic (+0.34%). Hydropower production decreased by 10.28% compared to the previous year. According to the Transelectrica annual report [71], this situation was caused by the decrease in hydraulicity in inland rivers from 97% in 2018, a normal year, to 85% in the year 2019, a subnormal year. However, given that the production of renewable sources is very volatile (variations in production over 1000 MW between concomitant intervals), the integration in the National Electrical System of wind power plants was facilitated, to no small extent, due to variation of the production in the hydropower plants.

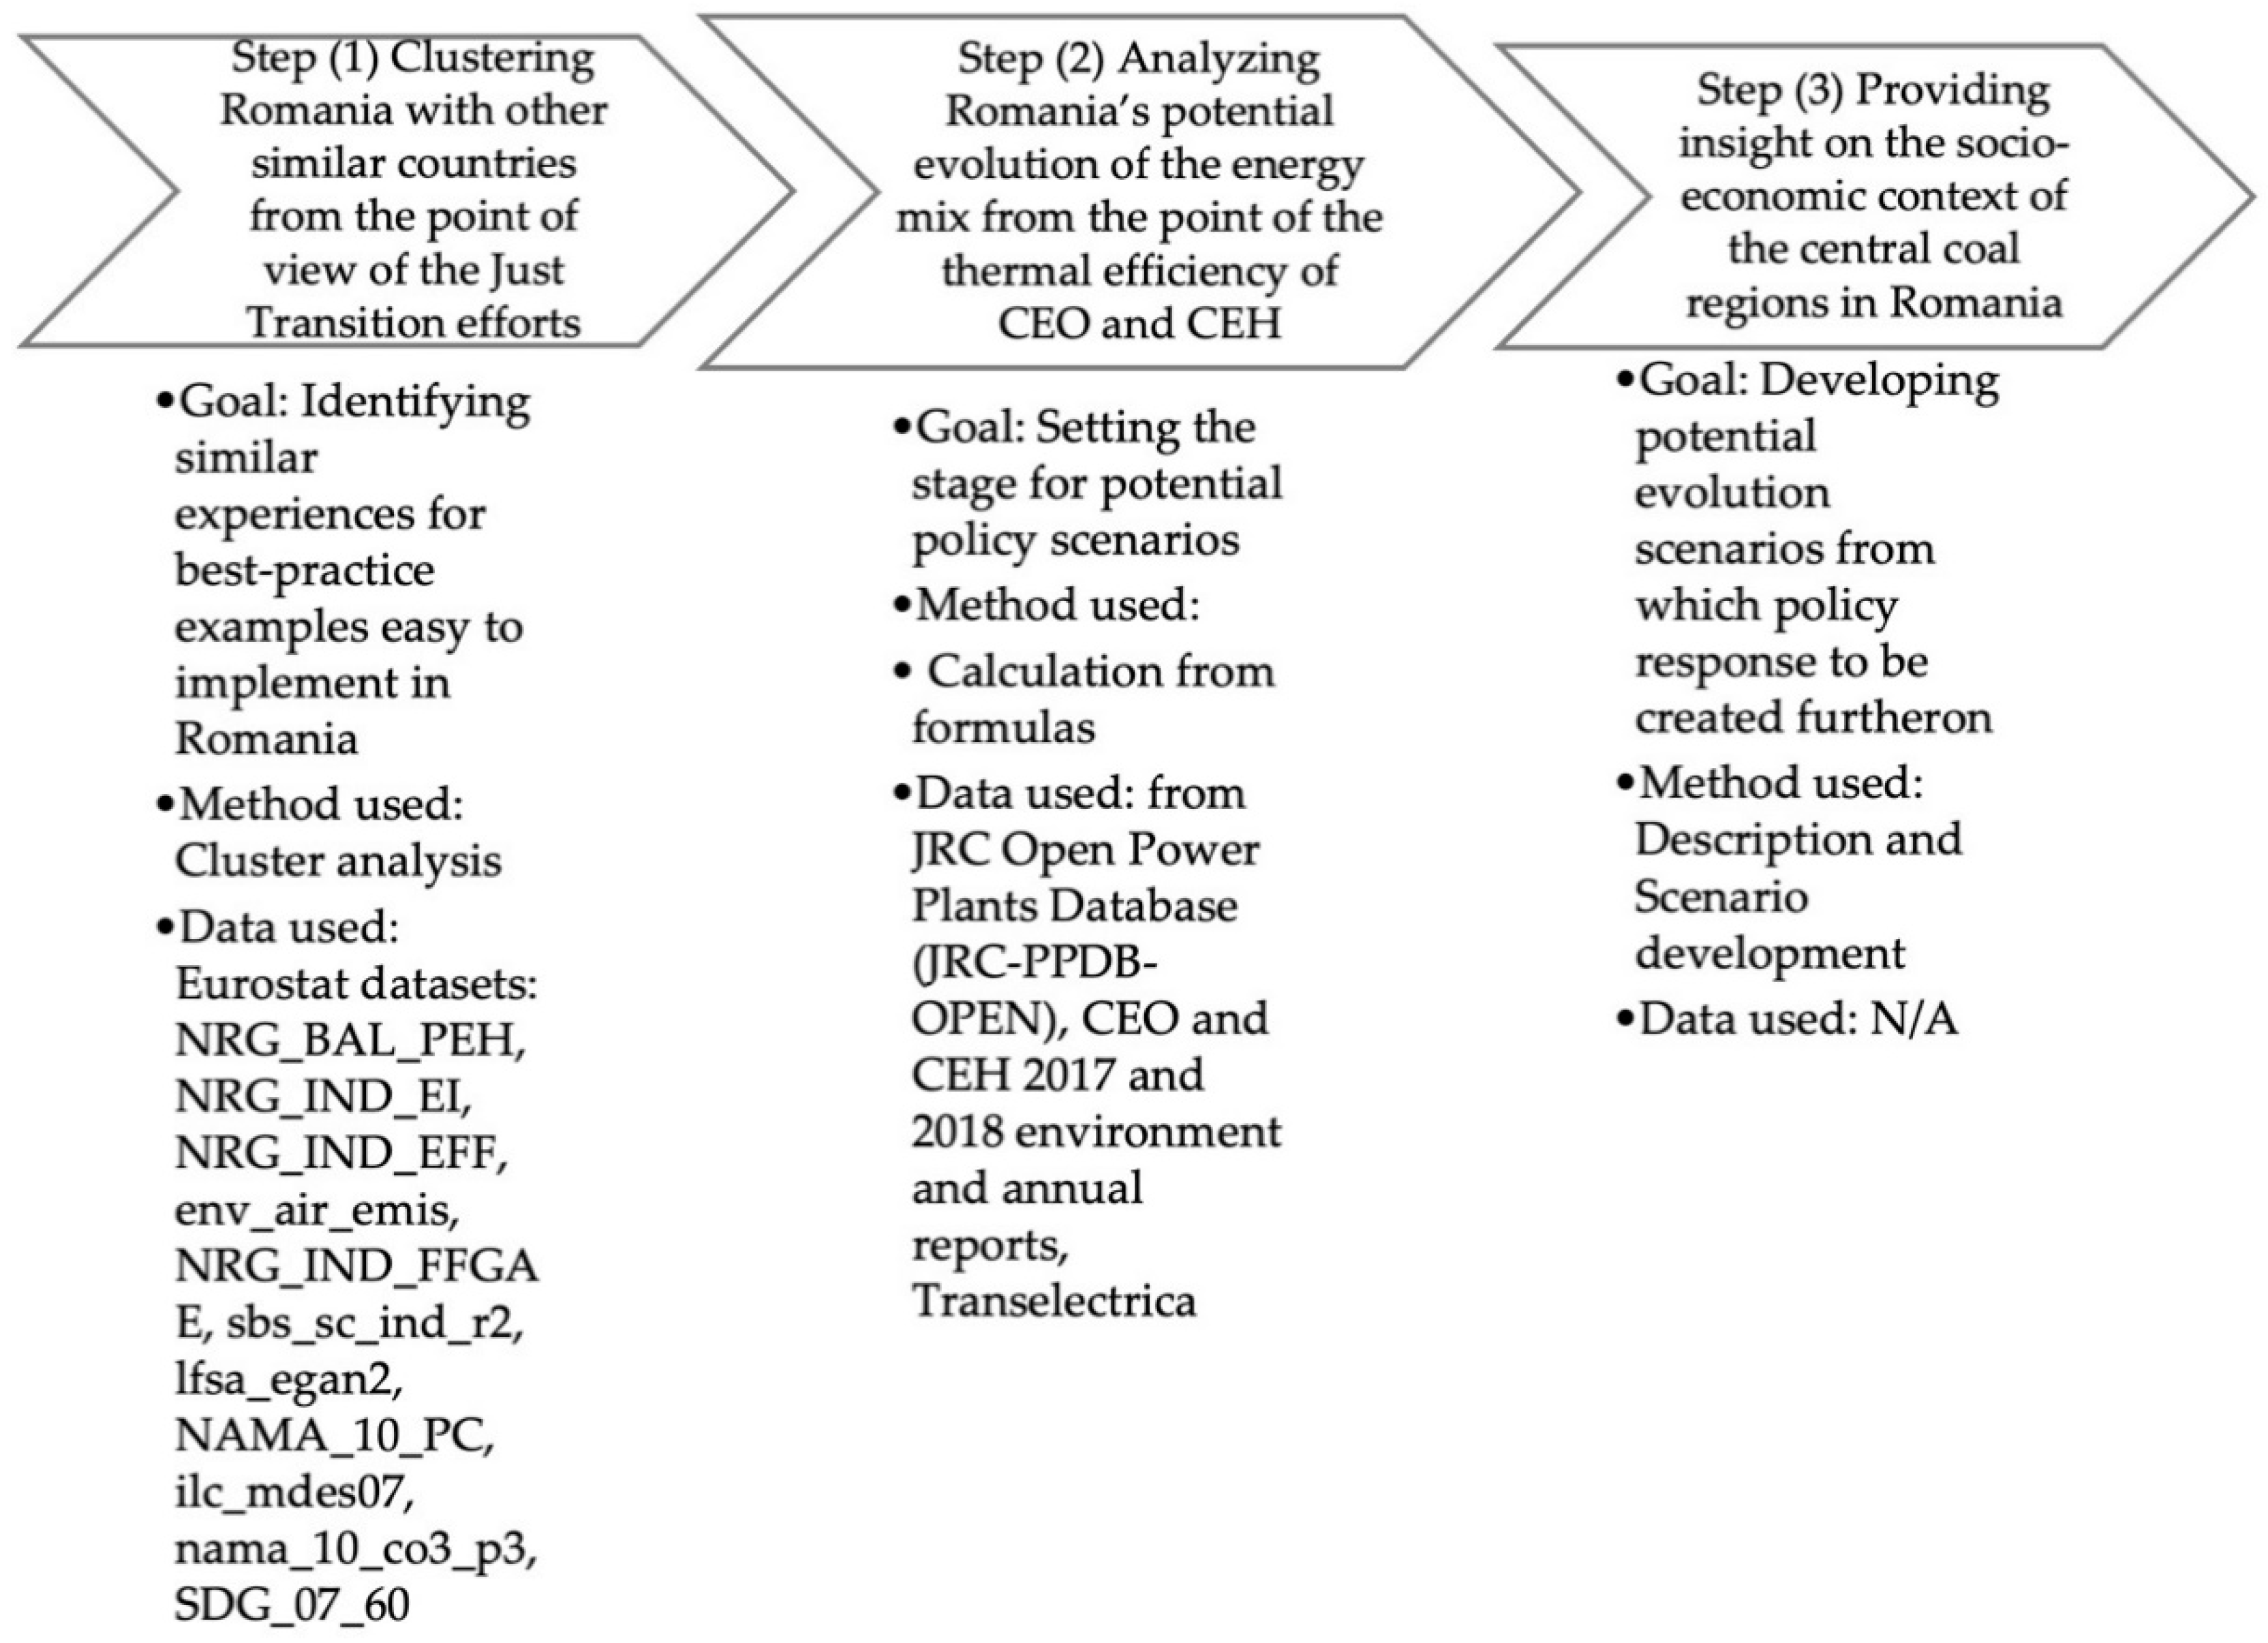
2. Materials and Methods

This article focused on possible scenarios to tackle this complex issue in Romania through a three-pronged methodology: (1) clustering Romania with other similar countries from the point of view of the Just Transition efforts (i.e., the energy mix and the socio-economic parameters), (2) analyzing Romania’s potential evolution of the energy mix from the point of the thermal efficiency of two major power plants (Complexul Energetic Hunedoara, CEH and Complexul Energetic Oltenia, CEO) and the systemic energy losses, and (3) providing insights into the socio-economic context (economic development and labor market transformations including the component on the effects on vulnerable consumers) of the central coal regions in Romania. To this extent, we have three different specific methodologies: related to cluster analysis, the evolution of thermal efficiency, and scenario development, and the methodological framework is presented in the following figures with the steps (Figure 1) and logical diagram (Figure 2).

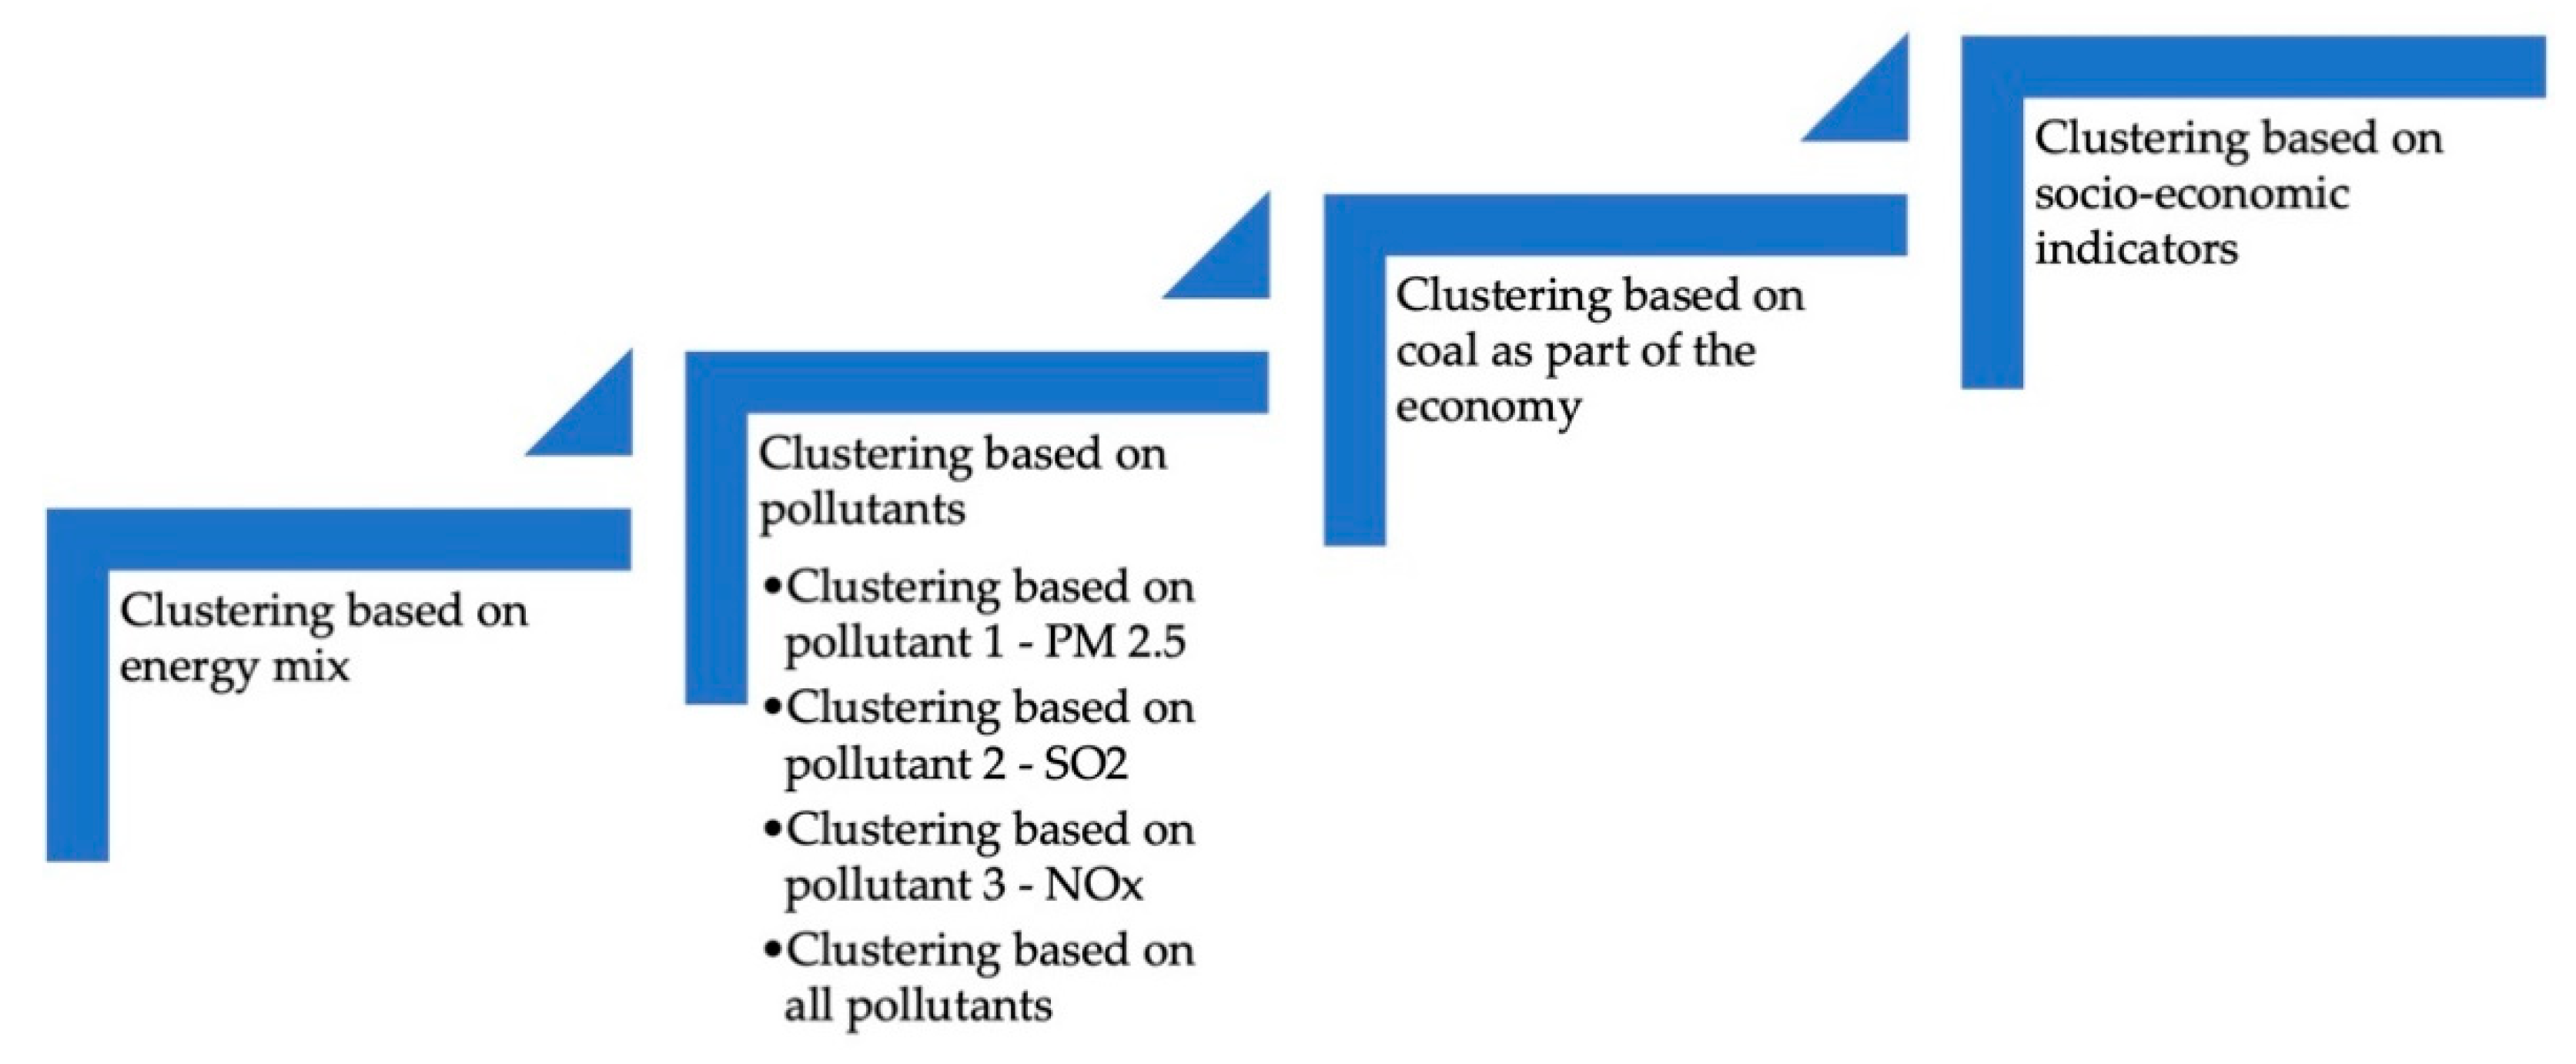
2.1. Cluster Analysis Methodology

The cluster analysis methodology used was the traditional k-means clustering. Clustering was done in four different levels, as seen in Figure 3, with an added final clustering aggregating all layers. Similarly, we ran those four clustering levels on three types of data: Raw data and Standardized data. For the standardization of data, this step aims to standardize the range of the continuous initial variables so that each one of them contributes equally to the analysis [72].
All countries clustered with Romania in any of the generated results were considered for a more focused view beyond the data of relevance, best practices, and use cases.
For the most recent year, all data for the EU Member States are published in Eurostat (2018 in most cases). The following datasets (in brackets the online data code for the dataset according to Eurostat) were used:
  • STAGE 1: clustering based on energy mix: Production of electricity and derived heat by type of fuel (NRG_BAL_PEH), Energy intensity (NRG_IND_EI), Energy efficiency (NRG_IND_EFF)
  • STAGE 2: clustering based on pollutants: Tons of PM2.5 to 1 Billion. EUR GDP, Tons of SO2 to 1 Billion EUR GDP, Tons of NOx to 1 Billion EUR GDP ([env_air_emis])
  • STAGE 3: clustering based on coal as part of the economy: Share of fossil fuels in gross available energy (NRG_IND_FFGAE), Number of companies in Mining and Quarrying in Total number of companies ([sbs_sc_ind_r2]), Population employed in Mining and Quarrying in Total population employed ([lfsa_egan2])
  • STAGE 4: clustering based on relevant socio-economic indicators: GDP per capita (NAMA_10_PC), Arrears on utility bills—EU-SILC survey [ilc_mdes07], Final consumption expenditure of households by consumption purpose (COICOP 3 digit) [nama_10_co3_p3], Population unable to keep home adequately warm by poverty status (SDG_07_60).
Finally, the overall clustering integrated all variables to provide an EU image that concerned our researched issue.
For the clustering, we used StatPlus, which allows for k-means clustering. K-means “is a method that partitions n observations into k clusters in which each observation belongs to the cluster with the nearest mean (cluster centers or cluster centroid), serving as a prototype of the cluster. k-means clustering minimizes within-cluster variances (squared Euclidean distances) but not regular Euclidean distances” [73]. Two levels of aggregations are necessary—if the number of items in the cluster is larger than 7: with k = 5 and then k = 3 (alternatively k = 5 and k = 4 were tried for the second level of aggregation, but there were no significant differences in the clusters resulted in the second aggregation).

2.2. Efficiency Analysis Methodology

To highlight the efficiency of coal-fired power plants in Romania compared to those in the European Union, we consolidated the findings obtained by Alves-Dias et al. (2018) [54] that estimated the thermal efficiency of the individual power plants based on the available information on the installed capacity, the age, and type of power plant. One of the most important technical factors for assessing a power plant’s performance is its efficiency since it is linked to competitiveness, as lower efficiency implies higher fuel consumption, which results in higher production costs and CO2 emissions.
The CO2 emissions of a power plant are proportionally related to the fuel used, the fuel consumed during the year, and the generated electricity and efficiency. The following formula was used:
Eff = generation   ×   3.6 CO 2 emissions   excl . biomass Intensity fuel + CO 2 emissions   CO 2 emissions   excl . biomass Intensity biomass
where:
Intensityfuel: The CO2 content per calorific energy in the fuel expressed in tons CO2 per TJ;
generation: Annual net generation of the power plant in MWh; and
CO 2 emissions : Annual emissions in Kg.
Note that the 3.6 factor was used to convert all variables in the same measure unit—joule (as 1 MWh = 3.6 Gigajoule).
The dataset used to calculate the coal-fired power plants’ thermal efficiency was from the JRC Open Power Plants Database (JRC-PPDB-OPEN). To emphasize each energy source’s contribution to the electricity production mix, we used the data provided by Transelectrica for 2019.
In order to calculate the energy losses from the process of transforming gross energy into energy available in the network for consumption, we used the Transelectrica methodology, which is based on the following formula:
N P = G A P ( P C O S + S C G S + P L T B )
where:
NP (net power) = The power that the generator can deliver to the network for marketing purposes;
GAP (gross available power) = Total electricity produced by the generator;
PCOS = Power consumed in own services;
SCGS = The share of consumption of general services; and
PLTB = Power losses in the transformer block.
We assumed generation (from Equation (1)) = NP (from Equation (2)) to correlate the two analyses. To calculate the pollution impact of the CEO and the CEH, we used the companies’ 2017 and 2018 environment and annual reports and the data provided in them regarding CO2, SO2, NOx, and PM 2.5 emissions. Next, starting with the amount of greenhouse gas emissions (SO2, NOx, and PM 2.5) at the national level, we analyzed the impact that the total closure of these two complexes would have on reducing greenhouse gas pollution. In addition, we investigated if such a scenario is relevant for reaching the 2030 air pollution targets imposed by the EU Green Deal. The impact was calculated at a national level by subtracting the pollution generated by the two energy complexes from the current air pollution levels.

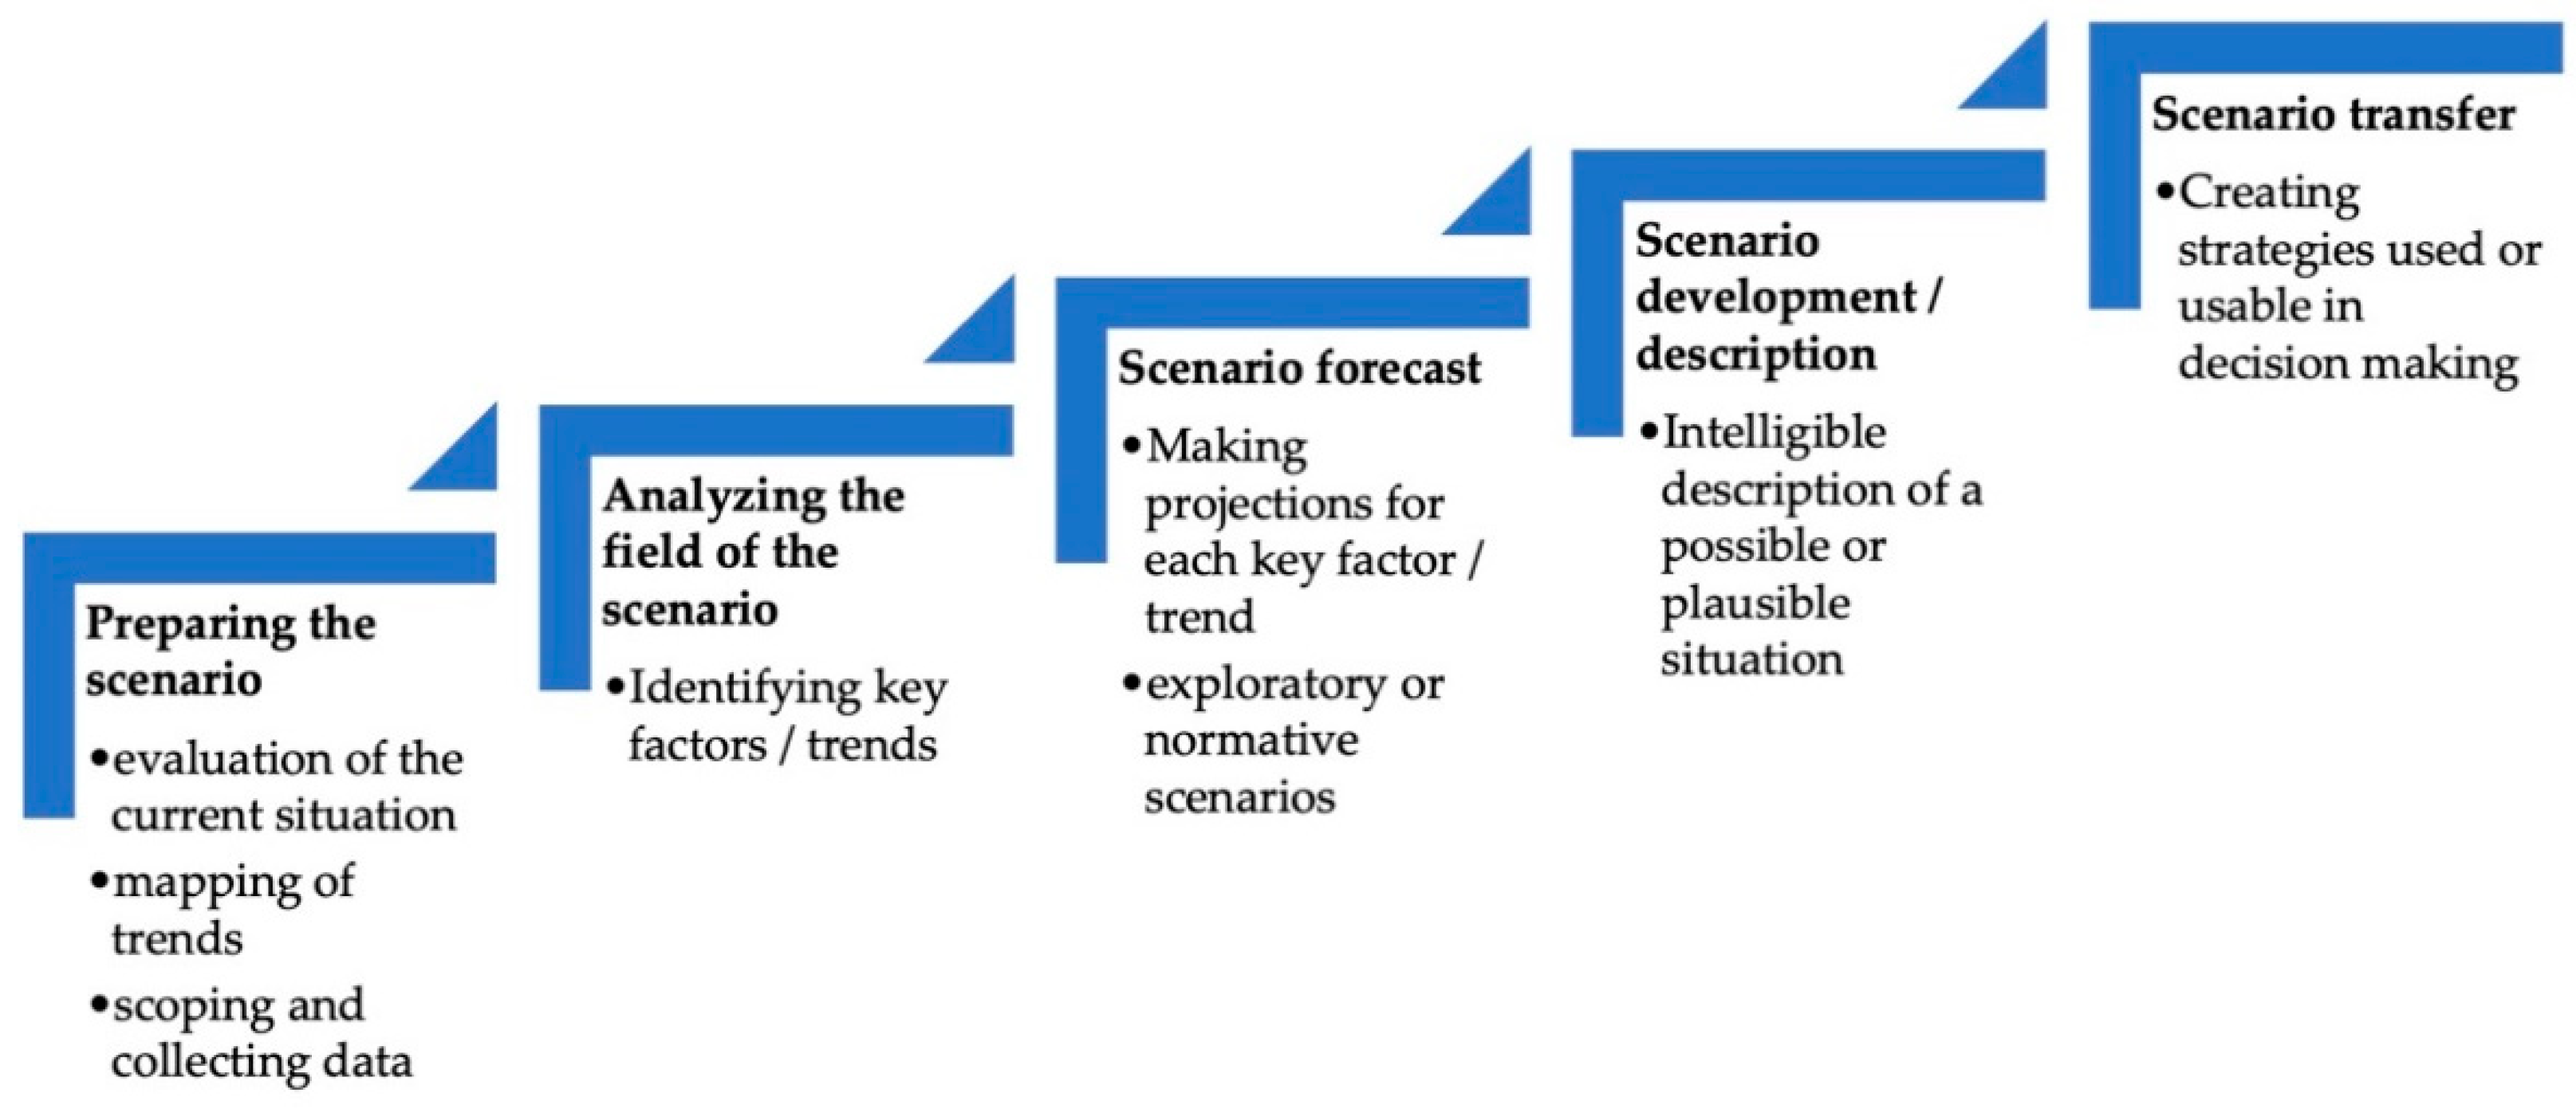
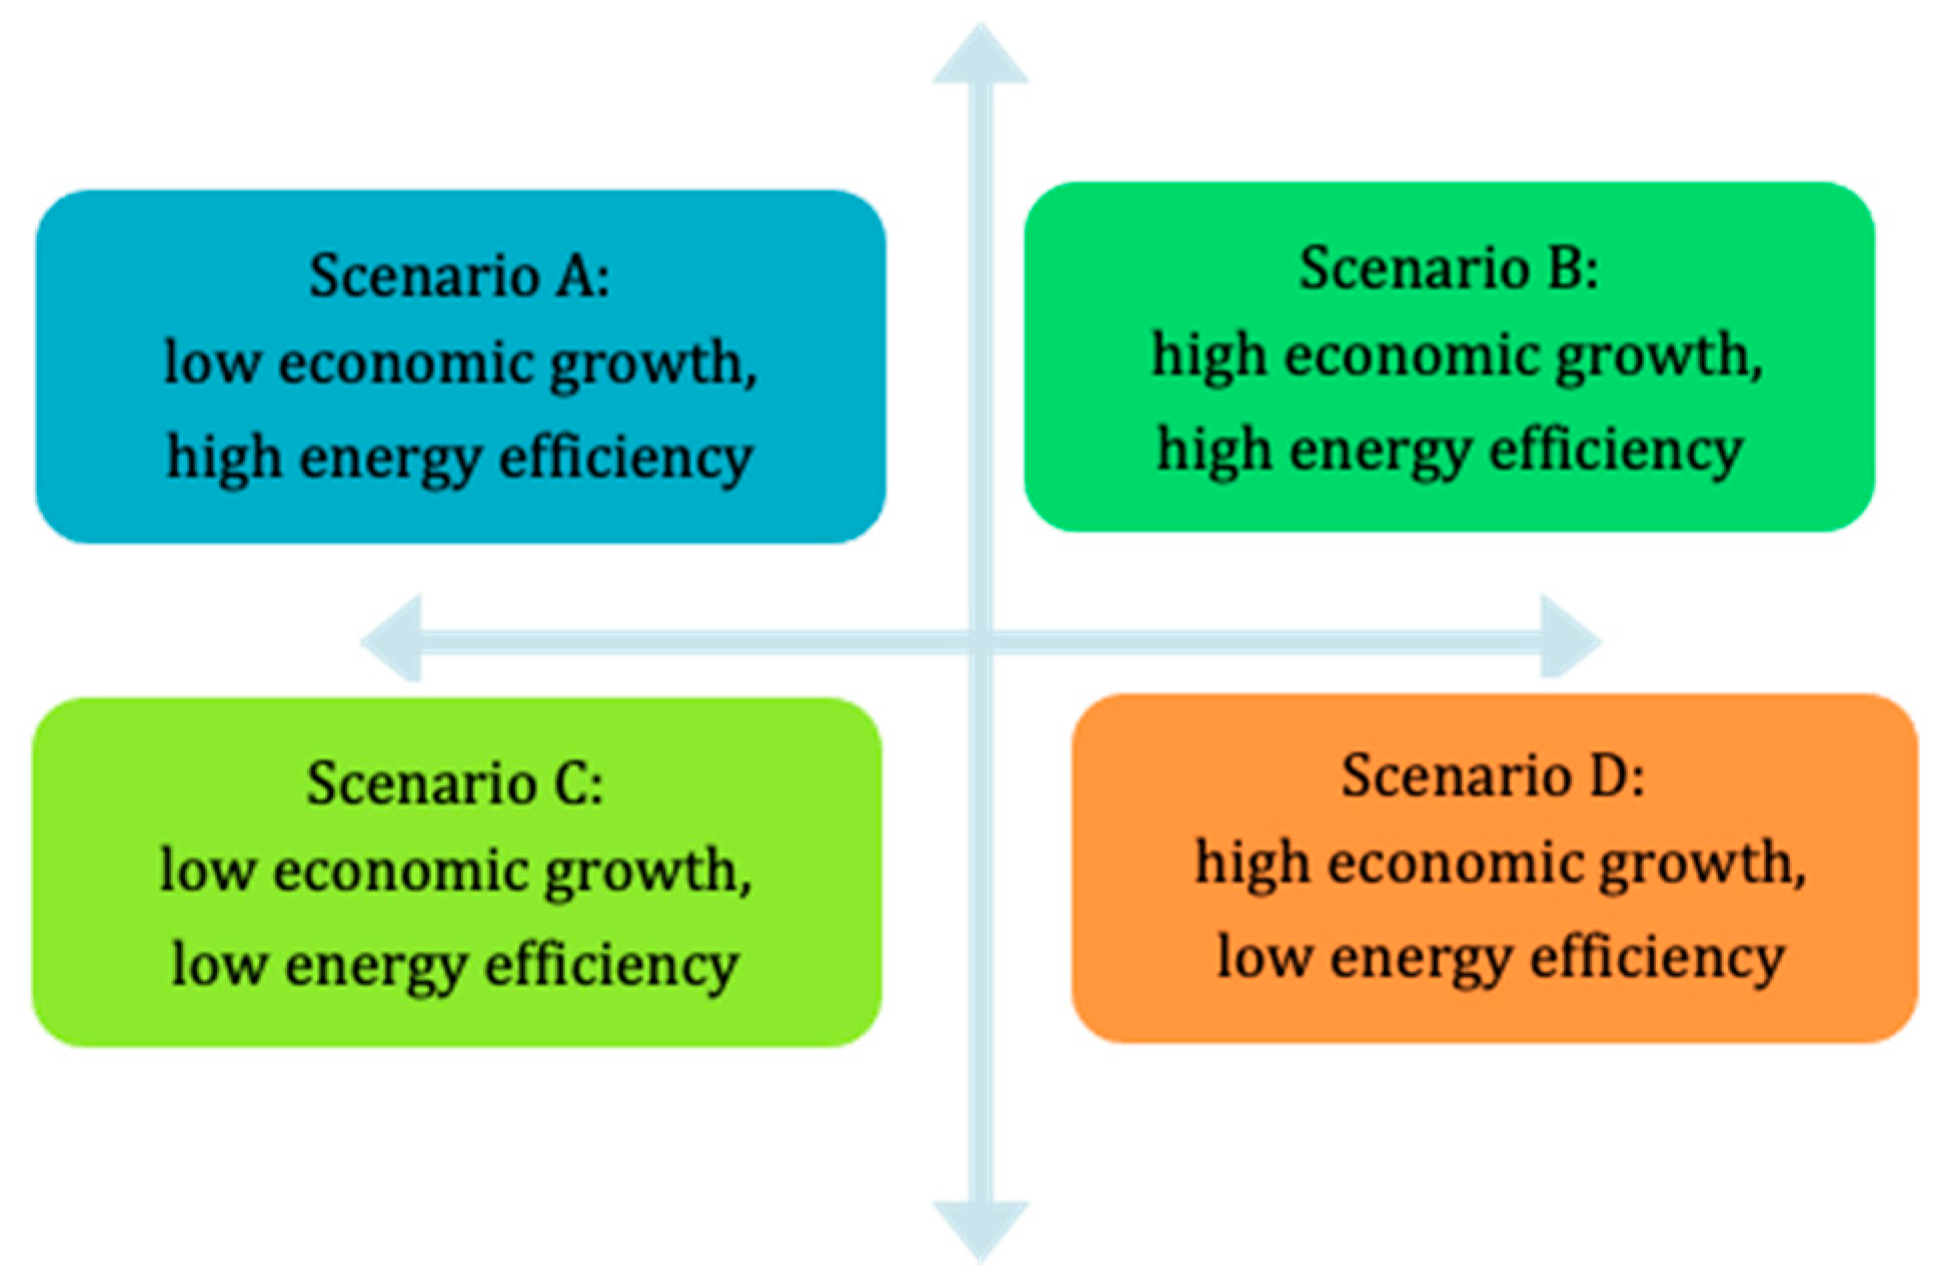
2.3. Scenario Methodology

Concerning scenarios, the methodology applied was again the classical version, according to Figure 4. The scenarios’ primary purpose was to assess the changes that occurred over a long period, evaluate the effects, and notify the decision-makers by suggesting strategies and policies to adapt to these changes. The scenarios were not intended to reflect all potential future circumstances; instead, they provide plausible answers to significant uncertainties and critical questions about an organization’s future growth or society.
An approach taxonomy to scenario modeling is created by defining a classification according to the distinction suggested by Rayner and Malone (1988) and Robinson and Timmerman (1993) (focused on values, meanings, and motivations) [74,75]. This distinction can be seen along with the exposure-correlation (local or global). Incorporating the subjective and interpretive viewpoints in a single paradigm is well established in the studies to date [76,77]. For quantitative evaluations, the recent approach in the field is to incorporate critical qualitative and narrative scenarios with global modeling [78,79], a situation in which it is also possible to use multifaceted evaluations on the sub-global level in multiscale assessments (MAs).
In this literature analysis, three categories of scenarios were identified: external (in which the determinants are external factors that participants in the affected system cannot influence), internal (the emphasis is on internal factors that are fully influential), and systemic (such as the case of the present research, which includes both external and internal factors). The most popular method of integrating elements is the matrix, represented in a scenarios-axes technique, as shaped by van’t Klooster and van Asselt (2006): scenario-axes as the backbone to scenario development as building scaffolding or as a foundation [80]. The widespread representation issue is that it uses only two of the most critical driving forces (as axes) with a decisive impact on the system analyzed. This approach caters to the idea that the primary source of errors in scenario modeling is the inability to integrate multiscale phenomena such as the regional approach opposed to the global approach. Models cannot account for evolutionary dependencies between the global and regional structures/networks such as the advent of irreversible phenomena [81,82,83].
Figure 4. Stages of scenario management based on the works of [81,82,83].
Energies 14 01509 g004

3. Results

The results are presented below according to the three methodological steps discussed below in the Discussion section.

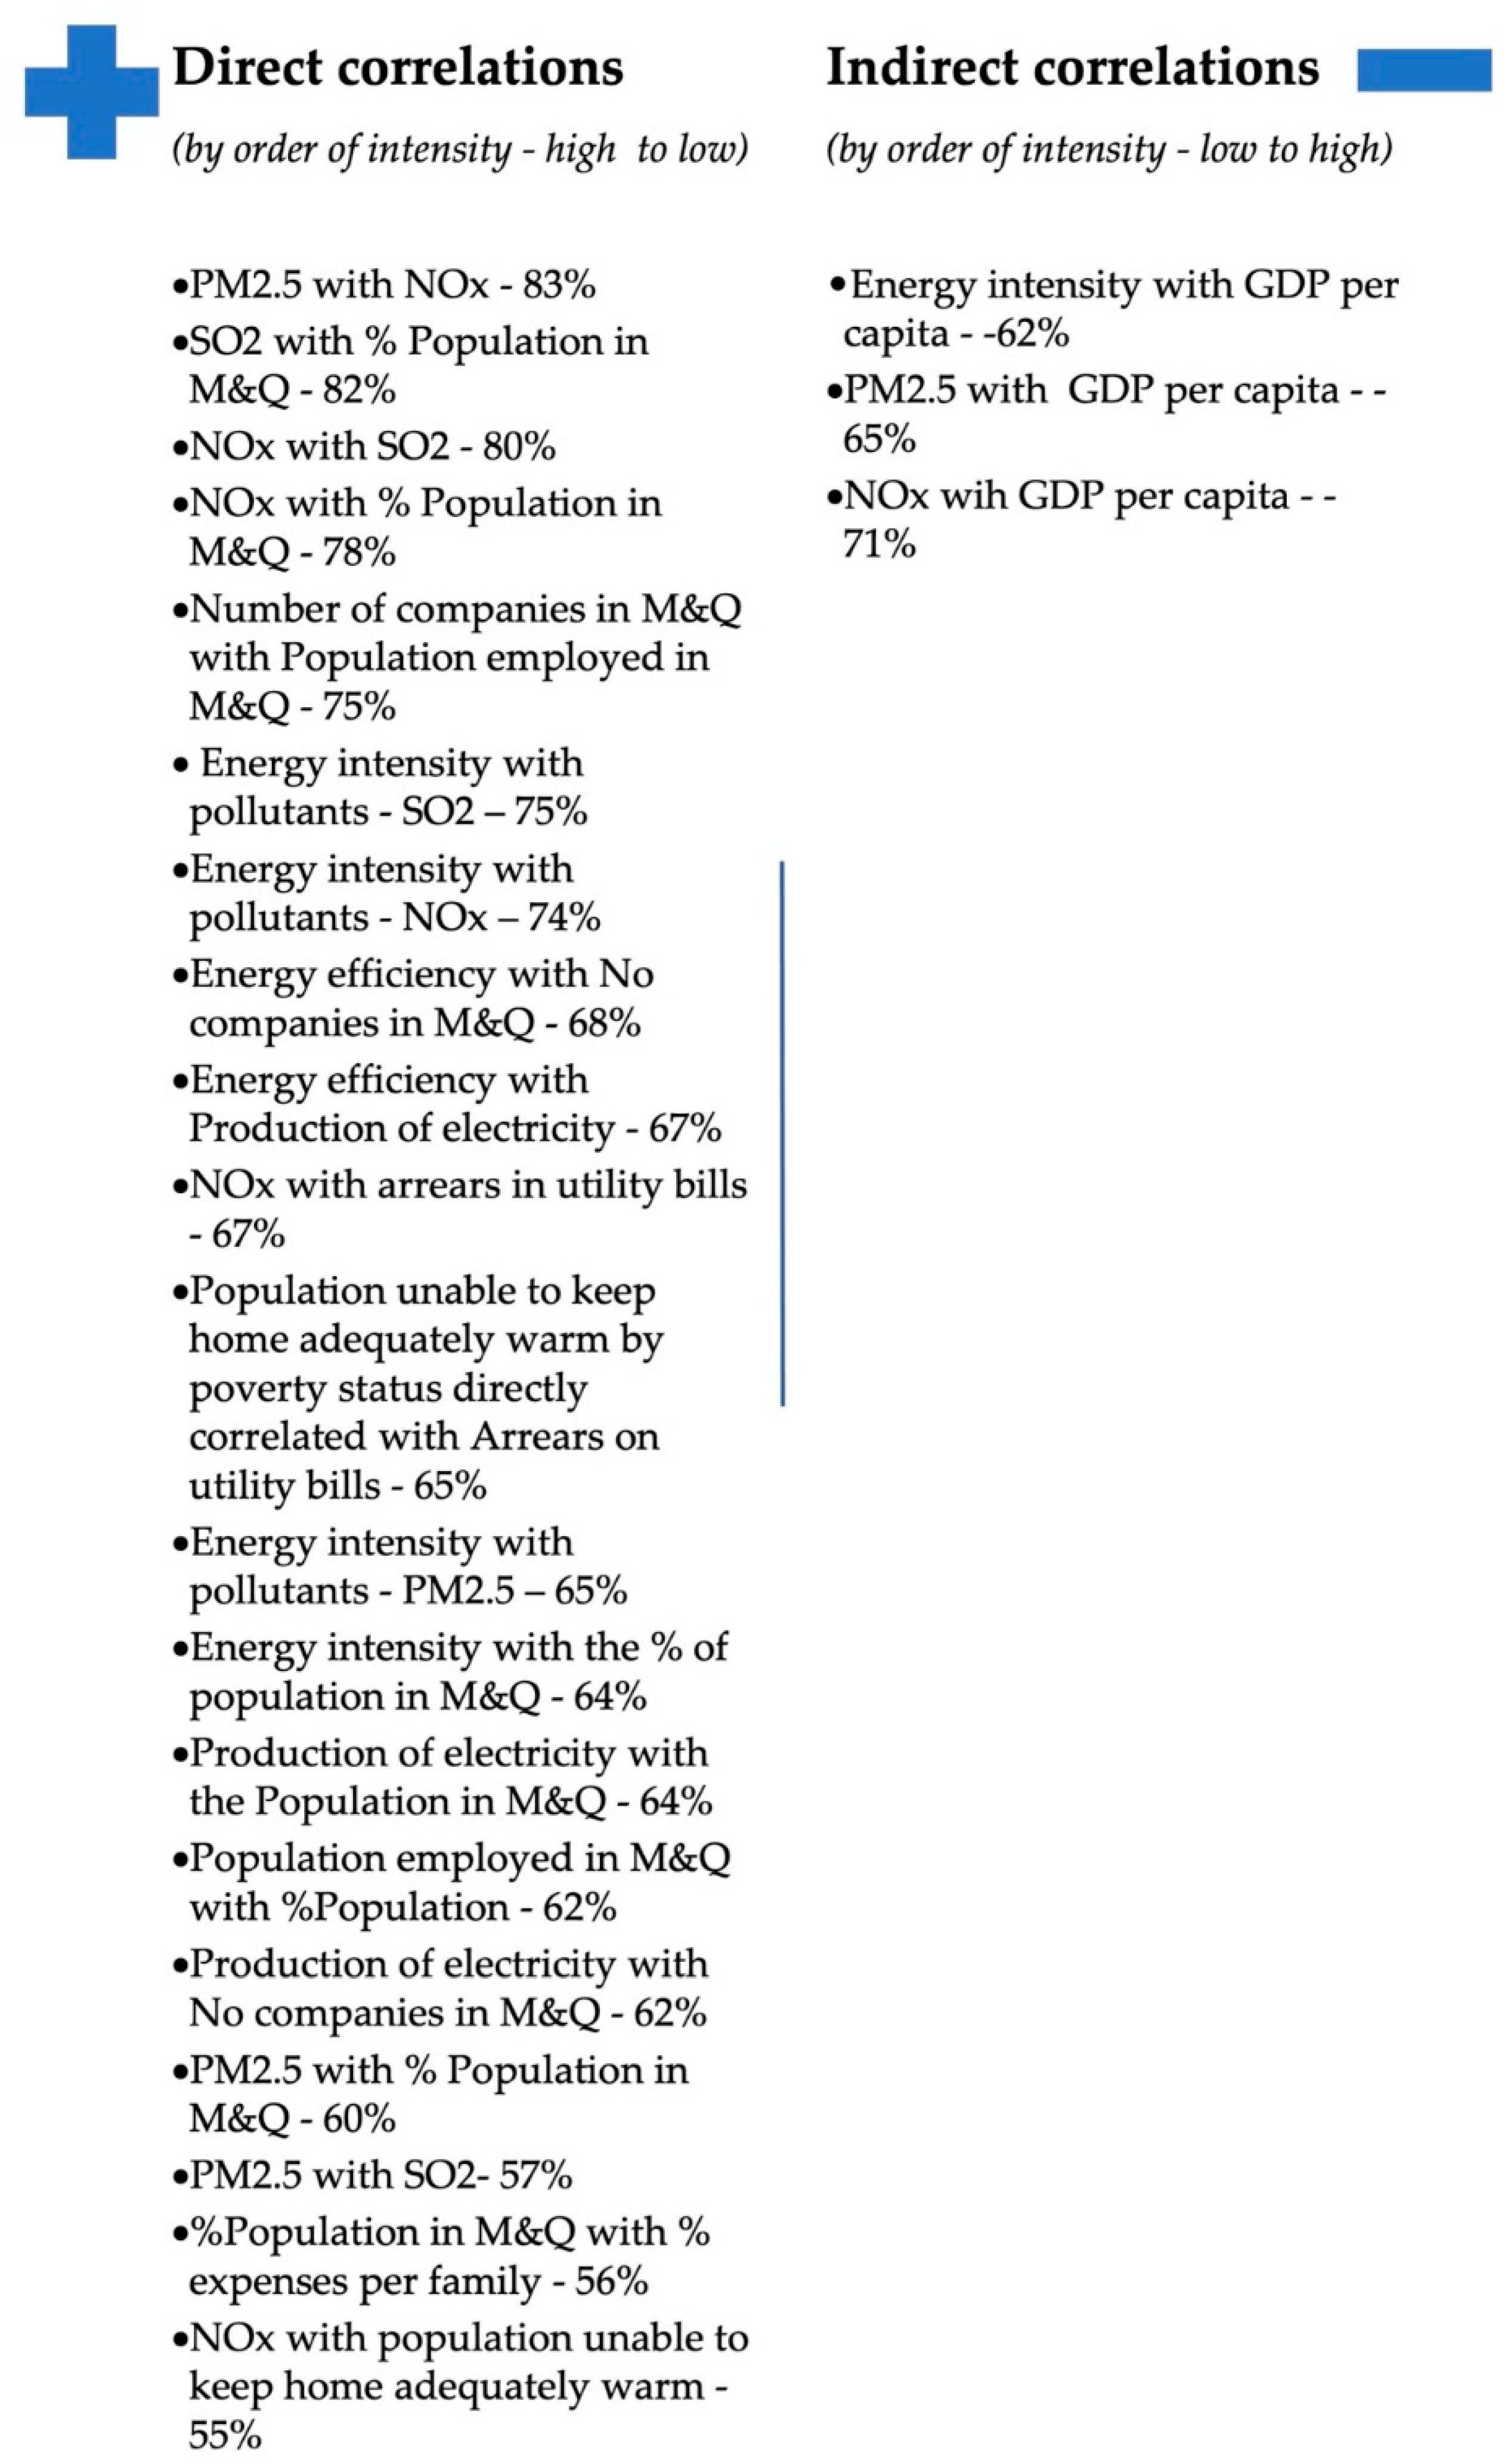
3.1. Cluster Analysis

The first analysis applied to the raw and standardized data was the correlation check. The following correlations were discovered:
  • Stage 1: Energy efficiency—direct correlation of 67% with production of electricity;
  • Stage 2: PM 2.5 directly correlated with SO2 (57%), PM 2.5 directly correlated with NOx (83%), NOx directly correlated with SO2 (80%);
  • Stage 3: Number of companies in M&Q directly correlated with population employed in M&Q (75%), population employed in M&Q directly correlated with % population (62%); and
  • Stage 4: Population unable to keep home adequately warm by poverty status directly correlated with arrears on utility bills (65%).
In the final integrative stage, the following direct and indirect correlation were noticed:
  • Production of electricity directly correlated with no. of companies in M&Q (62%) and with the population in M&Q (64%);
  • Energy intensity directly correlated with pollutants (PM 2.5—65%, SO2—75%, NOx—74%), with the % of population in M&Q (64%) and indirectly correlated to GDP per capita (−62%);
  • Energy efficiency directly correlated with no. of companies in M&Q (68%);
  • PM 2.5 directly correlated with % population in M&Q (60%) and indirectly correlated to GDP per capita (−65%) + energy intensity;
  • SO2 directly correlated with % population in M&Q (82%) + energy intensity;
  • NOx directly correlated with % population in M&Q (78%), arrears in utility bills (67%), population unable to keep home adequately warm (55%) + energy intensity and indirectly correlated to GDP per capita (−71%); and
  • % population in M&Q directly correlated with % expenses per family (56%) + see above.
The correlations are presented in Figure 5. Clustering algorithms were run, and the following results were obtained, as presented in Appendix A.
Significant differences appeared between the clusters created from raw data and standardized data, which led to a need to consolidate data to eliminate the erroneous weight of each correlated variable in the final results. This consolidation took place in the standardized data table; a treatment acknowledged as reducing biases in the analysis, with the following consolidation measures taken:
  • All pollutants were clustered into one variable (the mean average of the three variables).
  • All variables with correlations higher than 75% were eliminated; therefore % population in M&Q was eliminated.
  • In the second application of the correlation matrix, the only correlations higher than 75% were energy intensity vs. pollutant (78%) and no. of companies M&Q and population in M&Q (75%), which led to elimination from the analysis of the energy intensity and population in M&Q.
After this consolidation, data were considered suitable for an unbiased running of the clustering algorithm. Due to the consolidation, only integrative clustering was considered, as, for instance, Stage 2 was obsolete.
The unbiased analysis generated five clusters, as follows (see also Figure 6):
  • Cluster 1: The Czech Republic, Germany, Spain, France, Italy, Hungary, Portugal, Slovenia, Slovakia, Sweden, and the UK.
  • Cluster 2: Bulgaria, Greece, Cyprus, and Lithuania.
  • Cluster 3: Estonia, Croatia, Latvia, Romania, and Finland.
  • Cluster 4: Belgium, Denmark, Ireland, Luxembourg, Malta, the Netherlands, and Austria.
  • Cluster 5: Poland.

3.2. Efficiency in Energy Production Analysis

Table 1 shows the level of pollution produced by the two energy complexes responsible for 97% of the electricity generated from coal sources, CEH and CEO.
Using Equation (1) from the methodology [54] and the datasets provided in Appendix B, we presented the average thermal efficiency as well as the emissions estimated for every coal-based power plant (CO2, SO2, and PM 2.5). Moreover, given the average years of CEH and CEO, the efficiency is expected to decrease, while without any additional investment in new technologies, greenhouse gas emissions are expected to increase. Simultaneously, the lack of investment and low thermal efficiency will be reflected in the level of gas emissions and the energy losses. The coal sector has one of the most considerable losses in gross generated power. Figure 7 shows that more considerable losses in the energy production process are incurred for coal, oil, and gas (approximatively 14% of the gross energy production for both categories), having an essential share in the energy production mix (16% for oil and gas, and 24% for coal). The problem caused by these losses is all the thornier for coal-fired power plants, as they are financially inefficient due to the high costs of CO2 allowances. A loss of 14% of the gross energy produced by these power plants does nothing but put additional pressure on the budgets of the two energy complexes.

3.3. Scenario Development

The usual method for developing scenarios is to plot them on a matrix structure, as described in the methodology, starting from two critical factors. Based on previous stages of our research and literature in Romania’s coal mining regions, we considered the two critical factors to be economic growth and energy efficiency. Thus, the scenarios presented in Figure 8 are proposed in an exploratory manner. A detailed description of these scenarios, validated by qualitative data collection that would translate them into normative scenarios, is the next step in our research.
The energy efficiency considered here, for scenario development, refers to Romania’s ability to adhere to the Just Transition in the coal mining regions and to shift its energy mix to a more sustainable one. The economic growth done in the traditional manner of pushing the production is energy-intensive; therefore, achieving economic growth while keeping a high energy efficiency is challenging. The goal of the scenarios is to allow for proposals of specific policies that might increase the probability of the occurrence of scenario B from Figure 4.
Scenario A assumes that Romania would lose its economic drive due to global crises and diminishing competitiveness. However, it has managed to go through the Just Transition, and the energy efficiency of the entire economy is on the rise, with the support of renewables.
Scenario B might be considered as the best-case scenario and assumes a successful passing through the Just Transition while maintaining economic growth. This scenario would ask for smart policies that increase the share of services in the economic growth.
Scenario C may be considered as the worst-case of a failure in improving energy efficiency, which is a failed transition to a greener economy while losing competitiveness and growth.
Scenario D indicates that the current status is continued.

4. Discussion

We focused our article on Romania as a case study, as according to our analysis, it faces the highest vulnerability with regard to the ongoing energy transition in the European Union. As such, we accounted for both systemic vulnerabilities and policy measures. Romania’s situation is thus in contrast to other member states in CEE such as the Czech Republic, who have put forward mediation measures to counter the coal phase-out’s negative impacts and take full advantage of the Just Transition Mechanism. Even Poland—home to the largest coal-burning power station in Europe and still actively pursuing coal exploitation and energy production—has managed to establish new pathways of transition and regional transformation [66,86].
Based on our data, Romania is estimated to lose approximately 25% of its current production facilities given the coal phase-out and up to 40% if hydrocarbons are targeted under the Green Deal. Most of the energy production capacities to be lost are coal-based. The majority of those facilities, built during the communist period, have already surpassed their standard period of life, which, on the one hand, brings this country closer to the target of carbon neutrality. Nevertheless, on the other hand, this creates significant economic and social pressures in the affected regions due to narrow specialization and high reliance on the extraction of coal. In Romania, there are two regions where this problem is most stringent and where public policy support for the transition has to be specifically focused: the Vest and Sud-Vest regions. According to Eurostat data, the coal plants’ energy efficiency in Romania’s two regions of interest is on average 30%, well below the EU average of 35%. More than 50% of total SO2 and NOx emissions are released from coal mining activities in these regions in terms of air pollution. As such, innovative solutions are needed to mediate the transition’s shock and change the local development models.
In the transition to sustainable energy, current Eurostat estimates place cumulative job losses in the coal sector, by 2030, to be between 3000 and 6000 in the Vest region and between 6000 and 15,000 jobs in the Sud-Vest region. The part is profoundly affected by deindustrialization and out-migration, which have led to “shrinking cities” (i.e., urban areas faced with a rapid and drastic decrease of the population). Romania is facing a decline in human capital and reduced flexibility to reconversion and transition by a narrow horizon of regional specialization, an exodus of workers, a lack of allocated resources to entrepreneurs and start-ups, a deterioration of primary education and VET training, and an overall precarity of entrepreneurial culture [87,88,89]. All these effects are leveraged by the phenomena mentioned earlier. According to the European Commission 2019 Annual Report on Intra-EU Labor Mobility, 173,000 Romanians were hired in other EU countries in 2018, up by 7 percent than the previous year. Therefore, Romania is the EU Member State sending the most active movers; their numbers could be much higher in the next few years if the professional reconversion and reintegration into the workers’ labor market from the sectors affected by the green transition process are not managed efficiently.
Romania’s energy mix is well balanced compared to other member states from CEE, and the 2030 climate and energy framework targets have mostly been reached. However, the energy consumption from coal-fired power plants increases during the winter months from 24% to 40% of the energy mix, meaning that in the short run, in the case of mining closure, Romania would need to rely on imports.
Investments in the energy infrastructure are needed primarily because of the low efficiency and high pollution generated by the current facilities. Second, outside Bulgaria, in the CEE region, Romania has the worst situation in terms of arrears of utility bills (14.4% of the country’s population have delays in payment of utilities), and almost 10% of households fail to keep their homes adequately heated. In the absence of investments in alternative energy production sources, the closure of coal-based energy production will worsen these indicators.
Climate transition will significantly influence public and private spending in the coming years. Impact assessments and knowledge-sharing will be of paramount importance in ensuring that public authorities, investors, companies, cities, and people across the EU can develop the proper tools to engage in a just transition for all. Evidence-based policies and community-tailored solutions can contribute significantly to the successful pursuit of the Green Deal objectives at the subnational level. Therefore, this article can contribute to the evidence-based policy-making related to the Just Transition of coal regions in Romania. Our findings suggest that given the complexity of Romania’s energy transition and its socio-economic costs, the commitment to the Green Deal’s objectives is fundamentally linked to the extent of the political will at a national level.
The shift of scenarios from prospective to normative to implementable policies is based on various data analysis layers. It starts from a status quo assessment, identification of best practices, forecasting data using usual econometric methods, proposal of prospective scenarios, and, lastly, definition of policies meant to turn the latter to policies. These policies are either meant to increase the probability of a particular scenario (such as the best case) or provide mitigation if another scenario occurs (such as the worst case).
The scenarios proposed for the Romanian coal mining regions rely on the previous assessments of the regions themselves and the Just Transition requirements and desiderates. Plagued by the shrinking cities phenomenon and unemployment, these mono-industrial regions are confronted with the unprecedented need to shut down what is perceived to be an essential industry. Therefore, tracking best practices from other similar countries is relevant: apart from the cluster results that place Romania next to Estonia, Croatia, Latvia, and Finland, the measures used by states such as Germany or Poland (in clusters of their own) can also be integrated. Romania is clustered with smaller countries, more agile in terms of deployment of policies, further down the line in an alternative development of business ecosystems, with different economy make-ups is both interesting and challenging. It forces policy-makers to look outside the usual cluster partners for Romania of Poland and Bulgaria. As intended in our analysis, clustering is the first step toward identifying best practices, the latter being the subject of a different stage in our research project and, therefore, not covered in this article.
Another element to consider in the transfer to policies is the forecast of energy efficiency, based on current data. The two power plants are beyond their use period, and their energy efficiency is decreasing, so the trend is not hard to plot. Further modeling integrating four different options of business as usual, small alterations meant to keep the current level of efficiency from decreasing, extensive alterations, and complete shut-down, must be plotted in a dedicated in-depth analysis of the two power plants. This econometric forecast comports data unavailable at the time of our research and also constitutes a separate section in our research.
Finally, the proposed prospective scenarios are straightforward and explained. Nonetheless, the proposal of policies for each of them must integrate the growing complexity of the issue. For instance, in the case of stakeholders involved in the process, there are at least the following: the European Union, the European Commission, the national government, the regional (county) administration, the local administration, the business environment at European, national and regional level (considering the integration of coal in various supply chains), the employees of the two power plants and their families, the citizens in those regions relying on coal for heating, the unions of the employees, and green NGOs. This list is by no means exhaustive. However, it shapes a very complex landscape of stakeholders, at times with opposite needs and wants. The fact that the coal is mainly located in two Romanian regions means that the multi-level perspective is needed for a proper, deep-running, transformative regional shift; therefore, the next research lines should focus on regional holistic models, building on the econometrics of the RHOMOLO model [90], a spatial computable general equilibrium model, created by the Joint Research Centre for the European Commission, focusing on EU regions.
The normative scenarios will have to tackle this complexity, maintaining the idea that, ultimately, regardless of the data provided and the in-depth analysis, a shut-down is a political decision. However, anticipatory governance must allow for the data analyses and the resulting scenarios to be provided so that the political decision to be taken considers all implications. This article is a first step toward proposing anticipatory governance for the coal mining regions of Romania. In the second stage of our research, as presented in Figure 2, the future studies stage, the topics of MLP for Romania (identification of niches and drivers for a specific regional socio-technical regime), a reshaped Shift Index for the two coal-mining regions, and the adequation of the scenarios in a public policy setting (at national and local level) will be proposed in an integrated document. Whether it translates into real policies in the next period is beyond the article’s scope and its authors’ leverage.

Author Contributions

Conceptualization, R.V.-D., C.V., M.-F.P., V.N. and G.Ș.; Methodology, R.V.-D., C.V., M.-F.P., V.N. and G.Ș.; Software, R.V.-D., C.V., M.-F.P., V.N. and G.Ș.; Validation, R.V.-D., C.V., M.-F.P., V.N. and G.Ș.; Formal analysis, R.V.-D., C.V., M.-F.P., V.N. and G.Ș.; Investigation, R.V.-D., C.V., M.-F.P., V.N. and G.Ș.; Resources, R.V.-D., C.V., M.-F.P., V.N. and G.Ș.; Data curation, All; Writing—original draft preparation, R.V.-D., C.V., M.-F.P., V.N. and G.Ș.; Writing—review and editing, R.V.-D., C.V., M.-F.P., V.N. and G.Ș.; Visualization, R.V.-D., C.V., M.-F.P., V.N. and G.Ș.; Supervision, R.V.-D.; Project administration, R.V.-D.; Funding acquisition, V.N. and R.V.-D. All authors have read and agreed to the published version of the manuscript.

Funding

This research was funded by the European Investment Bank, project “STAREBEI-Sustainable Paths of Just Transition for the Coal Regions in Romania”, 2020–2021.

Institutional Review Board Statement

Not Applicable.

Informed Consent Statement

Not Applicable.

Data Availability Statement

All datasets used in this study were taken from Eurostat (https://appsso.eurostat.ec.europa.eu/ (accessed on 7 March 2021)) with the following codes NRG_BAL_PEH, NRG_IND_EI, NRG_IND_EFF, env_air_emis, NRG_IND_FFGAE, sbs_sc_ind_r2, lfsa_egan2, NAMA_10_PC, ilc_mdes07, nama_10_co3_p3, SDG_07_60; Transelectrica (https://www.transelectrica.ro/documents/10179/45094/7productie12a.xls/25e8acf0-a131-4d65-99b3-e9b08a621954 (accessed on 7 March 2021)), JRC Open Power Plants Database (https://zenodo.org/record/3574566#.YBgdCugzZPY (accessed on 7 March 2021)).

Acknowledgments

This article was supported by the project “STAREBEI-Sustainable Paths of Just Transition for the Coal Regions in Romania”, 2020–2021, funded by the European Investment Bank. Any errors remain those of the authors. The findings, interpretations, and conclusions presented in this document are entirely those of the authors and should not be attributed in any manner to the European Investment Bank. The project was also supported by the Center of Excellence in Foreign Trade at the Bucharest University of Economic Studies.

Conflicts of Interest

The authors declare no conflict of interest. The funders had no role in the design of the study; in the collection, analyses, or interpretation of data; in the writing of the manuscript, or in the decision to publish the results.

Appendix A

Table A1. Clusters resulted in the four stage process based on raw data and standardized data.
Clusters resulted from raw data
Stage 1Stage 2Stage 3Stage 4Integrative
CountryClusterCountryClusterCountryClusterCountryClusterCountryCluster
Austria1The Czech Republic1Belgium1Belgium1Belgium1
Belgium1Cyprus1Denmark1Germany1Denmark1
Croatia1Bulgaria2Estonia1France1Ireland1
Cyprus1Estonia2Ireland1The Netherlands1France1
Denmark1Poland2Croatia1Austria1The Netherlands1
Estonia1Greece3Cyprus1Finland1Austria1
Finland1Croatia3Latvia1Sweden1Finland1
Hungary1Latvia3Lithuania1The UK1Sweden1
Ireland1Lithuania3Luxembourg1Bulgaria2Germany2
Latvia1Romania3Hungary1Greece2The UK2
Lithuania1Spain4Malta1Croatia2Bulgaria3
Luxembourg1Hungary4Slovenia1Latvia2The Czech Republic3
Malta1Portugal4Bulgaria2Lithuania2Estonia3
Slovakia1Slovenia4The Czech Republic2Hungary2Greece3
Slovenia1Slovakia4Spain2Poland2Spain3
Sweden1Belgium5Italy2Romania2Croatia3
The Czech Republic2Denmark5Romania2Slovakia2Italy3
Italy2Germany5Germany3The Czech Republic3Cyprus3
The Netherlands2Ireland5The UK3Estonia3Latvia3
Spain2France5Greece4Spain3Lithuania3
Poland3Italy5France4Italy3Hungary3
Bulgaria4Luxembourg5The Netherlands4Cyprus3Malta3
France4Malta5Austria4Malta3Portugal3
Greece4The Netherlands5Portugal4Portugal3Romania3
Portugal4Austria5Slovakia4Slovenia3Slovenia3
Romania4Finland5Finland4Luxembourg4Slovakia3
The UK4Sweden5Sweden4Denmark5Luxembourg4
Germany5The UK5Poland5Ireland5Poland5
Clusters resulted from standardized data
Stage 1Stage 2Stage 3Stage 4Integrative
CountryClusterCountryClusterCountryClusterCountryClusterCountryCluster
Spain1Spain1Spain1Cyprus1Cyprus1
France1France1France1Lithuania1Lithuania1
Italy1Italy1Italy1Portugal1Portugal1
The UK1The UK1The UK1Bulgaria2Bulgaria2
Bulgaria2Bulgaria2Bulgaria2Greece2Greece2
Estonia2Estonia2Estonia2The Czech Republic3The Czech Republic3
Malta2Malta2Malta2Croatia3Croatia3
The Czech Republic3The Czech Republic3The Czech Republic3Latvia3Latvia3
Poland3Poland3Poland3Poland3Poland3
Belgium4Belgium4Belgium4Slovenia3Slovenia3
Denmark4Denmark4Denmark4Slovakia3Slovakia3
Ireland4Ireland4Ireland4Luxembourg4Luxembourg4
Greece4Greece4Greece4Belgium5Belgium5
Croatia4Croatia4Croatia4Denmark5Denmark5
Cyprus4Cyprus4Cyprus4Germany5Germany5
Latvia4Latvia4Latvia4Estonia5Estonia5
Lithuania4Lithuania4Lithuania4Ireland5Ireland5
Luxembourg4Luxembourg4Luxembourg4Spain5Spain5
Hungary4Hungary4Hungary4France5France5
The Netherlands4The Netherlands4The Netherlands4Italy5Italy5
Austria4Austria4Austria4Hungary5Hungary5
Portugal4Portugal4Portugal4Malta5Malta5
Romania4Romania4Romania4The Netherlands5The Netherlands5
Slovenia4Slovenia4Slovenia4Austria5Austria5
Slovakia4Slovakia4Slovakia4Romania5Romania5
Finland4Finland4Finland4Finland5Finland5
Sweden4Sweden4Sweden4Sweden5Sweden5
Germany5Germany5Germany5The UK5The UK5

Appendix B

Table A2. Data used for calculations of the efficiency in energy production for CEH and CEO [84,85].
Extracted Coal (mil.tons) and Generated Energy (TWh) for CEO and CEH
CEO201420152016201720182019
Extracted Coal (mil.tons)21.5 21.02819.439
Generated energy (TWh)13.3 14.9214.1412.4
CEH201420152016201720182019
Extracted Coal (mil.tons)1.1220.8240.7370.5740.529
Generated Energy (TWh)2.7111.8421.4231.1990.960
Generated Energy (in Mwh and Gj) by CEO and CEH
Generated energy (MWh)201420152016201720182019
CEO13,300,0000014,920,00014,140,00012,400,000
CEH2,710,5521,842,4371,422,5661,199,156960,0200
Generated Energy (Gj)201420152016201720182019
CEO47,880,0000053,712,00050,904,00044,640,000
CEH9,757,9876,632,773.25,121,2384,316,9623,456,0720

References

  1. European European Commission. The Just Transition Mechanism: Making Sure No One Is Left behind. Available online: https://ec.europa.eu/info/strategy/priorities-2019-2024/european-green-deal/actions-being-taken-eu/just-transition-mechanism_en (accessed on 2 February 2021).
  2. Guston, D.H. Understanding anticipatory governance. Soc. Stud. Sci. 2014, 44, 218–242. [Google Scholar] [CrossRef] [Green Version]
  3. Muiderman, K.; Gupta, A.; Vervoort, J.; Biermann, F. Four approaches to anticipatory climate governance: Different conceptions of the future and implications for the present. Wiley Interdiscip. Rev. Clim. Chang. 2020, 11, 673. [Google Scholar] [CrossRef]
  4. Zapletalová, V.; Komínková, M. Who is fighting against the EU’s energy and climate policy in the European Parliament? The contribution of the Visegrad Group. Energy Policy 2020, 139, 111326. [Google Scholar] [CrossRef]
  5. Mares, D.R. Achieving sustainable and inclusive economic growth in Latin America: National development during the commodity boom. Rev. Neiba Cad. Argent. Bras. 2020, 9. [Google Scholar] [CrossRef]
  6. Jung, T.Y. Sustainable Development Goals in the Republic of Korea; Routledge: London, UK, 2018. [Google Scholar]
  7. Ćetković, S.; Buzogány, A. The political economy of EU climate and energy policies in Central and Eastern Europe revisited: Shifting coalitions and prospects for clean energy transitions. Politics Gov. 2019, 7, 124. [Google Scholar] [CrossRef]
  8. Volintiru, C.; Popescu, M.-F.; Franţescu, D.; Ciot, M.G. Political Support at EU Level for Energy and Environmental Policies. Rom. J. Eur. Aff. 2019, 19, 30–50. [Google Scholar]
  9. Volintiru, C. EU’s Soft Power in Green Diplomacy–Scaling-Up Consensus from Subnational and National Initiatives; Institute of European Democrats: Brussels, Belgium, 2020. [Google Scholar]
  10. Volintiru, C.; Bargaoanu, A.; Durach, F.; Ștefan, G. East-West Divide? Development Challenges and Policy Preferences in the EU; Institute of European Democrats: Brussels, Belgium, 2021. [Google Scholar]
  11. Volintiru, C.; Stefan, G.; Nerau, V. Energy sector in Romania–Investment gap and opportunities. In Energy Connectivity in Central Europe and the Three Seas Initiative Countries: Issues, Challenges, Opportunities; Routledge: London, UK, 2021. [Google Scholar]
  12. Koltsaklis, N.E.; Dagoumas, A.S.; Seritan, G.; Porumb, R. Energy transition in the South East Europe: The case of the Romanian power system. Energy Rep. 2020, 6, 2376–2393. [Google Scholar] [CrossRef]
  13. European Commission. Amended Proposal for a Regulation of the European Parliament and of the Council Establishing the Just Transition Fund. Available online: https://eur-lex.europa.eu/legal-content/EN/TXT/?qid=1592556018727&uri=CELEX:52020PC0460 (accessed on 31 January 2021).
  14. Rip, A.; Kemp, R. Technological change. Hum. Choice Clim. Chang. 1998, 2, 327–399. [Google Scholar]
  15. Geels, F.W. Technological transitions as evolutionary reconfiguration processes: A multi-level perspective and a case-study. Res. Policy 2002, 31, 1257–1274. [Google Scholar] [CrossRef] [Green Version]
  16. Geels, F.W. From sectoral systems of innovation to socio-technical systems: Insights about dynamics and change from sociology and institutional theory. Res. Policy 2004, 33, 897–920. [Google Scholar] [CrossRef]
  17. Geels, F.W. Technological Transitions and System Innovations: A Co-Evolutionary and Socio-Technical Analysis; Edward Elgar Publishing: Cheltenham, UK, 2005. [Google Scholar]
  18. Geels, F.W.; Schot, J. Typology of sociotechnical transition pathways. Res. Policy 2007, 36, 399–417. [Google Scholar] [CrossRef]
  19. Schot, J.; Geels, F.W. Strategic niche management and sustainable innovation journeys: Theory, findings, research agenda, and policy. Technol. Anal. Strateg. Manag. 2008, 20, 537–554. [Google Scholar] [CrossRef]
  20. Geels, F.W. Ontologies, socio-technical transitions to sustainability, and the multi-level perspective. Res. Policy 2010, 39, 495–510. [Google Scholar] [CrossRef]
  21. Geels, F.W. The multi-level perspective on sustainability transitions: Responses to seven criticisms. Environ. Innov. Soc. Transit. 2011, 1, 24–40. [Google Scholar] [CrossRef]
  22. Geels, F.W. Regime resistance against low-carbon transitions: Introducing politics and power into the multi-level perspective. Theory Cult. Soc. 2014, 31, 21–40. [Google Scholar] [CrossRef] [Green Version]
  23. Geels, F.W. Socio-technical transitions to sustainability: A review of criticisms and elaborations of the multi-level perspective. Curr. Opin. Environ. Sustain. 2019, 39, 187–201. [Google Scholar] [CrossRef]
  24. Denning, S.; Hagel, J.; Brown, J.S.; Davison, L. The Shift Index 2011: The Most Important Business Study Ever? Forbes.com, 25 January 2012. [Google Scholar]
  25. Hagel, J.; Brown, J.S.; Davison, L. Measuring the Forces of Long-Term Change: The 2009 Shift Index; Deloitte Center for the Edge: New York, NY, USA, 2009; p. 29. [Google Scholar]
  26. Voicu-Dorobantu, R.; Paraschiv, D.M.; Marinoiu, A.M. Eco-Innovation in Romanian SMEs. Recent Res. Appl. Econ. 2011, 1, 186–190. [Google Scholar]
  27. Paraschiv, D.M.; Voicu-Dorobantu, R.; Langa Olaru, C.; Laura Nemoianu, E. New models in support of the eco-innovative capacity of companies—A theoretical approach. Econ. Comput. Econ. Cybern. Stud. Res. 2012, 5, 103–116. [Google Scholar]
  28. Voicu-Dorobantu, R. Flexibilitate Și Sustenabilitate în Ecosistemele Antreprenoriale Regionale Din România (Flexibility and Sustainability in Romanian Regional Entrepreneurial Ecosystems). Ph.D. Thesis, The Romanian Academy, Bucharest, Romania, 2015, unpublished. [Google Scholar]
  29. Cooke, P. Green governance and green clusters: Regional & national policies for the climate change challenge of Central & Eastern Europe. J. Open Innov. Technol. Mark. Complex. 2015, 1, 1–17. [Google Scholar] [CrossRef] [Green Version]
  30. Armeanu, D.Ş.; Gherghina, Ş.C.; Pasmangiu, G. Exploring the causal nexus between energy consumption, environmental pollution and economic growth: Empirical evidence from Central and Eastern Europe. Energies 2019, 12, 3704. [Google Scholar] [CrossRef] [Green Version]
  31. Pavlínek, P.; Pickles, J. Environmental Transitions: Transformation and Ecological Defense in Central and Eastern Europe; Psychology Press: London, UK, 2000. [Google Scholar]
  32. Aghion, P.; Blanchard, O.J.; Carlin, W. The economics of enterprise restructuring in Central and Eastern Europe. In Property Relations, Incentives and Welfare, Proceedings of the International Economic Association Conference; Roemer, J.E., Ed.; International Economic Association Series; Palgrave Macmillan: London, UK, 1997; pp. 271–325. ISBN 978-1-349-25287-9. [Google Scholar]
  33. Broadberry, S.; Gupta, B. The early modern great divergence: Wages, prices and economic development in Europe and Asia, 1500–1800. Econ. History Rev. 2006, 59, 2–31. [Google Scholar] [CrossRef] [Green Version]
  34. Delteil, V.; Kirov, V.N. Labour and Social Transformation in Central and Eastern Europe: Europeanization and Beyond; Routledge: London, UK, 2016. [Google Scholar]
  35. Drahokoupil, J.; Myant, M. Dependent capitalism and employment relations in East Central Europe. In Labour and Social Transformation in Central and Eastern Europe: Europeanization and Beyond; Routledge: Abingdon, UK, 2016; pp. 42–59. [Google Scholar]
  36. Šćepanović, V.; Bohle, D. The institutional embeddedness of transnational corporations: Dependent capitalism in Central and Eastern Europe. In Handbook of the International Political Economy of the Corporation; Edward Elgar Publishing: Cheltenham, UK, 2018. [Google Scholar]
  37. Ban, C. Dependent development at a crossroads? Romanian capitalism and its contradictions. West Eur. Politics 2019, 42, 1041–1068. [Google Scholar] [CrossRef]
  38. Gilbert, J.; Muchová, E. Export competitiveness of Central and Eastern Europe since the enlargement of the EU. Int. Rev. Econ. Financ. 2018, 55, 78–85. [Google Scholar] [CrossRef] [Green Version]
  39. Tcvetkov, P. Climate policy imbalance in the energy sector: Time to focus on the value of CO2 utilization. Energies 2021, 14, 411. [Google Scholar] [CrossRef]
  40. Iotzov, V.; Gauk, M. Policy Brief: Structural Change in Coal Phase-Out Regions; ESPON EGTC: Luxembourg, 2020; p. 22. [Google Scholar]
  41. Bointner, R. Innovation in the energy sector: Lessons learnt from R&D expenditures and patents in selected IEA countries. Energy Policy 2014, 73, 733–747. [Google Scholar] [CrossRef]
  42. Wangler, L.U. Renewables and innovation: Did policy induced structural change in the energy sector effect innovation in green technologies? J. Environ. Plan. Manag. 2013, 56, 211–237. [Google Scholar] [CrossRef]
  43. Grubler, A.; Aguayo, F.; Gallagher, K.; Hekkert, M.; Jiang, K.; Mytelka, L.; Neij, L.; Nemet, G.; Wilson, C. Policies for the energy technology innovation system (ETIS). In Global Energy Assessment—Toward a Sustainable Future; Cambridge University Press: Cambridge, UK; New York, NY, USA, 2012; Chapter 24; pp. 1665–1744. [Google Scholar]
  44. Voicu-Dorobanțu, R. European regions and entrepreneurial ecosystems in the context of the new sustainable development goals. J. East. Eur. Res. Bus. Econ. 2016, 2016, 145844. [Google Scholar] [CrossRef] [Green Version]
  45. Barzotto, M.; Corradini, C.; Fai, F.M.; Labory, S.; Tomlinson, P.R. Enhancing innovative capabilities in lagging regions: An extra-regional collaborative approach to RIS3. Camb. J. Reg. Econ. Soc. 2019, 12, 213–232. [Google Scholar] [CrossRef]
  46. Copus, A.K. From Core-Periphery to Polycentric Development: Concepts of Spatial and Aspatial Peripherality. Eur. Plan. Stud. 2001, 9, 539–552. [Google Scholar] [CrossRef]
  47. Sinea, A.; Murafa, C.; Jiglău, G. Energy Poverty and the Vulnerable Consumer in Romania and Europe; Presa Universitară Clujeană: Cluj-Napoca, Romania, 2018; ISBN 978-606-37-0459-8. [Google Scholar]
  48. Druică, E.; Goschin, Z.; Ianole-Călin, R. Energy poverty and life satisfaction: Structural mechanisms and their implications. Energies 2019, 12, 3988. [Google Scholar] [CrossRef] [Green Version]
  49. Sinea, A.; Jiglău, G. Dealing with energy poverty from the bottom up. Local approaches to a pan-european issue. In Sustainable Development and Resilience of Local Communities and Public Sector Organizations; Accent: Cluj-Napoca, Romania, 2019; p. 584. [Google Scholar]
  50. European Commission. Commission Staff Working Paper: An Energy Policy for Consumers; European Commission: Brussels, Belguim, 2010. [Google Scholar]
  51. Tagliapietra, S. The European Climate Law Needs a Strong Just Transition Fund. Bruegel-Blogs, 6 October 2020. [Google Scholar]
  52. European Parliamentary Research Service Briefing—EU Support for Coal Regions; European Parliament: Brussels, Belguim, 2019; p. 8.
  53. Publications Office of the European Union Clean Energy for All Europeans. Available online: http://op.europa.eu/en/publication-detail/-/publication/b4e46873-7528-11e9-9f05-01aa75ed71a1/language-en (accessed on 31 January 2021).
  54. Alves Dias, P.; Kanellopoulos, K.; Medarac, H.; Kapetaki, Z.; Miranda-Barbosa, E.; Shortall, R.; Czako, V.; Telsnig, T.; Vazquez-Hernandez, C.; Lacal Arántegui, R. EU Coal Regions: Opportunities and Challenges Ahead; European Commission, Joint Research Centre: Petten, The Netherlands, 2018. [Google Scholar]
  55. Keles, D.; Yilmaz, H.Ü. Decarbonisation through coal phase-out in Germany and Europe–Impact on emissions, electricity prices and power production. Energy Policy 2020, 141, 111472. [Google Scholar] [CrossRef]
  56. Oei, P.-Y.; Brauers, H.; Herpich, P. Lessons from Germany’s hard coal mining phase-out: Policies and transition from 1950 to 2018. Clim. Policy 2020, 20, 963–979. [Google Scholar] [CrossRef] [Green Version]
  57. Spero, J.E. Energy Self-Sufficiency and National Security. Acad. Political Soc. 1973, 31, 123–136. [Google Scholar] [CrossRef]
  58. Rentier, G.; Lelieveldt, H.; Kramer, G.J. Varieties of coal-fired power phase-out across Europe. Energy Policy 2019, 132, 620–632. [Google Scholar] [CrossRef]
  59. Anderson, K. The Political economy of coal subsidies in Europe. Energy Policy 1995, 23, 485–496. [Google Scholar] [CrossRef]
  60. Storchmann, K. The rise and fall of German hard coal subsidies. Energy Policy 2005, 33, 1469–1492. [Google Scholar] [CrossRef]
  61. Frondel, M.; Kambeck, R.; Schmidt, C.M. Hard coal subsidies: A never-ending story? Energy Policy 2007, 35, 3807–3814. [Google Scholar] [CrossRef] [Green Version]
  62. Heinrichs, H.U.; Markewitz, P. A coal phase-out in Germany—Clean, efficient and affordable? Energy Procedia 2015, 75, 2541–2547. [Google Scholar] [CrossRef] [Green Version]
  63. Lewis, A.B. Poland Feels the Pain of Its Love Affair with Coal. Reuters, 15 April 2016. [Google Scholar]
  64. Daroń, M.; Wilk, M. Management of energy sources and the development potential in the energy production sector—A comparison of EU countries. Energies 2021, 14, 685. [Google Scholar] [CrossRef]
  65. Claeys, G.; Tagliapietra, S.; Zachmann, G. How to Make the European Green Deal Work; Bruegel: Brussels, Belgium, 2019; Available online: https://www.bruegel.org/wp-content/uploads/2019/11/PC-13_2019-151119.pdf (accessed on 7 March 2021).
  66. Mayer, A. A Just transition for coal miners? Community identity and support from local policy actors. Environ. Innov. Soc. Transit. 2018, 28, 1–13. [Google Scholar] [CrossRef]
  67. Healy, N.; Barry, J. Politicizing energy justice and energy system transitions: Fossil fuel divestment and a “Just transition”. Energy Policy 2017, 108, 451–459. [Google Scholar] [CrossRef] [Green Version]
  68. Siddi, M. The European Green Deal: Assessing Its Current State and Future Implementation; FIIA Working Paper 114; The Finnish Institute of International Affairs: Helsinki, Finland, May 2020. [Google Scholar]
  69. Metzger, M.; Duckheim, M.; Franken, M.; Heger, H.J.; Huber, M.; Knittel, M.; Kolster, T.; Kueppers, M.; Meier, C.; Most, D. Pathways toward a decarbonized future—Impact on security of supply and system stability in a sustainable German energy system. Energies 2021, 14, 560. [Google Scholar] [CrossRef]
  70. Barbu, D. Romania’s Power Strategy–Role of Coal. 2018. Available online: https://ec.europa.eu/energy/sites/ener/files/documents/4_priority_projects_in_jiu_valley_viorel_stancu_hunedoara_energy_complex.pdf (accessed on 7 March 2021).
  71. Transelectrica. Raport Anual 2019; Transelectrica: Bucharest, Romania, 2020. [Google Scholar]
  72. Milligan, G.W.; Cooper, M.C. A study of standardization of variables in cluster analysis. J. Classif. 1988, 5, 181–204. [Google Scholar] [CrossRef]
  73. K-Means Clustering. Wikipedia, 17 January 2021. Available online: https://en.wikipedia.org/wiki/K-means_clustering(accessed on 7 March 2021).
  74. Rayner, S.; Malone, E. The challenge of climate change to the social sciences. In Human Choice and Climate Change, What Have We Learned; Battelle Press: Columbus OH, USA, 1988; Volume 4. [Google Scholar]
  75. Robinson, J.; Timmerman, P. Myths, rules, artifacts, ecosystems: Framing the human dimensions of global change. In Human Ecology: Crossing Boundaries; The Society for Human Ecology: Bar Harbor, ME, USA, 1993; pp. 236–246. [Google Scholar]
  76. Morita, T.; Robinson, J.R.; Alcamo, J.; Nakicenovic, N.; Riahi, K. Greenhouse Gas Emission Mitigation Scenarios and Implications. 2001. Available online: http://pure.iiasa.ac.at/id/eprint/6385/ (accessed on 7 March 2021).
  77. Swart, R.J.; Raskin, P.; Robinson, J. The problem of the future: Sustainability science and scenario analysis. Glob. Environ. Chang. 2004, 14, 137–146. [Google Scholar] [CrossRef]
  78. Heaps, C.; Kemp-Benedict, E.; Raskin, P. Conventional Worlds: Technical Description of Bending the Curve Scenarios; Polestar Series Report; Stockholm Environment Institute: Boston, MA, USA, 1998. [Google Scholar]
  79. Nakićenović, N.; Victor, N.; Morita, T. Emissions Scenarios database and review of scenarios. Mitig. Adapt. Strateg. Glob. Chang. 1998, 3, 95–131. [Google Scholar] [CrossRef]
  80. Van’t Klooster, S.A.; van Asselt, M.B.A. Practising the scenario-axes technique. Futures 2006, 38, 15–30. [Google Scholar] [CrossRef]
  81. Fink, A.; Schlake, O. Scenario management—An approach for strategic foresight. Compet. Intell. Rev. 2000, 37–45. [Google Scholar] [CrossRef]
  82. Fink, A.; Siebe, A.; Kuhle, J. How scenarios support strategic early warning processes. Foresight 2004, 6, 173–185. [Google Scholar] [CrossRef]
  83. Breuer, H.; Schulz, J.; Leihener, J. Learning from the Future—Modeling Scenarios Based on Normativity, Performativity and Transparency; Social Science Research Network: Rochester, NY, USA, 2012. [Google Scholar]
  84. Complexul Energetic Hunedoara. Raportul Administratorilor Asupra Exercitiului Financiar 2017; Complexul Energetic Hunedoara: Petroșani, Romania, 2018. [Google Scholar]
  85. Complexul Energetic Oltenia. Raport CEO 2018; Complexul Energetic Oltenia: Târgu Jiu, Romania, 2019. [Google Scholar]
  86. Manowska, A.; Osadnik, K.T.; Wyganowska, M. Economic and social aspects of restructuring polish coal mining: Focusing on Poland and the EU. Resour. Policy 2017, 52, 192–200. [Google Scholar] [CrossRef]
  87. Voicu-Dorobanţu, R.; Ploae, C. Improved regional entrepreneurial ecosystems in Eastern Europe: A Romanian policy approach. In Value Sharing for Sustainable and Inclusive Development; IGI Global: Hershey, PA, USA, 2018; pp. 290–308. ISBN 9781522531470. [Google Scholar]
  88. Volintiru, M.; Volintiru, C.; Stefan, G. Young Romanians: Entrepreneurs in their home country? Eur. J. Interdiscip. Stud. 2018, 10, 1–15. [Google Scholar] [CrossRef]
  89. Ignat, R.; Constantin, M. Multidimensional facets of entrepreneurial resilience during the COVID-19 crisis through the lens of the wealthiest Romanian counties. Sustainability 2020, 12, 220. [Google Scholar] [CrossRef]
  90. Fucci, M. The RHOMOLO Model. Available online: https://ec.europa.eu/jrc/en/rhomolo (accessed on 1 March 2021).
Figure 1. Methodological framework for the analysis—steps.
Energies 14 01509 g001
Figure 2. Methodological framework for the analysis—logical diagram.
Energies 14 01509 g002
Figure 3. Steps of the cluster analysis.
Energies 14 01509 g003
Figure 5. Results of the correlations between relevant Just Transition Indicators for Romania—in preparation of the cluster analysis.
Energies 14 01509 g005
Figure 6. European Member State clusters based on Just Transition Indicators.
Energies 14 01509 g006
Figure 7. Loss in energy production by type of resources (September 2020), based on [71], using Equation (2).
Energies 14 01509 g007
Figure 8. The proposed exploratory scenarios for the coal mining regions in Romania.
Energies 14 01509 g008
Table 1. Greenhouse gas emissions generated by Complexul Energetic Oltenia (CEO) and Complexul Energetic Hunedoara (CEH) (2017–2018)—extrapolated data, based on [84,85].
Emissions/SourceCEOCEHTotal
CO25141.304349.0635490.37
SO211.830.867 *12.63
NOx14.2860.970 *15.26
Particulate matter (PM 2.5)0.760.052 *0.82
Efficiency **33%29%
Lifespan of powerplants in Romania3944
Note: All values are in Gigagrams. * Extrapolation based on electricity produced and similar levels of pollution with CEO. ** Calculated using Equation (1).
Publisher’s Note: MDPI stays neutral with regard to jurisdictional claims in published maps and institutional affiliations.

