Climate Policy Imbalance in the Energy Sector: Time to Focus on the Value of CO2 Utilization


Abstract
1. Introduction
- (1)
- Reduced consumption of products with greenhouse gas emissions
- (2)
- Decrease in greenhouse gas emissions per unit of output
- (3)
- Gradual phase-out of carbon-intensive technologies.
- (1)
- the lack of climate policy targets justification [7] and orientation on the prospects of renewable sector development, mostly;
- (2)
- focus on unidirectional policy regulation for various industries [8] (only taxes or only incentives);
- (3)
- necessity to support the raising number of both, producers and consumers of green energy [9];
- (4)
- (5)
- make a bet on substitution of existing energy infrastructure without proper attention to alternative technologies, allowing to expand carbon-intensive technological chains with environmentally-friendly solutions [14].
2. Theoretical Background and Practical Issues
2.1. Social Cost of Carbon and Carbon Taxes
2.2. Climate Change Mitigation Options
- -
- Activation stage (up to 50 USD/t CO2), like ethanol production with CCS (29 USD for capture + 17 USD for transport and storage = 46 USD/t CO2);
- -
- Expansion stage (50–90 USD/t CO2), like for cement industry with CCS (64 USD for capture + 23 USD for transport and storage = 87 USD/t CO2);
- -
- At-scale deployment (90–110 USD/t CO2), for national gas power system with CCS (93 USD for capture + 14 USD for transport and storage = 107 USD/t CO2).

| Technology | Data Collected by Budinis et al. [57] | Bhadola A. et al. [58] | Rubin E.S. et al. [59] | |||
|---|---|---|---|---|---|---|
| Min | Max | Min | Max | Min | Max | |
| Coal-fired power | 24 | 110 | 23 | 36 | - | - |
| Gas-fired power | 67 | 115 | 12 | 102 | - | - |
| Iron and steel | 52 | 120 | - | - | - | - |
| Refineries | 6 | 160 | - | - | - | - |
| Pulp and paper | 47 | 93 | - | - | - | - |
| Cement production | 27 | 146 | - | - | - | - |
| Natural Gas Combined Cycle | 10 | 146 | - | - | - | - |
| Oxyfuel combustion | 48 | 99 | 36 | 102 | - | - |
| Integrated Gasification Combined Cycle | 3 | 140 | - | - | - | - |
| Chemicals + bio or synfuel | 20 | 111 | - | - | - | - |
| Post-combustion (amine) | 63 | 87 | 34 | 58 | - | - |
| Pre-combustion | 47 | 60 | 12 | 23 | - | - |
| CCS | 20 | 113 | - | - | 3.1 | 31.4 |
| Enhanced oil/gas recovery | 71 | 84 | - | - | 1.6 | 22 |
| Transport. Onshore pipelines (30 MtCO2/y) | - | - | - | - | 1.3 | 2.2 |
| Transport. Offshore pipelines (30 MtCO2/y) | - | - | - | - | 1.9 | 2.4 |
| CCU Industry | IGU (2019) Global Gas Report | Source [60] | |||
|---|---|---|---|---|---|
| Min | Max | Min | Max | Capturable Volume in Europe, Mt CO2/y | |
| Iron and Steel | 65 | 240 | 70 | 95 | 69 |
| Aluminium | 60 | 80 | |||
| Natural Gas Combined Cycle | 55 | 170 | - | - | - |
| Refining | 45 | 130 | 40 | 103 | 59 |
| Hydrogen | 40 | 65 | - | - | - |
| Cement | 30 | 155 | - | - | - |
| Petrochemical | 15 | 30 | 65 | 113 | - |
| Ammonia | 15 | 25 | - | - | - |
| Biomass-to-ethanol | 15 | 25 | - | - | - |
| Natural gas processing | 10 | 45 | - | - | - |
| Mineral | - | - | 60 | 120 | 109 |
| Chemical | - | - | - | 39 | 39 |
| Waste | - | - | 150 | 200 | 61 |
| Power | - | - | 70 | 105 | 841 |
2.3. Methods of Scaling Solar and Wind Energy
3. Discussion
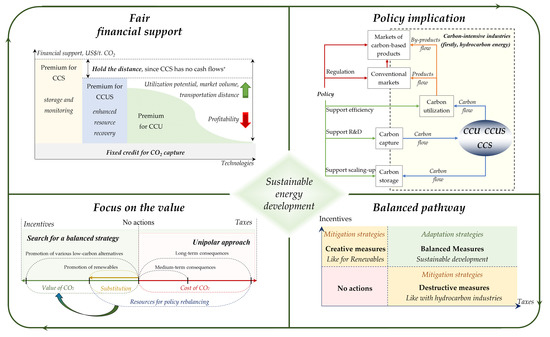
3.1. Policy Balancing
- (1)
- To determine the utility of natural resource we have to rely on market valuation methods, despite their subjectivity. Moreover, using such methods under conditions of negative projects’ profitability and volatility of markets is a rather complicated task, which bring significant uncertainty in the results of calculations. On the other hand, in order to develop adequate measures of state regulation, we have to use financial estimates [99], which can be easily interpreted by policymakers and companies, in contrast to qualitative or technical evaluation methods, like energy [100] or energy [101] analysis.
- (2)
- In an attempt to solve the first problem, SCC estimation methods focusing on the loss of society from one ton of CO2 emissions were proposed. Despite the supposed similarity of estimates, they have differences. The current situation is comparable to the fact that within the cost-benefit analysis we zero out some of possible benefits. It is explained by a huge gap in our knowledge about scalability of CO2-based production chains, available to be captured amount of CO2 and influence of carbon emission on a social welfare [102]. As a result, there is a stable belief that (1) there could be no benefits from CO2 emission; (2) utilization pathways are much more cost-intensive than renewable energy. However, today we see that it might be wrong, since (1) CO2 utilization could give us various valuable products; (2) the cost of renewable energy support is one-two orders of magnitude higher than expected.
3.2. Green Paradox: Imposed Climate Change Mitigation Pathway
3.3. Focus on Carbon Capture
4. Conclusions
- (1)
- The need to diversify the climate policy portfolio of technologies was already ripe at the beginning of the 21st century [138], but the necessary actions were not taken. The existing imbalance of financial support for climate technologies will not allow achieving the targets of keeping the temperature growth rate below 1.5 °C and, in case of an unfavorable scenario, will not allow achieving the climate targets of 2 °C. This is due to the fact that full replacement of hydrocarbon resources by renewable energy is impossible in the short and medium term [139].
- (2)
- Focusing only on potential losses from CO2 emissions may lead to a more dangerous conclusions than the need to combat oil, gas and coal companies, as the main driver of energy consumption growth is the growth of the world’s population, which will increase by 30 percent by 2050. If climate targets are not met by that time, and if the flagship hydrocarbon industries, which are bound to finance renewable energy, are weakened, we will have to conclude that strict global population growth control is needed.
- (3)
- Today it is necessary to switch from destructive measures (in terms of taxes and subsidizing competitor industries) in relation to the hydrocarbon industry to creative measures (in terms of incentives), which will provoke the introduction of environmental technologies at all production and processing facilities. It is these industries that are able to ensure a smooth and environmentally balanced energy transition [140], but only when conditions are created for the development of sustainable investments, including in renewable energy, but mainly in sequestration technology, as the main instrument of rational management of CO2 [141,142].
- (4)
- Today, there is no single cost-effective technology that can provide the necessary reduction of technogenic CO2 emissions. This is also fair for almost all CCU and CCUS options, which require financial support to improve technology readiness level [143,144]. In this regard, it is advisable to start with enhanced fuel recovery technologies (like CO2-enhanced oil/gas recovery) that have already proven themselves and require minimal support [145]. At the same time, despite some positive examples of their economic efficiency, such industrial applications require the improvement of regulatory mechanisms, which is superficial in many countries or absent at all [146]. It is crucial for late-production and post-production periods, while careful monitoring of depleted field is needed.
- (5)
- The history of sequestration technology development is quite long and has both positive and negative examples that, in fact, caused the reduction of the attractiveness of these projects [147]. In documents available to the general public, the language should be accurately chosen, since conclusions such as “must not only focus on reducing emissions but also on reducing the amount of raw material used as inputs to the global economy” [148] can easily be taken out of context to develop abandonment activities as such, while the main goal is to maximize the value created by a unit of raw material, as well as to organize closed technology cycles which, combined with an effective climate policy, can help reduce global CO2 emissions by 63 percent by 2050 [149]. This applies to both traditional raw materials such as hydrocarbons and CO2 directly [150].
Funding
Conflicts of Interest
References
- IEA. Methane Tracker 2020; IEA: Paris, France, 2020; Available online: https://www.iea.org/reports/methane-tracker-2020 (accessed on 10 October 2020).
- Skytt, T.; Nielsen, S.N.; Jonsson, B.G. Global warming potential and absolute global temperature change po-tential from carbon dioxide and methane fluxes as indicators of regional sustainability–A case study of Jämtland, Sweden. Ecol. Indic. 2020, 110, 105831. [Google Scholar] [CrossRef]
- Fais, B.; Sabio, N.; Strachan, N. The critical role of the industrial sector in reaching long-term emission reduction, energy efficiency and renewable targets. Appl. Energy 2016, 162, 699–712. [Google Scholar] [CrossRef]
- Litvinenko, V. The role of hydrocarbons in the global energy agenda: The focus on liquefied natural gas. Resources 2020, 9, 59. [Google Scholar] [CrossRef]
- Buchner, B.; Clark, A.; Falconer, A.; Macquarie, R.; Meattle, C.; Tolentino, R.; Weth-erbee, C. Global Landscape of Climate Finance. 2019. Available online: https://climatepolicyinitiative.org/publication/ global-climate-finance-2019/ (accessed on 12 October 2020).
- IEA. Energy Technology Perspectives 2020. Special Report on Carbon Capture, Utilisation and Storage. 2020. Available online: https://webstore.iea.org/download/direct/4191 (accessed on 12 October 2020).
- Siddiqui, A.S.; Tanaka, M.; Chen, Y. Are targets for renewable portfolio standards too low? The impact of market structure on energy policy. Eur. J. Oper. Res. 2016, 250, 328–341. [Google Scholar] [CrossRef]
- Lu, Y.; Khan, Z.A.; Alvarez-Alvarado, M.S.; Zhang, Y.; Huang, Z.; Imran, M. A critical review of sustainable energy policies for the promotion of renewable energy sources. Sustainability 2020, 12, 5078. [Google Scholar] [CrossRef]
- De Lagarde, C.M.; Lantz, F. How renewable production depresses electricity prices: Evidence from the German market. Energy Policy 2018, 117, 263–277. [Google Scholar] [CrossRef]
- ÓhAiseadha, C.; Quinn, G.; Connolly, R.; Connolly, M.; Soon, W. Energy and climate policy—An evaluation of global climate change expenditure 2011–2018. Energies 2020, 13, 4839. [Google Scholar] [CrossRef]
- Moriarty, P.; Honnery, D. Ecosystem maintenance energy and the need for a green EROI. Energy Policy 2019, 131, 229–234. [Google Scholar] [CrossRef]
- Nagle, A.J.; Delaney, E.L.; Bank, L.C.; Leahy, P.G. A Comparative life cycle assessment between landfilling and co-processing of waste from decommissioned irish wind turbine blades. J. Clean. Prod. 2020, 277, 123321. [Google Scholar] [CrossRef]
- Xu, Y.; Li, J.; Tan, Q.; Peters, A.L.; Yang, C. Global status of recycling waste solar panels: A review. Waste Manag. 2018, 75, 450–458. [Google Scholar] [CrossRef]
- Jarvis, S.M.; Samsatli, S. Technologies and infrastructures underpinning future CO2 value chains: A comprehensive review and comparative analysis. Renew. Sustain. Energy Rev. 2018, 85, 46–68. [Google Scholar] [CrossRef]
- IEA. CO2 Emissions from Fuel Combustion: Overview; IEA: Paris, France, 2020; Available online: https://www.iea.org/reports/CO2-emissions-from-fuel-combustion-overview (accessed on 14 October 2020).
- Liu, Z.; Ciais, P.; Deng, Z.; Lei, R.; Davis, S.J.; Feng, S.; Zheng, B.; Cui, D.; Dou, X.; Zhu, B.; et al. Near-real-time monitoring of global CO2 emissions reveals the effects of the COVID-19 pandemic. Nat. Commun. 2020, 11, 5172. [Google Scholar] [CrossRef] [PubMed]
- Hashmi, R.; Alam, K. Dynamic relationship among environmental regulation, innovation, CO2 emissions, population, and economic growth in OECD countries: A panel investigation. J. Cleaner Prod. 2019, 231, 1100–1109. [Google Scholar] [CrossRef]
- Litvinenko, V.S. Digital economy as a factor in the technological development of the mineral sector. Nat. Resour. Res. 2020, 29, 1521–1541. [Google Scholar] [CrossRef]
- Stocker, T.F.; Qin, D.; Plattner, G.-K.; Tignor, M.M.B.; Allen, S.K.; Boschung, J.; Nauels, A.; Xia, Y.; Bex, V.; Midgley, P.M. (Eds.) Climate Change 2013: The Physical Science Basis. Contribution of Working Group I to the Fifth Assessment Report of IPCC the Intergovernmental Panel on Climate Change; Cambridge University Press: Cambridge, UK, 2014. [Google Scholar] [CrossRef]
- Marcott, S.A.; Shakun, J.D.; Clark, P.U.; Mix, A.C. A reconstruction of regional and global temper-ature for the past 11,300 years. Science 2013, 339, 1198–1201. [Google Scholar] [CrossRef]
- Siegenthaler, U.; Stocker, T.F.; Monnin, E.; Lüthi, D.; Schwander, J.; Stauffer, B.; Jouzel, J. Stable carbon cycle–climate relationship during the late Pleistocene. Science 2005, 310, 1313–1317. [Google Scholar] [CrossRef]
- Hoegh-Guldberg, O.; Jacob, D.; Bindi, M.; Brown, S.; Camilloni, I.; Diedhiou, A.; Hijioka, Y. Impacts of 1.5 °C Global Warming on Natural and Human Systems. Global Warming of 1.5 °C; An IPCC Special Report; IPCC: Geneva, Switzerland, 2018. [Google Scholar]
- Bovari, E.; Giraud, G.; Mc Isaac, F. Coping with collapse: A stock-flow consistent monetary macro-dynamics of global warming. Ecol. Econ. 2018, 147, 383–398. [Google Scholar] [CrossRef]
- Smol, M.; Marcinek, P.; Duda, J.; Szołdrowska, D. Importance of sustainable mineral resource management in implementing the circular economy (CE) model and the european green deal strategy. Resources 2020, 9, 55. [Google Scholar] [CrossRef]
- Zachmann, G.; McWilliams, B. A European Carbon Border Tax: Much Pain, Little Gain; Bruegel: Brussels, Belgium, 2020. [Google Scholar]
- Thisted, E.V.; Thisted, R.V. The diffusion of carbon taxes and emission trading schemes: The emerging norm of carbon pricing. Environ. Politics 2020, 29, 804–824. [Google Scholar] [CrossRef]
- Friedmann, J.; Fan, Z.; Byrum, Z.; Ochu, E.; Bhardwaj, A.; Sheerazi, H. Levelized Cost of Carbon Abatement: An Improved Cost-Assessment Methodology for a Net-Zero Emissions World; Columbia University SIPA Center on Global Energy Policy: New York, NY, USA, 2020. [Google Scholar]
- Van den Bijgaart, I.; Gerlagh, R.; Liski, M. A simple formula for the social cost of carbon. J. Environ. Econ. Manag. 2016, 77, 75–94. [Google Scholar] [CrossRef]
- Nordhaus, W.D. Revisiting the social cost of carbon. Proc. Natl. Acad. Sci. USA 2017, 114, 1518–1523. [Google Scholar] [CrossRef]
- Tol, R.S. On the optimal control of carbon dioxide emissions: An application of FUND. Environ. Modeling Assess. 1997, 2, 151–163. [Google Scholar] [CrossRef]
- Hope, C. Critical issues for the calculation of the social cost of CO2: Why the estimates from PAGE09 are higher than those from PAGE2002. Clim. Chang. 2013, 117, 531–543. [Google Scholar] [CrossRef]
- Nordhaus, W. Evolution of modeling of the economics of global warming: Changes in the DICE model, 1992–2017. Clim. Chang. 2018, 148, 623–640. [Google Scholar] [CrossRef]
- Jin, G.; Shi, X.; Zhang, L.; Hu, S. Measuring the SCCs of different Chinese regions under future scenarios. Renew. Sustain. Energy Rev. 2020, 130, 109949. [Google Scholar] [CrossRef]
- Bastien-Olvera, B.A.; Moore, F.C. Use and non-use value of nature and the social cost of carbon. Nat. Sustain. 2020, 1–8. [Google Scholar] [CrossRef]
- Ricke, K.; Drouet, L.; Caldeira, K.; Tavoni, M. Country-level social cost of carbon. Nat. Clim. Chang. 2018, 8, 895–900. [Google Scholar] [CrossRef]
- Tol, R.S. A social cost of carbon for (almost) every country. Energy Economics 2019, 83, 555–566. [Google Scholar] [CrossRef]
- Callaghan, M.W.; Minx, J.C.; Forster, P.M. A topography of climate change research. Nat. Clim. Chang. 2020, 10, 118–123. [Google Scholar] [CrossRef]
- Tol, R.S. The economic impacts of climate change. Rev. Environ. Econ. Policy 2018, 12, 4–25. [Google Scholar] [CrossRef]
- Vasilev, Y.; Vasileva, P.; Tsvetkova, A. International review of public perception of CCS technologies. In Proceedings of the International Multidisciplinary Scientific GeoConference Surveying Geology and Mining Ecology Management, SGEM, Albena, Bulgaria, 8 June–7 July 2019; Volume 19, Issue 5.1. pp. 415–422. [Google Scholar] [CrossRef]
- Archer, D.; Kite, E.; Lusk, G. The ultimate cost of carbon. Clim. Chang. 2020, 162, 1–18. [Google Scholar] [CrossRef]
- Carleton, T.A.; Hsiang, S.M. Social and economic impacts of climate. Science 2016, 353. [Google Scholar] [CrossRef] [PubMed]
- Kaufman, N.; Barron, A.R.; Krawczyk, W.; Marsters, P.; McJeon, H. A near-term to net zero alternative to the social cost of carbon for setting carbon prices. Nat. Clim. Chang. 2020, 10, 1–5. [Google Scholar] [CrossRef]
- Xie, X.; Weng, Y.; Cai, W. Co-benefits of CO2 mitigation for NOX emission reduction: A research based on the DICE model. Sustainability 2018, 10, 1109. [Google Scholar] [CrossRef]
- Frantzeskaki, N.; Hölscher, K.; Holman, I.P.; Pedde, S.; Jaeger, J.; Kok, K.; Harrison, P.A. Transition pathways to sustainability in greater than 2 C climate futures of Europe. Reg. Environ. Chang. 2019, 19, 777–789. [Google Scholar] [CrossRef]
- Lin, B.; Jia, Z. Supply control vs. demand control: Why is resource tax more effective than carbon tax in reducing emissions? Humanit. Soc. Sci. Commun. 2020, 7, 1–13. [Google Scholar] [CrossRef]
- Tsvetkova, A.; Katysheva, E. Assessment of positive and negative aspects of CO2 sequestration projects by argument map development. In Proceedings of the 18th International Multidisciplinary Scientific GeoConference SGEM, Albena, Bulgaria, 2–8 July 2018; Volume 18, Issue 5.1. pp. 75–80. [Google Scholar] [CrossRef]
- Babacan, O.; De Causmaecker, S.; Gambhir, A.; Fajardy, M.; Rutherford, A.W.; Fantuzzi, A.; Nelson, J. Assessing the feasibility of carbon dioxide mitigation options in terms of energy usage. Nat. Energy 2020, 5, 720–728. [Google Scholar] [CrossRef]
- Pathways to a Low-Carbon Economy. Available online: https://www.mckinsey.com/~/media/mckinsey/dotcom/client_service/sustainability/cost%20curve%20pdfs/pathways_lowcarbon_economy_version2.ashx (accessed on 14 October 2020).
- Greenstone, M.; Nath, I. Do Renewable Portfolio Standards Deliver? Becker Friedman Institute for Economics Working Paper; University of Chicago: Chicago, IL, USA, 2019. [Google Scholar]
- Keith, D.W.; Holmes, G.; Angelo, D.S.; Heidel, K. A process for capturing CO2 from the atmosphere. Joule 2018, 2, 1573–1594. [Google Scholar] [CrossRef]
- Biniek, K.; Henderson, K.; Rogers, M.; Santoni, G. Driving CO2 Emissions to Zero (and Beyond) with Carbon Capture, Use, and Storage. 2020. Available online: https://www.mckinsey.com/business-functions/sustainability/our-insights/driving-CO2-emissions-to-zero-and-beyond-with-carbon-capture-use-and-storage# (accessed on 9 October 2020).
- Fasihi, M.; Efimova, O.; Breyer, C. Techno-economic assessment of CO2 direct air capture plants. J. Clean. Prod. 2019, 224, 957–980. [Google Scholar] [CrossRef]
- Gillingham, K.; Stock, J.H. The cost of reducing greenhouse gas emissions. J. Econ. Perspect. 2018, 32, 53–72. [Google Scholar] [CrossRef]
- NPC. Meeting the Dual Challenge: A Roadmap to At-Scale Deployment of Carbon Capture, Use, and Storage in the United States; National Petroleum Council: Washington, DC, USA, 2019; Available online: https://dualchallenge.npc.org/downloads.php (accessed on 3 September 2020).
- Biniek, K.; Davies, R.; Henderson, K. Why Commercial Use Could be the Future of Carbon Capture. 2019. Available online: https://www.mckinsey.com/business-functions/sustainability/our-insights/why-commercial-use-could-be-the-future-of-carbon-capture# (accessed on 3 September 2020).
- Chauvy, R.; Lepore, R.; Fortemps, P.; De Weireld, G. Comparison of multi-criteria decision-analysis methods for selecting carbon dioxide utilization products. Sustain. Prod. Consum. 2020, 24, 194–210. [Google Scholar] [CrossRef]
- Budinis, S.; Krevor, S.; Mac Dowell, N.; Brandon, N.; Hawkes, A. An assessment of CCS costs, barriers and potential. Energy Strategy Rev. 2018, 22, 61–81. [Google Scholar] [CrossRef]
- Bhadola, A.; Patel, V.; Potdar, S.; Mallick, S. Technology Scouting—Carbon Capture: From Today’s to Novel Technologies. Concawe Group. 2020. Available online: https://www.concawe.eu/wp-content/uploads/Rpt_20-18.pdf (accessed on 3 September 2020).
- Rubin, E.S.; Davison, J.E.; Herzog, H.J. The cost of CO2 capture and storage. Int. J. Greenh. Gas. Contr. 2015, 40, 378–400. [Google Scholar] [CrossRef]
- Carbon Limits AS and THEMA Consulting Group. The role of Carbon Capture and Storage in a Carbon Neutral Europe. 2020. Available online: https://www.regjeringen.no/contentassets/971e2b1859054d0d87df9593acb660b8/the-role-of-ccs-in-a-carbon-neutral-europe.pdf (accessed on 17 September 2020).
- Mac Dowell, N.; Fennell, P.S.; Shah, N.; Maitland, G.C. The role of CO2 capture and utilization in mitigating climate change. Nat. Clim. Chang. 2017, 7, 243–249. [Google Scholar] [CrossRef]
- Quarton, C.J.; Samsatli, S. The value of hydrogen and carbon capture, storage and utilisation in decarbonising energy: Insights from integrated value chain optimisation. Appl. Energy 2020, 257, 113936. [Google Scholar] [CrossRef]
- Saeidi, S.; Najari, S.; Fazlollahi, F.; Nikoo, M.K.; Sefidkon, F.; Klemeš, J.J.; Baxter, L.L. Mechanisms and kinetics of CO2 hydrogenation to value-added products: A detailed review on current status and future trends. Renew. Sustain. Energy Rev. 2017, 80, 1292–1311. [Google Scholar] [CrossRef]
- Li, W.; Wang, H.; Jiang, X.; Zhu, J.; Liu, Z.; Guo, X.; Song, C. A short review of recent advances in CO2 hydrogenation to hydrocarbons over heterogeneous catalysts. RSC Adv. 2018, 8, 7651–7669. [Google Scholar] [CrossRef]
- Zhang, Z.; Pan, S.Y.; Li, H.; Cai, J.; Olabi, A.G.; Anthony, E.J.; Manovic, V. Recent advances in carbon di-oxide utilization. Renew. Sustain. Energy Review. 2020, 125, 109799. [Google Scholar] [CrossRef]
- Zhiznina, S.Z.; Timokhov, V.M.; Gusev, A.L. Economic aspects of nuclear and hydrogen energy in the world and Russia. Int. J. Hydrog. Energy 2020, 45, 31353–31366. [Google Scholar] [CrossRef]
- Stern, N. Economics: Current climate models are grossly misleading. Nature 2016, 530, 407–409. [Google Scholar] [CrossRef]
- Thonemann, N.; Pizzol, M. Consequential life cycle assessment of carbon capture and utilization technologies within the chemical industry. Energy Environ. Sci. 2019, 12, 2253–2263. [Google Scholar] [CrossRef]
- Bobeck, J.; Peace, J.; Ahmad, F.M.; Munson, R. Сarbon Utilization—A Vital and Effective Pathway for Decarbonization; Center for Climate and Energy Solutions: Arlington, VA, USA, 2019. [Google Scholar]
- Spurgeon, J.M.; Kumar, B. A comparative technoeconomic analysis of pathways for commercial electrochemical CO 2 reduction to liquid products. Energy Environ. Sci. 2018, 11, 1536–1551. [Google Scholar] [CrossRef]
- Böhringer, C.; Cuntz, A.; Harhoff, D.; Asane-Otoo, E. The impact of the German feed-in tariff scheme on innovation: Evidence based on patent filings in renewable energy technologies. Energy Econ. 2017, 67, 545–553. [Google Scholar] [CrossRef]
- Kemeny, T. Does foreign direct investment drive technological upgrading? World Dev. 2010, 38, 1543–1554. [Google Scholar] [CrossRef]
- Koçak, E.; Ulucak, Z.Ş. The effect of energy R&D expenditures on CO2 emission reduction: Estimation of the STIRPAT model for OECD countries. Environ. Sci. Pollut. Res. 2019, 26, 14328–14338. [Google Scholar]
- Goodarzi, S.; Aflaki, S.; Masini, A. Optimal feed-in tariff policies: The impact of market structure and technology characteristics. Prod. Oper. Manag. 2018. [CrossRef]
- García-Álvarez, M.T.; Cabeza-García, L.; Soares, I. Analysis of the promotion of onshore wind energy in the EU: Feed-in tariff or renewable portfolio standard? Renew. Energy 2017, 111, 256–264. [Google Scholar] [CrossRef]
- Hitaj, C.; Löschel, A. The impact of a feed-in tariff on wind power development in Germany. Resource Energy Econ. 2019, 57, 18–35. [Google Scholar] [CrossRef]
- Özokcu, S.; Özdemir, Ö. Economic growth, energy, and environmental Kuznets curve. Renew. Sustain. Energy Rev. 2017, 72, 639–647. [Google Scholar] [CrossRef]
- Aslan, A.; Destek, M.A.; Okumus, I. Bootstrap rolling window estimation approach to analysis of the environment Kuznets Curve hypothesis: Evidence from the USA. Environ. Sci. Pollut. Res. 2018, 25, 2402–2408. [Google Scholar] [CrossRef]
- Solarin, S.A.; Al-Mulali, U.; Ozturk, I. Validating the environmental Kuznets curve hypothesis in India and China: The role of hydroelectricity consumption. Renew. Sustain. Energy Rev. 2017, 80, 1578–1587. [Google Scholar] [CrossRef]
- Sarkodie, S.A.; Strezov, V. A review on environmental Kuznets curve hypothesis using bibliometric and meta-analysis. Sci. Total Environ. 2019, 649, 128–145. [Google Scholar] [CrossRef] [PubMed]
- Ota, T. Economic growth, income inequality and environment: Assessing the applicability of the Kuznets hypotheses to Asia. Palgrave Commun. 2017, 3, 17069. [Google Scholar] [CrossRef]
- Sinha, A.; Shahbaz, M.; Balsalobre, D. Data selection and environmental Kuznets curve mod-els-environmental Kuznets curve models, data choice, data sources, missing data, balanced and unbalanced panels. In Environmental Kuznets Curve (EKC); Academic Press: Cambridge, MA, USA, 2019; pp. 65–83. [Google Scholar]
- Dolgonosov, B.M. A conceptual model of the relationship among world economy and climate indicators. Biophys. Econ. Resour. Qual. 2018, 3. [Google Scholar] [CrossRef]
- Oerlemans, L.A.; Chan, K.Y.; Volschenk, J. Willingness to pay for green electricity: A review of the contingent valuation literature and its sources of error. Renew. Sustain. Energy Rev. 2016, 66, 875–885. [Google Scholar] [CrossRef]
- Balezentis, T.; Streimikiene, D.; Mikalauskas, I.; Shen, Z. Towards carbon free economy and electricity: The puzzle of energy costs, sustainability and security based on willingness to pay. Energy 2020, 214, 119081. [Google Scholar] [CrossRef]
- Yu, H.; Reiner, D.; Chen, H.; Mi, Z. A Comparison of Public Preferences for Different Low-Carbon Energy Technologies: Support for CCS, Nuclear and Wind Energy in the United Kingdom; University of Cambridge: Cambridge, IL, USA, 2018. [Google Scholar]
- Du, Y.; Takeuchi, K. Does a small difference make a difference? Impact of feed-in tariff on renewable power generation in China. Energy Econ. 2020, 87, 104710. [Google Scholar]
- Tabatabaei, S.M.; Hadian, E.; Marzban, H.; Zibaei, M. Economic, welfare and environmental impact of feed-in tariff policy: A case study in Iran. Energy Policy 2017, 102, 164–169. [Google Scholar] [CrossRef]
- Alizada, K. Rethinking the diffusion of renewable energy policies: A global assessment of feed-in tariffs and renewable portfolio standards. Energy Res. Soc. Sci. 2018, 44, 346–361. [Google Scholar] [CrossRef]
- Xydis, G.; Vlachakis, N. Feed-in-premium renewable energy support scheme: A scenario approach. Resources 2019, 8, 106. [Google Scholar] [CrossRef]
- Carley, S.; Davies, L.L.; Spence, D.B.; Zirogiannis, N. Empirical evaluation of the stringency and design of renewable portfolio standards. Nat. Energy 2018, 3, 754–763. [Google Scholar] [CrossRef]
- Yi, Z.; Xin-gang, Z.; Yu-zhuo, Z.; Ying, Z. From feed-in tariff to renewable portfolio standards: An evolutionary game theory perspective. J. Clean. Prod. 2019, 213, 1274–1289. [Google Scholar] [CrossRef]
- Zhang, Q.; Wang, G.; Li, Y.; Li, H.; McLellan, B.; Chen, S. Substitution effect of renewable portfolio standards and renewable energy certificate trading for feed-in tariff. Appl. Energy 2018, 227, 426–435. [Google Scholar] [CrossRef]
- Robinson, S.A. Climate change adaptation in SIDS: A systematic review of the literature pre and post the IPCC Fifth Assessment Report. Wiley Interdiscip. Rev. Clim. Chang. 2020, e653. [Google Scholar] [CrossRef]
- Al-Ghussain, L. Global warming: Review on driving forces and mitigation. Environ. Prog. Sustain. Energy 2018. [CrossRef]
- Pires, J.C.M.; da Cunha Goncalves, A.L. (Eds.) Bioenergy with Carbon Capture and Storage: Using Natural Resources for Sustainable Development; Academic Press: Cambridge, MA, USA, 2019. [Google Scholar]
- Hennessey, R.; Pittman, J.; Morand, A.; Douglas, A. Co-benefits of integrating climate change adaptation and mitigation in the Canadian energy sector. Energy Policy 2017, 111, 214–221. [Google Scholar] [CrossRef]
- Kumar, S.; Foroozesh, J.; Edlmann, K.; Rezk, M.G.; Lim, C.Y. A comprehensive review of value-added CO2 sequestration in subsurface saline aquifers. J. Nat. Gas Sci. Eng. 2020, 103437. [Google Scholar] [CrossRef]
- Hatfield-Dodds, S.; Schandl, H.; Newth, D.; Obersteiner, M.; Cai, Y.; Baynes, T.; Havlik, P. Assessing global resource use and greenhouse emissions to 2050, with ambitious resource efficiency and climate mitigation policies. J. Clean. Prod. 2017, 144, 403–414. [Google Scholar] [CrossRef]
- Yu, X.; Geng, Y.; Dong, H.; Fujita, T.; Liu, Z. Emergy-based sustainability assessment on natural resource utilization in 30 Chinese provinces. J. Clean. Prod. 2016, 133, 18–27. [Google Scholar] [CrossRef]
- Buonocore, E.; Picone, F.; Donnarumma, L.; Russo, G.F.; Franzese, P.P. Modeling matter and energy flows in marine ecosystems using emergy and eco-exergy methods to account for natural capital value. Ecol. Model. 2019, 392, 137–146. [Google Scholar] [CrossRef]
- Ilinova, A.A.; Romasheva, N.V.; Stroykov, G.A. Prospects and social effects of carbon dioxide sequestration and utilization projects. J. Min. Inst. 2020, 244, 493–502. [Google Scholar] [CrossRef]
- Bach, M. The oil and gas sector: From climate laggard to climate leader? Environ. Politics 2019, 28, 87–103. [Google Scholar] [CrossRef]
- Fan, J.L.; Xu, M.; Yang, L.; Zhang, X.; Li, F. How can carbon capture utilization and storage be incentivized in China? A perspective based on the 45Q tax credit provisions. Energy Policy 2019, 132, 1229–1240. [Google Scholar] [CrossRef]
- Romasheva, N.; Ilinova, A. CCS projects: How regulatory framework influences their deployment. Resources 2019, 8, 181. [Google Scholar] [CrossRef]
- Cherepovitsyn, A.E.; Ilinova, A.A.; Evseeva, O.O. Stakeholders management of carbon sequestration project in the state-business-society system. J. Min. Inst. 2019, 240, 731. [Google Scholar] [CrossRef]
- Wang, L.; Sarkar, B.; Sonne, C.; Ok, Y.S.; Tsang, D.C. Soil and geologic formations as antidotes for CO2 sequestration? Soil Use Manag. 2020. [CrossRef]
- Bauer, N.; McGlade, C.; Hilaire, J.; Ekins, P. Divestment prevails over the green paradox when anticipating strong future climate policies. Nat. Clim. Chang. 2018, 8, 130–134. [Google Scholar] [CrossRef]
- Sinn, H.-W. Public policies against global warming: A supply side approach. Int. Tax. Public Finan. 2008, 15, 360–394. [Google Scholar] [CrossRef]
- Gerlagh, R.; Heijmans, R.; Rosendahl, K.E. Endogenous Emission Caps Always Induce a Green Paradox. CESifo Working Paper No. 7862. 2019. Available online: https://ssrn.com/abstract=3467997 (accessed on 8 October 2020).
- Steinkraus, A. A synthetic control assessment of the green paradox: The role of climate action plans. Ger. Econ. Rev. 2019, 20, e545–e570. [Google Scholar] [CrossRef]
- San-Akca, B.; Sever, S.D.; Yilmaz, S. Does natural gas fuel civil war? Rethinking energy security, international relations, and fossil-fuel conflict. Energy Res. Soc. Sci. 2020, 70, 101690. [Google Scholar] [CrossRef]
- Kolster, C.; Masnadi, M.S.; Krevor, S.; Mac Dowell, N.; Brandt, A.R. CO2 enhanced oil recovery: A catalyst for gigatonne-scale carbon capture and storage deployment? Energy Environ. Sci. 2017, 10, 2594–2608. [Google Scholar] [CrossRef]
- Böhringer, C. Two decades of European climate policy: A critical appraisal. Rev. Environ. Econ. Policy 2014, 8, 1–17. [Google Scholar] [CrossRef]
- Böhringer, C.; Behrens, M. Interactions of emission caps and renewable electricity support schemes. J. Regul. Econ. 2015, 48, 74–96. [Google Scholar] [CrossRef]
- Van der Ploeg, F.; Withagen, C. Global warming and the green paradox: A review of adverse effects of climate policies. Rev. Environ. Econ. Policy 2015, 9, 285–303. [Google Scholar] [CrossRef]
- Zhai, H. Advanced membranes and learning scale required for cost-effective post-combustion carbon capture. Iscience 2019, 13, 440–451. [Google Scholar] [CrossRef]
- Pieri, T.; Nikitas, A.; Castillo-Castillo, A.; Angelis-Dimakis, A. Holistic assessment of carbon capture and utilization value chains. Environments 2018, 5, 108. [Google Scholar] [CrossRef]
- IEA. Putting CO2 into USE: Creating Value from Emissions; IEA: Paris, France, 2019; p. 86. [Google Scholar]
- Song, C.; Liu, Q.; Ji, N.; Deng, S.; Zhao, J.; Li, Y.; Li, H. Alternative pathways for efficient CO2 capture by hybrid processes—A review. Renew. Sustain. Energy Rev. 2018, 82, 215–231. [Google Scholar] [CrossRef]
- Rochedo, P.R.; Costa, I.V.; Império, M.; Hoffmann, B.S.; Merschmann, P.R.D.C.; Oliveira, C.C.; Schaeffer, R. Carbon capture potential and costs in Brazil. J. Clean. Prod. 2016, 131, 280–295. [Google Scholar] [CrossRef]
- Global CCS Institute. Global Status Status Report. 2019. Available online: https://www.globalccsinstitute.com/wp-content/uploads/2019/12/GCC_GLOBAL_STATUS_REPORT_2019.pdf (accessed on 11 October 2020).
- Corno-Gandolphe. Carbon Capture, Storage and Utilization to the Rescue of Coal? Global Perspective and Focus on China and the United States; Etudes de I’lfri, Ifri: Paris, France, 2019. [Google Scholar]
- Fan, J.L.; Xu, M.; Li, F.; Yang, L.; Zhang, X. Carbon capture and storage (CCS) retrofit po-tential of coal-fired power plants in China: The technology lock-in and cost optimization perspec-tive. Appl. Energy 2018, 229, 326–334. [Google Scholar] [CrossRef]
- Leeson, D.; Mac Dowell, N.; Shah, N.; Petit, C.; Fennell, P.S. A Techno-economic analysis and systematic review of carbon capture and storage (CCS) applied to the iron and steel, cement, oil refin-ing and pulp and paper industries, as well as other high purity sources. Int. J. Greenh. Gas Control 2017, 61, 71–84. [Google Scholar] [CrossRef]
- He, G.; Lin, J.; Sifuentes, F.; Liu, X.; Abhyankar, N.; Phadke, A. Rapid cost decrease of renewables and storage accelerates the decarbonization of China’s power system. Nat. Commun. 2020, 11, 1–9. [Google Scholar]
- Kätelhön, A.; Meys, R.; Deutz, S.; Suh, S.; Bardow, A. Climate change mitigation potential of carbon capture and utilization in the chemical industry. Proc. Natl. Acad. Sci. USA 2019, 116, 11187–11194. [Google Scholar] [CrossRef] [PubMed]
- Taskforce, C.C.C. Delivering Clean Growth: CCUS Cost Challenge Taskforce Report. UK Department for Business, Energy and Industrial Strategy. 2018. Available online: https://assets.publishing.service.gov.uk/govern ment/uploads/system/uploads/attachment_data/file/727040/CCUS_cost_challenge_taskforce_report.pdf (accessed on 13 October 2020).
- IEA. CCUS in Clean Energy Transitions; IEA: Paris, France, 2020; Available online: https://www.iea.org/reports/ccus-in-clean-energy-transitions (accessed on 7 October 2020).
- Aresta, M.; Karimi, I.; Kawi, S. (Eds.) Perspective Look on CCU Large-Scale Exploitation. In An Economy Based on Carbon Dioxide and Water; Springer: Cham, Switzerland, 2019. [Google Scholar] [CrossRef]
- IEA. ETP Clean Energy Technology Guide; IEA: Paris, France, 2020; Available online: https://www.iea.org/articles/etp-clean-energy-technology-guide (accessed on 1 November 2020).
- Wich, T.; Lueke, W.; Deerberg, G.; Oles, M. Carbon2Chem®-CCU as a Step Toward a Circular Economy. Front. Energy Res. 2020, 7, 162. [Google Scholar] [CrossRef]
- Durán-Romero, G.; López, A.M.; Beliaeva, T.; Ferasso, M.; Garonne, C.; Jones, P. Bridging the gap between circular economy and climate change mitigation policies through eco-innovations and Quintuple Helix Model. Technol. Forecast. Soc. Chang. 2020, 160, 120246. [Google Scholar] [CrossRef]
- Agarwal, A.S.; Rode, E.; Sridhar, N.; Hill, D. Conversion of CO2 to value added chemicals: Opportunities and challenges. In Handbook of Climate Change Mitigation and Adaptation; Springer International Publishing: Cham, Switzerland, 2017; pp. 2487–2526. [Google Scholar]
- Royal Society. Greenhouse Gas Removal. 2018. Available online: https://royalsociety.org/-/media/policy/projects/greenhouse-gas-removal/royal-society-greenhouse-gas-removal-report-2018.pdf (accessed on 4 November 2020).
- Fuss, S.; Lamb, W.F.; Callaghan, M.W.; Hilaire, J.; Creutzig, F.; Amann, T.; Luderer, G. Negative emissions—Part 2: Costs, potentials and side effects. Environ. Res. Lett. 2018, 13, 063002. [Google Scholar] [CrossRef]
- Hepburn, C.; Adlen, E.; Beddington, J.; Carter, E.A.; Fuss, S.; Mac Dowell, N.; Minx, J.C.; Smith, P.; Williams, C.K. The technological and economic prospects for CO2 utilization and re-moval. Nature 2019, 575, 87–97. [Google Scholar] [CrossRef]
- Moss, R.; Edmonds, J.; Hibbard, K.; Manning, M.R.; Rose, S.K.; van Vuuren, D.P.; Carter, T.R.; Emori, S.; Kainuma, M.; Kram, T.; et al. The next generation of scenarios for climate change research and assessment. Nature 2010, 463, 747–756. [Google Scholar] [CrossRef]
- Walsh, B.J.; Rydzak, F.; Palazzo, A.; Kraxner, F.; Herrero, M.; Schenk, P.M.; Ciais, P.; Janssens, I.A.; Peñuelas, J.; Niederl-Schmidinger, A.; et al. New feed sources key to ambitious climate targets. Carbon Balance Manag. 2015, 10, 26. [Google Scholar] [CrossRef]
- IEAGHG. Towards Zero Emissions CCS from Power Stations using Higher Capture Rates or Biomass; IEAGHG: Cheltenham, UK, 2019. [Google Scholar]
- De Carvalho Reis, A.; de Medeiros, J.L.; Nunes, G.C.; Araújo, O.D.Q.F. Lifetime oriented design of natural gas offshore processing for cleaner production and sustainability: High carbon dioxide content. J. Clean. Prod. 2018, 200, 269–281. [Google Scholar] [CrossRef]
- Silvestre, B.S.; Gimenes, F.A.P. A sustainability paradox? Sustainable operations in the offshore oil and gas industry: The case of Petrobras. J. Clean. Prod. 2017, 142, 360–370. [Google Scholar] [CrossRef]
- Stuardi, F.M.; MacPherson, F.; Leclaire, J. Integrated CO2 capture and utilization: A priority research di-rection. Curr. Opin. Green Sustain. Chem. 2019, 16, 71–76. [Google Scholar] [CrossRef]
- Fawzy, S.; Osman, A.I.; Doran, J.; Rooney, D.W. Strategies for mitigation of climate change: A review. Environ. Chem. Lett. 2020, 1–26. [Google Scholar] [CrossRef]
- Yang, L.; Xu, M.; Yang, Y.; Fan, J.; Zhang, X. Comparison of subsidy schemes for carbon capture utilization and storage (CCUS) investment based on real option approach: Evidence from China. Appl. Energy 2019, 255, 113828. [Google Scholar] [CrossRef]
- Bruhn, T.; Naims, H.; Olfe-Kräutlein, B. Separating the debate on CO2 utilisation from carbon capture and storage. Environ. Sci. Policy 2016, 60, 38–43. [Google Scholar] [CrossRef]
- Tcvetkov, P.; Cherepovitsyn, A.; Fedoseev, S. Public perception of carbon capture and storage: A state-of-the-art overview. Heliyon 2019, 5, e02845. [Google Scholar] [CrossRef] [PubMed]
- Behrens, A. Time to Connect the Dots: What is the Link between Climate Change Policy and the Circular Economy? CEPS Policy Brief; CEPS: Brussels, Belgium, 2016. [Google Scholar]
- Circle Economy. The circularity gap report, Platform for accelerating The Circular Economy (PACE). 2019. Available online: https://www.legacy.circularity-gap.world/2019 (accessed on 13 October 2020).
- European Commission. A new Circular Economy Action Plan for a Cleaner and More Competitive Europe. 2020. Available online: https://eur-lex.europa.eu/resource.html?uri=cellar:9903b325-6388-11ea-b735-01aa75ed71a1.0017.02/DOC_1&format=PDF (accessed on 21 October 2020).


| CCUS/CCU Option | Mature | Early Adoption | Demonstration | Large Prototype | TRL |
|---|---|---|---|---|---|
| Capture | |||||
| Natural gas processing | Absorption: TRL1-TRL9 Adsorption: TRL2-TRL7 Membranes: TRL3-TRL8 Cryogen: TRL3-TRL6 Oxy-combustion: TRL2-TRL4 | ||||
| Hydrogen | |||||
| Chemicals (ammonia) | |||||
| Chemicals (Methanol) | |||||
| Power | |||||
| Cement | |||||
| Iron and steel | |||||
| Transport & Compression | |||||
| CO2 pipelines | Ship: TRL3-TRL7 Pipeline: TRL7-TRL9 Compression: TRL8-TRL9 | ||||
| CO2 shipping | |||||
| Storage | |||||
| Saline formations | TRL5-TRL9 | ||||
| Depleted Oil/Gas reservoir | TRL5-TRL8 | ||||
| Use | |||||
| Chemicals (urea) | Electro/Photochemical: TR:1-TRL4 Thermochemical: TRL2-TRL5 Biological: TRL3-TRL9 Carbonation: TRL5-TRL8 EOR: Conventional-TRL7-TRL9 Unconventional-TRL3-TRL6 | ||||
| Enhanced oil recovery | |||||
| Building materials | |||||
| Synthetic methane | |||||
| Methanol | |||||
| Bioethanol | |||||
| Synthetic fuels | |||||
| Required measures to support CCUS/CCU at different stages | Market mechanisms for support (carbon pricing, regulatory standards, feed-in-tariffs/prices, operating subsidies) | R&D incentives, capital expenditures compensation | |||
| Option | Royal Society [135] | Fuss et. al. [136] | Hepburn et al. [137] | ||||
|---|---|---|---|---|---|---|---|
| Potential, Gt CO2/year | Cost, US$/tCO2 | TRL | Potential, Gt CO2/year | Cost, US$/tCO2 | Potential, Mt CO2/y | Cost, US$/tCO2 | |
| Afforestation and re-forestation | 3–20 | 3–30 | 8–9 | 0.5–3.6 | 5–50 | 70 to 1100 | −$40 to $10 |
| Forest management | 1–2 | 3–30 | 8–9 | - | - | ||
| Wetland, peatland and coastal habitat restoration | 0.4–20 | 10–100 | 5–6 | - | - | 900 to 1900 | −$90 to −$20 |
| Soil carbon sequestration | 1–10 | 10 profit-3 cost | 8–9 | 2–5 | 0–100 | - | - |
| Biochar | 2–5 | 0–200 | 3–6 | 0.5–2 | 30–120 | 170 to 1000 | −$70 to −$60 |
| Bio-energy CCS | 10 | 100–300 | Bioenerg: 7–9 | 0.5–5 | 100–200 | 500 to 5000 | $60 to $160 |
| Enhanced weathering | 0.5–4 | 50–500 | 1–5 | 2–4 | 50–200 | n.d. | Less than $200 |
| Mineral carbonation | - | 50–300 (20 in situ) | 3–8 | - | - | - | - |
| Ocean alkalinity | 40 | 70–200 | 2–4 | - | - | - | - |
| Direct air capture | 0.5–5 | 200–600 (100 mature) | 4–7 | 0.5–5 | 100–300 | - | - |
Publisher’s Note: MDPI stays neutral with regard to jurisdictional claims in published maps and institutional affiliations. |
© 2021 by the author. Licensee MDPI, Basel, Switzerland. This article is an open access article distributed under the terms and conditions of the Creative Commons Attribution (CC BY) license (http://creativecommons.org/licenses/by/4.0/).
Share and Cite
Tcvetkov, P. Climate Policy Imbalance in the Energy Sector: Time to Focus on the Value of CO2 Utilization. Energies 2021, 14, 411. https://doi.org/10.3390/en14020411
Tcvetkov P. Climate Policy Imbalance in the Energy Sector: Time to Focus on the Value of CO2 Utilization. Energies. 2021; 14(2):411. https://doi.org/10.3390/en14020411
Chicago/Turabian StyleTcvetkov, Pavel. 2021. "Climate Policy Imbalance in the Energy Sector: Time to Focus on the Value of CO2 Utilization" Energies 14, no. 2: 411. https://doi.org/10.3390/en14020411
APA StyleTcvetkov, P. (2021). Climate Policy Imbalance in the Energy Sector: Time to Focus on the Value of CO2 Utilization. Energies, 14(2), 411. https://doi.org/10.3390/en14020411