Article

An Experimental Study on the Characteristics of NOx Distributions at the SNCR Inlets of a Large-Scale CFB Boiler

1
College of Energy and Power Engineering, Nanjing Institute of Technology, Nanjing 211167, China
2
Key Laboratory of Low-grade Energy Utilization Technologies and Systems, Ministry of Education of PRC, Chongqing University, Chongqing 400044, China
3
Key Laboratory of Energy Thermal Conversion and Control of Ministry of Education, Southeast University, Nanjing 210096, China
4
Datang Wu’an Power Plant Co. Ltd., Handan 056300, China
*
Author to whom correspondence should be addressed.
Energies 2021, 14(5), 1267; https://doi.org/10.3390/en14051267
Submission received: 8 February 2021 / Revised: 22 February 2021 / Accepted: 23 February 2021 / Published: 25 February 2021
(This article belongs to the Special Issue Progress and Novel Applications of Fluidized Bed Technology)

Abstract

:
The unknown NOx distributions inside large-scale CFB (circulating fluidized bed) boilers have always hindered the economy of the SNCR (selective non-catalytic reduction) process. In this study, field tests were carried out on a typical 300 MW CFB boiler, where multi-level 316 L-made probe and Ecom-J2KN/Testo 350 analyzers were used to perform detailed two-dimensional distributions of flue gas composition at SNCR inlets for the first time. The penetration depth inside the horizontal flue pass was up to 7 m. The NOx distributions were analyzed in detail combining with the auxiliary test in the dilute phase zone. Key results show that the average O2 concentrations in #A and #C regions were 6.52% and 0.95%, respectively. The vertical NOx distributions of #A and #C SNCR inlets were similar, showing a trend of first increasing and then decreasing with peak value all appeared at 5 m depth, while the NOx distribution of #B SNCR inlet was basically increasing. Some local areas with extremely high NOx concentration (over 2000 mg/m3) were observed near the inclined edge of SNCR inlets, which has never been reported before. Based on this, the optimization of urea injections was conducted, which could save 15.7% of the urea solution consumption while ensuring ultra-low emission of NOx.

1. Introduction

In recent years, the circulating fluidized bed (CFB) technology has developed rapidly because of its advantages in fuel flexibility and load regulation [1,2,3,4]. The low-temperature combustion inside the furnace also provides sufficient benefits for de-NOx combustion [5,6] and high-efficient desulfurization [7]. Meanwhile, the operating temperature of the cyclone ranges from 800 to 950 °C, which is very suitable for the selective non-catalytic reduction (SNCR) system. The high-velocity rotation and strong turbulence intensity of flue gas promote the mixing of NOx with reduction agents. In general, the NOx emission can be limited below 100 mg/m3 with SNCR technology [8,9]. However, with the increasingly stringent requirements of environmental protection, the conventional treatments have been difficult to meet the updated NOx emission standard (50 mg/m3 at 6% O2) [10].
Thus, various de-NOx combustion technologies emerged as the times required, including air-staging [11], improvement of cyclone efficiency [12], fluidization state specification [13], flue gas recirculation [14] and optimization of urea injection [15]. Most utility boilers could meet the ultra-low emission standards after retrofit, while the problems of high NH3 escape and low NOx-removal efficiency existed in a large number of power plants.
Including but not limited to CFB boiler, many scholars focused on the mechanism of SNCR reactions to improve de-NOx efficiency. Taking the cyclone of a 660 MW CFB boiler as the object, Kang et al. [16] obtained a simplified 18-element mechanism using CHEMKIN software; the optimal temperature window was then proposed by combining with CFD simulation. When the gas temperature was not sufficient, the NOx-removal efficiency could also be improved to a certain extent by increasing the ratio of ammonia to nitrogen (NSR). Yao et al. [17] compared the effect of CO and CH4 on NO reduction in a tubular reactor with simulated flue gas. At low temperatures, the additive of C3H8 was the most efficient in enhancing SNCR process. At pressurized oxy-combustion condition, kinetic modeling was carried out by Rahman et al. [18] to simulate and optimize the SNCR process. The de-NOx efficiency increased as the pressure increased from 1 to 10 atm. At high pressure, the generation of NNH showed to be the most promoting reaction. Świeboda et al. [19] reviewed the application of SNCR technology in pulverized coal-fired boilers and pointed out that the measurement of exhaust gas parameters was the most direct validation for SNCR optimization.
It is generally believed that significant non-uniform input parameters exist in large-scale CFB boilers, including primary air and secondary air [20,21], fuel particle dispersion [22], coal feed distribution [23,24], recirculating ash and heat absorption deviation in multi-parallel loops. Therefore, the flue gas composition at furnace outlets should also be uneven. Generally speaking, the smaller the uniformity deviation of NSR distribution is, the higher NOx-removal efficiency is. On the contrary, the worse the mixing of urea solution with NOx will be, which not only affects the NOx-removal efficiency, but also may generate a sharp increase of NH3 escape in some local areas. Therefore, it is particularly important to obtain the actual NOx distributions at SNCR inlets for accurate urea injections. In the selective catalytic reduction (SCR) system commonly adopted in pulverized coal boiler, the non-uniform NOx distribution and flow field can be directly calculated [25] or even measured [26] due to low solid concentration and gas temperature. For example, Liu et al. [27] proposed a prediction-assisted feed-forward to enhance outlet NOx control; 22 key operating parameters were considered in the MLR (multi-layer perception) method and the original dynamic NOx emission was predicted successfully.
However, due to stronger thermal inertia and harsher in-furnace processes, it is difficult to dynamically monitor the NOx distributions at the SNCR inlets of CFB boilers. Thus, on-site measurement shows to be the key means to solve this problem. Niklasson et al. [28] performed on-line measurements with zirconia cell probe successfully. Hartge et al. [29] designed novel probes to measure flue gas at various levels inside a 235 MW CFB boiler. The maximum penetration depth reached 3 m. A wall region with a thickness of 0.5 m was observed in the test, and the non-uniformity of gas composition in front and rear walls was attributed to fuel distribution. With a self-made sampling device system, the authors once measured the gas along the horizontal direction of secondary air ports with a maximum sampling depth up to 4 m [30]. The oxygen distribution and jet penetration at the lower part of the furnace were basically predicted.
The above literature indicates that many studies are available concerning the SCR process or the reaction mechanism during SNCR process, but few are related to the non-uniformity of NOx concentration at the SNCR entrance of CFB boilers. In particular, relevant field tests have rarely been reported. Nonetheless, the accumulation of the studies in [28,29,31] inspires the scholars to further explore more detailed NOx distributions in large-scale CFB boilers through the field test approach. Thus, the present contribution reports a preliminary investigation into a typical 300 MW CFB boiler, focusing on measuring the characteristics of NOx distributions at the SNCR inlets. By comparison with the auxiliary test in the dilute phase, the non-uniformity of NOx distribution was analyzed in detail. In addition, local regions with ultra-high NOx concentration were captured at the inclined edge of the SNCR inlets for the first time. Based on the measured NOx distributions, the regulation of precise urea injections was proposed, which could save 15.7% of the urea consumption while ensuring ultra-low emission of NOx. It is the first time to achieve the sampling depth up to 7 m, and the detailed two-dimensional distributions of NOx concentration were obtained. The results provide the lasting source for the improvement of CFB combustor model, and a direct reference for the prediction of NOx distribution at SNCR entrance to enhance de-NOx efficiency in large-scale CFB boilers.

2. Experimental Section

2.1. The 300 MW Utility CFB Boiler

As shown in Figure 1, the tested 300 MW CFB boiler has single furnace, single air distributor and three steam-cooled cyclones, labeled A–C from the left wall to the right wall. The cross-sectional area of the furnace is 28.3 × 9.8 m2. Circulating ash return from the rear wall through six seal loops to improve the uniformity of bed temperature distribution. Eight coal feed ports are arranged on the front wall, the primary air enters the windbox from two sides and the secondary air is blown into the chamber through the high and low levels at the front and rear walls. Eighteen L-shape platen heat exchangers consist of three different types with the same numbers, namely intermediate temperature superheater (ITS), high temperature superheaters (THS) and high temperature reheaters (HTR). They protrude into the furnace at two heights from the front wall. Two water-cooled evaporation walls are arranged on the rear wall. The SNCR system with urea solution injections is installed on each side of the three cyclone inlets. The main design parameters of this boiler are exhibited in Table 1.

2.2. Measurement Port Arrangement and Test Procedure

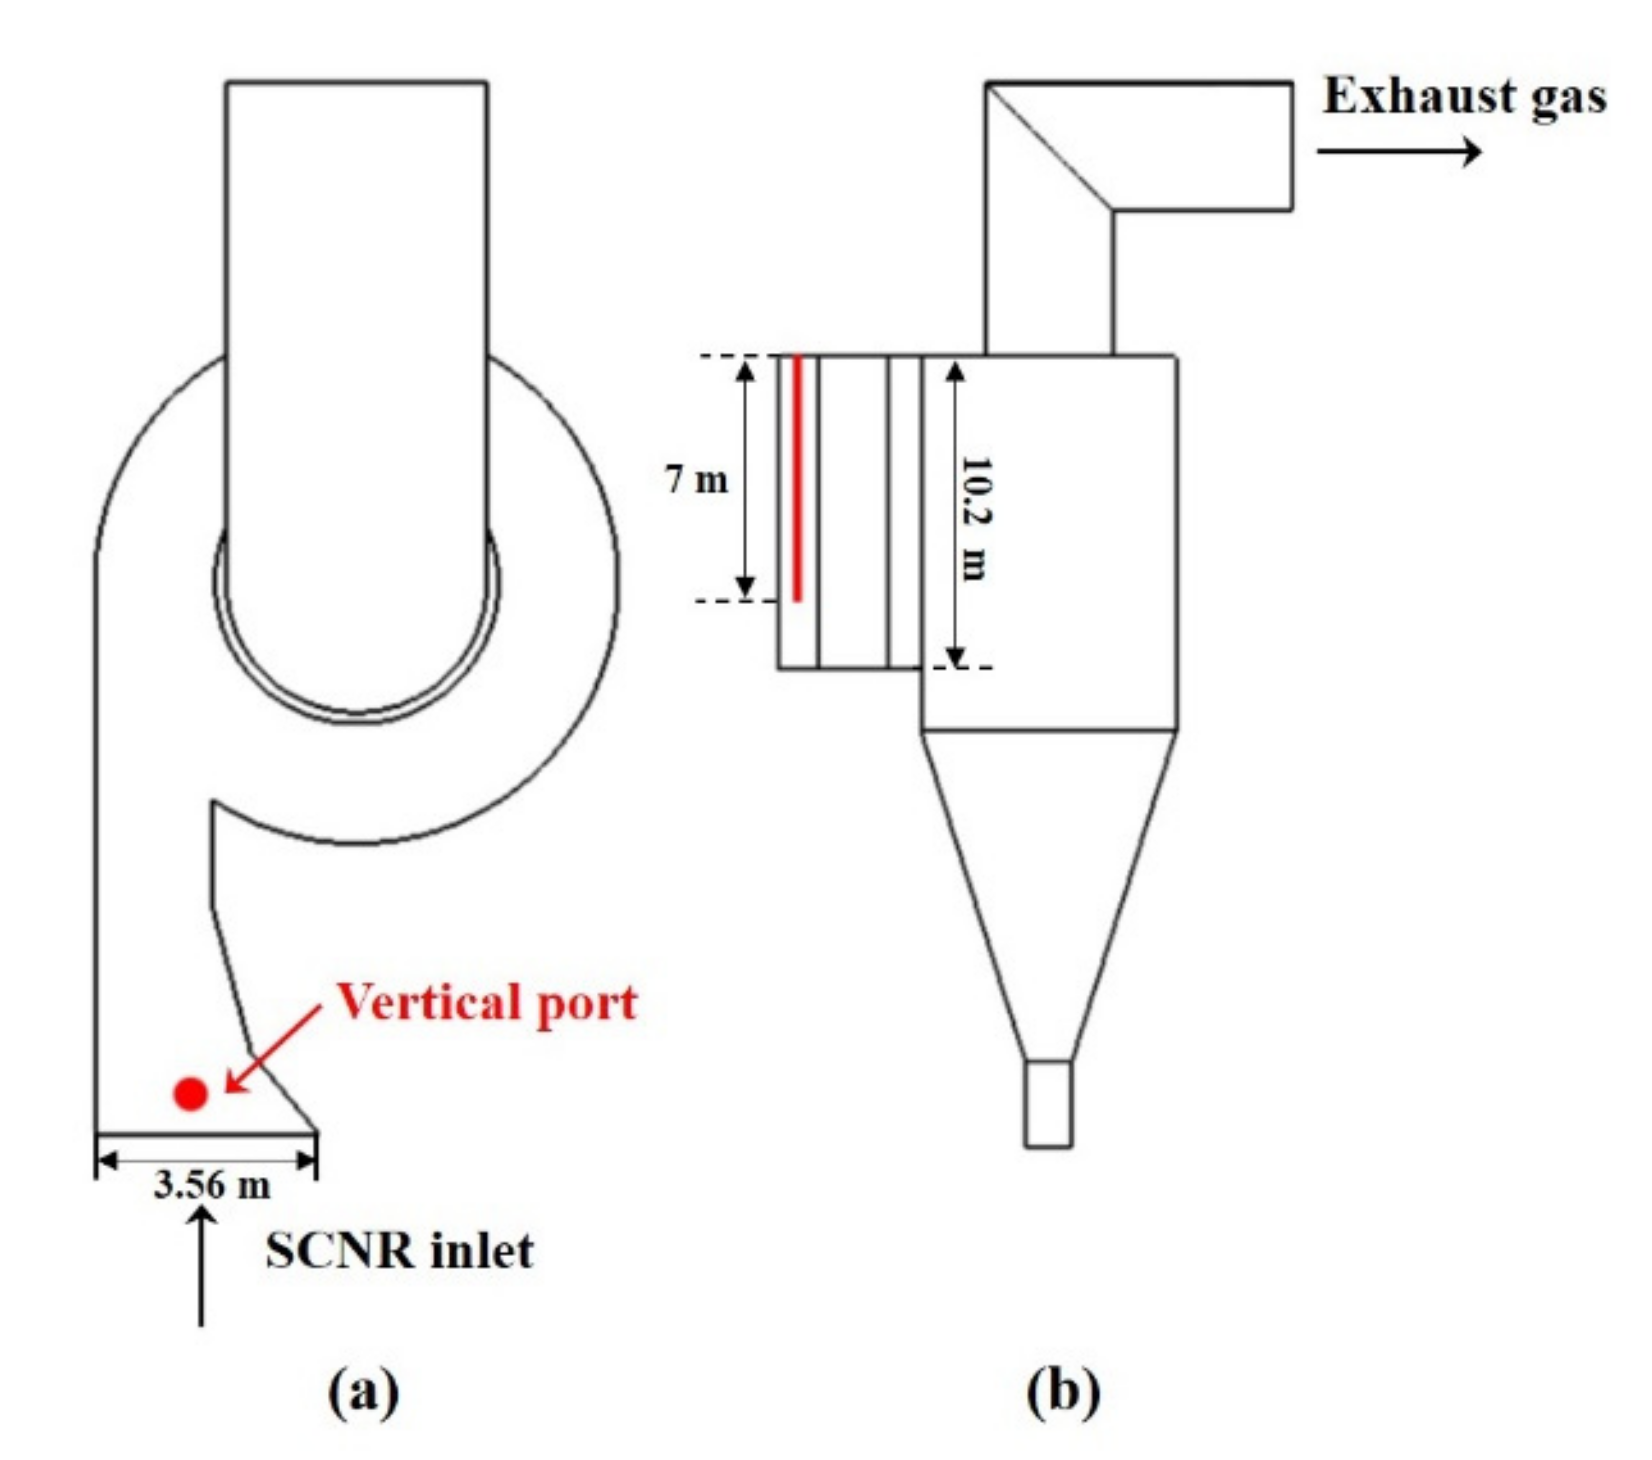
As illustrated in Figure 2, the vertical measurement ports at SNCR inlets of the three cyclones were all installed in the middle of the roof of the horizontal flue pass and were about 700 mm before the injection of the urea spray guns. The sampling probe was composed of four 316 L stainless steel tubes with sectional size of 28 mm × 6 mm and a length of 2200 mm; all tubes were connected by threads. With such a long probe, complex chemical reactions could occur at the same time due to the absence of water-cooling, and all the deviations must be related to the probe length. In our previous study [30], the flue gas could continue to react with C-bearing species of the tube walls, but the S-bearing species did not change significantly. Thus, the measurement errors of O2 and CO with a 2.2 m, 316 L probe were −4% and 8.6%, and the concentrations of SO2 and NOx had no obvious changes. However, the deviations corresponding to longer probes could not increase linearly to a certain extent as it was also affected by the absolute value of oxygen concentration and gas temperature. In fact, the measurement error of O2 should be obviously higher than proposed, while the measurement errors of NOx and CO were hard to be clarified at this stage, as the potential reactions of NO, NO2 and CO with O2 could also cause major changes. The authors hoped to reduce the measurement errors within the scope of existing cognition. Thus, the previous obtained measurement errors were adopted, and the same relative corrections were applied to all the corresponding measured data.
The analysis system was composed of the above-mentioned probe, filter device, vacuum pump, three-way valve and gas analyzers. Two gas analyzers were used in this test, as detailed in Table 2. The Ecom-J2KN type analyzer was for routine use, while the Testo 350 type analyzer would be used in the areas with odd values or large concentration gradients as a check. According to our experience of on-site tests, the gas composition would still show sinusoidal fluctuation under stable loads [32,33], so at least two groups of peak/valley values of flue gas should be recorded.
As the height of the horizontal flue pass was 10 m and the ash deposition layer at the bottom was about 2–3 m, the maximum penetration depth of 7 m could basically cover the flow area of the SNCR inlets. Meanwhile, to figure out the relationship of flue gas composition between the SNCR inlets and the dilute phase zone, two measurement ports were installed at 20.6 m above the distributor in the corresponding area of cyclone #A, as shown in Figure 3. The maximum penetration depth of each measurement port was about 5 m, so the combustion and pollutant distribution in the whole depth direction of the furnace could be obtained. The above two tests were carried out at the same time to ensure comparability.
Each horizontal measurement port adopted the urea spray guns at the straight edge of the horizontal flue pass, i.e., #1–#6 shown in Figure 4. Because the inner side of the cyclone inlet was inclined, the horizontal measurement could not characterize the cross-sectional distribution precisely, so the #7–#10 spray guns were not adopted as measurement ports. The distances between these urea injections and the roof of the horizontal flue pass were 1.86, 3.32, 3.9, 6.55, 7.05 and 7.65 m. respectively. The width of the horizontal flue pass corresponding to the spray guns was about 2.2 m, so the sampling probe was composed of two 316 L stainless steel tubes. To avoid the influence of adjacent urea injections, the valves of the #7–#10 spray guns at the inclined edge were closed in turn during the test inside each spray gun.

2.3. Working Condition Arrangement

Three-day stable load periods were applied to keep the unit load and operating parameters relatively stable, during which the trial test, regular test and repetitive test were conducted. The main operating conditions corresponding to each measurement are listed in Table 3 and Table 4, where the bed temperatures refer to those in the corresponding area of each circulating loop. The ultimate and proximate analysis of the experimental coal is shown in Table 5.

3. Results and Discussion

3.1. Vertical Distributions of Flue Gas Composition at the SNCR Inlets

As mentioned above, to exclude the influence of accidental factors, several tests were conducted on each vertical or horizontal measurement port of the SNCR inlet. Therefore, the typical distribution characteristics with repeatability are presented in the following results.

3.1.1. Vertical Distributions of Flue Gas Composition at #A SNCR Inlet

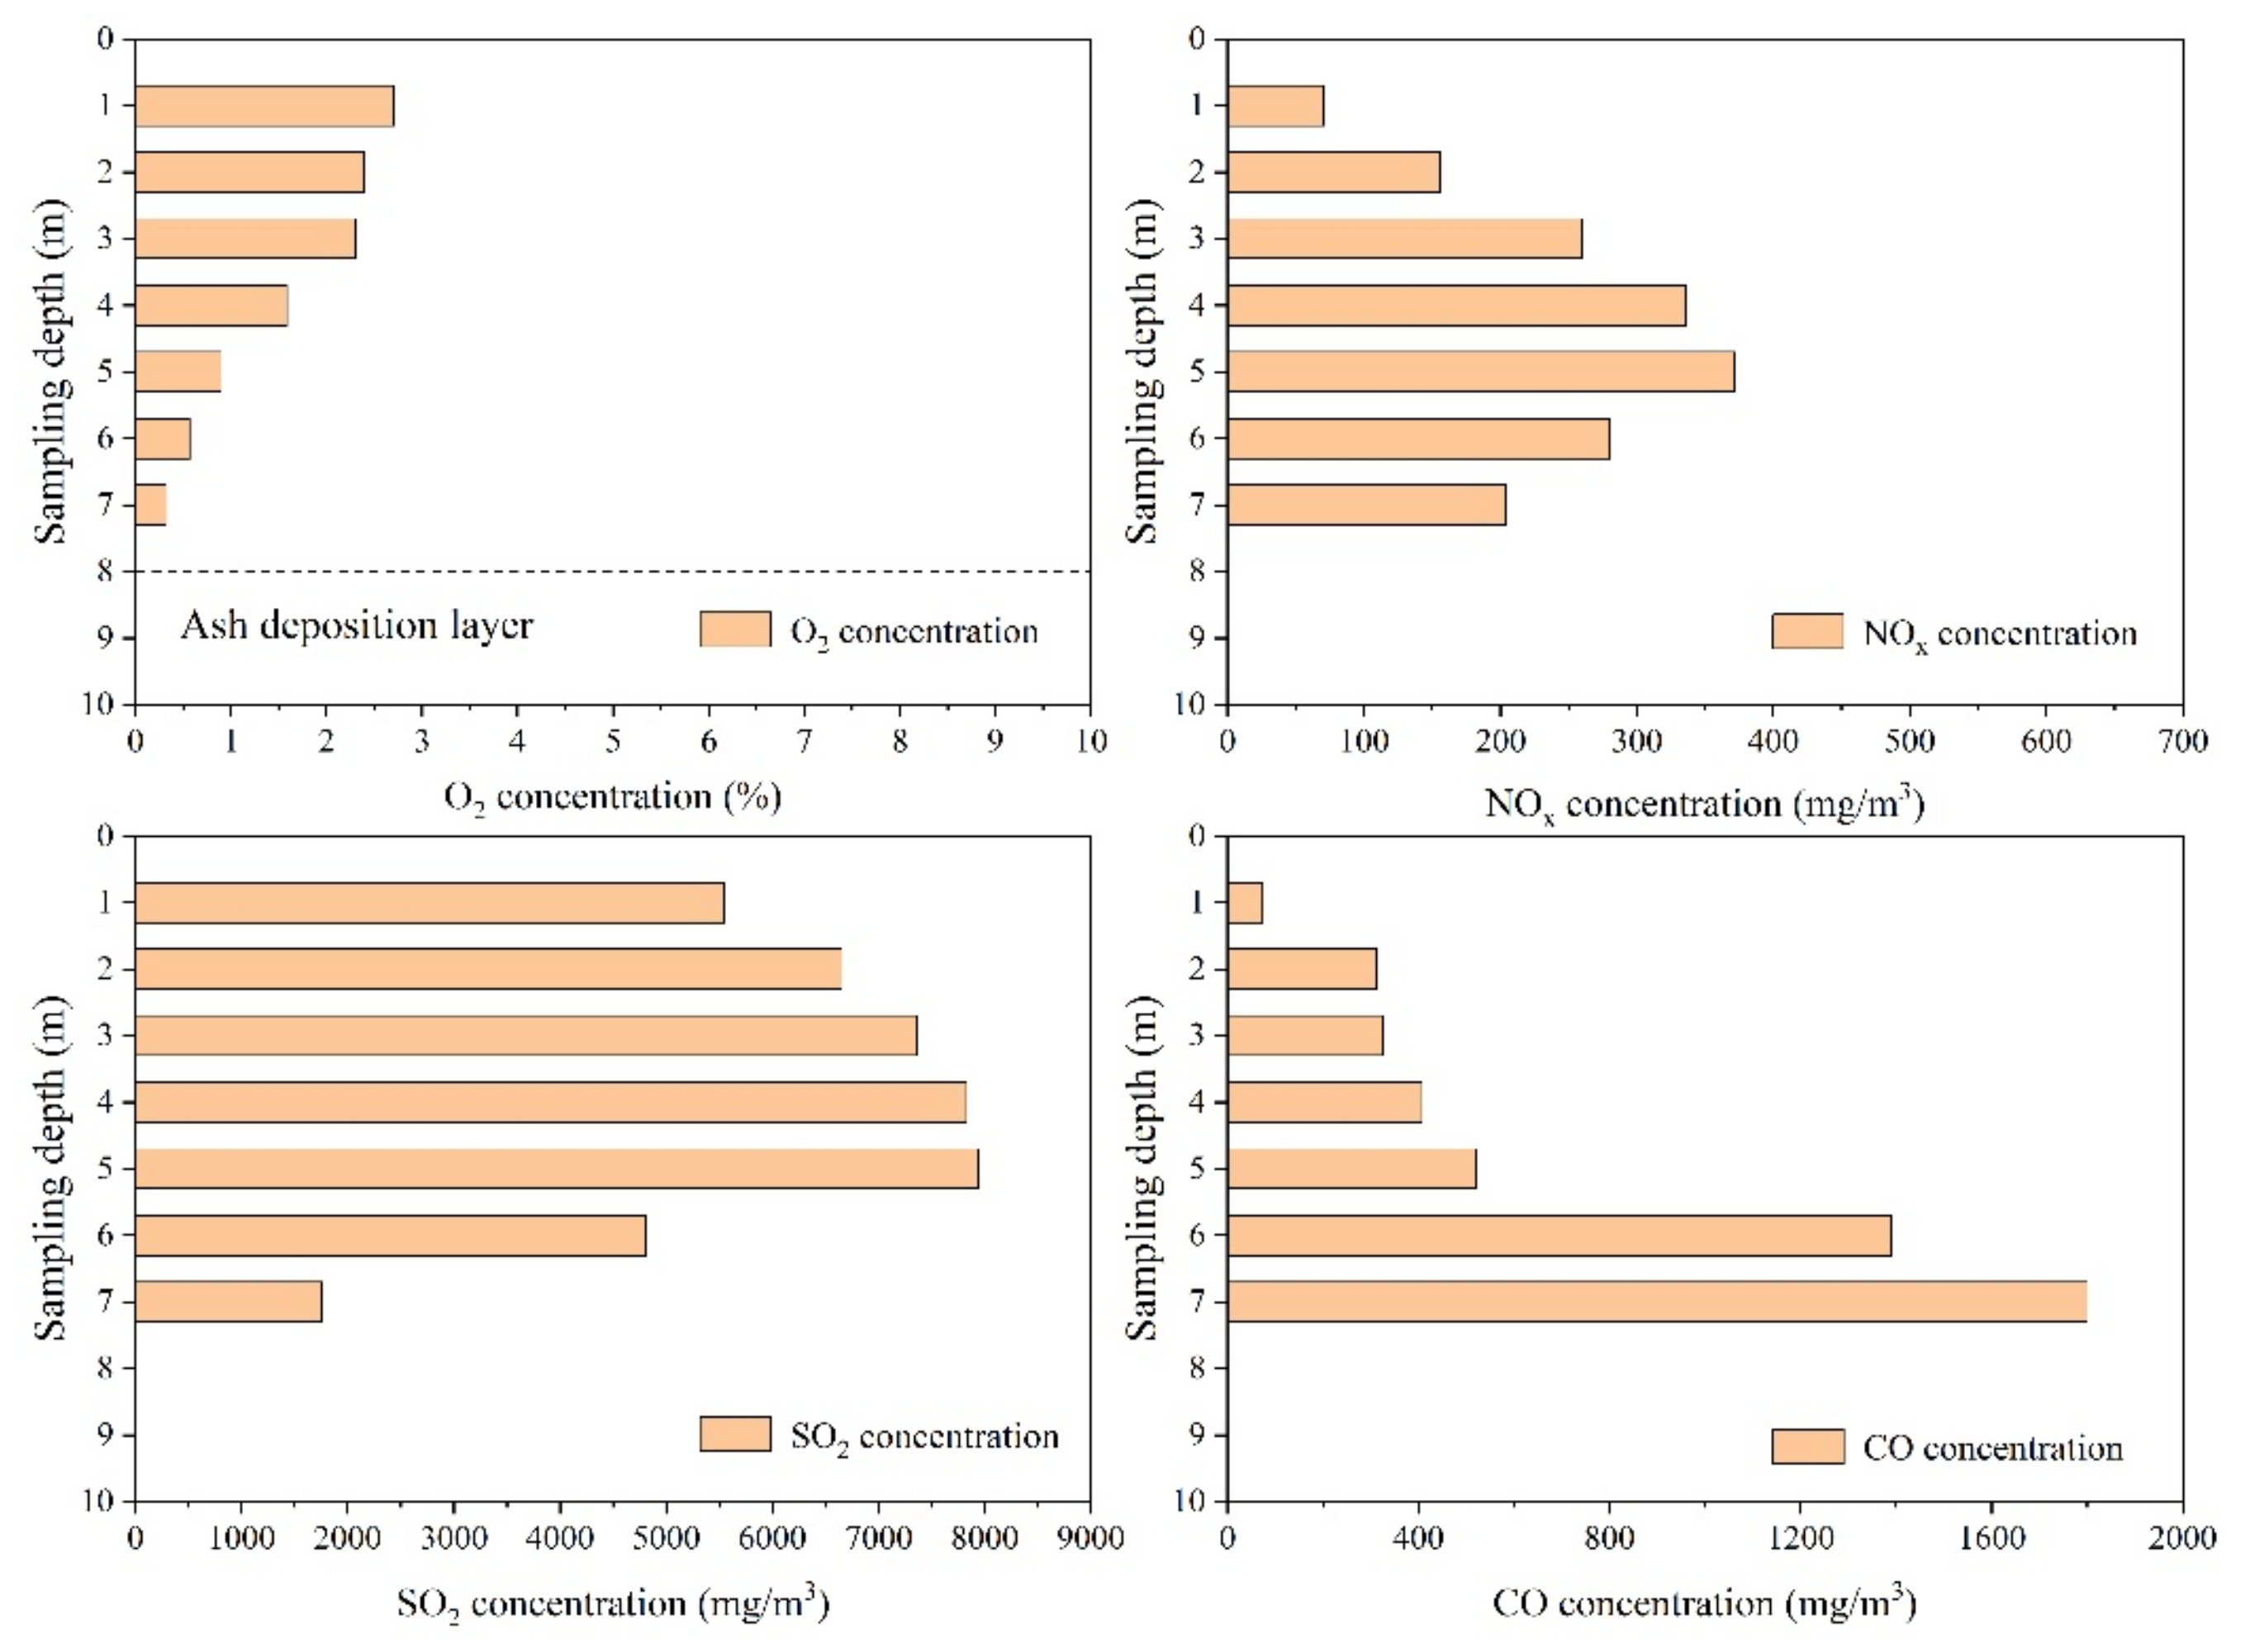
The vertical distributions of flue gas composition at #A horizontal flue pass is exhibited in Figure 5. During this test, it was confirmed that, when the penetration depth of the probe exceeded 7.5 m, it gradually reached the ash deposition layer. Along vertical direction, the oxygen concentration gradually decreased from 2.7% to 0.37%, and the corresponding CO concentration increased from less than 100 to 1800 mg/m3, indicating that the lower part of the SNCR entrance was in an obvious reducing condition. This should be due to the uneven distribution of fuel and air in the corresponding dense phase zone. On the other hand, the vertical distributions of SO2 and NOx were shown to be parabolic, and the peak values all appeared at the sampling depth of 5 m. As in-furnace desulfurization was not adopted, it is believed that this distribution reflected the actual fuel distribution at the lower part of the furnace in the depth direction.
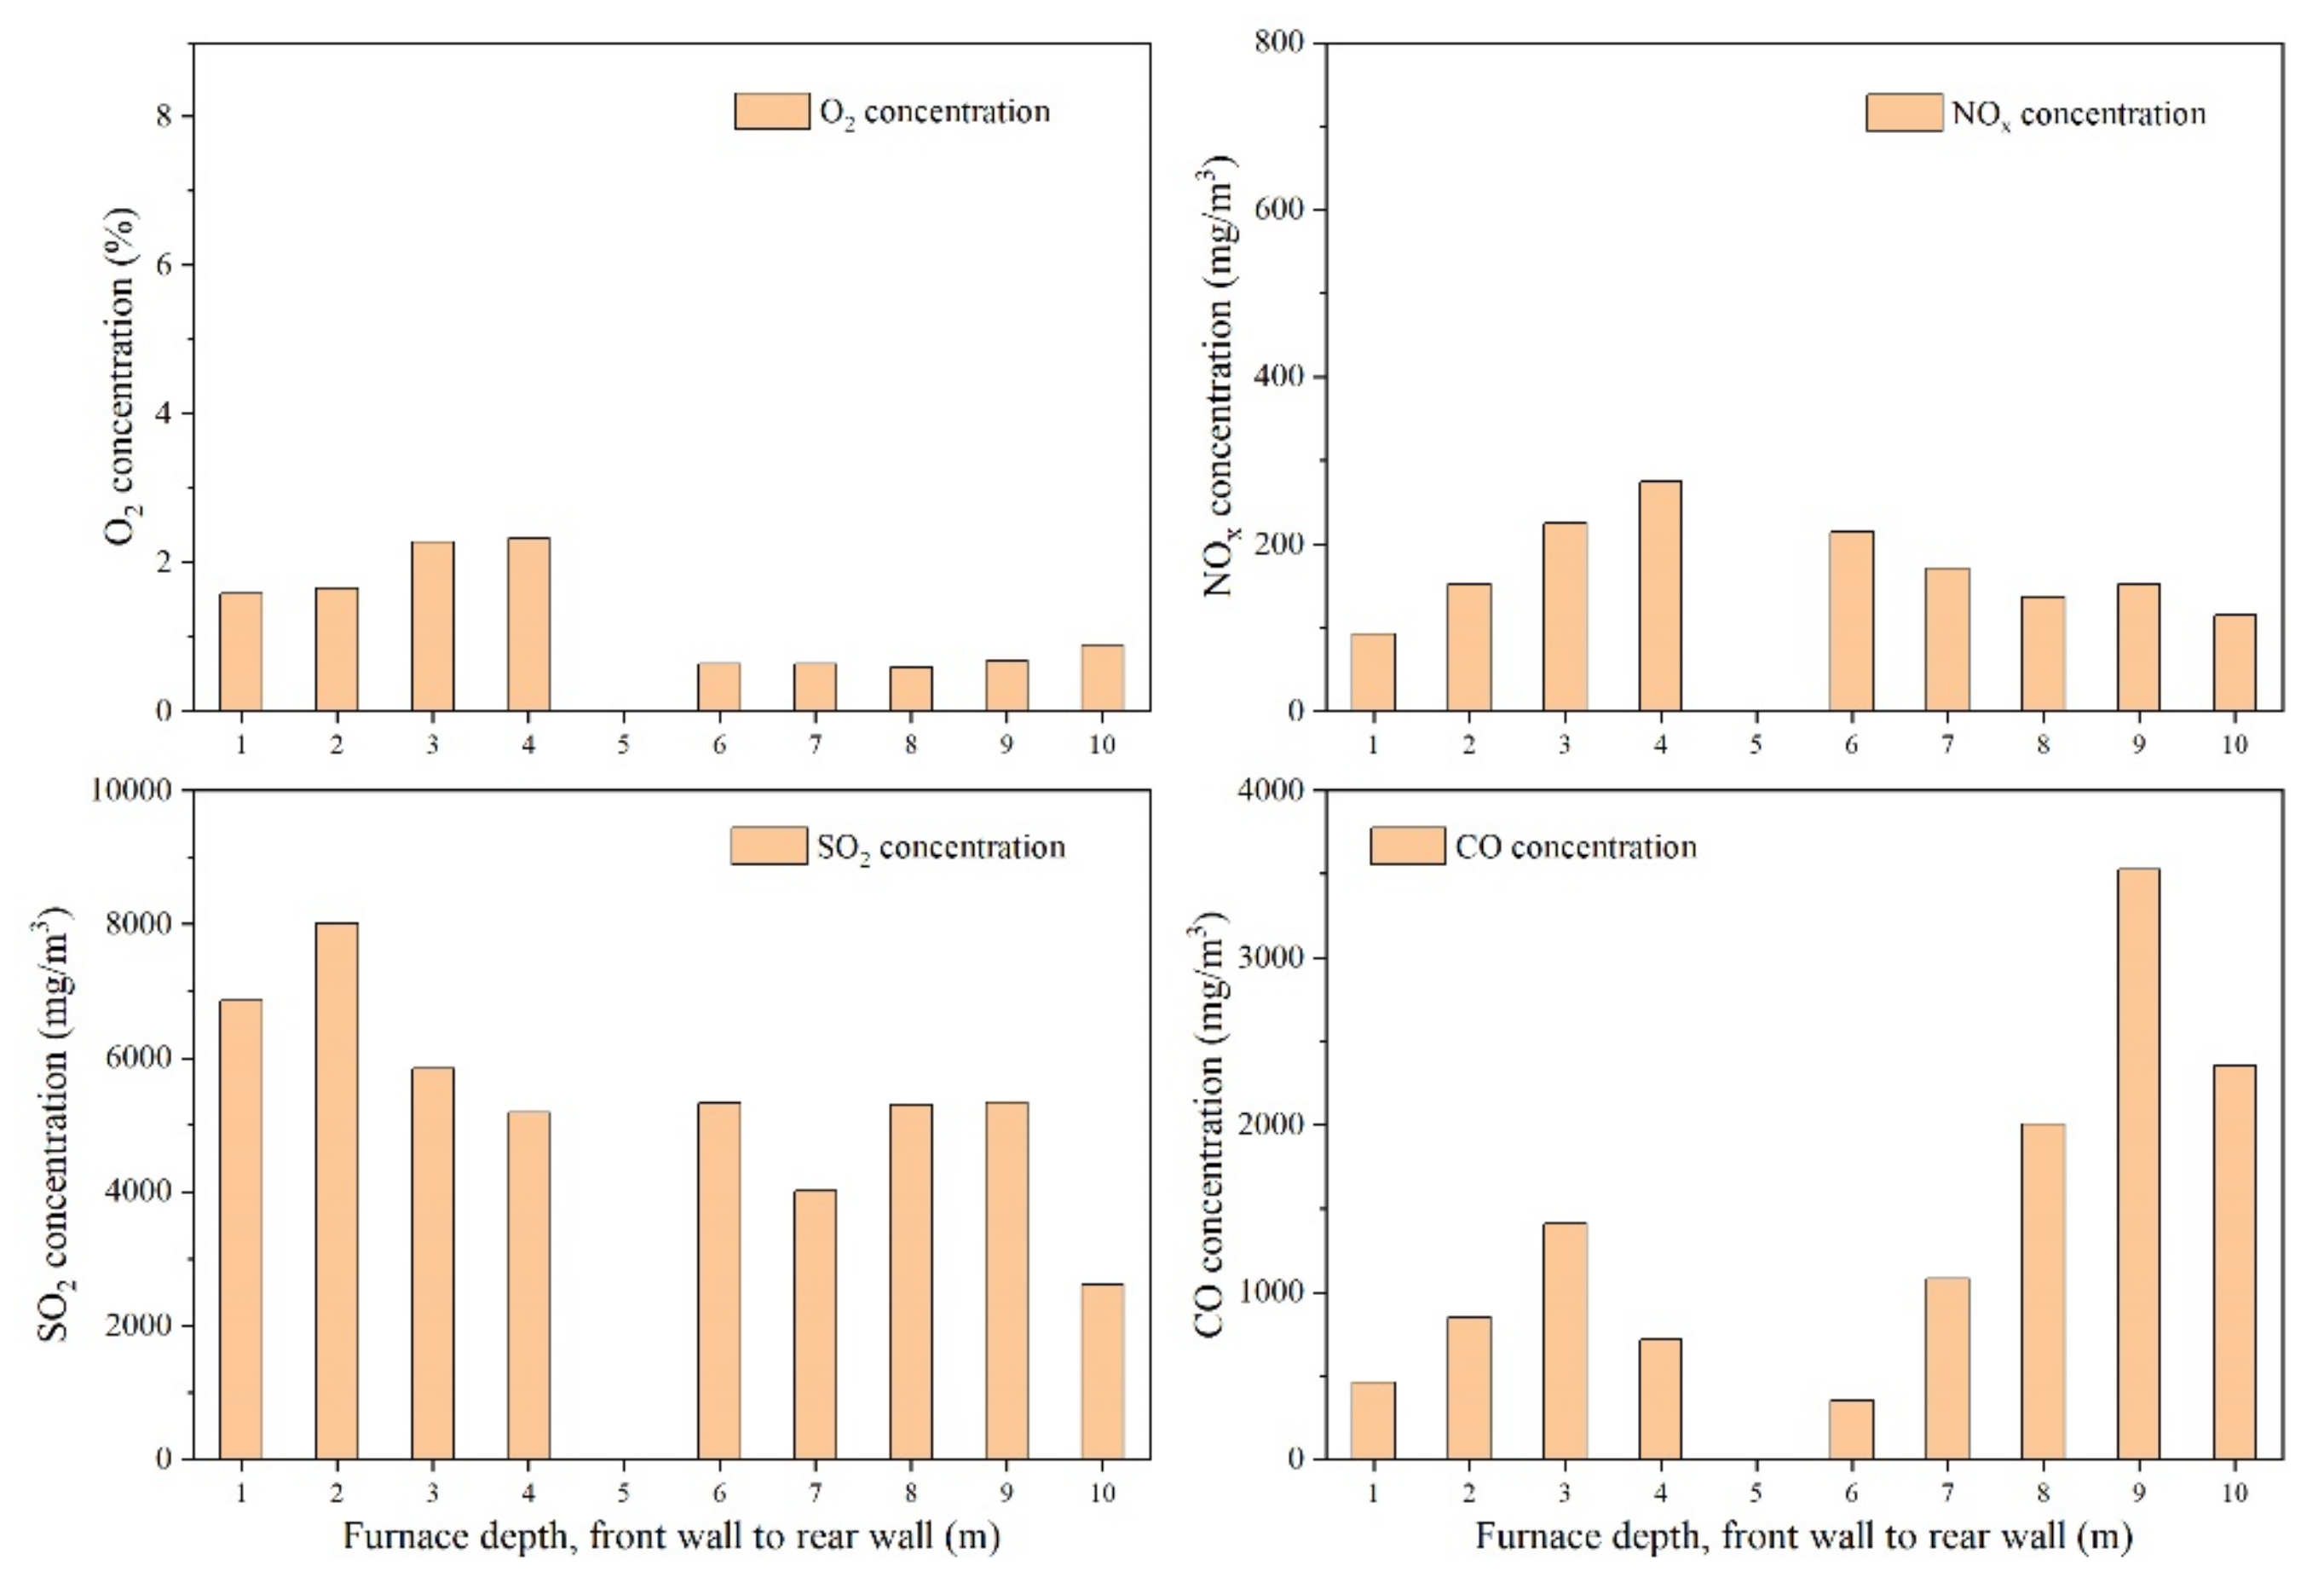
To confirm this conjecture, Figure 6 illustrates the distribution of flue gas composition along the depth direction of the measurement port in dilute phase. It can be seen that the distribution trend of O2 and CO concentrations was the same as that in #A SNCR inlet. Higher O2 content was observed near the front wall. while higher CO concentration appeared near the rear wall. This indicated that the flue gas in the upper part of the horizontal flue pass mainly came from that in the front wall of the dilute phase zone; the bottom part (except the ash deposition layer) was mainly affected by the flue gas near the rear wall; and the middle part should be affected by the flue gas in the central zone of the furnace. In addition, the NOx concentration along furnace depth also presented a parabolic distribution with an average value of about 174 mg/m3, while the NOx concentration at SNCR inlet reached 240 mg/m3 with higher O2 content, indicating that the mixing of gases played a dominant role in promoting further combustion in the upper furnace. Judged from the changes of SO2 distribution, it was believed that combustion was mainly concentrated in the central part of the furnace, and the corresponding value increased from 6220 to 7937 mg/m3 until the SNCR inlet.

3.1.2. Vertical Distributions of Flue Gas Composition at #B SNCR Inlet

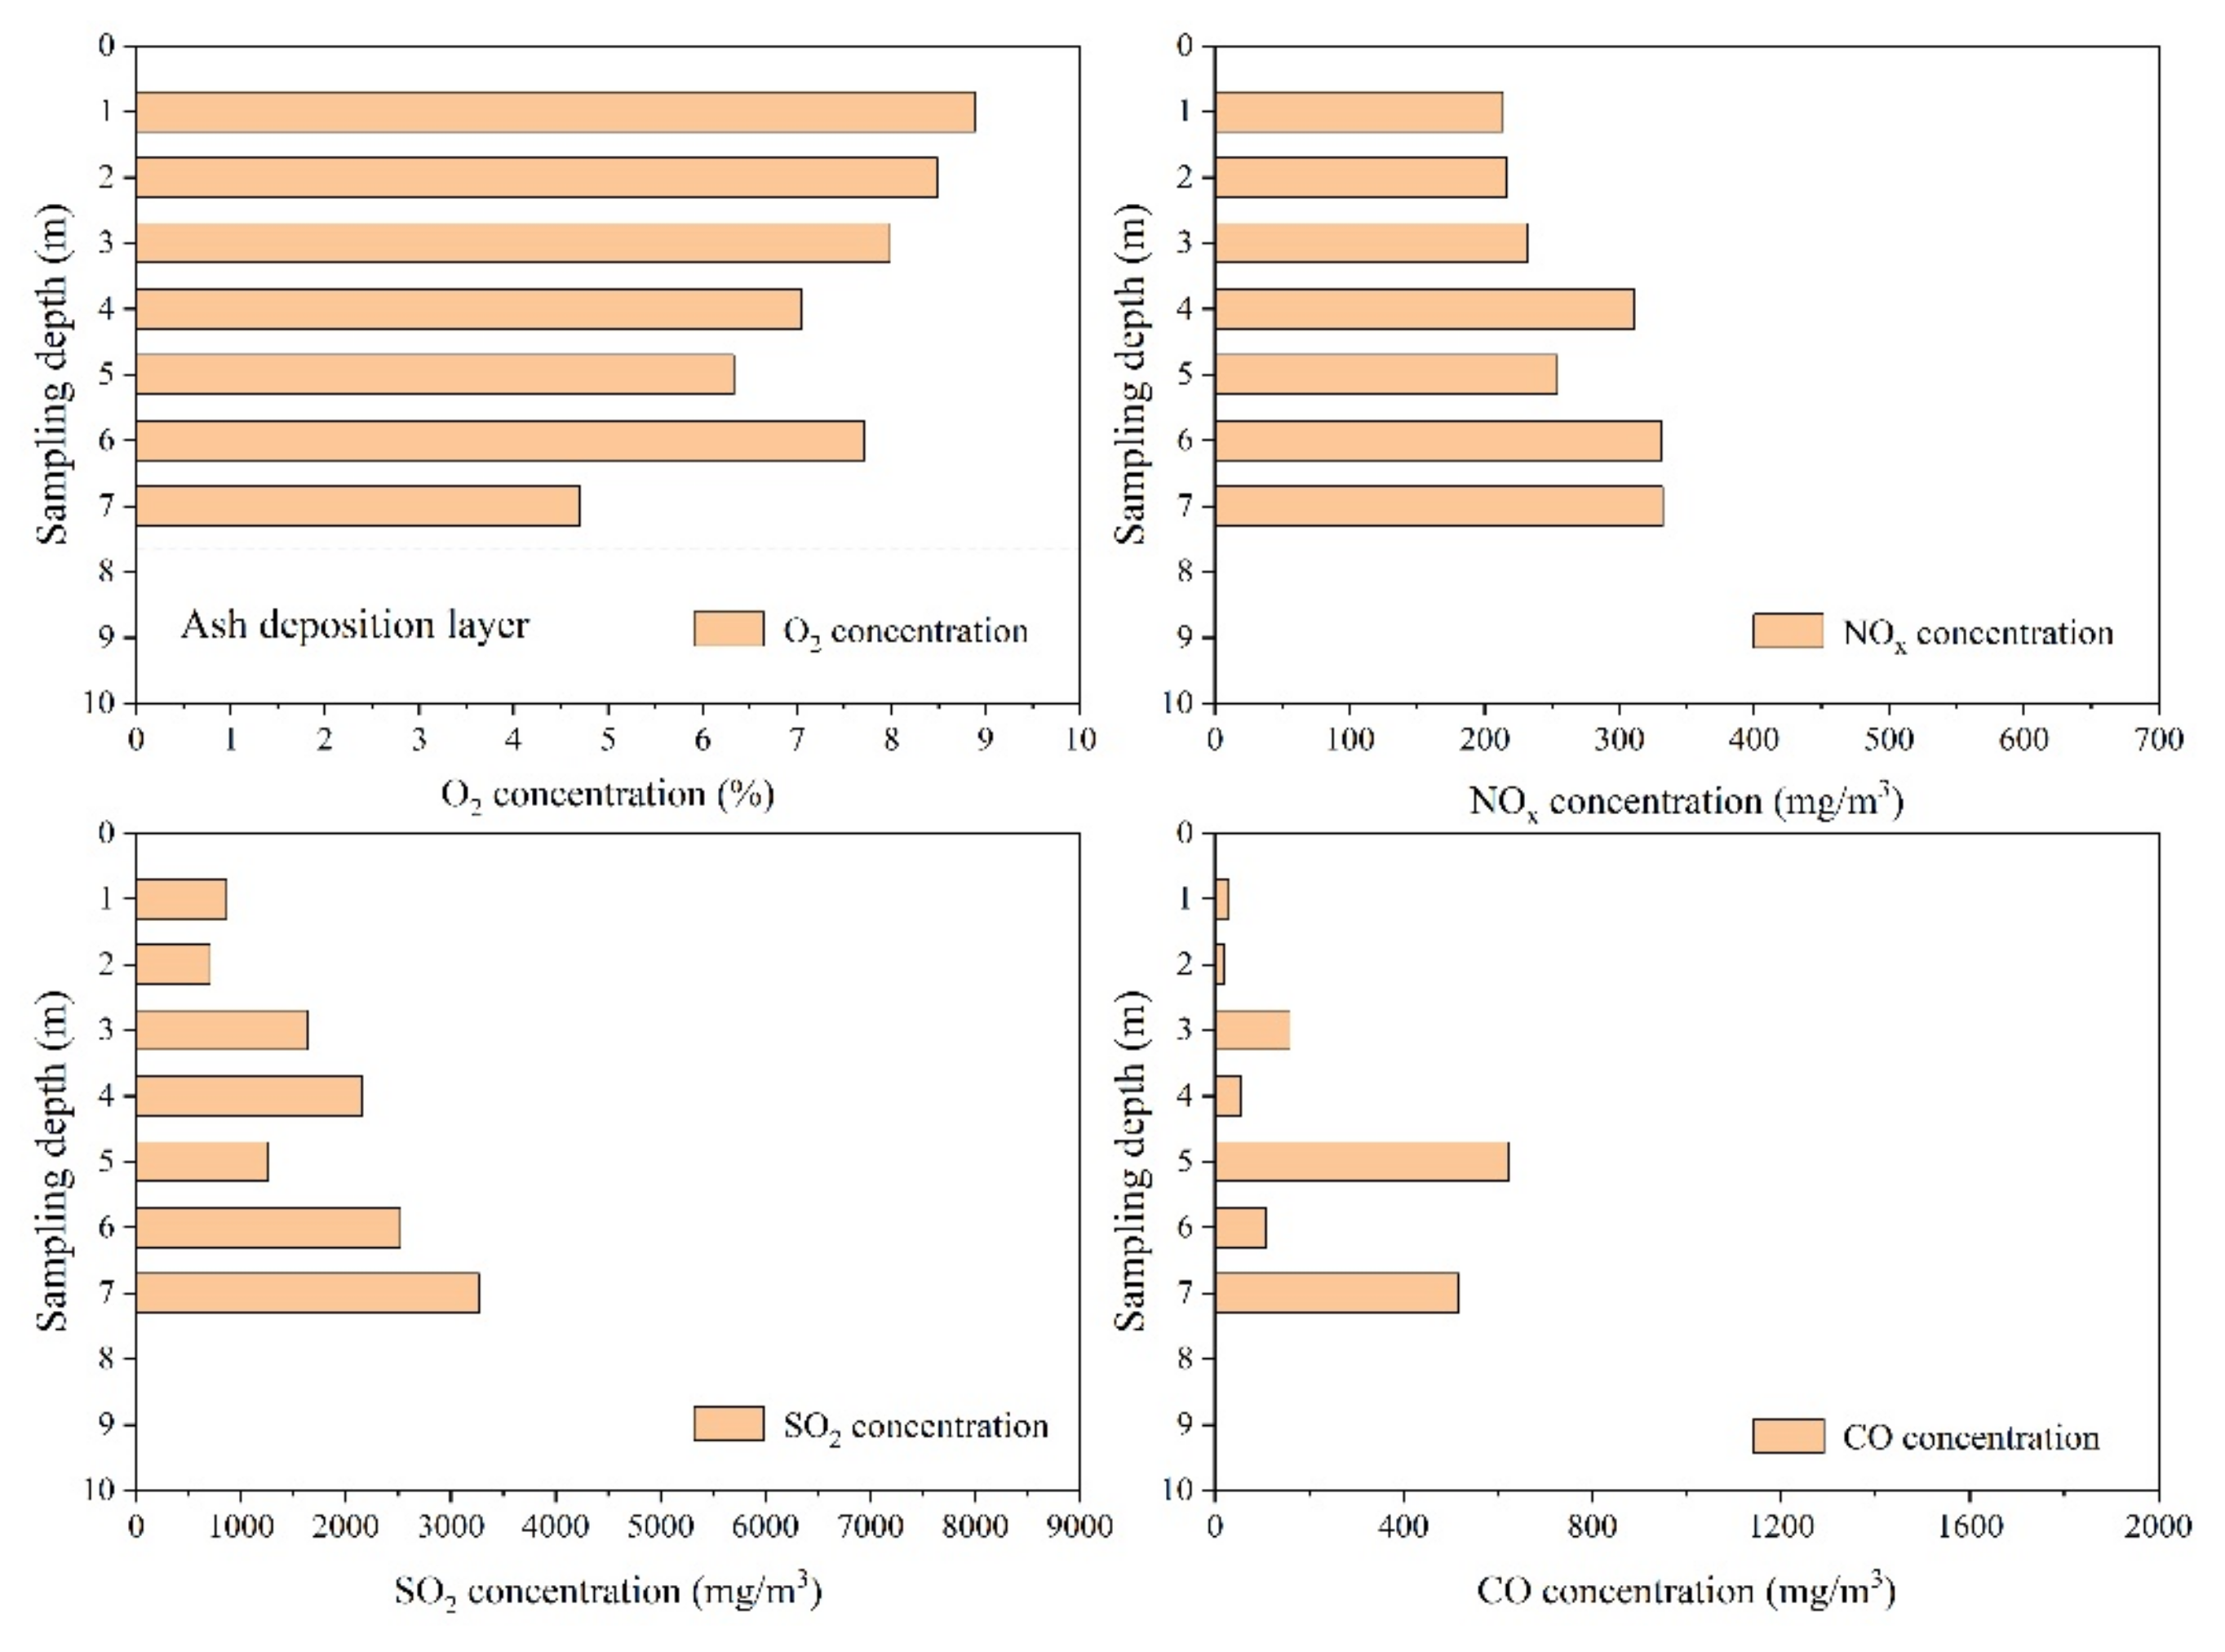
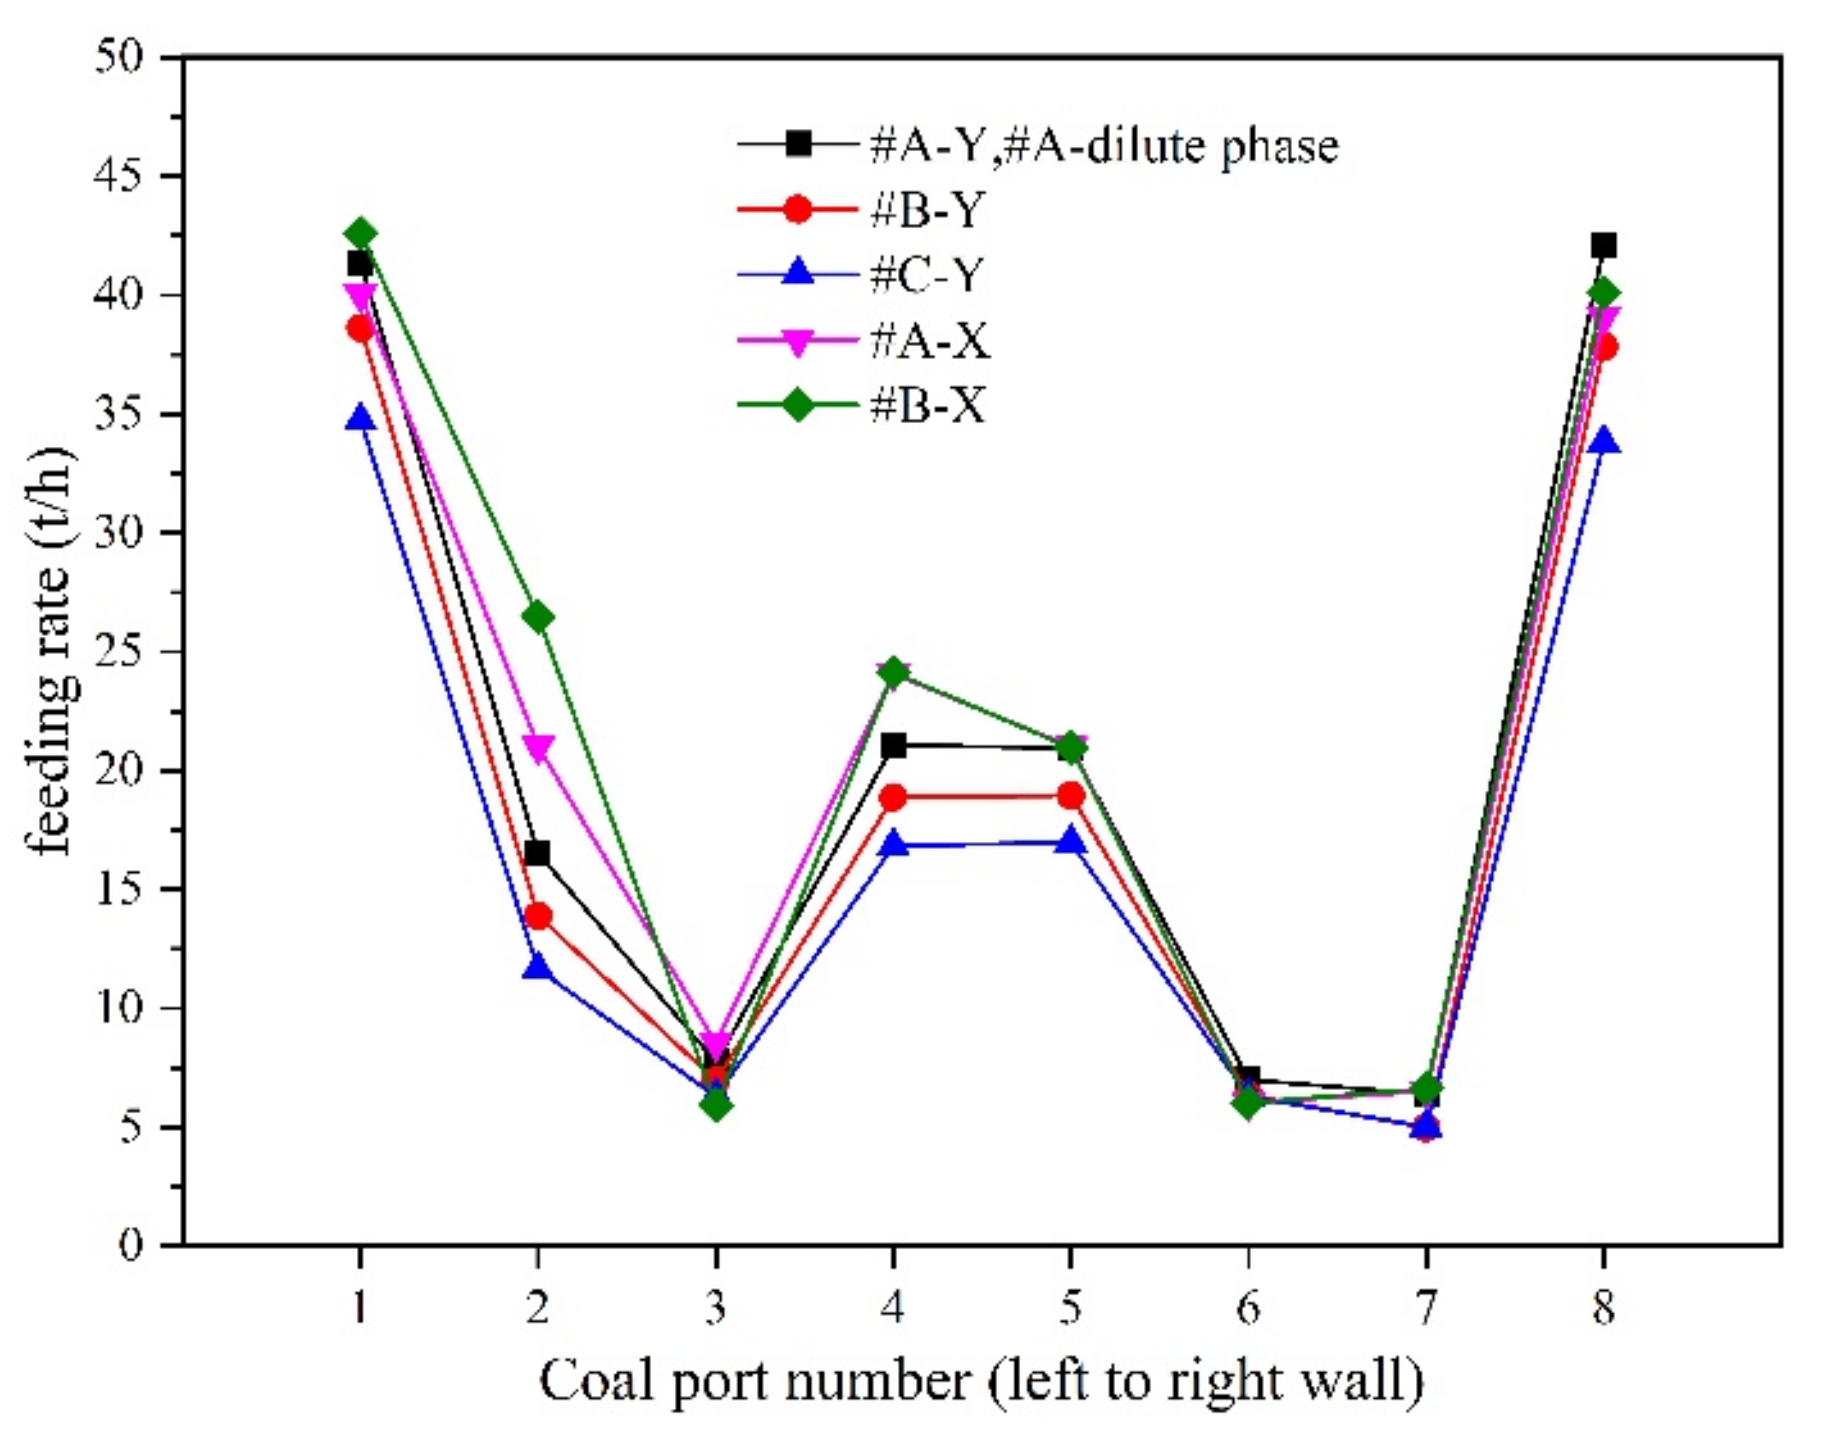
The vertical distributions of flue gas composition at #B SNCR inlet is exhibited in Figure 7. The O2 content gradually decreased along vertical direction, with the same distribution trend as that in the #A SNCR inlet. However, all the measured O2 concentrations were over 4.69%, and the maximum value was up to 8.88%. Thus, the CO concentration remained at a very low level. To analyze this combustion difference, the coal feed distribution during the test is illustrated in Figure 8. Although some variation was obviously unavoidable, it was significant that mass flows were always the highest through feed lines #1 and #8 and lower through the middle ones. This extremely uneven coal feed distribution must be limited by the primary air distribution along furnace width, so as to provide more uniform bed temperatures. Before the test, the blast caps and secondary air nozzles were optimized to introduce more uniform air, thus it was reasonable that O2 content in the middle part of the furnace was higher. Different from the #A SNCR inlet, the vertical distributions of NOx and SO2 at the #B SNCR inlet showed an increasing trend. Although the corresponding dilute phase zone was not measured, it could be judged from the above analysis that the combustion share of the coal should be higher near the rear wall. In this boiler, the coal was introduced into the furnace through seeding coal air, so the coal distribution over the bed was strongly affected by the initial momentum of fuel particles. Less coal could be thrown farther under the action of similar seeding air volume. In addition, the average SO2 concentration was only 1772 mg/m3, the strong oxidizing condition in the middle part could promote the generation and conversion of NOx [34,35]. Thus, the average NOx concentration reached 270 mg/m3, which was higher than the measured value at #A SNCR inlet.

3.1.3. Vertical Distributions of Flue Gas Composition at #C SNCR Inlet

The vertical distributions of flue gas composition at #C SNCR inlet is exhibited in Figure 9. The O2 concentration presented a parabolic distribution, and the peak value appeared at 3 m away from the roof. The distribution of NOx concentration was similar to that at #A SNCR inlet, and the maximum value also existed at the depth of 5 m. However, the measured value was more than 650 mg/m3, which was far greater than the average NOx concentration along vertical direction. After repeated tests, the accuracy of this measurement result was confirmed. This should be due to the intense combustion of feeding coal in the central part of the furnace corresponding to the #C SNCR inlet, and this influence lasted until the furnace outlet. In any case, it must be related to the initial coal distribution over the bed in the depth direction. Moreover, the SO2 distribution was highly consistent with the NOx distribution, which also confirmed this judgment.

3.2. Horizontal NOx Distributions at the Cross Section of the SNCR Inlets

It is difficult to describe the distribution characteristics of flue gas composition only in the vertical direction of the horizontal flue duct. Therefore, it is necessary to draw a complete NOx distribution by combining with the horizontal sampling at each height, so as to provide more powerful reference for accurate urea injections. During the measurement, part of the spray guns cannot be inserted due to the obstruction of steel frame, but we tried our best to obtain the NOx distributions of the whole cross sections.
The horizontal distributions of NOx concentration at #A and #C SNCR inlets are exhibited in Figure 10. For the #C SNCR inlet, only the measurements of #5 and #6 spray guns were accessible due to the obstruction of the furnace layout. However, three interesting phenomena can be summarized: (1) The NOx concentrations in the horizontal direction of the two SNCR inlets were all maintained within 200–300 mg/m3 except the #3 spray gun of #A SNCR inlet, and the peak value of NOx concentration also appeared just near the #3 height. (2) No local regions with low NOx concentration due to denitration reaction were observed. This provided a better prerequisite for optimization of accurate urea injections. (3) For the measured values at the #3 urea spray gun, the NOx distribution had no changes after repeated tests. Along the horizontal direction, the NOx concentration fluctuated and suddenly increased from 309 to 2890 mg/m3 after 1200 mm depth, and finally fell back to about 785 mg/m3 near the inclined wall.
The horizontal distributions of NOx concentration at #B SNCR inlet is exhibited in Figure 11, where the position with the highest value appeared at the height of #6 urea spray gun, i.e., the bottom part of the horizontal flue pass. This is also consistent with the distribution trend shown in Figure 7. Moreover, the NOx concentration at the height of #6 urea spray gun increased sharply from 478 to 2258 mg/m3 after 1200 mm depth. In fact, it is difficult to explain this distribution characteristics, and such a high NOx concentration has never been reported in the previous numerical simulations. Therefore, the authors believe that the long-term existence of high NOx concentration in local area should be related to the following reasons: (1) local extremely uneven gas–solid flow and the subsequent devolatilization process during actual boiler operation; (2) the impact and accumulation of particles, together with unstable flow field [36] may occur near the inclined edge of the SNCR inlet, so as to increase the probability of high NOx concentration in this region; and (3) complex chemical reactions in the hot probe, such as oxidation reactions of carbonous dust or hydrocarbon gases and competitive reactions of NO/NO2/CO when O2 was present. This factor was unverified but existed potentially, as, when the probe was immediately moved to another measurement depth, the NOx value decreased randomly. After turning back, the NOx value turned to rebound again. These ultra-high concentrations of NOx could form at the furnace outlet or in the dilute phase zone but were not captured by this test. For the #C SNCR inlet, only the measurement ports of #5 and #6 spray guns were accessible due to the obstruction of the furnace layout. Thus, the corresponding results are not exhibited in this paper because of the lack of representativeness.

3.3. Optimization of Urea Injections Based on Uneven NOx Distributions

To save urea consumption, it is necessary to obtain the NOx flux distribution of the cross section. At present, although detailed distributions of NOx concentration at the three SNCR inlets were obtained, the overall velocity field of flue gas was definitely non-uniform. According to the simulation results of Wang et al. [37], the composition and flow rate had great influence on the urea demand. Therefore, only the preliminary optimization of the flow rate in each urea spray gun was carried out. Before the optimization, the valves of all the spray gun were full open, and the flow rate of urea solution at each SNCR inlet was the same. Meanwhile, the NH3 escape detected from the tail flue pass was 8.39 ppm, indicating that obvious excessive injection of urea solution was conducted in some local area.
The optimization process was divided into two steps. Firstly, the NOx concentrations were shown to be the highest in the middle section of #A and #C SNCR inlets based on the vertical measurement results. Thus, the valve openings of #2, #3, #8 and #9 spray guns were kept unchanged and the others were gradually reduced. The NOx concentration at the roof of #B SNCR inlet was the lowest, so the valve opening of #4 and #10 spray guns were kept unchanged and the others were reduced accordingly. Judged from the horizontal measured results, the local area with extremely high NOx concentration just existed at the height where the overall horizontal NOx concentration was high, so the adjustment of the inner and outer urea spray guns was consistent. Secondly, the flow rate of urea solution in the main pipe was slowly reduced in the same proportion, while the stack emission of NOx was detected at the same time. Eventually, the main operating parameters of SNCR process before and after the urea optimization are exhibited in Table 6, where the consumption of urea solution was reduced by 15.7% under the condition that the NOx stack emission was still limited below 50 mg/m3.
It should also be noted that the highest NOx position of #A and #C SNCR inlets appeared at 5 m from the roof, which was just in the middle of #2 (#8) and #3 (#9) spray guns. Therefore, future work should be focused on the optimization of the position and injection characteristics of the spray gun and the investigation of initial distribution of fuel particles over the bed, so as to further improve the NOx-removal efficiency during SNCR process.

4. Conclusions

In this study, field tests with deep penetration sampling were conducted on a typical large-scale CFB boiler. The horizontal and vertical distributions of flue gas composition at each SNCR inlet was successfully obtained, and the differences of NOx concentration were analyzed in detail combined with air/coal distribution as well as one auxiliary test in dilute phase zone. Although some horizontal ports were inaccessible due to limitation of site layout, the measurements provided a complete picture of the NOx distribution characteristics in a large utility CFB boiler for the first time.
The vertical NOx distribution at SNCR inlet was basically consistent with that in the dilute phase zone, which depended mainly on the initial fuel dispersion along depth direction. In addition, the vertical NOx concentration at the SNCR inlet on both sides presented a parabolic distribution but increased along height direction in the middle one. Particularly, some local areas with extremely high NOx concentration (over 2000 mg/m3) were captured near the inclined edge of SNCR inlets, which might be related to the potential reactions in tubes or local uneven combustion and is worthy of further study.
As a practical conclusion, the preliminary regulation of precise urea injection could save 15.7% of urea solution consumption based on the obtained two-dimensional NOx distributions. Follow-up work should be focused on three aspects: (1) the initial distribution of fuel particles over the bed or even without bed materials; (2) applications of the latest SNCR technologies in large-scale CFB boilers, such as new urea-based ammonia-releasing reduction agents from ERC Technik, Selective Cooling and TWIN-NOx® technologies from M&S, acoustic gas temperature measurement and advanced control systems; and (3) more comprehensive measurements in dilute phase zone to verify their relationship with gas distribution at the corresponding SNCR inlet, thus to predict the level of original NOx distribution and the subsequent SNCR process.

Author Contributions

Conceptualization, X.L. and J.Y.; investigation, J.Y., X.Z. and X.F.; methodology, X.L. and J.Y.; writing—original draft preparation, J.Y.; writing—review and editing, C.Z., Q.L. and J.W.; and validation, S.L. and C.Z. All authors have read and agreed to the published version of the manuscript.

Funding

This work was supported by the Scientific Research Start-up Foundation funding of High-level Introduction Talents of Nanjing Institute of Technology (Grants No. YKJ201962), the Prospective Project of Industry and University (Grants No. CXY202006) and the National Key Research & Development Program of China (No. 2016YFB0600201).

Institutional Review Board Statement

Not applicable.

Informed Consent Statement

Not applicable.

Data Availability Statement

No new data were created or analyzed in this study. Data sharing is not applicable to this article.

Acknowledgments

The authors are thankful to the stuff from Wu’an Power Plant for valuable support during the long-term field tests.

Conflicts of Interest

The authors declare no conflict of interest.

References

  1. Blaszczuk, A.; Nowak, W. Heat transfer behavior inside a furnace chamber of large-scale supercritical CFB reactor. Int. J. Heat Mass Tran. 2015, 87, 464–480. [Google Scholar] [CrossRef]
  2. Yue, G.X.; Cai, R.X.; Lyu, J.F.; Zhang, H. From a CFB reactor to a CFB boiler—The review of R&D progress of CFB coal combustion technology in China. Powder Technol. 2017, 316, 18–28. [Google Scholar]
  3. Blaszczuk, A.; Pogorzelec, M.; Shimizu, T. Heat transfer characteristics in a large-scale bubbling fluidized bed with immersed horizontal tube bundles. Energy 2018, 162, 10–19. [Google Scholar] [CrossRef]
  4. Chen, H.W.; Song, Y.F.; Yang, S.; Xin, Y. Prediction of particle circulation rate in an internally circulating fluidized bed with a central draft tube. Powder Technol. 2021, 380, 497–505. [Google Scholar] [CrossRef]
  5. Ji, J.Q.; Cheng, L.M.; Wei, Y.J.; Wang, J.F.; Gao, X.Y.; Fang, M.X.; Wang, Q.H. Predictions of NOx/N2O emissions from an ultra-supercritical CFB boiler using a 2-D comprehensive CFD combustion model. Particuology 2020, 49, 77–87. [Google Scholar] [CrossRef]
  6. Blaszczuk, A.; Nowak, W.; Jagodzik, S. Effects of operating conditions on deNOx system efficiency in supercritical circulating fluidized bed boiler. J. Power Technol. 2013, 93(1), 1–8. [Google Scholar]
  7. Ke, X.W.; Li, D.F.; Li, Y.R.; Jiang, L.; Cai, R.X.; Lyu, J.F.; Yang, H.R.; Zhang, M.; Jeon, C.H. 1-Dimensional modelling of in-situ desulphurization performance of a 550 MWe ultra-supercritical CFB boiler. Fuel 2021, 290, 120088. [Google Scholar] [CrossRef]
  8. Li, J.J.; Yang, H.R.; Wu, Y.X.; Lv, J.F.; Yue, G.X. Effects of the updated national emission regulation in China on circulating fluidized bed boilers and the solutions to meet them. Environ. Sci. Technol. 2013, 47, 6681–6687. [Google Scholar] [CrossRef]
  9. Ke, X.W.; Cai, R.X.; Zhang, M.; Miao, M.; Lyu, J.F.; Yang, H.R. Application of ultra-low NOx emission control for CFB boilers based on theoretical analysis and industrial practices. Fuel Process. Technol. 2018, 181, 252–258. [Google Scholar] [CrossRef]
  10. The Upgrade and Retrofitting Action Plan of Energy Saving and Emission Reduction for Coal-Fired Power Plants; National Development and Reform Commission: Beijing, China, 2014.
  11. Sirisomboon, K.; Charernporn, P. Effects of air staging on emission characteristics in a conical fluidized-bed combustor firing with sunflower shells. J. Energy Inst. 2017, 90, 316–323. [Google Scholar] [CrossRef]
  12. Misiulia, D.; Antonyuk, S.; Andersson, A.G.; Lundstrom, T.S. High-efficiency industrial cyclone separator: A CFD study. Powder Technol. 2020, 364, 943–953. [Google Scholar] [CrossRef]
  13. Liu, X.M.; Yang, H.R.; Lyu, J.F. Optimization of fluidization state of a circulating fluidized bed boiler for economical operation. Energies 2020, 13, 376. [Google Scholar] [CrossRef] [Green Version]
  14. Fang, D.D.; Zhang, L.H.; Duan, F.; Chyang, C.S.; Wang, Y.C. Combustion and pollutant emissions characteristics of Camellia oleifera shells in a vortexing fluidized-bed combustor. J. Energy Inst. 2020, 93, 739–751. [Google Scholar] [CrossRef]
  15. Ljungdahl, B.; Larfeldt, J. Optimised NH3 injection in CFB boilers. Powder Technol. 2001, 120, 55–62. [Google Scholar] [CrossRef]
  16. Kang, Z.Z.; Yuan, Q.X.; Zhao, L.Z.; Dai, Y.K.; Sun, B.M.; Wang, T. Study of the performance, simplification and characteristics of SNCR de-NOx in large-scale cyclone separator. Appl. Therm. Eng. 2017, 123, 635–645. [Google Scholar] [CrossRef]
  17. Yao, T.; Duan, Y.F.; Yang, Z.Z.; Li, Y.; Wang, L.W.; Zhu, C.; Zhou, Q.; Zhang, J.; She, M.; Liu, M. Experimental characterization of enhanced SNCR process with carbonaceous gas additives. Chemosphere 2017, 177, 149–156. [Google Scholar] [CrossRef] [PubMed]
  18. Rahman, Z.; Wang, X.B.; Zhang, J.Y.; Baleta, J.; Vujanovic, M.; Tan, H.Z. Kinetic study and optimization on SNCR process in pressurized oxy-combustion. J. Energy Inst. 2021, 94, 263–271. [Google Scholar] [CrossRef]
  19. Świeboda, T.; Krzyżyńska, R.; Bryszewska-Mazurek, A.; Mazurek, W.; Czapliński, T.; Przygoda, A. Advanced approach to modeling of pulverized coal boilers for SNCR process optimization—Review and recommendations. Int. J. Thermofluid. 2020, 7–8, 100051. [Google Scholar] [CrossRef]
  20. Yan, J.; Lu, X.F.; Wang, Q.H.; Kang, Y.H.; Li, J.B.; Zhou, J.; Zhang, Y.; Lv, Z.; Sicong, S. Experimental and numerical study on air flow uniformity in the isobaric windbox of a 600 MW supercritical CFB boiler. Appl. Therm. Eng. 2017, 122, 311–321. [Google Scholar] [CrossRef]
  21. Zheng, W.J.; Zhang, M.; Zhang, Y.; Lyu, J.F.; Yang, H.R. The effect of the secondary air injection on the gas–solid flow characteristics in the circulating fluidized bed. Chem. Eng. Res. Des. 2019, 141, 220–228. [Google Scholar] [CrossRef]
  22. Yan, J.; Lu, X.F.; Zheng, X.; Xue, R.; Lei, X.J.; Fan, X.C.; Liu, S.R. Experimental investigations on lateral dispersion coefficients of fuel particles in large-scale circulating fluidized bed boilers with different coal feeding modes. Energies 2020, 13, 6336. [Google Scholar] [CrossRef]
  23. Ma, S.X.; Chang, W.M.; Zhang, J.C.; Luo, D.L. Optimizing calculation of particle size distribution of feeding coal for circulating fluidized bed boiler. Appl. Therm. Eng. 2015, 87, 463–470. [Google Scholar] [CrossRef]
  24. Yan, J.; Lu, X.F.; Song, Y.F.; Zheng, X.; Lei, X.J.; Liu, Z.; Fan, X.C.; Liu, C.C. A comprehensive understanding of the non-uniform characteristics and regulation mechanism of six external loops in a 600 MW supercritical CFB boiler. Energy 2021, 120032, in press. [Google Scholar] [CrossRef]
  25. Yuan, Z.W.; Meng, L.; Gu, X.B.; Bai, Y.Y.; Cui, H.M.; Jiang, C.Y. Prediction of NOx emissions for coal-fired power plants with stacked-generalization ensemble method. Fuel 2021, 289, 119748. [Google Scholar] [CrossRef]
  26. Zhou, G.Y.; Jin, B.S. Ammonia injection method for SCR based on non-uniform inlet condition. J. Huazhong Univ. Sci. Tech. 2016, 44, 121–126. [Google Scholar] [CrossRef]
  27. Liu, G.F.; Zhang, Y.; Shen, D.K.; Yuan, B.; Li, R.; Sun, Y. Anticipatory NH3 injection control for SCR system based on the prediction of the inlet NOx concentration. J. Energy Inst. 2021, 94, 167–175. [Google Scholar] [CrossRef]
  28. Niklasson, F.; Johnsson, F.; Leckner, B. Locao air ratio measured by zirconia cell in a circulating fluidised bed furnace. Chem. Eng. J. 2003, 96, 145–155. [Google Scholar] [CrossRef]
  29. Hartge, E.-U.; Fehr, M.; Werther, J.; Ochodek, T.; Noskievic, P.; Krzin, I.; Kallner, P.; Gadowski, J. Gas concentration measurements in the combustion chamber of the 235 MWe circulating fluidized bed boiler Turow no 3. In Proceedings of the 18th International Conference on Fluidized Bed Combustion, Toronto, ON, Canada, 22–25 May 2005. [Google Scholar]
  30. Yan, J.; Lu, X.F.; Wang, Q.H.; Kang, Y.H.; Li, J.B.; Xu, Z.; Lei, X.; Zheng, X.; Fan, X.; Liu, Z. Study on the influence of secondary air on the distributions of flue gas composition at the lower part of a 600 MW supercritical CFB boiler. Fuel Process. Technol. 2019, 196, 106035. [Google Scholar] [CrossRef]
  31. Werther, J.; Hartge, E.-U.; Ratschow, L.; Wischnewski, R. Simulation-supported measurements in large circulating fluidized bed combustors. Particuology 2009, 7, 324–331. [Google Scholar] [CrossRef]
  32. Lu, J.Y.; Lu, X.F.; He, H.H.; Wang, H.; Gan, L.; Zhao, P.; Tang, X.N. Combustion characteristics of the external circulation loop on Baima’s 300 MWe circulating fluidized bed boiler. Energy Fuel 2011, 25, 3456–3464. [Google Scholar] [CrossRef]
  33. Yan, J.; Lu, X.F.; Xue, R.; Lu, J.Y.; Zheng, Y.; Zhang, Y.; Liu, Z. Validation and application of CPFD model in simulating gas-solid flow and combustion of a supercritical CFB boiler with improved inlet boundary conditions. Fuel Process. Technol. 2020, 208, 106512. [Google Scholar] [CrossRef]
  34. Vodička, M.; Hrdlička, J.; Skopec, P. Experimental study of the NOx reduction through the staged oxygen supply in the oxy-fuel combustion in a 30 kWth bubbling fluidized bed. Fuel 2021, 286, 119343. [Google Scholar] [CrossRef]
  35. Song, G.L.; Yang, X.T.; Yang, Z.; Xiao, Y. Experimental study on ultra-low initial NOx emission characteristics of Shenmu coal and char in a high temperature CFB with post-combustion. J. Energy Inst. 2021, 94, 310–318. [Google Scholar] [CrossRef]
  36. Guo, Q.; Wang, Q.H.; Lu, X.F.; Li, J.B.; Xu, J. Numerical study on gas flow characteristics in three parallel separators of a large-scale CFB boiler. Proc. CSEE 2019, 39, 3851–3858. [Google Scholar]
  37. Wang, W. Numerical Simulation of the SNCR Denitration Process in a Circulating Fluidized Bed; Southeast University: Nanjing, China, 2016. [Google Scholar]
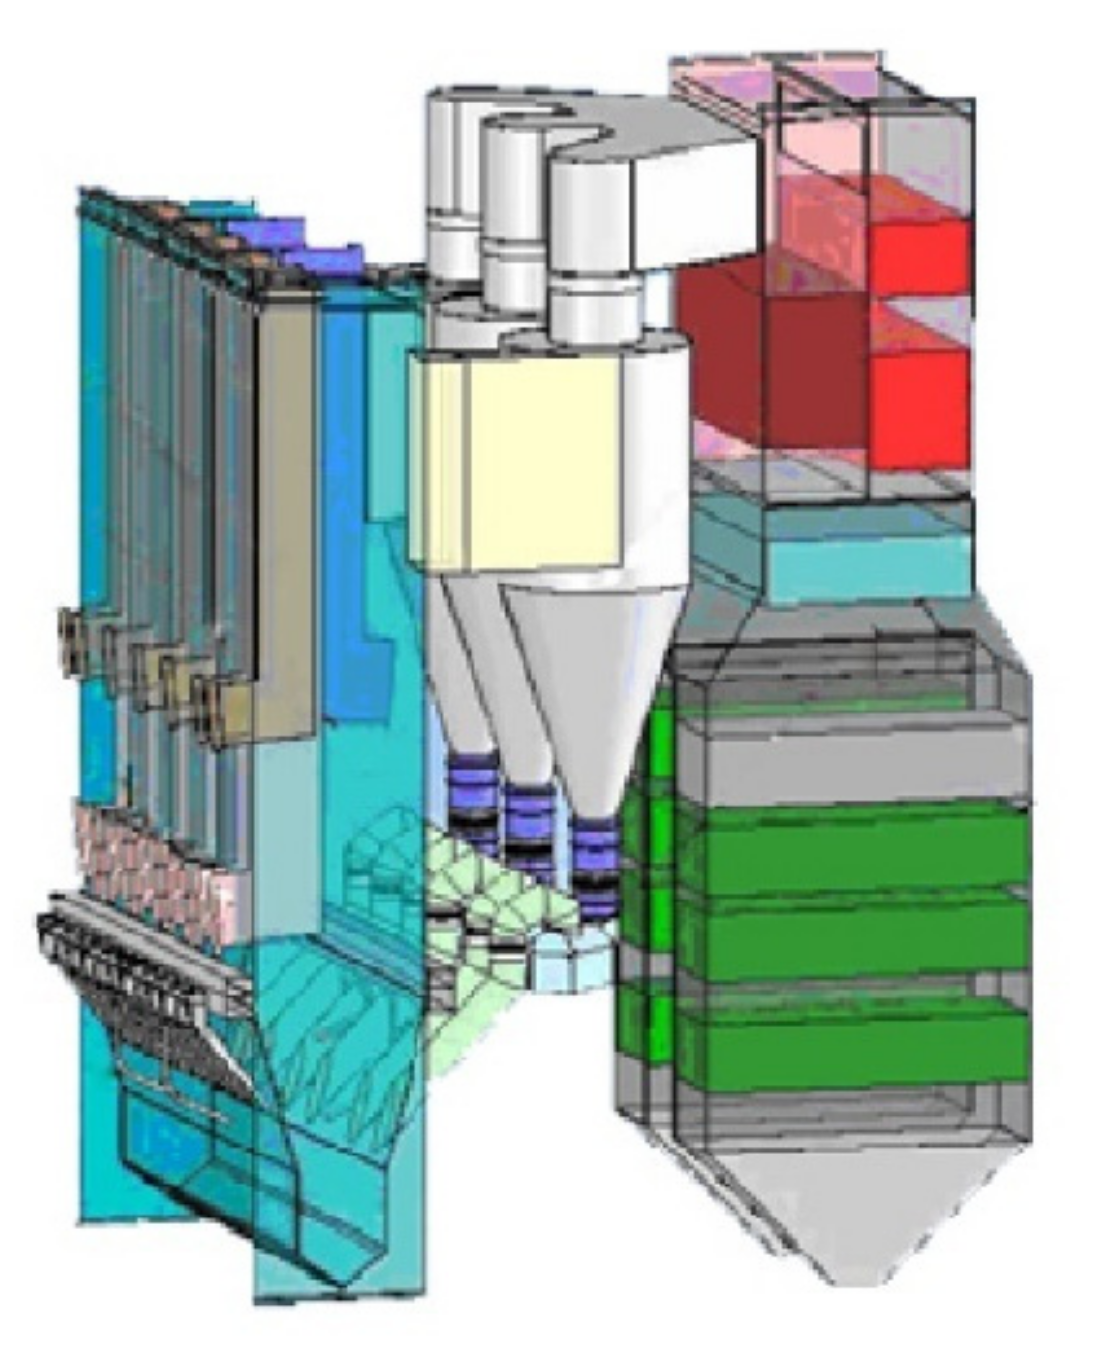
Figure 1. Schematic diagram of the 300 MW CFB boiler.
Energies 14 01267 g001
Figure 2. Positions of the vertical measurement ports of the three SNCR inlets: (a) top view; and (b) side view.
Energies 14 01267 g002
Figure 3. Positions of the horizontal measurement ports in the dilute phase: (a) view from the side wall; and (b) view from the front wall.
Energies 14 01267 g003
Figure 4. Detailed positions of the urea pray guns/horizontal measurement ports at SNCR inlets: (a) view from the straight edge; and (b) view from the inclined edge.
Energies 14 01267 g004
Figure 5. Vertical distributions of flue gas composition at the #A SNCR inlet.
Energies 14 01267 g005
Figure 6. Horizontal distributions of flue gas composition at the dilute phase zone corresponding to the #A SNCR inlet.
Energies 14 01267 g006
Figure 7. Vertical distributions of flue gas composition at the #B SNCR inlet.
Energies 14 01267 g007
Figure 8. Fuel distributions during the measurement of at different ports.
Energies 14 01267 g008
Figure 9. Vertical distributions of flue gas composition at the #C SNCR inlet.
Energies 14 01267 g009
Figure 10. Horizontal distributions of NOx concentration at the different heights of the #A and #C SNCR inlets.
Energies 14 01267 g010
Figure 11. Horizontal distributions of NOx concentration at the different heights of the #B SNCR inlet.
Energies 14 01267 g011
Table 1. Design parameters of the 300 MW CFB boiler.
ItemUnitValue (BMCR)
Superheat steam flow ratet/h1100
Superheated steam pressureMPa17.4
Superheated steam temperature°C541
Reheat steam pressureMPa3.87
Reheat steam temperature°C541
Water feed temperature°C282
Table 2. Information of the two gas analyzers used in the test.
ItemSensor TypeRangePrecision (Based on Measured Values)
Ecom-J2KN type analyzer
O2Electrochemical0–21%0.2%
CO1Electrochemical0–10,000 ppm5%
NOElectrochemical0–5000 ppm5%
NO2Electrochemical0–1000 ppm5%
SO2Electrochemical0–5000 ppm5%
Testo 350 type analyzer
O2Electrochemical0–25%0.8%
CO1Electrochemical0–10,000 ppm10%
NOElectrochemical0–4000 ppm5%
NO2Electrochemical0–500 ppm5%
SO22Electrochemical0–5000 ppm5%
1 CO sensors contain H2 compensation. 2 Anti-interference of CO up to 10,000 ppm.
Table 3. Main operating parameters of the boiler during the tests of the dilute phase and the vertical measurement ports at SNCR inlets (Y-vertical direction)
ItemUnitDilute Phase#A-Y#B-Y#C-Y
LoadMW270270266268
Coal feed ratet/h151151146150
PA flow ratekNm3/h507507487499
SA flow ratekNm3/h310310299302
Bed pressurekPa7.417.437.687.69
Bed temperature°C918920930937
Cyclone inlet temperature°C932931984975
Cyclone outlet temperature°C882882942933
Economizer O2Vol.-%3.933.934.174.06
Table 4. Main operating parameters of the boiler during the tests of the horizontal measurement ports at SNCR inlets (X-horizontal direction).
ItemUnit#A-X#B-X#C-X
LoadMW280279264
Coal feed ratet/h170162136
PA flow ratekNm3/h532539458
SA flow ratekNm3/h319318287
Bed pressurekPa8.128.217.54
Bed temperature°C936955933
Cyclone inlet temperature°C932962952
Cyclone outlet temperature°C898914940
O2Vol.-%4.264.153.78
Table 5. Proximate and ultimate analysis of the feeding coal during the tests.
CoalValue
Proximate analysis (wt%, air dry basis)
Ash42.33
Fixed carbon49.22
Moisture8.8
Volatiles8.45
Lower heating value (MJ/kg)16.31
Ultimate analysis (wt%, air dry basis)
C52.28
H2.69
O1.51
N0.52
Stotal0.67
Table 6. Main operating parameters of SNCR process during urea optimization.
ItemUnitBefore OptimizationAfter Optimization
Urea solution flowrate in #Am3/h2.8002.535
Urea solution flowrate in #Bm3/h2.6941.982
Urea solution flowrate in #Cm3/h2.6012.307
NH3 escapeppm8.39/
Stack NOx emissionmg/m344.9347.49
O2%6.296.06
Publisher’s Note: MDPI stays neutral with regard to jurisdictional claims in published maps and institutional affiliations.