Parametric Study on the Adjustability of the Syngas Composition by Sorption-Enhanced Gasification in a Dual-Fluidized Bed Pilot Plant


Abstract
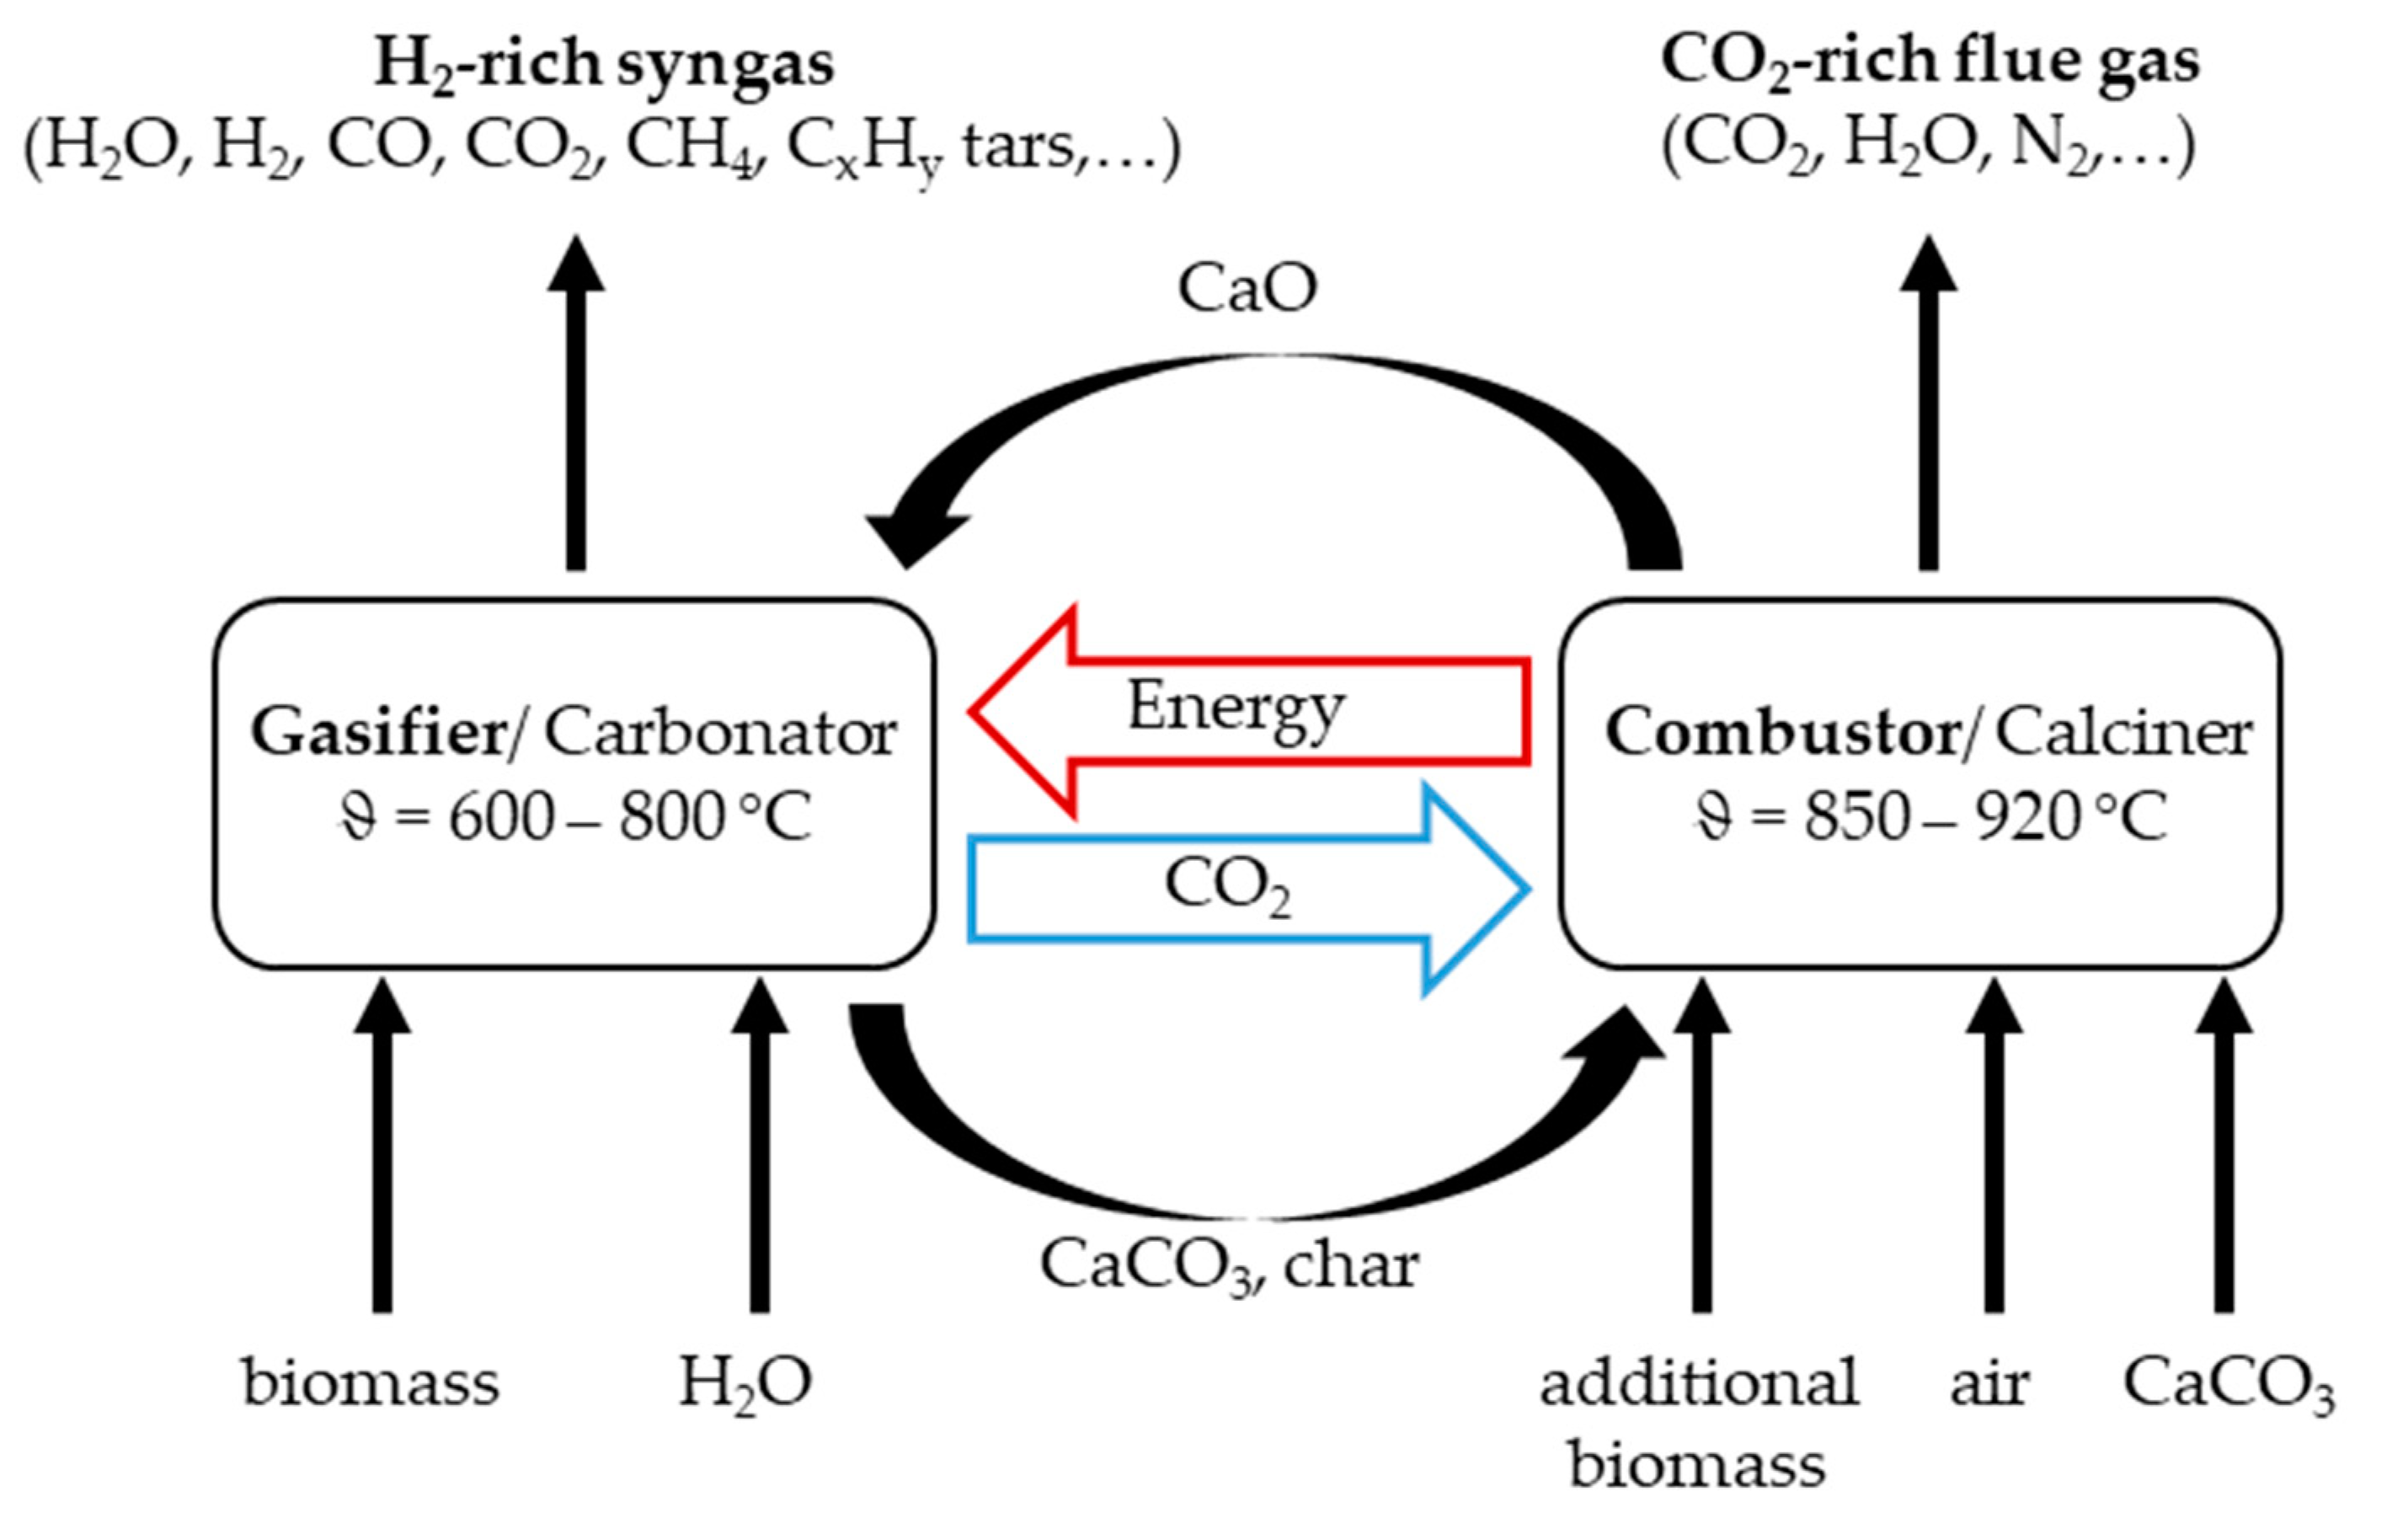
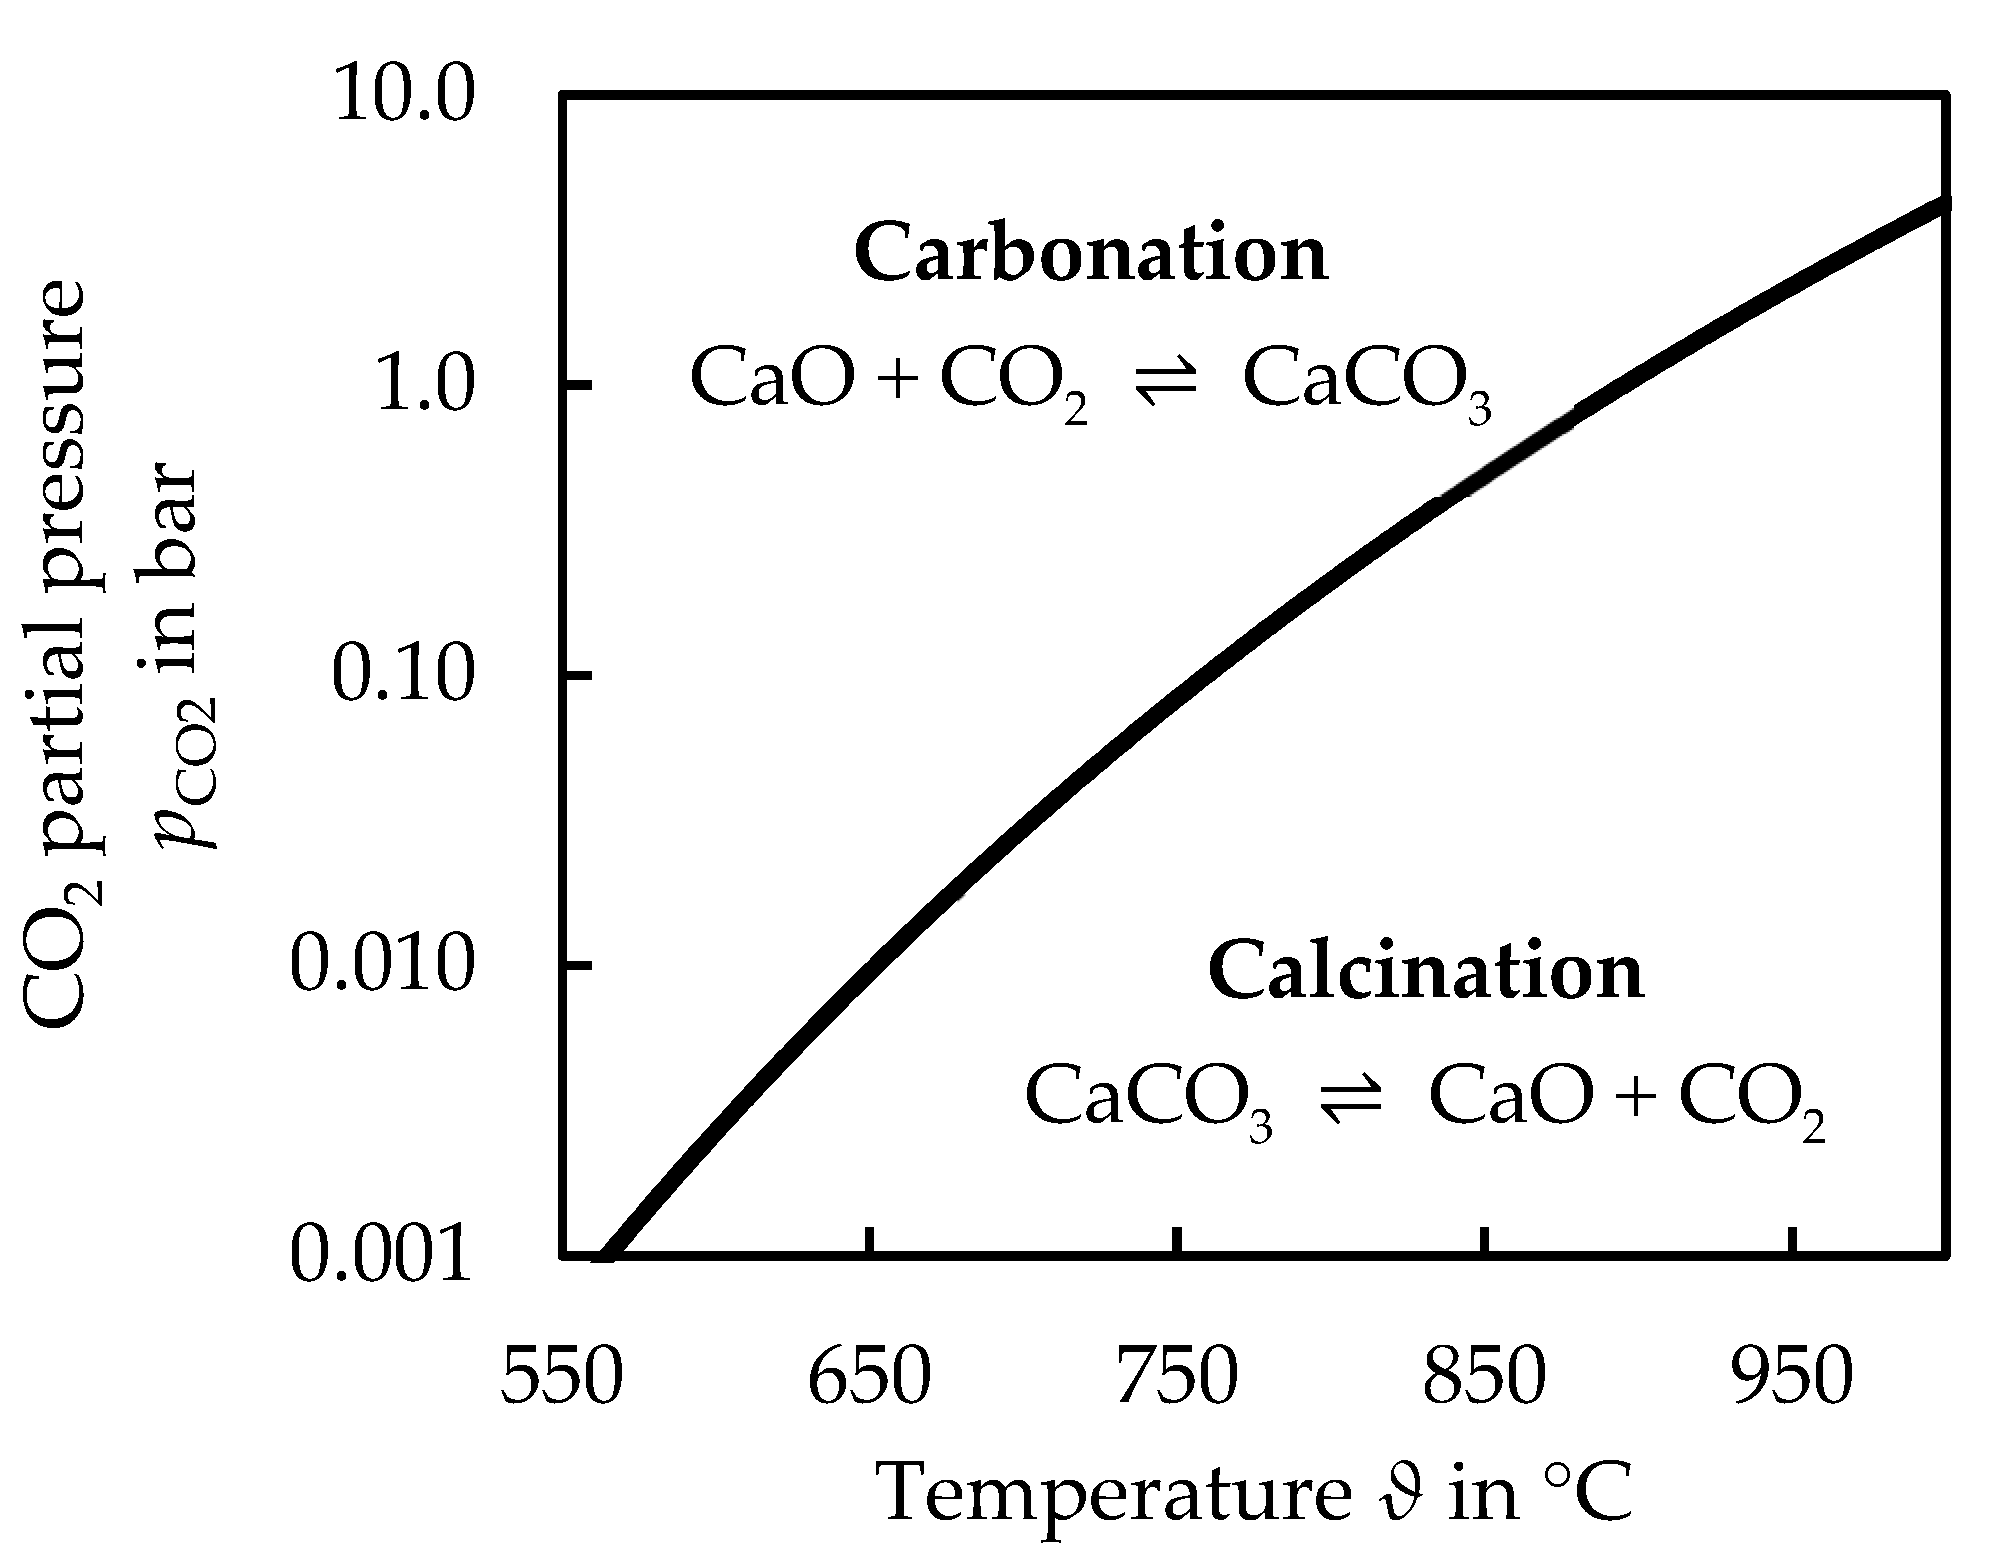
1. Introduction
2. Materials and Methods
2.1. Description of the Facility and Measurement Techniques
2.2. Experimental Procedure and Materials
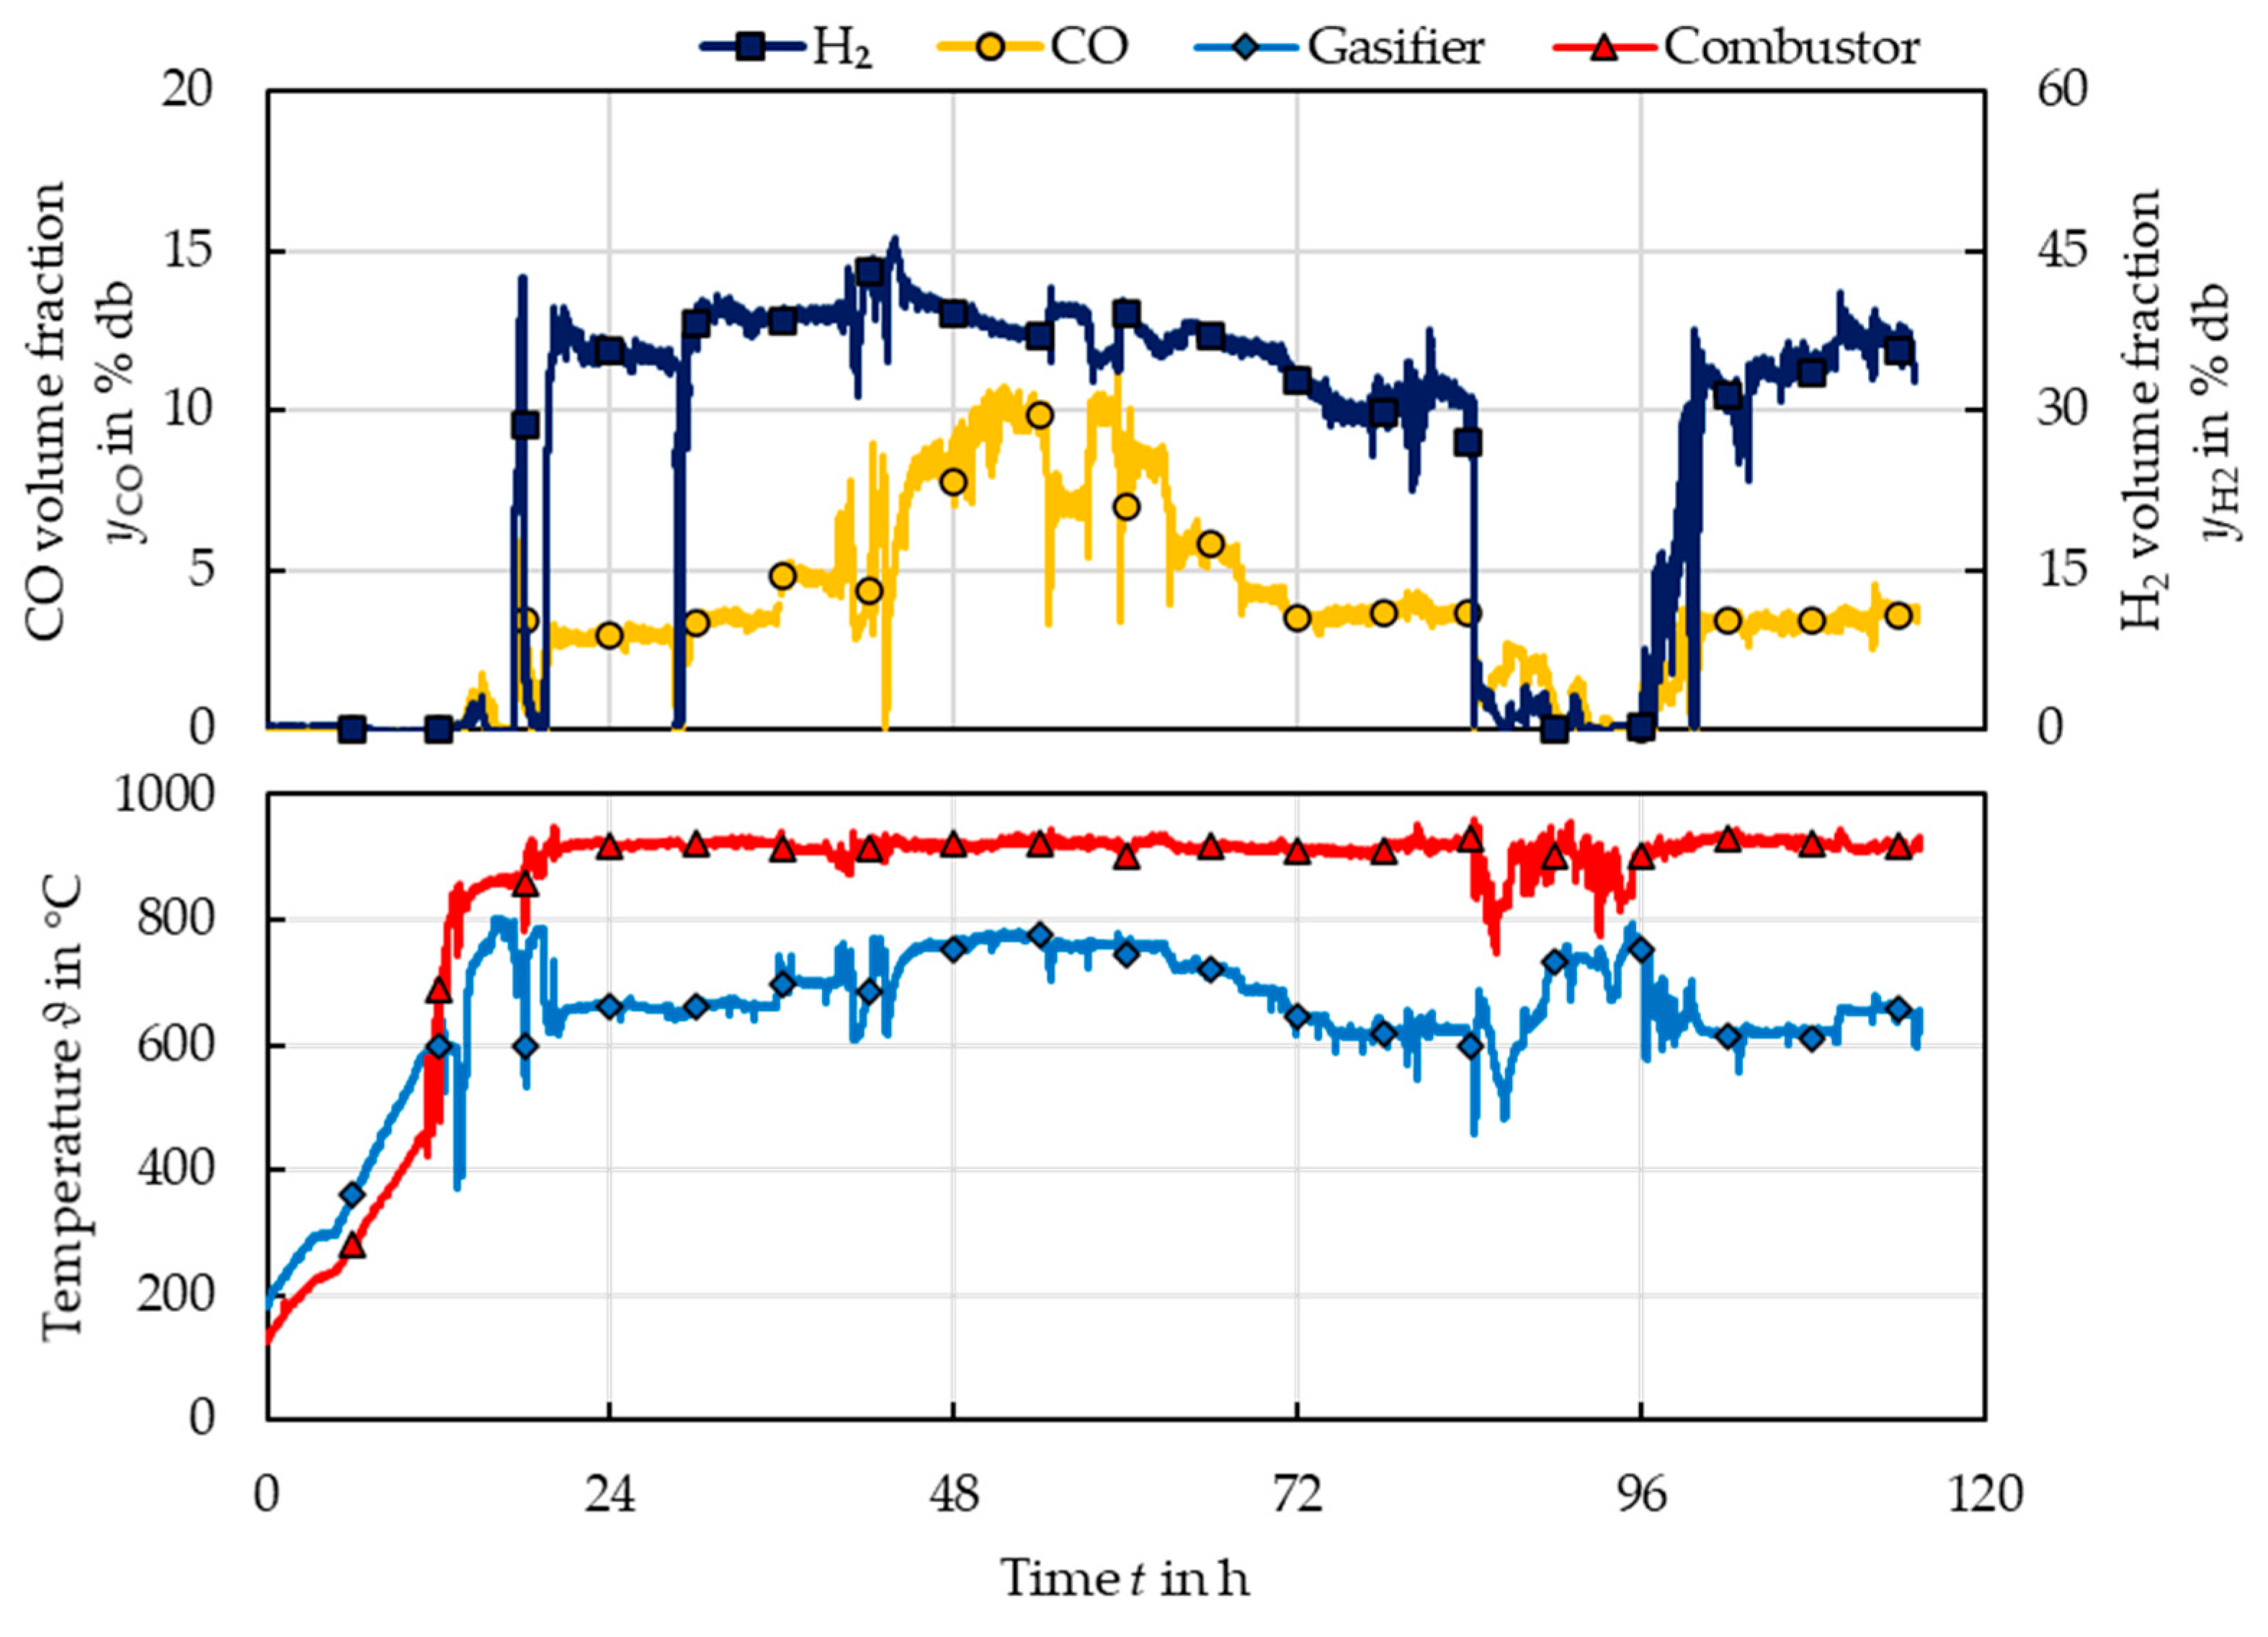
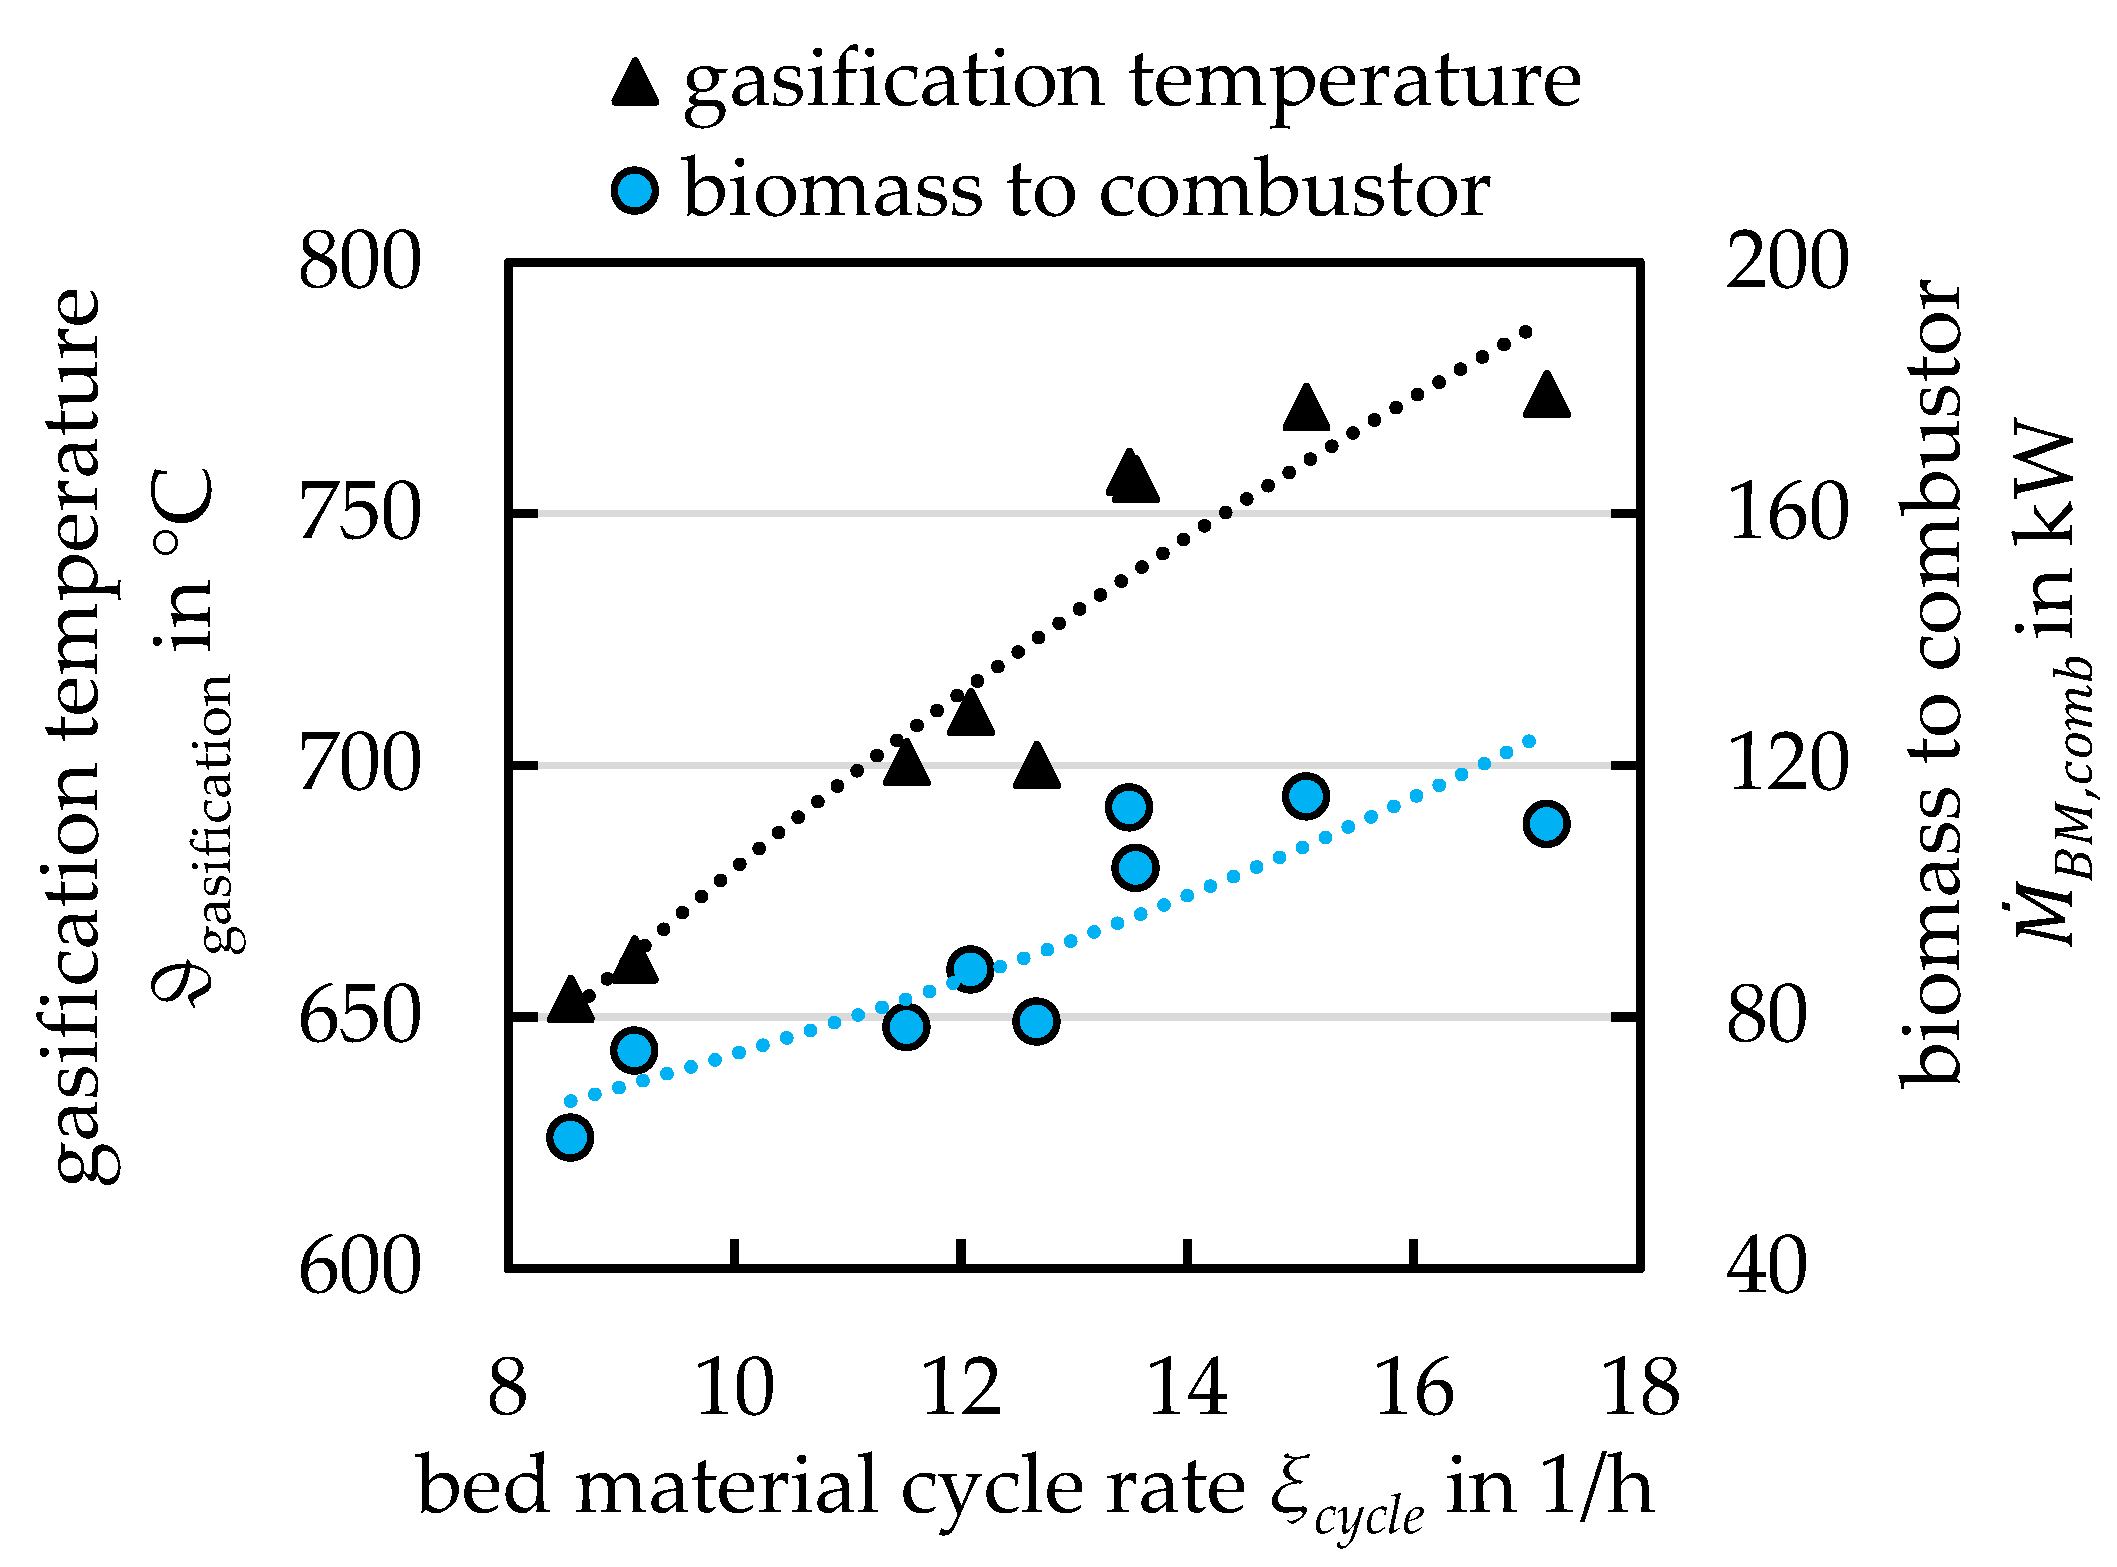
3. Results and Discussion
3.1. Permanent Gases and Lower Hydrocarbons
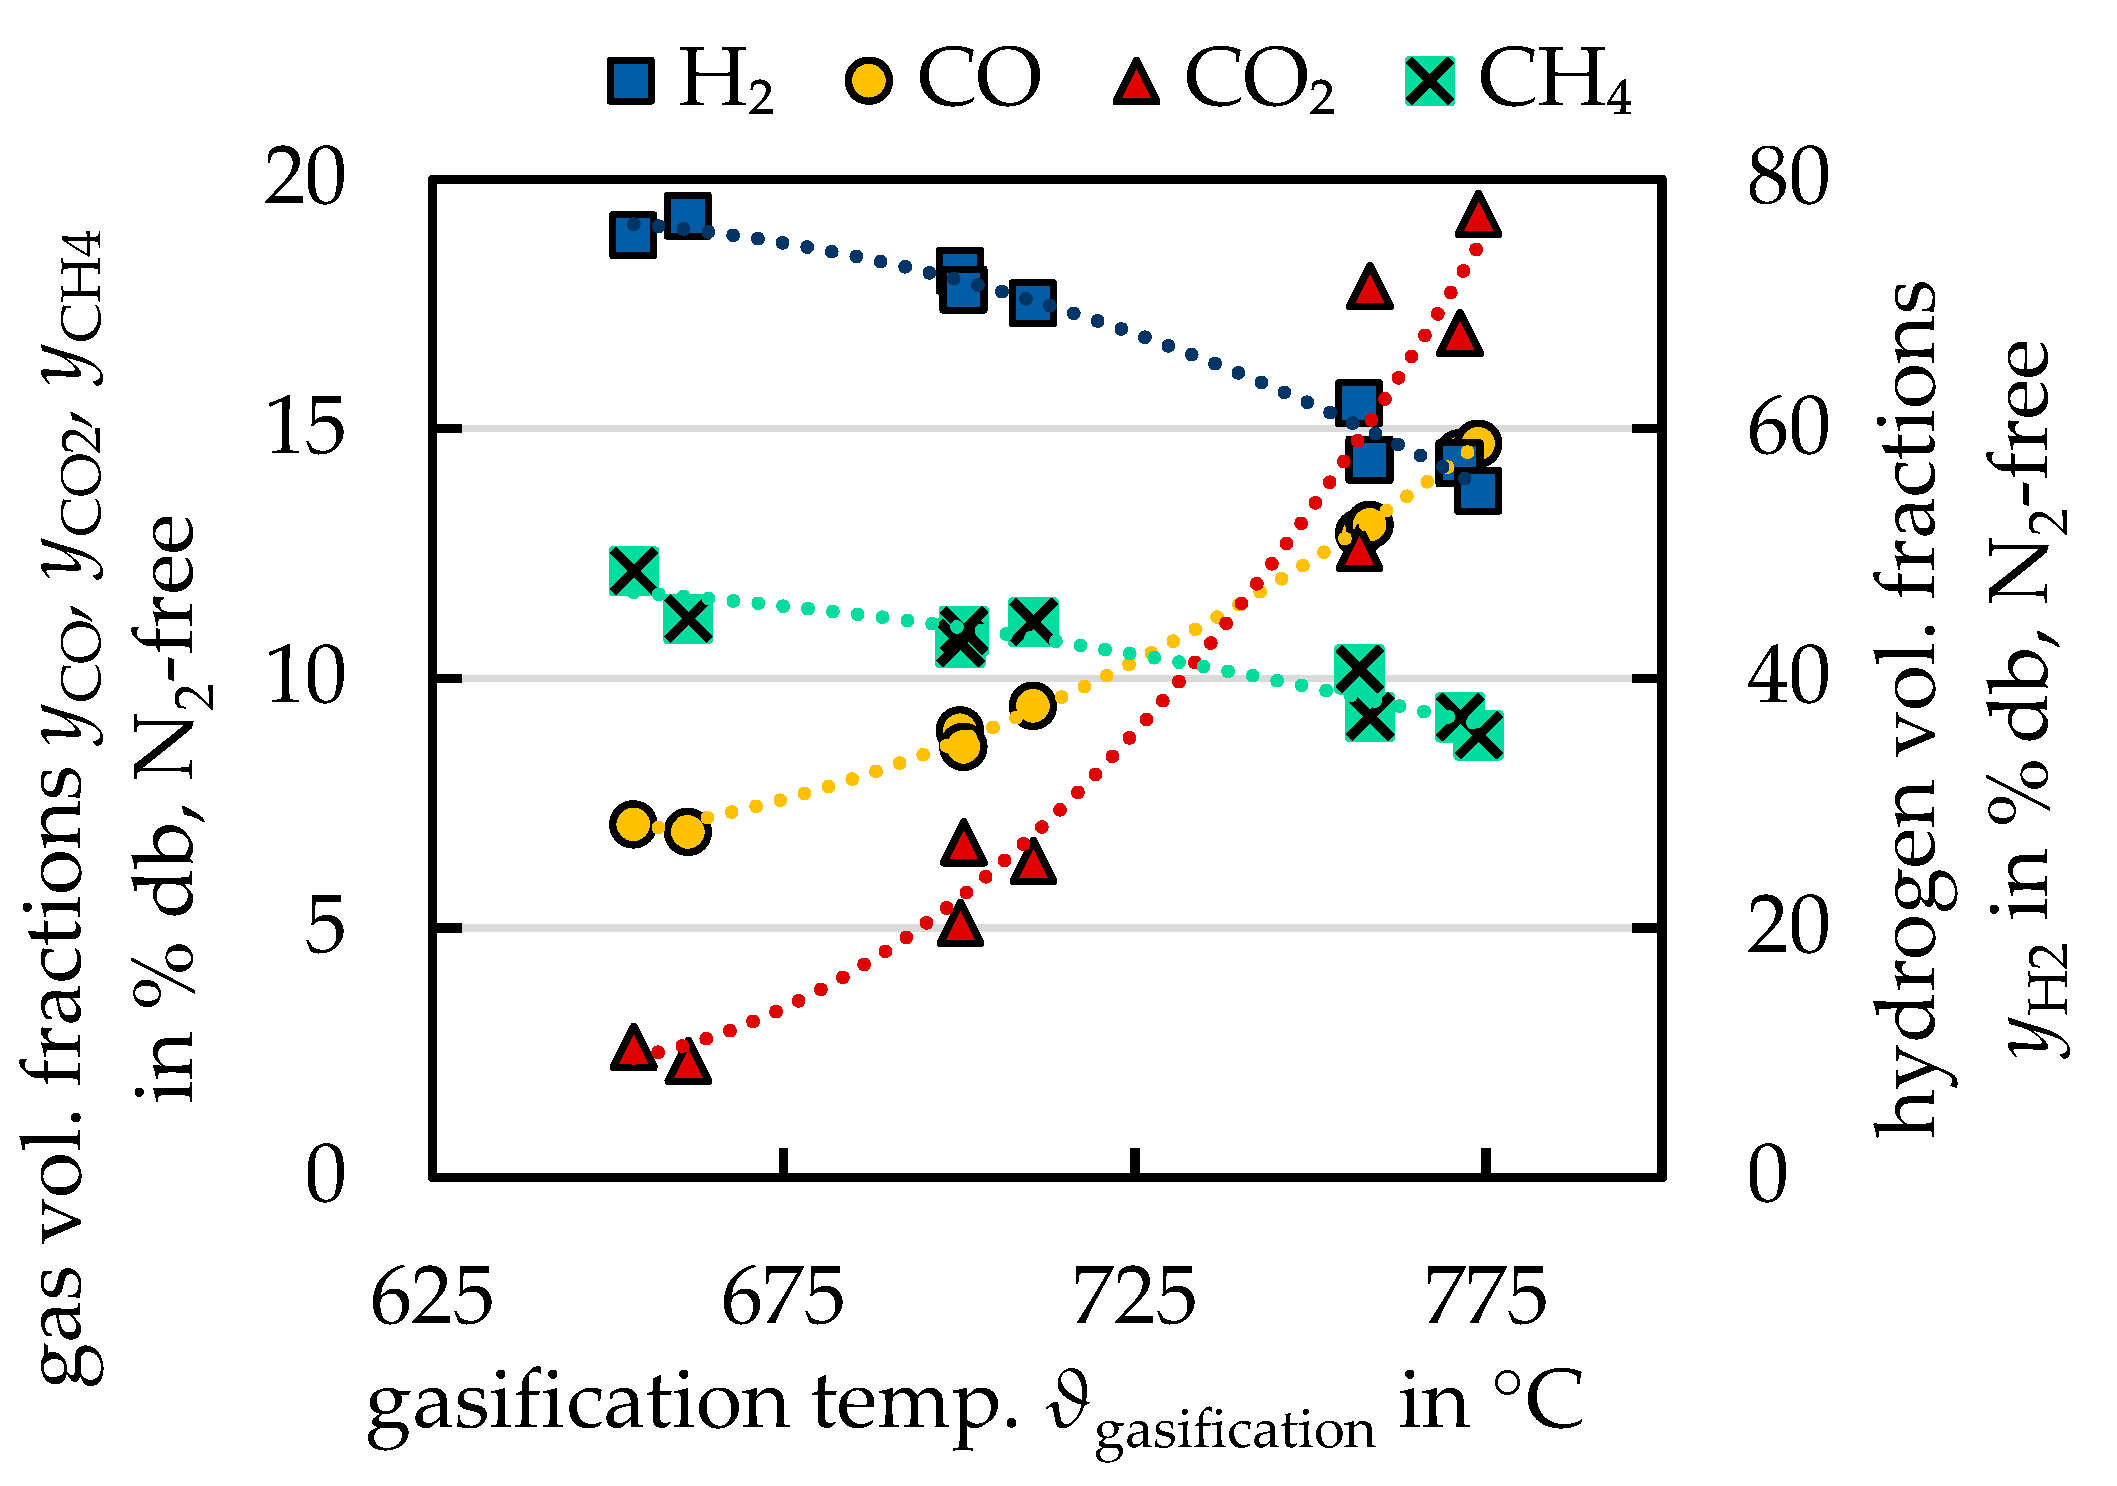
3.1.1. Influence of the Gasification Temperature
3.1.2. Influence of the Steam to Carbon Ratio
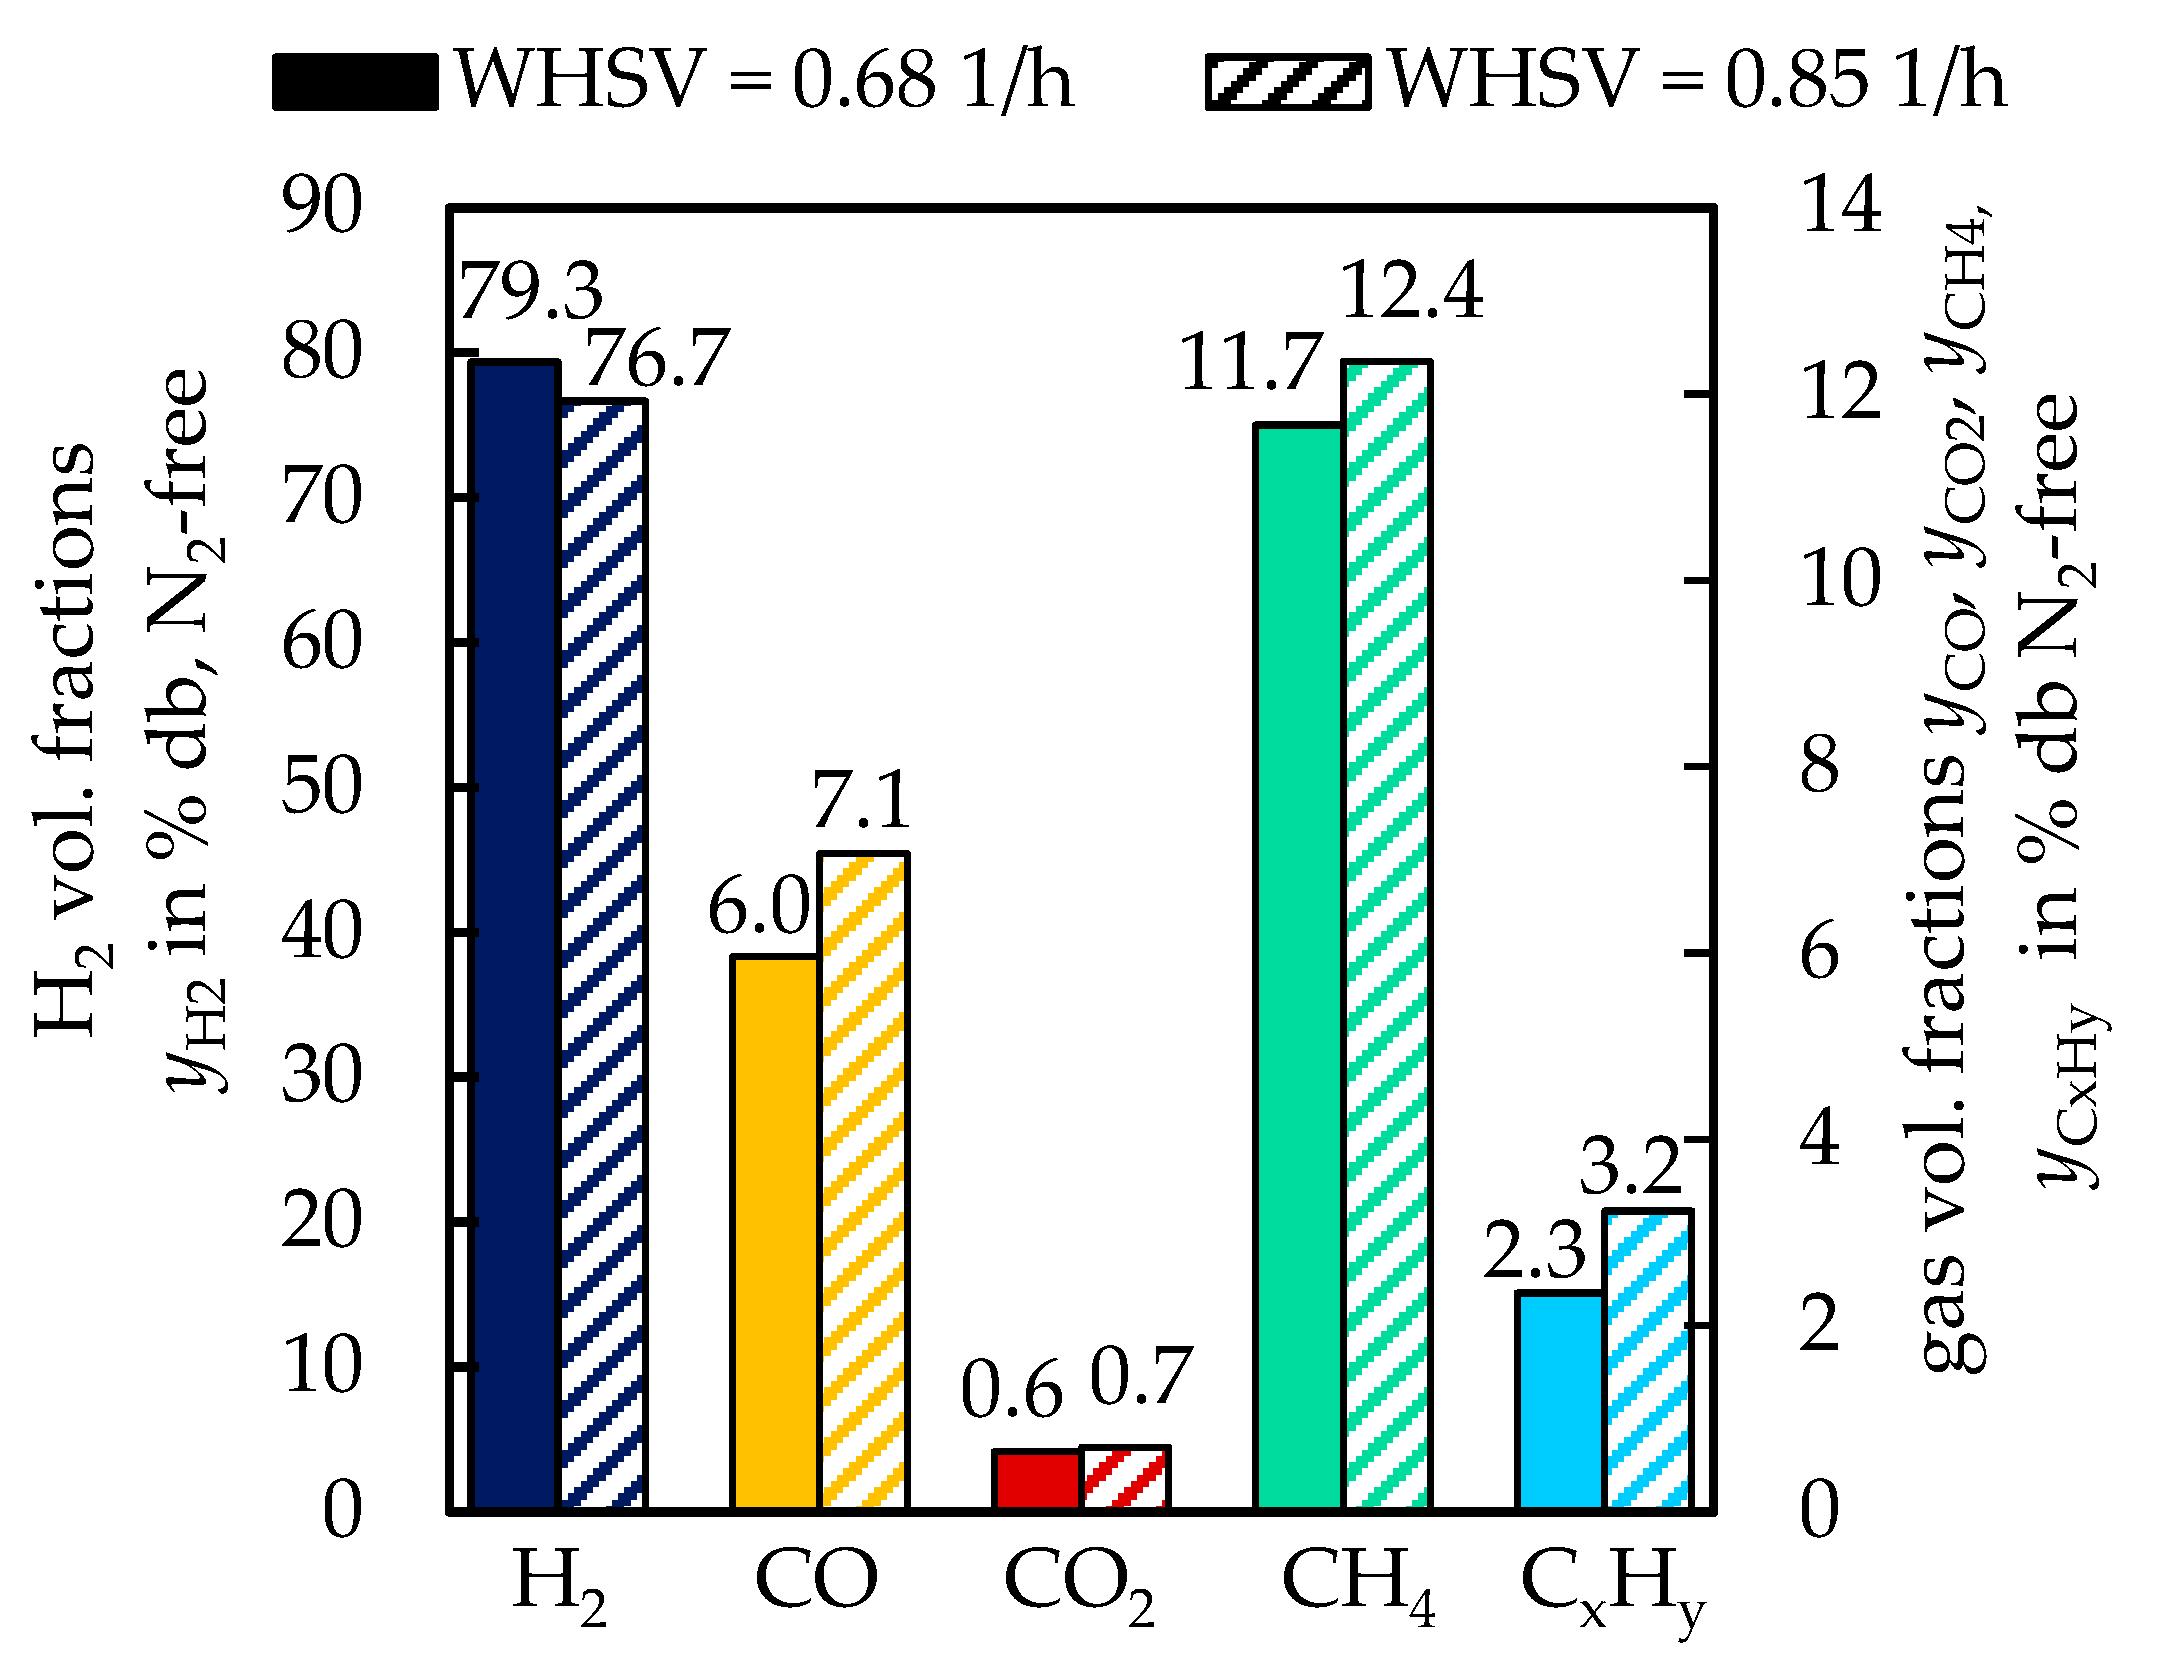
3.1.3. Influence of the Weight Hourly Space Velocity
3.2. Tars
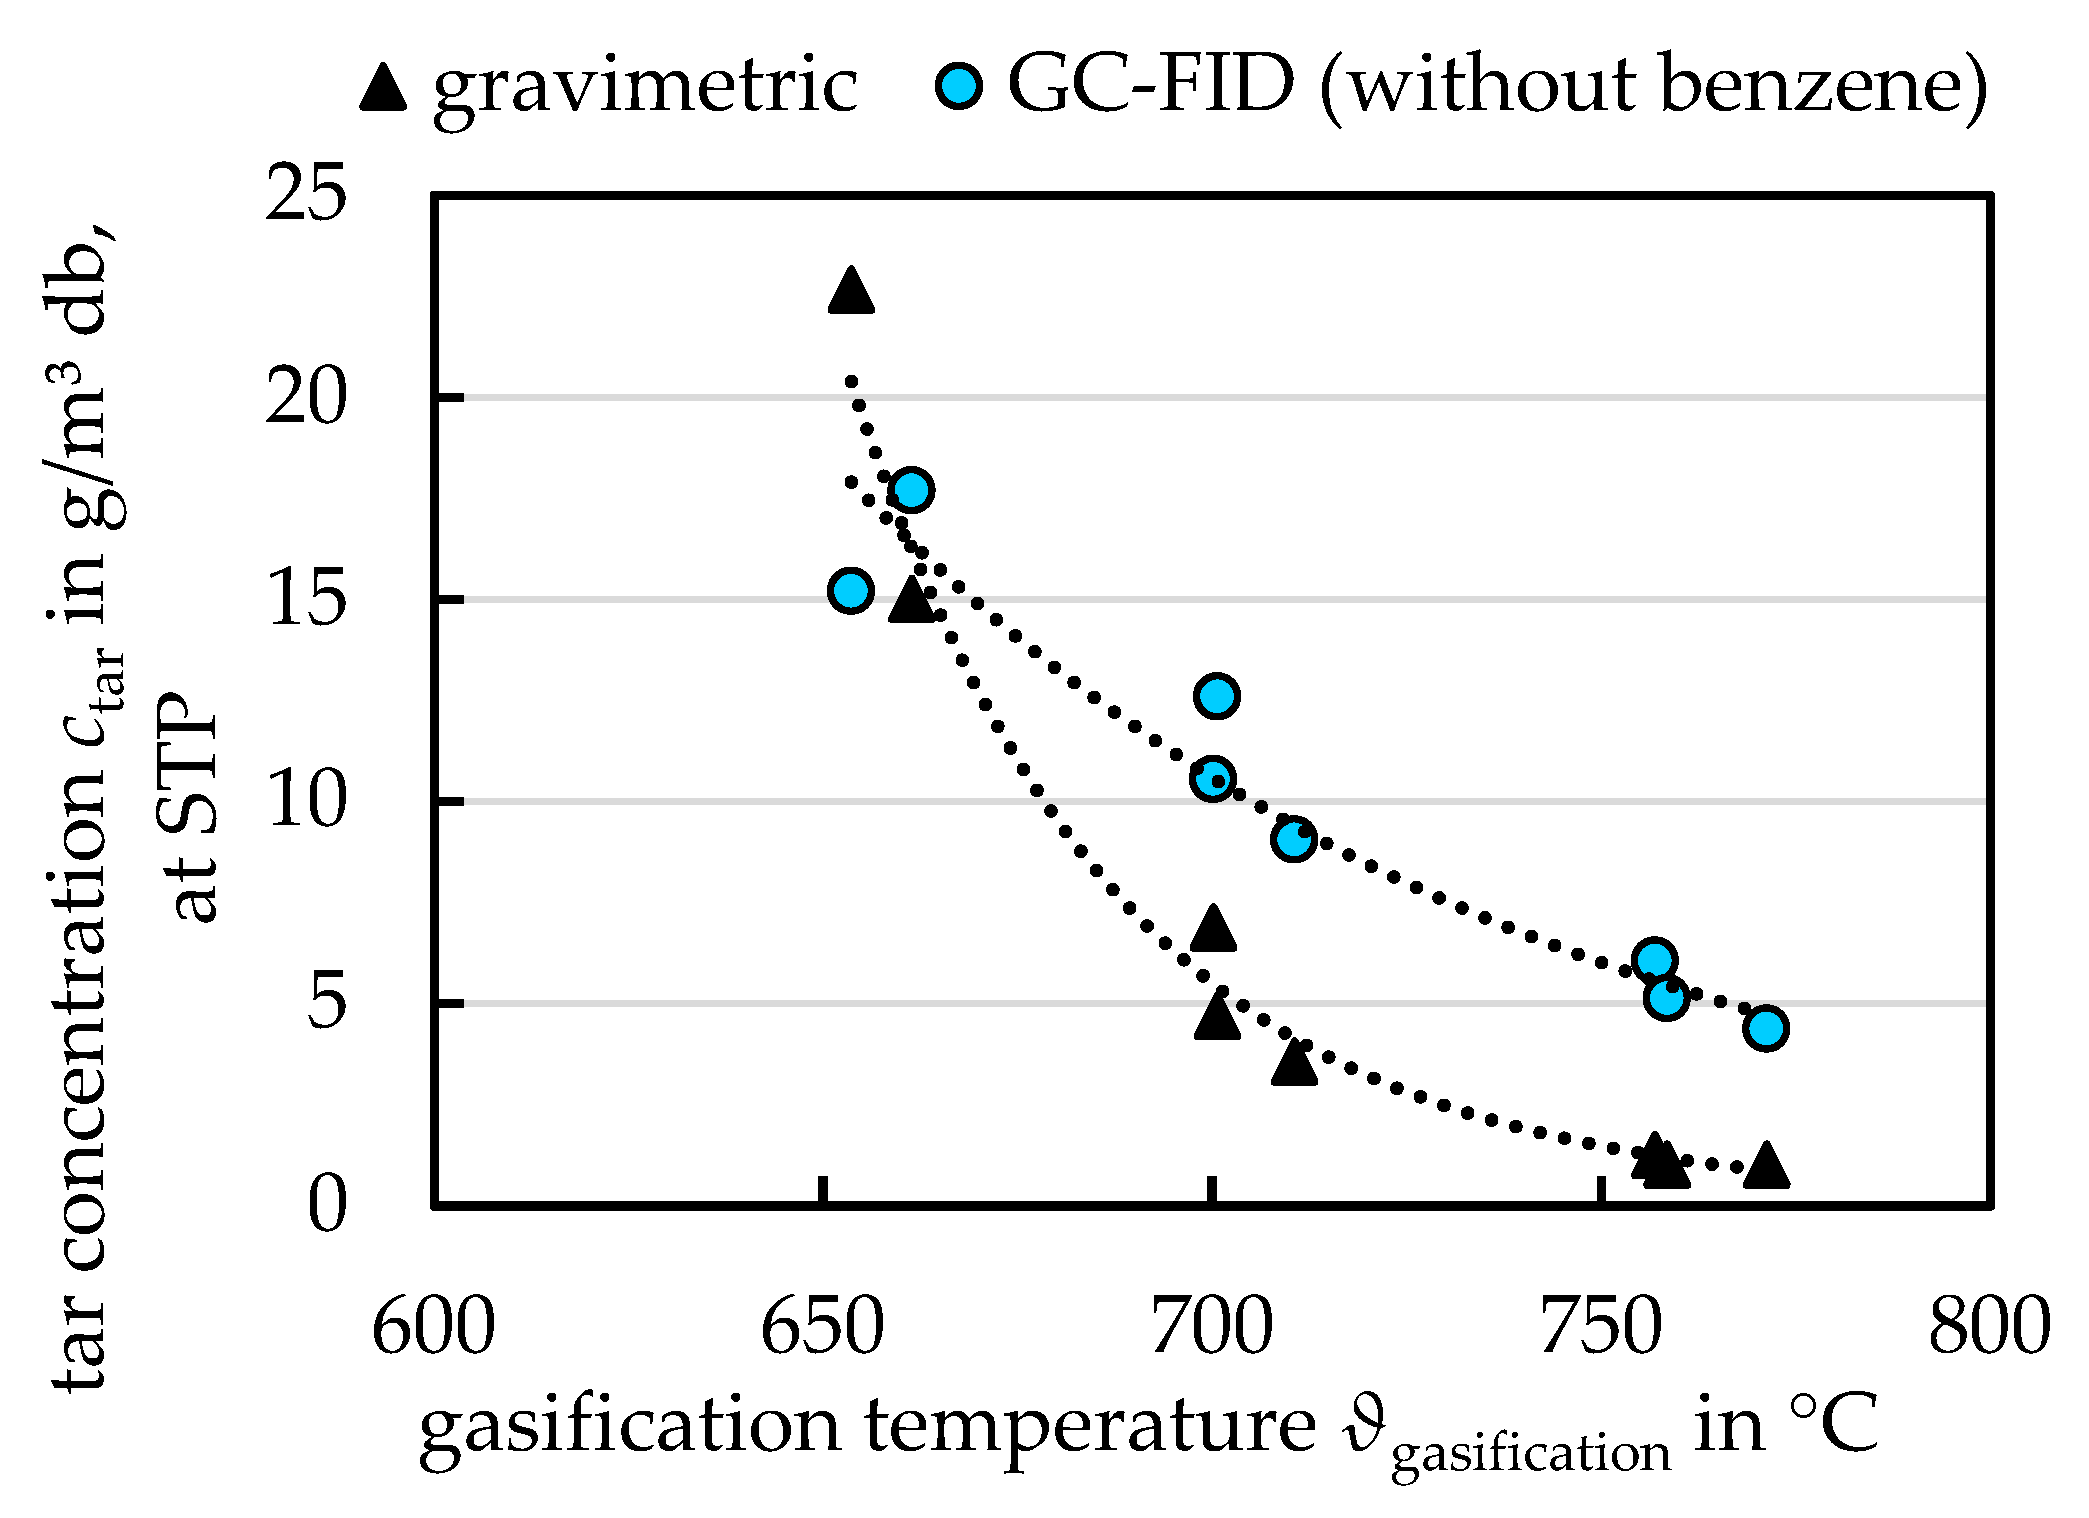
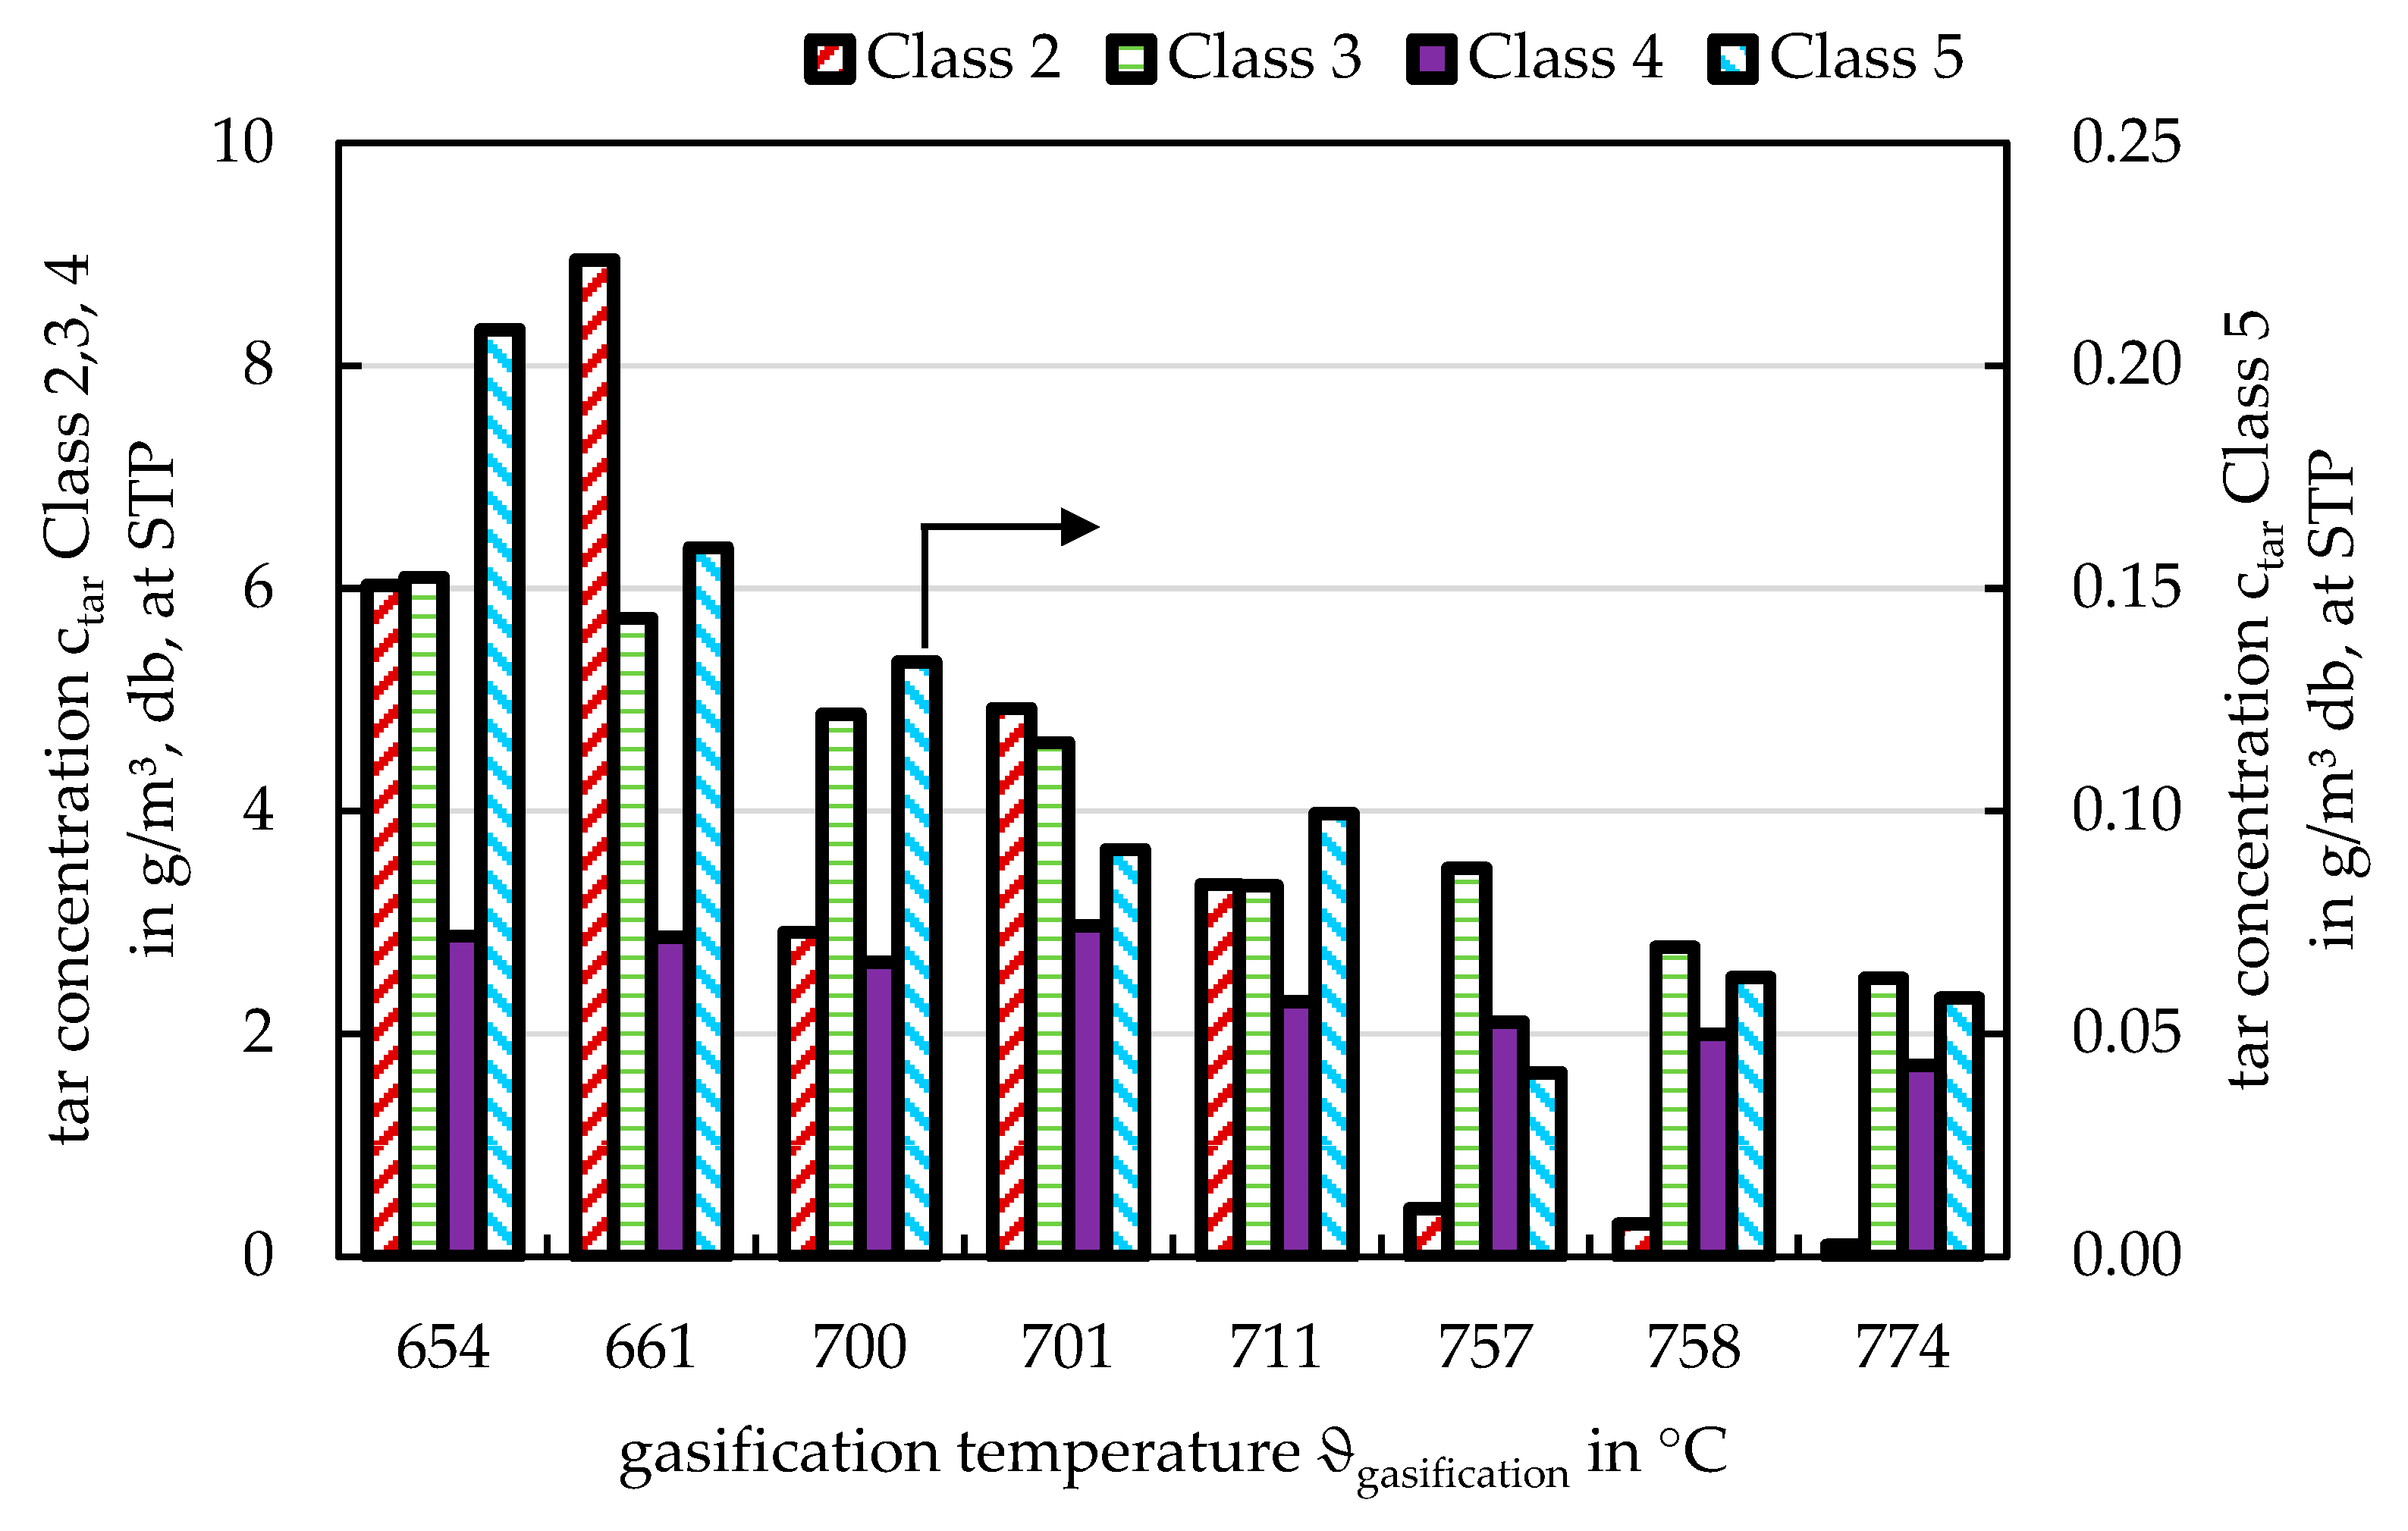
3.2.1. Influence of the Gasification Temperature
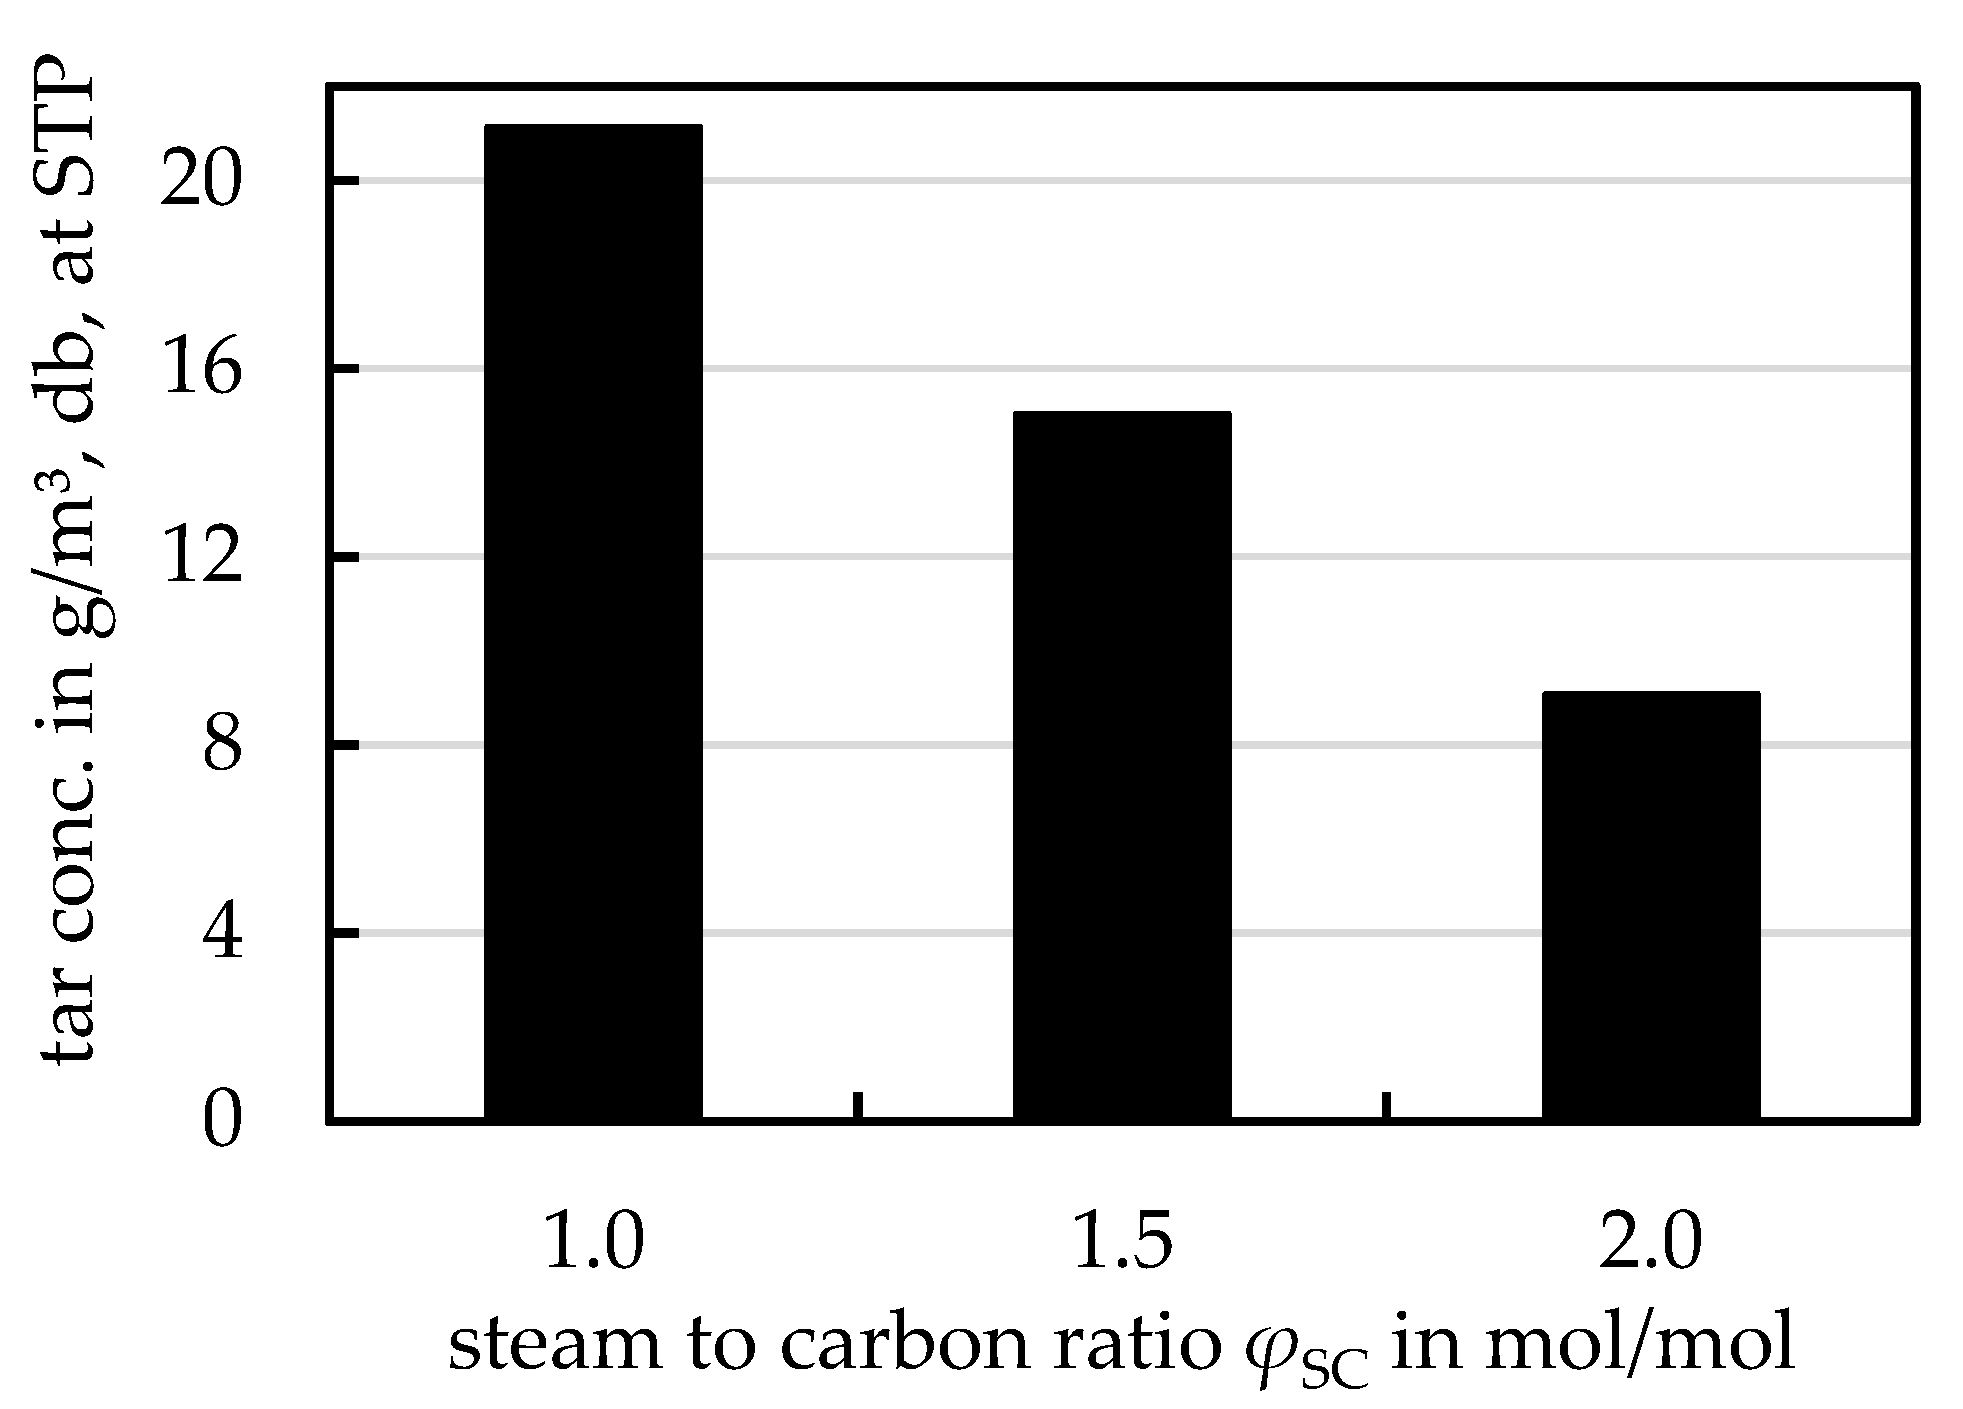
3.2.2. Influence of the Steam to Carbon Ratio
4. Conclusions
Author Contributions
Funding

Data Availability Statement
Acknowledgments
Conflicts of Interest
Abbreviations
| ar | as received |
| BFB | bubbling fluidized bed |
| BM | biomass |
| CCS | carbon capture and storage |
| CFB | circulating fluidized bed |
| DFB | dual fluidized bed |
| DME | dimethyl ether |
| ECN | Energy research Center of the Netherlands |
| FC | fixed carbon |
| FT | Fischer–Tropsch |
| GC-FID | gas chromatography and flame ionization detector |
| GHG | greenhouse gas |
| MeOH | methanol |
| NDIR | nondispersive infrared sensor |
| S/C | steam to carbon |
| SEG | sorption enhanced gasification |
| SNG | synthetic natural gas |
| STP | standard temperature and pressure (0 °C and 1013 mbar) |
| V | volatiles |
| waf | water and ash free |
| wf | water free |
| WGS | water-gas-shift |
| WHSV | weight hourly space velocity |
Symbols
| ctar | g/m³ | tar mass in dry and N2-free gas at STP |
| Hu | kJ/kg | net calorific value |
| kg/s | mass flow | |
| M | kg | mass |
| mol/s | mole flow | |
| p | Pa | pressure |
| xi | wt.% | mass fraction of component i |
| yi | vol.% | gas volume fraction of component i |
| γi | wt.% | fuel mass fraction of component i |
| kJ/mol | specific reaction enthalpy | |
| ϑ | °C | temperature |
| 1/h | bed material cycle rate | |
| ξWHSV | 1/h | weight hourly space velocity |
| φSC | mol/mol | steam to carbon ratio |
References
- European Commission. 2030 Climate & Energy Framework. Available online: https://ec.europa.eu/clima/policies/strategies/2030_en (accessed on 17 December 2020).
- Ellen MacArthur Foundation. Growth within: A Circular Economy Vision for a Competitive Europe; McKinsey & Company: New York, NY, USA, 2015. [Google Scholar]
- Iaquaniello, G.; Centi, G.; Salladini, A.; Palo, E.; Perathoner, S. Waste to Chemicals for a Circular Economy. Chem. Eur. J. 2018, 24, 11831–11839. [Google Scholar] [CrossRef] [PubMed]
- Rauch, R.; Hrbek, J.; Hofbauer, H. Biomass gasification for synthesis gas production and applications of the syngas. WIREs Energy Environ. 2014, 3, 343–362. [Google Scholar] [CrossRef]
- Benedikt, F.; Fuchs, J.; Schmid, J.C.; Müller, S.; Hofbauer, H. Advanced dual fluidized bed steam gasification of wood and lignite with calcite as bed material. Korean J. Chem. Eng. 2017, 34, 2548–2558. [Google Scholar] [CrossRef]
- Corella, J.; Toledo, J.M.; Molina, G. A Review on Dual Fluidized-Bed Biomass Gasifiers. Ind. Eng. Chem. Res. 2007, 46, 6831–6839. [Google Scholar] [CrossRef]
- Fuchs, J.; Schmid, J.C.; Müller, S.; Hofbauer, H. Dual fluidized bed gasification of biomass with selective carbon dioxide removal and limestone as bed material: A review. Renew. Sustain. Energy Rev. 2019, 107, 212–231. [Google Scholar] [CrossRef]
- Koppatz, S.; Pfeifer, C.; Rauch, R.; Hofbauer, H.; Marquard-Moellenstedt, T.; Specht, M. H2 rich product gas by steam gasification of biomass with in situ CO2 absorption in a dual fluidized bed system of 8 MW fuel input. FUEL Process. Technol. 2009, 90, 914–921. [Google Scholar] [CrossRef]
- Aghaalikhani, A.; Schmid, J.C.; Borello, D.; Fuchs, J.; Benedikt, F.; Hofbauer, H.; Rispoli, F.; Henriksen, U.B.; Sárossy, Z.; Cedola, L. Detailed modelling of biomass steam gasification in a dual fluidized bed gasifier with temperature variation. Renew. Energy 2019, 143, 703–718. [Google Scholar] [CrossRef]
- Koppatz, S.; Pfeifer, C.; Hofbauer, H. Comparison of the performance behaviour of silica sand and olivine in a dual fluidised bed reactor system for steam gasification of biomass at pilot plant scale. Chem. Eng. J. 2011, 175, 468–483. [Google Scholar] [CrossRef]
- Hofbauer, H.; Rauch, R.; Klaus, B.; Reinhard, K.; Aichernig, C. Biomass CHP Plant Güssing—A Success Story. In Expert Meeting on Pyrolysis and Gasification of Biomass and Waste; Bridgewater, A.V., Ed.; CPL Press: Strasbourg, France; Newbury, UK, 2002; pp. 527–536. [Google Scholar]
- Thunman, H.; Seemann, M.; Berdugo Vilches, T.; Maric, J.; Pallares, D.; Ström, H.; Berndes, G.; Knutsson, P.; Larsson, A.; Breitholtz, C.; et al. Advanced biofuel production via gasification—lessons learned from 200 man-years of research activity with Chalmers’ research gasifier and the GoBiGas demonstration plant. Energy Sci. Eng. 2018, 6, 6–34. [Google Scholar] [CrossRef]
- Wilk, V.; Hofbauer, H. Analysis of optimization potential in commercial biomass gasification plants using process simulation. FUEL Process. Technol. 2016, 141, 138–147. [Google Scholar] [CrossRef]
- Wilcox, J. Carbon Capture; Springer: Boston, MA, USA, 2012. [Google Scholar]
- Kaltschmitt, M.; Hartmann, H.; Hofbauer, H. Energie aus Biomasse: Grundlagen, Techniken und Verfahren, 2nd ed.; Springer: Berlin/Heidelberg, Germany, 2009. [Google Scholar]
- Pfeifer, C.; Puchner, B.; Hofbauer, H. In-situ CO2-absorption in a dual fluidized bed biomass steam gasifier to produce a hydrogen rich syngas. Int. J. Chem. React. Eng. 2007, 5. [Google Scholar] [CrossRef]
- Martínez, I.; Kulakova, V.; Grasa, G.; Murillo, R. Experimental investigation on sorption enhanced gasification (SEG) of biomass in a fluidized bed reactor for producing a tailored syngas. FUEL 2020, 259, 116252. [Google Scholar] [CrossRef]
- Pitkäoja, A.; Ritvanen, J.; Hafner, S.; Hyppänen, T.; Scheffknecht, G. Simulation of a sorbent enhanced gasification pilot reactor and validation of reactor model. Energy Convers. Manag. 2020, 204, 112318. [Google Scholar] [CrossRef]
- Poboß, N. Experimentelle Untersuchung der sorptionsunterstützten Reformierung; Universität Stuttgart: Stuttgart, Germany, 2016. [Google Scholar]
- Valverde, J.M.; Sanchez-Jimenez, P.E.; Perez-Maqueda, L.A. Limestone Calcination Nearby Equilibrium: Kinetics, CaO Crystal Structure, Sintering and Reactivity. J. Phys. Chem. C 2015, 119, 1623–1641. [Google Scholar] [CrossRef]
- Schweitzer, D.; Beirow, M.; Gredinger, A.; Armbrust, N.; Waizmann, G.; Dieter, H.; Scheffknecht, G. Pilot-Scale Demonstration of Oxy-SER steam Gasification: Production of Syngas with Pre-Combustion CO2 Capture. Energy Procedia 2016, 86, 56–68. [Google Scholar] [CrossRef]
- Dieter, H. Gasification with In-Situ CO2 Capture and Separation in a 200 kWth Pilot Plant. In Proceedings of the Gasification Technologies Conference, Washington, DC, USA, 26–29 October 2014. [Google Scholar]
- Schmid, M.; Beirow, M.; Schweitzer, D.; Waizmann, G.; Spörl, R.; Scheffknecht, G. Product gas composition for steam-oxygen fluidized bed gasification of dried sewage sludge, straw pellets and wood pellets and the influence of limestone as bed material. Biomass Bioenergy 2018, 117, 71–77. [Google Scholar] [CrossRef]
- Kübel, M.; Gfrereis, C.; Waizmann, J.; Michel, M.; Hein, K.R. Hydrogen Rich Syngas Production from Steam Gasification of BCO in a FB Reactor-Gas Composition and Tar Formation at Various Conditions. In Proceedings of the 2nd World Biomass Conference-Biomass for Energy, Industry and Climate Protection, Rome, Italy, 10–14 May 2004; pp. 763–766. [Google Scholar]
- CEN/TC BT/TF 143. Biomass Gasification—Tar and Particles in Product Gases—Sampling and Analysis; 2004. [Google Scholar]
- Van Paasen, S.V.B.; Kiel, J.H.A. Tar Formation in Fluidised-Bed Gasification—Impact of Gasifier Operating Conditions. In Proceedings of the 2nd World Conference and Technology Exhibition on Biomass for Energy, Industry and Climate Protection, Rome, Italy, 10–14 May 2004. [Google Scholar]
- Brellochs, J. Experimentelle Untersuchung und Prozess-Simulation der AER-Biomassevergasung zur Erzeugung eines regenerativen Erdgassubstitutes. Ph.D. Thesis, Universität Stuttgart, Stuttgart, Germany, 2014. [Google Scholar]
- Schweitzer, D.; Albrecht, F.; Schmid, M.; Beirow, M.; Spörl, R.; Dietrich, R.; Seitz, A. Process Simulation and Techno-Economic Assessment of SER Steam Gasification for Hydrogen Production. Int. J. Hydrogen Energy 2018, 3, 569–579. [Google Scholar] [CrossRef]
- Schmid, J.; Fuchs, J.; Benedikt, F.; Mauerhofer, A.; Müller, S.; Hofbauer, H.; Stocker, H.; Kieberger, N.; Bürgler, T. Sorption Enhanced Reforming with the Novel Dual Fluidized Bed Test Plant at TU Wien. In Proceedings of the 25th European Biomass Conference and Exhibition, Stockholm, Sweden, 12–15 June 2017. [Google Scholar]
- Herguido, J.; Corella, J.; Gonzalez-Saiz, J. Steam Gasification of Lignocellulosic Residues in a Fluidized Bed at a Small Pilot Scale. Effect of the Type of Feedstock. Ind. Eng. Chem. Res. 1992, 31, 1274–1282. [Google Scholar] [CrossRef]
- Weimer, T.; Berger, R.; Hawthorne, C.; Abanades, J.C. Lime enhanced gasification of solid fuels: Examination of a process for simultaneous hydrogen production and CO2 capture. FUEL 2008, 87, 1678–1686. [Google Scholar] [CrossRef]
- Corella, J.; Toledo, J.M.; Molina, G. Steam Gasification of Coal at Low−Medium (600−800 °C) Temperature with Simultaneous CO2 Capture in a Bubbling Fluidized Bed at Atmospheric Pressure. 2. Results and Recommendations for Scaling Up. Ind. Eng. Chem. Res. 2008, 47, 1798–1811. [Google Scholar] [CrossRef]
- Göransson, K.; Söderlind, U.; He, J.; Zhang, W. Review of syngas production via biomass DFBGs. Renew. Sustain. Energy Rev. 2011, 15, 482–492. [Google Scholar] [CrossRef]
- Corella, J.; Toledo, J.M.; Molina, G. Biomass gasification with pure steam in fluidised bed: 12 variables that affect the effectiveness of the biomass gasifier. Int. J. Oil Gas. Coal Technol. 2008, 1, 194–207. [Google Scholar] [CrossRef]
- Schmid, J.C.; Benedikt, F.; Fuchs, J.; Mauerhofer, A.M.; Müller, S.; Hofbauer, H. Syngas for biorefineries from thermochemical gasification of lignocellulosic fuels and residues—5 years’ experience with an advanced dual fluidized bed gasifier design. Biomass Conv. Bioref. 2019. [CrossRef]
- Kiel, J.; van Paasen, S.; Neeft, J.; Devi, L.; Ptasinski, K.; Janssen, F.J.J.G. Primary Measures to Reduce Tar Formation in Fluidised-Bed Biomass Gasifiers; Final report SDE project P1999-012; ECN: Petten, The Netherlands, 2004. [Google Scholar]
- Udomsirichakorn, J.; Basu, P.; Salam, P.A.; Acharya, B. Effect of CaO on tar reforming to hydrogen-enriched gas with in-process CO2 capture in a bubbling fluidized bed biomass steam gasifier. Int. J. Hydrogen Energy 2013, 38, 14495–14504. [Google Scholar] [CrossRef]


| xCaO, wf | xMgO, wf | xSiO2, wf | xAl2O3, wf | xothers, wf | xCO2, wf1 | |
|---|---|---|---|---|---|---|
| wt% | ||||||
| Limestone | 55.1 | 0.7 | 0.4 | 0.1 | 0.2 | 43.5 |
| Hu,ar | γH2O,ar | γash,wf | γV,waf | γFC,waf | γC,waf | γH,waf | γN,waf | γS,waf | γCl,waf | |
|---|---|---|---|---|---|---|---|---|---|---|
| kJ/kg | wt% | |||||||||
| Wood pellets | 17,358 | 6.0 | 0.2 | 82.7 | 17.3 | 50.8 | 6.1 | 0.2 | 0.1 | 0.02 |
Publisher’s Note: MDPI stays neutral with regard to jurisdictional claims in published maps and institutional affiliations. |
© 2021 by the authors. Licensee MDPI, Basel, Switzerland. This article is an open access article distributed under the terms and conditions of the Creative Commons Attribution (CC BY) license (http://creativecommons.org/licenses/by/4.0/).
Share and Cite
Hafner, S.; Schmid, M.; Scheffknecht, G. Parametric Study on the Adjustability of the Syngas Composition by Sorption-Enhanced Gasification in a Dual-Fluidized Bed Pilot Plant. Energies 2021, 14, 399. https://doi.org/10.3390/en14020399
Hafner S, Schmid M, Scheffknecht G. Parametric Study on the Adjustability of the Syngas Composition by Sorption-Enhanced Gasification in a Dual-Fluidized Bed Pilot Plant. Energies. 2021; 14(2):399. https://doi.org/10.3390/en14020399
Chicago/Turabian StyleHafner, Selina, Max Schmid, and Günter Scheffknecht. 2021. "Parametric Study on the Adjustability of the Syngas Composition by Sorption-Enhanced Gasification in a Dual-Fluidized Bed Pilot Plant" Energies 14, no. 2: 399. https://doi.org/10.3390/en14020399
APA StyleHafner, S., Schmid, M., & Scheffknecht, G. (2021). Parametric Study on the Adjustability of the Syngas Composition by Sorption-Enhanced Gasification in a Dual-Fluidized Bed Pilot Plant. Energies, 14(2), 399. https://doi.org/10.3390/en14020399