Article

The Relationship between Thermal Characteristics and Microstructure/Composition of Carbon Dioxide Hydrate in the Presence of Cyclopentane

1
Guangzhou Institute of Energy Conversion, Chinese Academy of Sciences, Guangzhou 510640, China
2
CAS Key Laboratory of Gas Hydrate, Guangzhou 510640, China
3
Guangdong Provincial Key Laboratory of New and Renewable Energy Research and Development, Guangzhou 510640, China
4
Guangzhou Center for Gas Hydrate Research, Chinese Academy of Sciences, Guangzhou 510640, China
5
School of Engneering Sciences, University of Sciences and Technology of China, Hefei 230023, China
6
Nano Science and Technology Institute, University of Sciences and Technology of China, Suzhou 215123, China
*
Authors to whom correspondence should be addressed.
Energies 2021, 14(4), 870; https://doi.org/10.3390/en14040870
Submission received: 14 January 2021 / Revised: 2 February 2021 / Accepted: 4 February 2021 / Published: 7 February 2021

Abstract

:
Hydrate-based carbon dioxide (CO2) separation and capture is a new technology for achieving CO2 emission reduction. However, it is still not commercially applied for the ambiguity of microscopic hydrate formation mechanism. In a constant volume experiment of hydrate formation, there are two or more pressure platforms, indicating that there might be two or more different hydrates formation in succession. In order to reveal the relationship between the microscopic process and the gas consumption in the process of hydrate formation, hydrate composition and formation mechanism of cyclopentane-CO2 (CP-CO2) system was investigated using a differential scanning calorimeter (DSC) and Raman spectroscopy. The results indicated CO2-CP binary hydrate and CO2 hydrate are formed successively, and they coexist in the final hydrate. CP-CO2 binary hydrates forms preferentially, and as crystal seeds, inducing the formation of CO2 hydrates. The two hydrates formation processes cause the two pressure-drops. The results provide a scientific basis for increasing the gas consumption in different stages of gas hydrate formation in the presence of hydrate formation promoter.

Graphical Abstract

1. Introduction

Energy and environment issues are the focus of researchers all over the world. With the continuous development of industry, the CO2 emissions from fossil fuel combustion increase year by year, which has become the main reason for greenhouse effect such as global warming [1]. As there is no new energy that can completely replace the fossil energy to social development, fossil energy will continue to be the main energy to support economic development, thus the sustainable utilization of fossil energy is of great significance [2]. Therefore, while maintaining the efficient and sustainable utilization of fossil energy, it is very important to separate and capture CO2 from the exhaust gas [3]. Many meaningful methods of atmospheric CO2 fixation in inorganic and biomimetic structures have been proposed [4]. The traditional methods of CO2 separation include physical absorption, chemical adsorption, membrane separation, cryogenic separation and chemical cycle combustion method, but all these methods have their individual defects, for instance, most of the chemical adsorbents aren’t environmental friendly, the capacity of a membrane is small and the membrane is consumable, therefore, it is expected to develop new and environmental friendly and efficient technology for gas separation [5,6,7]. Hydrate-based gas separation technology has attracted great attention because of its advantages of simple process, low energy consumption and relatively environmental friendly [8,9].
Gas hydrate is a kind of non-stoichiometric crystalline compound, which is composed of water molecules as the host molecules and gas molecules (CH4, CO2, H2, etc.) as the guest molecules. Water molecules form cages through hydrogen bond, and gas molecules enter the cages and make the cages more stable by Van der Waals force [10]. Depending on the pressure and the molecular properties of the guest, gas hydrates usually have different structures. The three main structures include cubic structure I (sI), cubic structure II (sII) and hexagonal structure H (sH), and sI hydrate crystal unit is composed of two 512 and six 51262 cages with chemical formula of 2 [512] · 6 [51262] · 46H2O. sII hydrate crystal unit is composed of sixteen 512 and eight 51264 cages with chemical formula of 16 [512] · 8 [51264] · 136H2O. sH hydrate crystal unit is composed of three 512 cages, two 435663 cages and one 51268 cages with chemical formula of 3 [512] · 2 [435663] · 1 [51268] · 34H2O [11,12]. The principle of hydrate-based gas separation from gas mixture is that the different gas components have their individual gas hydrate formation equilibrium conditions, and the component with relatively moderate equilibrium condition preferentially enters the hydrate cage and enriches in the hydrate phase, while the remaining components enrich in the residual gas phase. For example, compared with H2 and N2, the phase equilibrium pressure of CO2 hydrate is much lower at a certain temperature, and it is easier to enter the hydrate to enrich in the hydrate, so as to achieve the purpose of separating CO2 from CO2/H2 or CO2/N2 mixture [13]. In fact, gas hydrate formation could only happen under the condition of high pressure or/and low temperature. For example, the phase equilibrium pressure is about 2.4 MPa for pure CO2 forming CO2 hydrate at 5 °C in pure water system. And the higher pressure or lower temperature means the higher energy consumption. Therefore, various promoters have been developed to moderate the hydrate formation conditions. All the promoters are divided into thermodynamic promoter and kinetic promoter [14]. The thermodynamic promoter itself, such as Tetrahydrofuran (THF) [15,16,17,18], CP [19], Tetrabutyl Ammonia Salt (TBA+) [20,21,22,23], Propane (C3H8) [24,25], can form hydrate with a relatively moderate phase equilibrium condition. Therefore, the presence of the thermodynamic promoter can moderate the hydrate formation temperature and pressure. Taken CP as an example, relative to CO2 or CH4, CP could form CP hydrate at quite higher temperature and lower pressure, thus on one hand, the CP hydrate which formed in advanced could offer cages for CO2 or CH4 to form CO2-CP or CH4-CP binary hydrate, on the other hand, the CP hydrate could induce the formation of CO2 hydrate or CH4 hydrate formation as crystal seeds, moderating the conditions of forming CO2 hydrate or CH4 hydrate [26,27]. The function of kinetic promoter, such as Sodium Dodecyl Sulfonate (SDS) [28,29], Tween 80 [30], Dimethyl Sulphoxide (DMSO) [31], is to improve the fugacity of gas in liquid phase by changing the surface tension and promoting gas dissolution. Currently, the main thermodynamic promoters include THF, CP and TBAB, etc. Many works have been carried out to investigate the effect of the promoters on hydrate formation equilibrium conditions, kinetics and thermodynamics of hydrate formation, gas separation efficiency, micro-mechanism of hydrate formation, etc. Without any questions, the positive effects of the thermodynamic promoters on hydrate formation have been systematically proven, and some new synergistic promoters such as Tetrabutyl Ammonium bromide + Dodecyl Trimethyl Ammonium Chloride (TBAB+DTAC) [7], CP+TBAB [32], THF+SDS [28], TBAB+DSMO [31,33] have also been developed. However, as reported previously, different thermodynamic promoters have different selectivity for gases in the process of hydrate formation depending on their physical and chemical properties. For example, CP and THF are relatively more conducive to the formation of CO2 and CH4 hydrates, while TBAB could significantly reduce the formation conditions of hydrate but being disadvantage of the gas consumption for the hydrate agglomeration [14]. Even so, the scientific basis supporting these experimental results, especially the thermodynamic micro-mechanism, is still unclear.
The thermodynamic micro-mechanism of gas hydrate formation is usually inferred by molecular dynamic (MD) simulation [34,35,36,37,38,39]. It could also be obtained by measuring the reaction heat of hydrate formation. Since the 1980s, differential scanning calorimetry (DSC) has been used to study the thermal properties of hydrates, such as hydrate decomposition enthalpy and heat capacity [40,41]. Under a certain temperature, it is a kind of analytical method for determining the energy difference related to the temperature between the delivered substance and the reference substance. The gas hydrate decomposition enthalpy (ΔHd) is a key parameter for predicting the heat for hydrate decomposing into water and gas. Koh et al. [42] used DSC to measure the decomposition heat of hydrate formation by carrying out experiments on simulated natural gas hydrate (NGH) formation and decomposition under environmental pressure, and used DSC to quantify and compare the effects of various kinetic inhibitors. Dalmazzone et al. [43] employed high-pressure DSC to characterize the limits of the thermodynamic stability of methane hydrate and other natural gas hydrates in the presence of hydrate formation kinetic inhibitors (KIs). Zhang et al. [44] measured the decomposition temperature of H2 + CP and CO2 + CP in different pressures by high pressure DSC. The results showed that the decomposition temperature of H2 hydrate depends on the properties of additives, while the decomposition temperature of CO2 hydrate is independent of the properties of the additives. In addition, Seo et al. [45,46] (from Ulsan National Institute of Science and Technology) used HP µ-DSC to prove the existence of sI and sII hydrates in the process of CH4-CO2 replacement and obtain the transformation enthalpy of hydrate structure from sH to sI in the CO2 capture and sequestration by hydrate method, which are of great significance for further study on the mechanism of gas hydrate technology.
The hydrate formation or/and decomposition enthalpy is closely related to the hydrate structure and composition. And the hydrate structure and composition could be determined by many micro analytical methods, e.g., Raman Spectroscopy, Fourier Transform Infrared Spectroscopy (FTIR), Powder X-ray Diffraction (PXRD), Nuclear Magnetic Resonance (NMR) [47,48,49]. For instance, Chen et al. [50] investigated structures of CO2 hydrate and THF + CO2 binary hydrate by Raman spectra, and they found in the pure CO2 hydrate, CO2 molecules occupy both medium 51262 and small 512 cages, while CO2 molecules only occupy the small 512 cages in the binary hydrate. They further believed that THF occupies the medium 51264 cages is the reason why the gas consumption in THF system is lower than that in pure water system. Xu et al. [14] successfully achieved the mechanism of hydrate formation promoters affecting on the gas selectivity in the process of hydrate formation by Raman and Cryo-SEM. Seo et al. [51] carried out the experiments to form CH4 hydrate in the presence of tetra-iso-amyl ammonium bromide (TiAAB), and investigated the relationship between the transformation of hydrate structure among sI, sII or/and sH and the composition of gas hydrate by DSC and Raman, then they found the inclusion of CH4 had few effects on the semi-clathrate structure.
Up to now, there is still no authoritative consensus on the micro process of gas hydrate formation, especially whether there is a correlation between the thermodynamic properties of hydrate formation and the hydrate structure and composition. In order to further reveal the relationship between them, the thermodynamic properties of CO2 hydrate formation in the presence of CP were studied by DSC, and the hydrate composition and structure were analyzed by Raman. Through the scientific comparison and analysis of the experimental results, it is expected to find the corresponding relationship between the formation thermodynamic properties of gas hydrate and the hydrate structure and composition.

2. Experimental

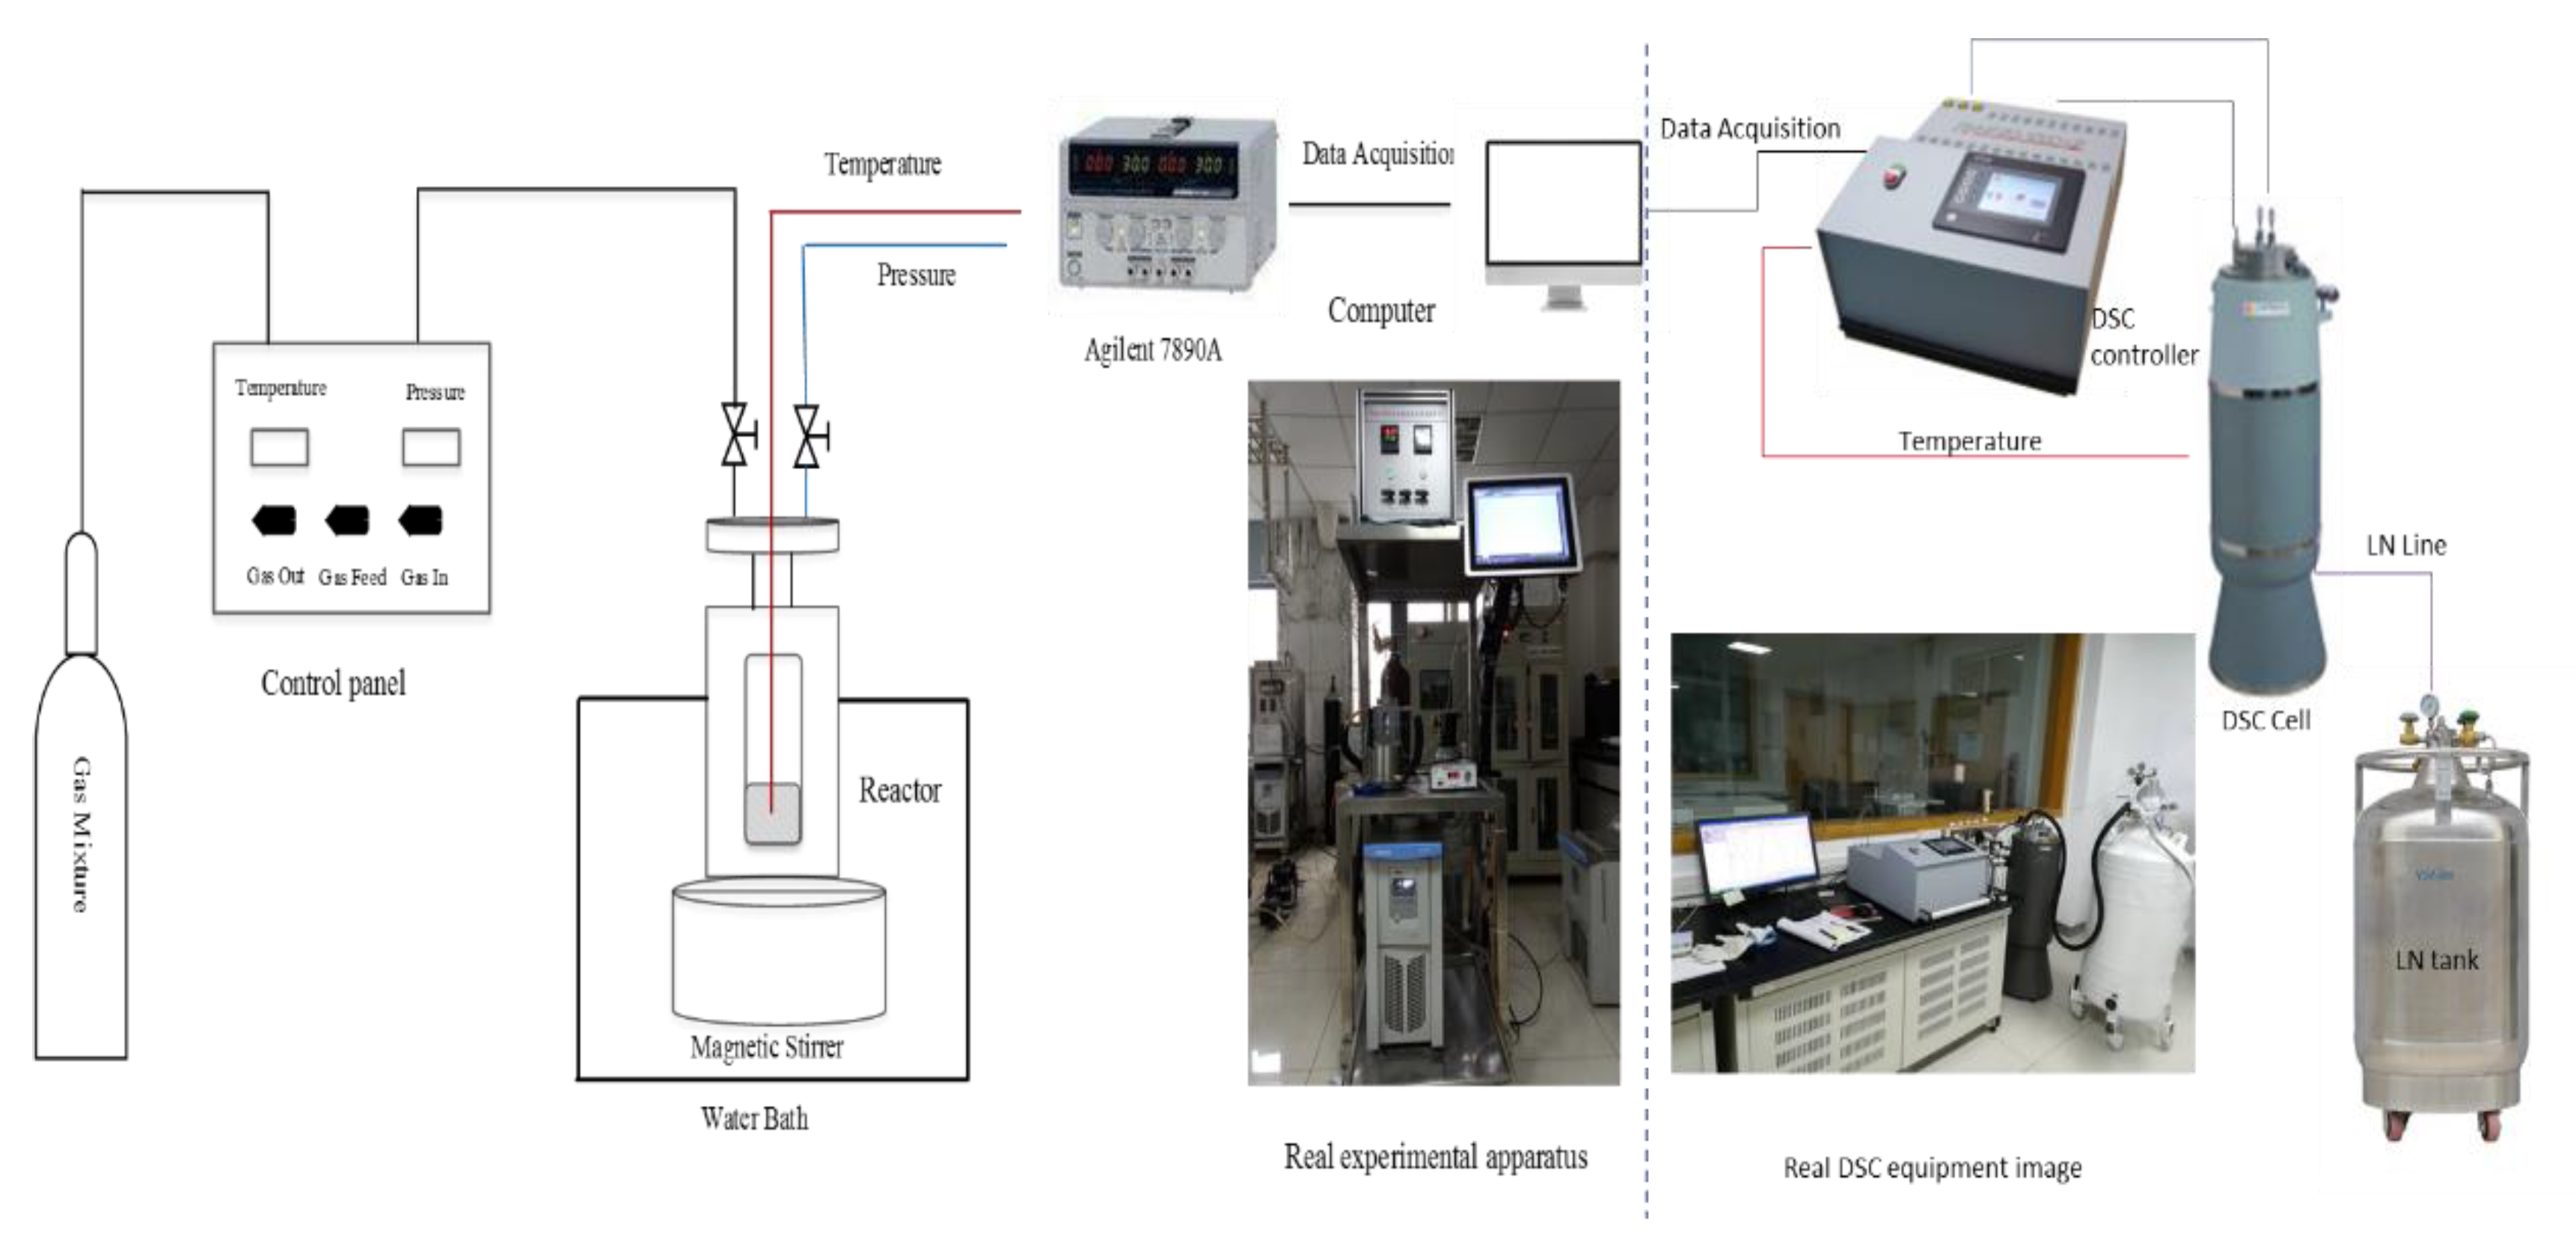
2.1. Experimental Apparatus and Materials

The low-temperature and high-pressure DSC and Raman spectrometer used in this experiment are Setaram BT 2.15 and Horiba LabRam, respectively. CO2 (A.R. > 99.99%) is provided by Guangzhou Shengying Gas Co., Ltd. (Guangzhou, China), and CP (A.R. > 99.0%) is offered by Xiamen Pioneer Chemical Reagent Co., Ltd. (Xiamen, China), and the deionized water with a resistivity of 18.25 mΩ/cm is self-produced using an ultra-pure water system supplied by Nanjing Ultrapure Water Technology Co., Ltd., Nanjing, China.
The whole experimental schematic diagram is shown in Figure 1. As shown, there are two sets of experimental equipment. The left is special for gas hydrate formation and Raman measurement, and the right is special for DSC measurement. For the left, the high-pressure cylinder reactor is made of 304 stainless steel with an internal volume of 100 mL and a maximum bearing pressure of 10 MPa. There are visual windows at the front and back of the reactor, through which the hydrate formation and decomposition process can be observed. There is a flange on the reactor and it is connected with the gas cylinder through the conduit. The temperature and pressure in the reactor are measured by a Omega Pt 100 thermocouple with the uncertainties of 0.1 °C and a Trafag NAH 8253 pressure transmitter with accuracy of 0.3%. Temperature and pressure are directly transferred to computer through data acquisition system. The reactor is placed on a magnetic stirrer with a rotating speed of 0–2000 r/min. The material in the reactor can be fully mixed by the magnetic stirrer. The system temperature is regulated by a water-bath jacket outside the reactor, and the jacket is filled with a 25 wt% glycol aqueous solution. DSC consists of three main parts: gas control platform, reaction tank and calorimetric system, liquid nitrogen (LN) temperature control system. An air-bath tank is set out around the DSC, which is full of N2 during the measurement, and a LN tank is set in the DSC, which is filled with LN. A DSC cell with inner volume of 3.60 mL is placed in the LN tank for test. Here is a program controller for setting the temperature and pressure program.

2.2. Experimental Procedure

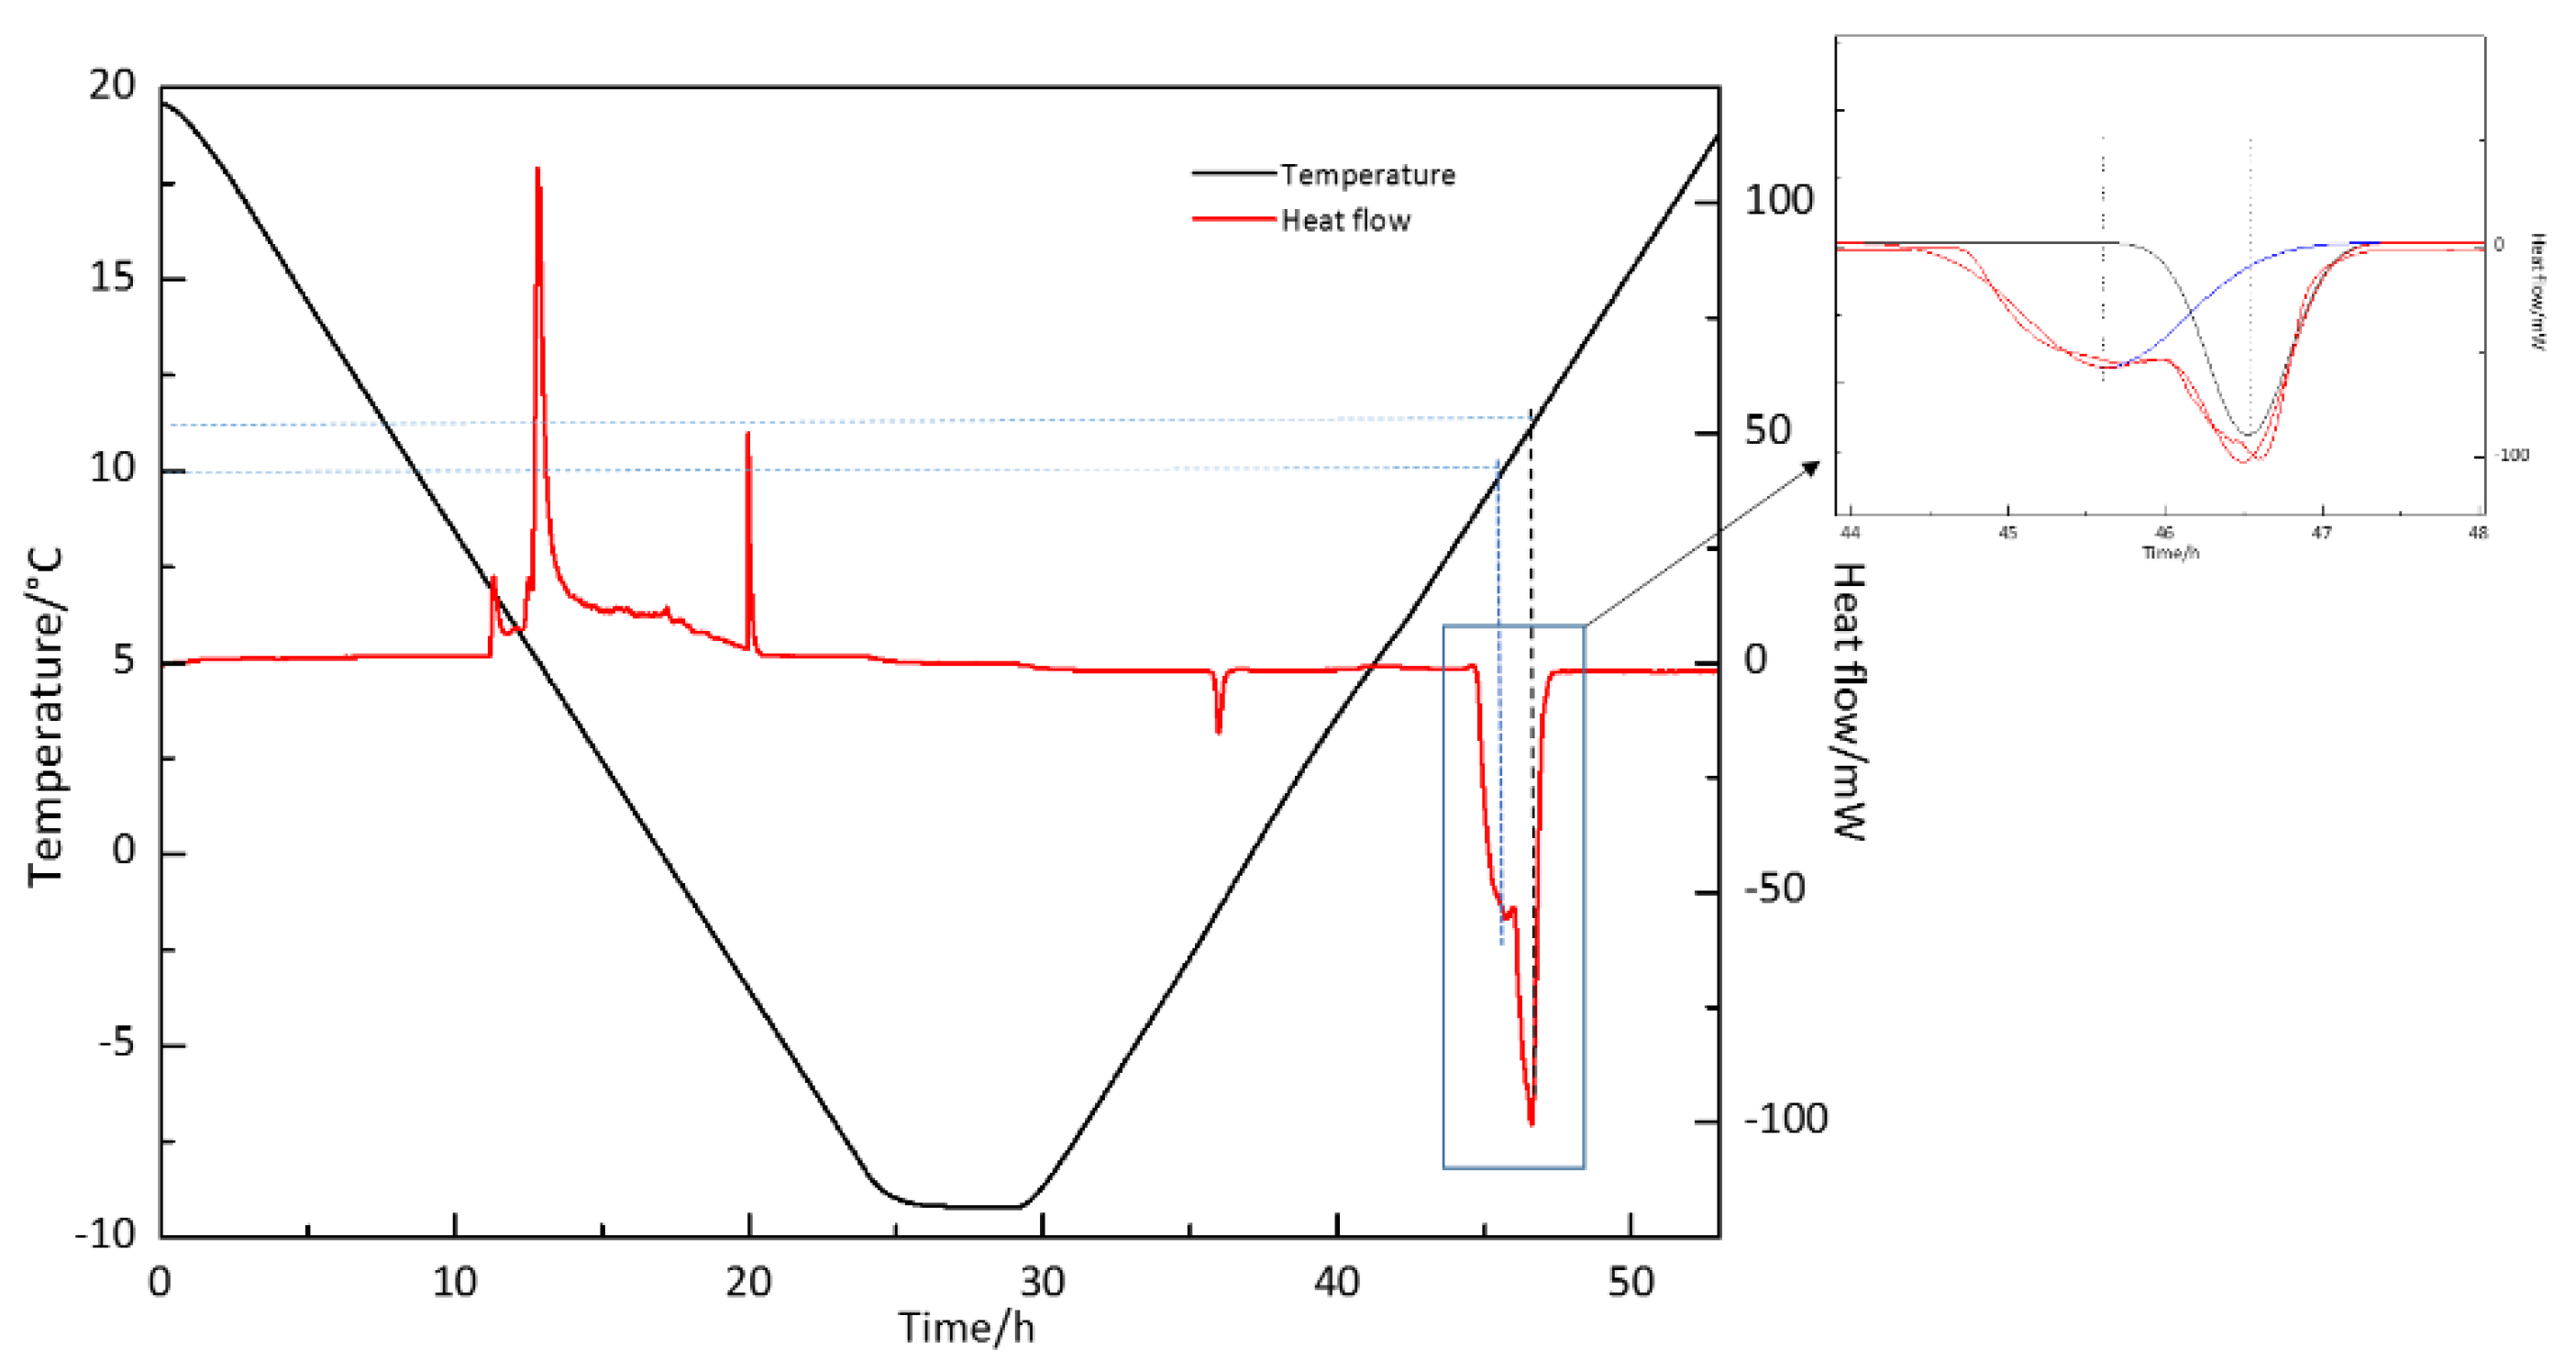
2.2.1. DSC Experiment

The process of the DSC experiment is similar to that reported in Reference [52]. Before the experiment, the cell is firstly rinsed with the ionized water at least 3 times, and then thoroughly dried with a dryer. After being injected about 1.0 g solution (CP solution 5 v%), the cell is transferred to the He-bath chamber. The chamber is vacuumized to −1.0 MPa, and then is pumped to 1.0 MPa with pure helium (He). The feed gas is injected into the cell to exclude the air and then pumped to the set experimental pressure with an automatic pressurizer. Whereafter, the temperature program is set according to the experimental scheme, and then started. For each experiment, the same program runs four times automatically. The detail procedure of DSC experiments is set as shown in Table 1. In this experiment, the final sample is 1.0550 g. And then install the high-pressure sample cell into the measuring unit according to the operation specification.

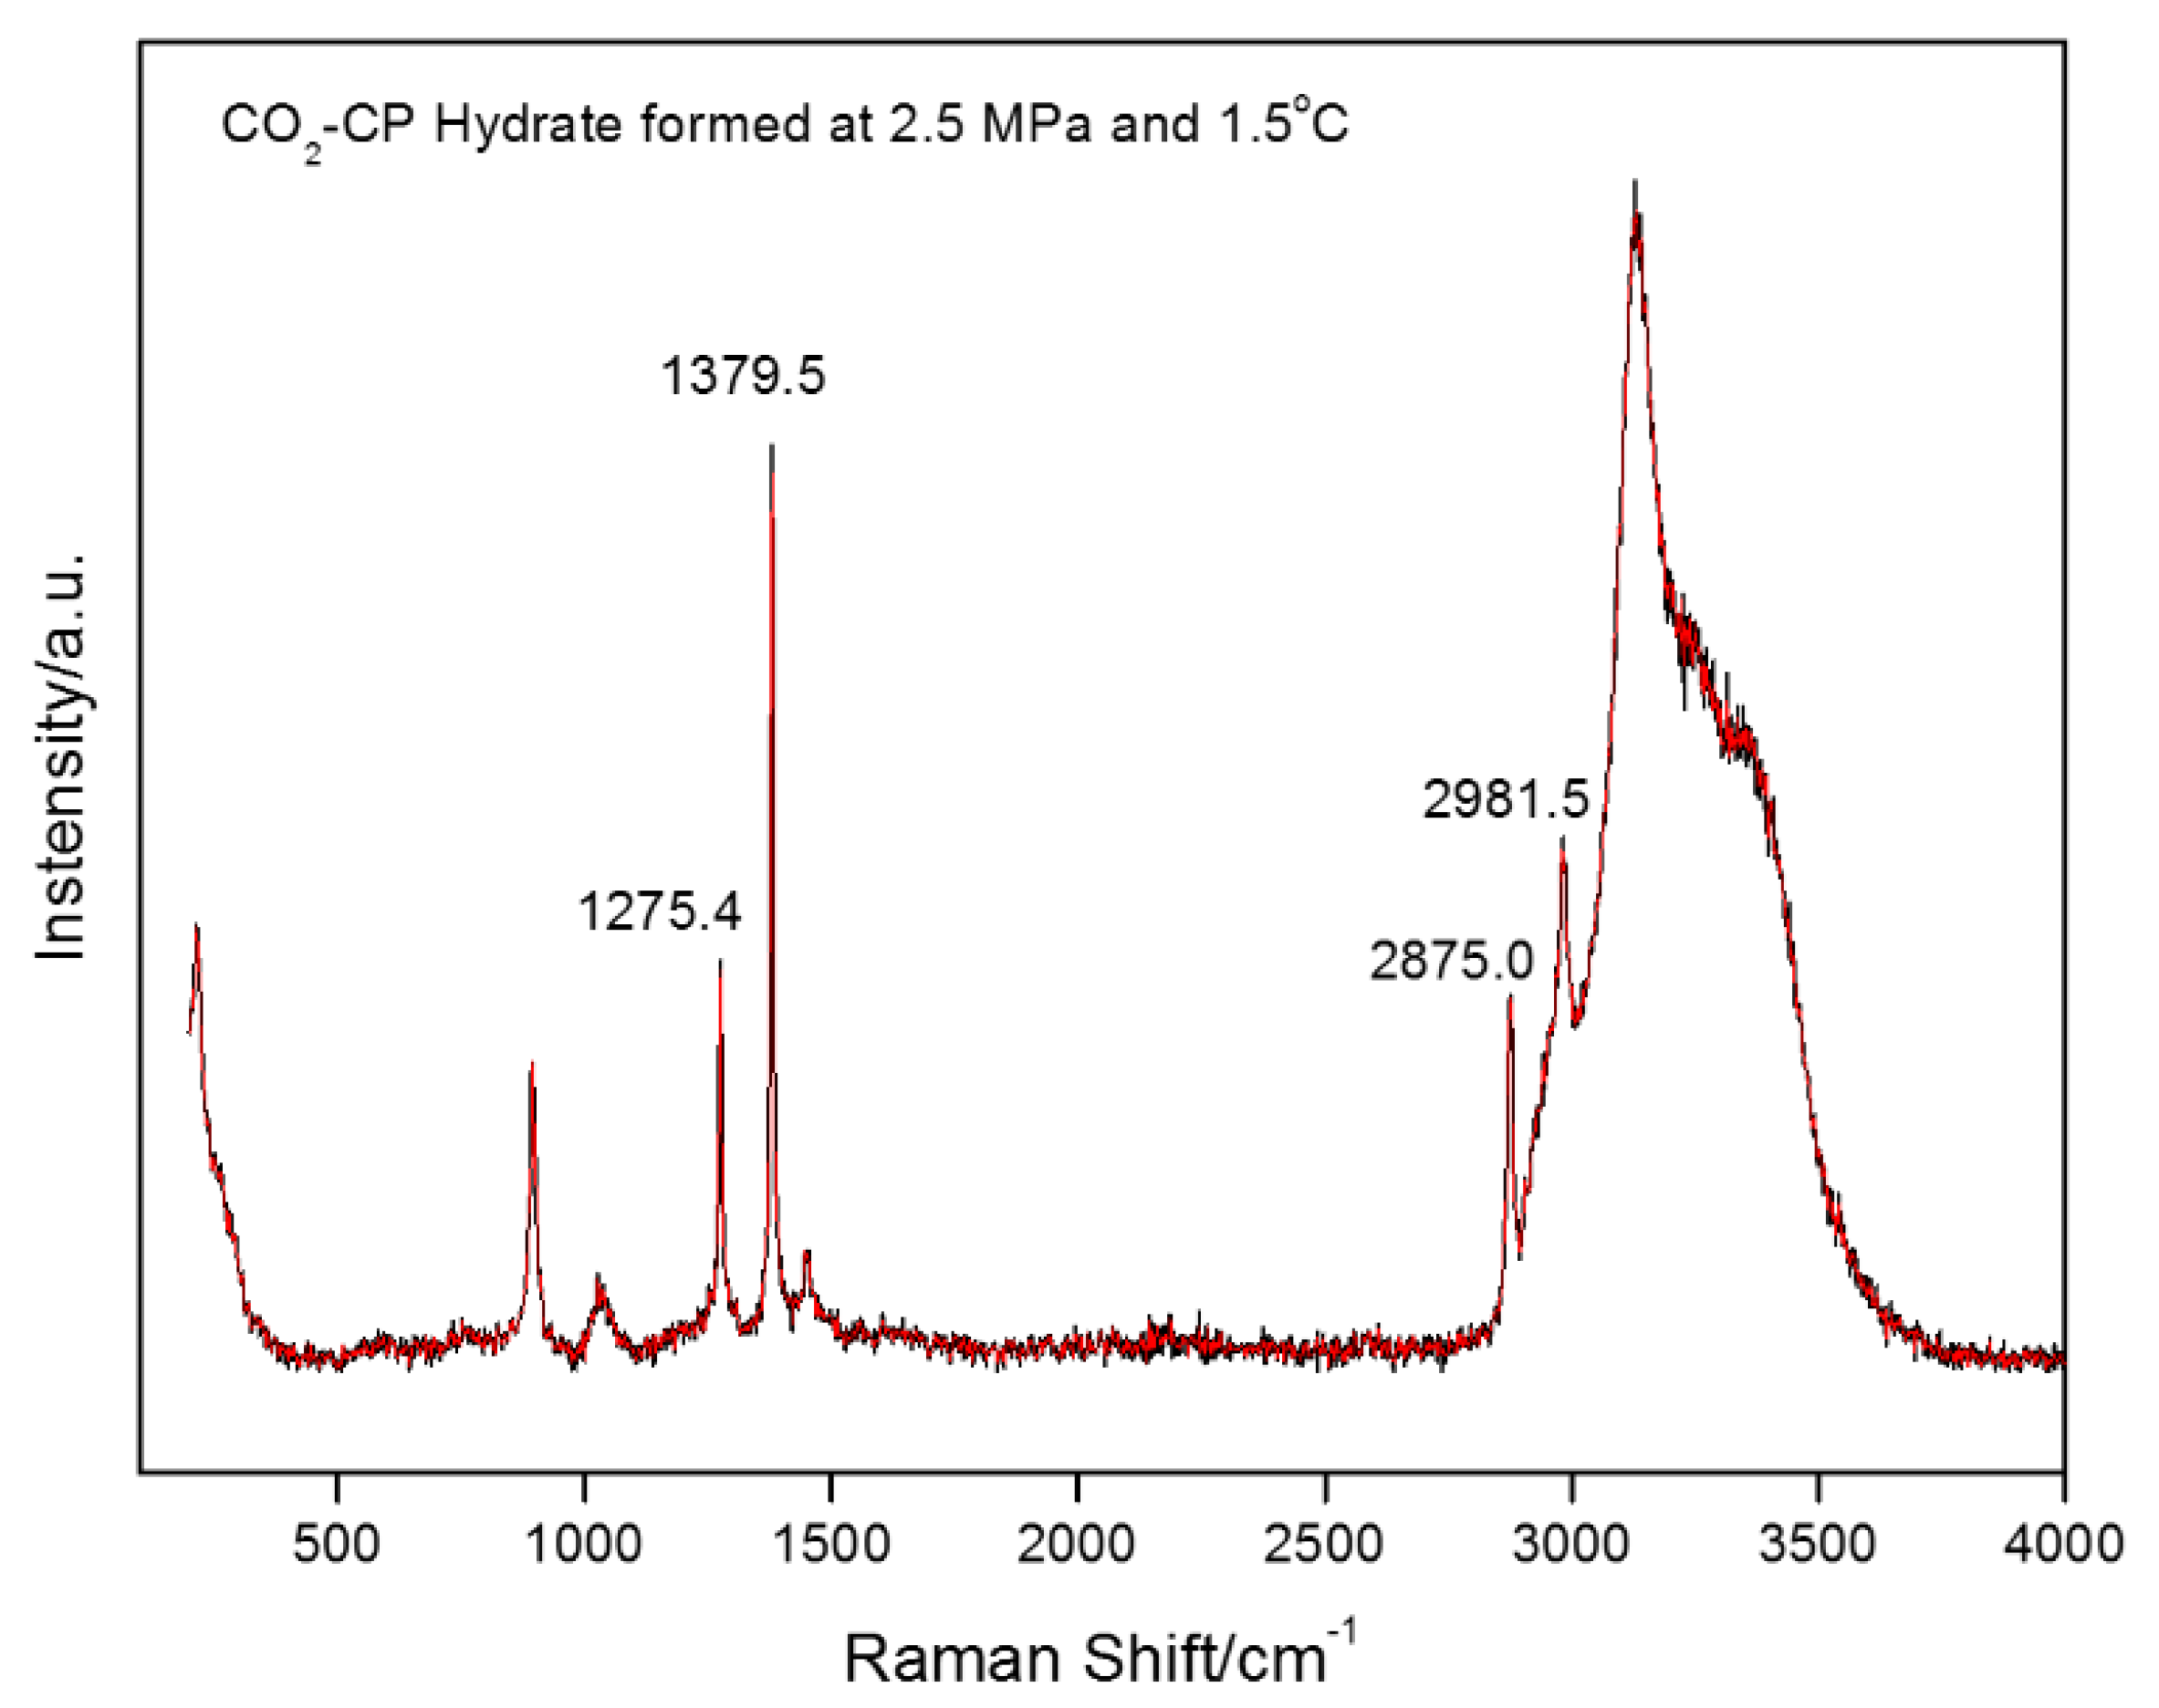
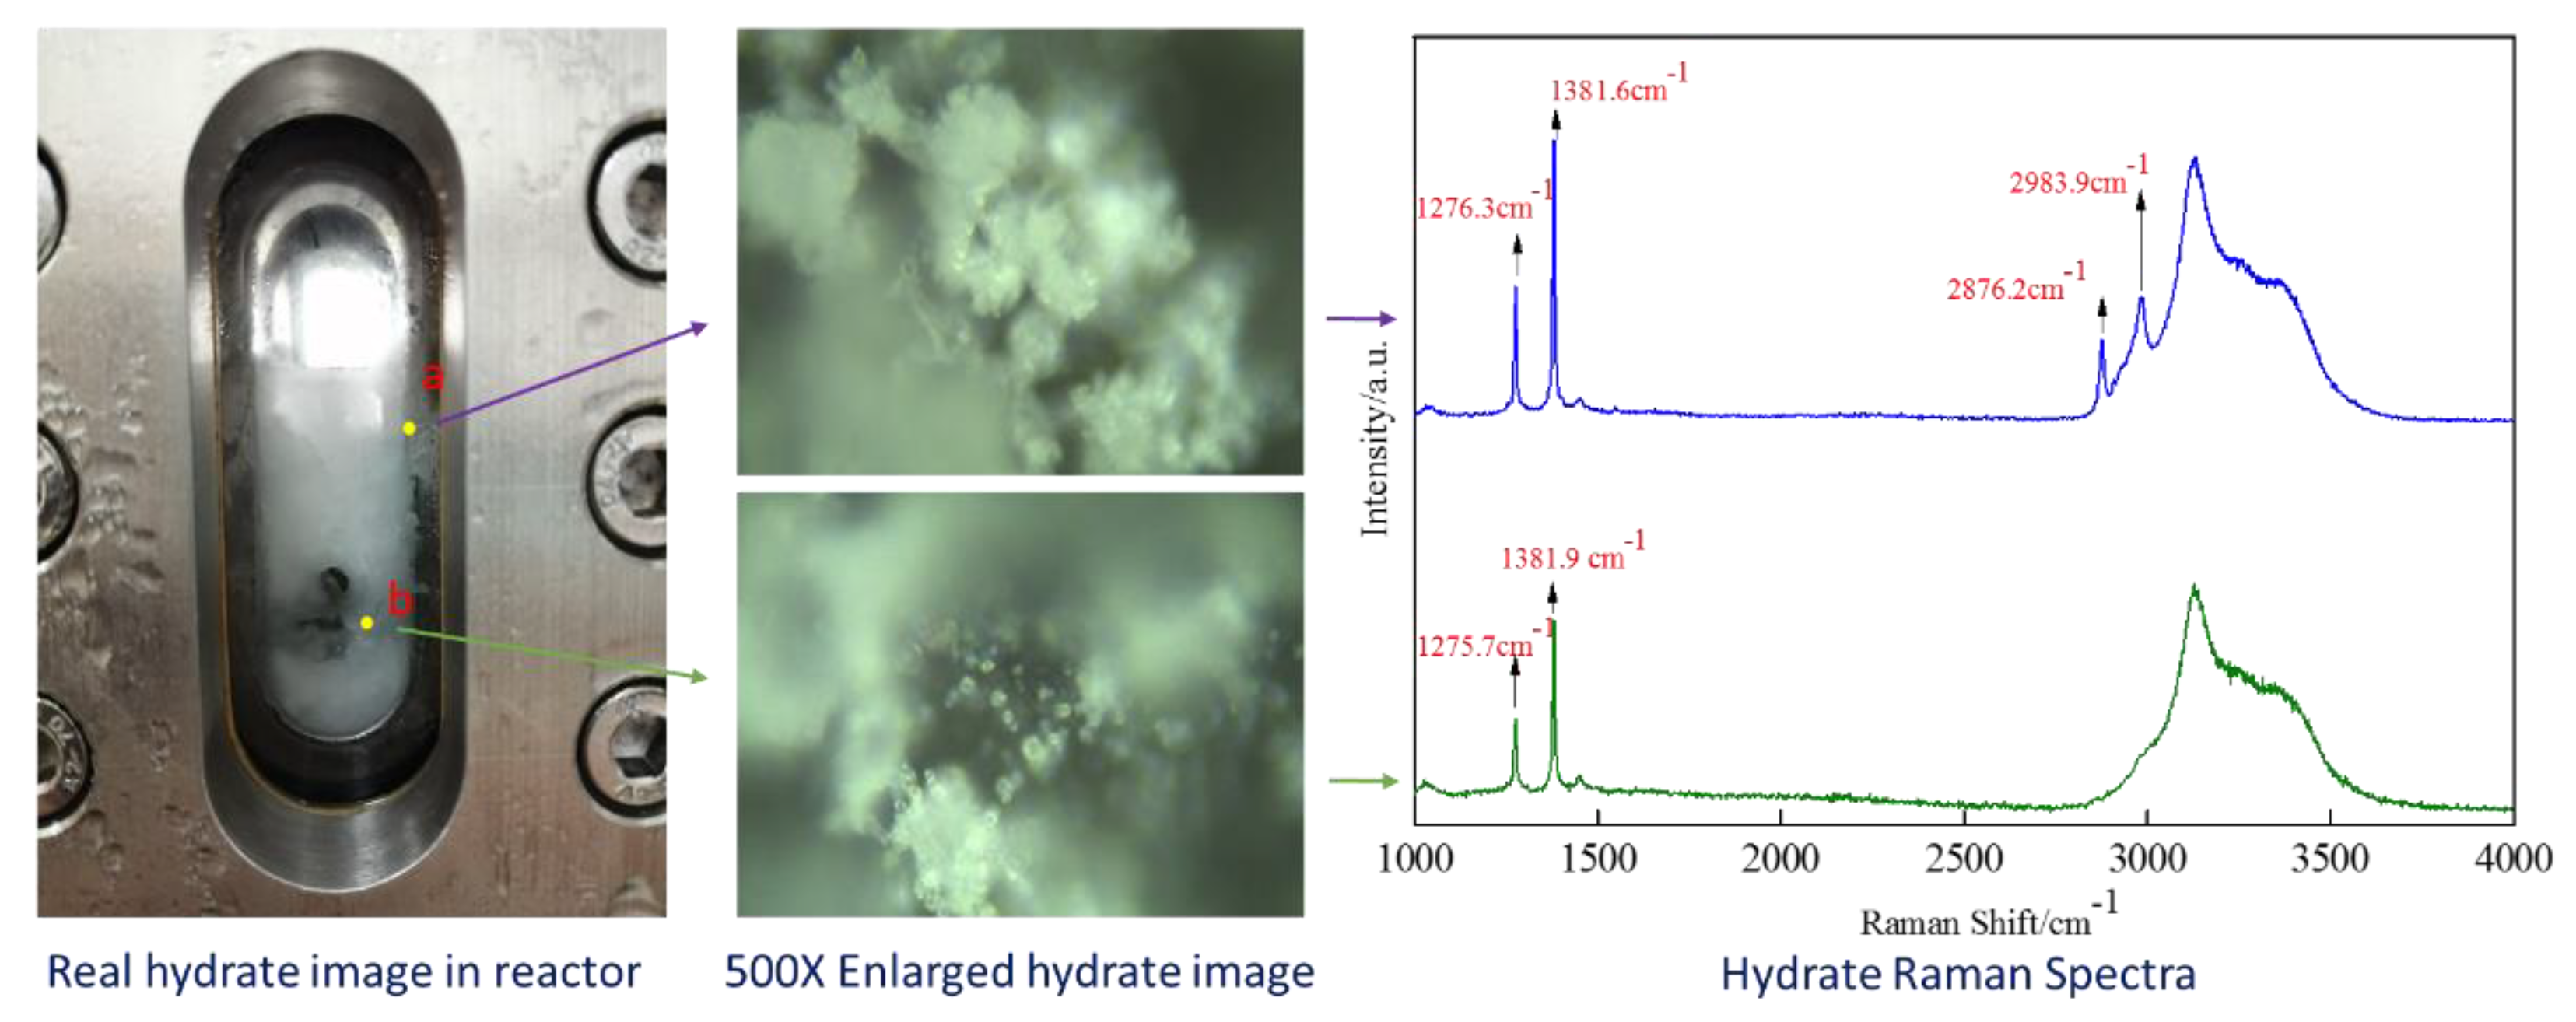
2.2.2. Raman Experiment

The steps of Raman experiment are similar to those in reference [52], including hydrate formation, hydrate sampling, Raman measurement, etc., but due to the update of the test system, the Raman spectrometer was replaced by InVia Reflex from Renishaw with a single monochromator of 1800 grooves/mm grating, and a multichannel air-cooled charge coupled device (CCD) detector is employed to measure the simulated CH4-CO2 binary hydrate, using a 532 nm Argon laser with 100 mW. Before the measurement, the Raman spectrum is calibrated with standard silicon (Si) crystal of 520.7 cm−1.
All the DSC measurement and Raman measurement were repeated by 3 times in order to ensure all measurements were repeatable. In addition, the pressure in the hydrate formation experiment and Raman measurement were gauge pressure, but the pressure in the DSC measurement was absolute pressure.

3. Results and Discussion

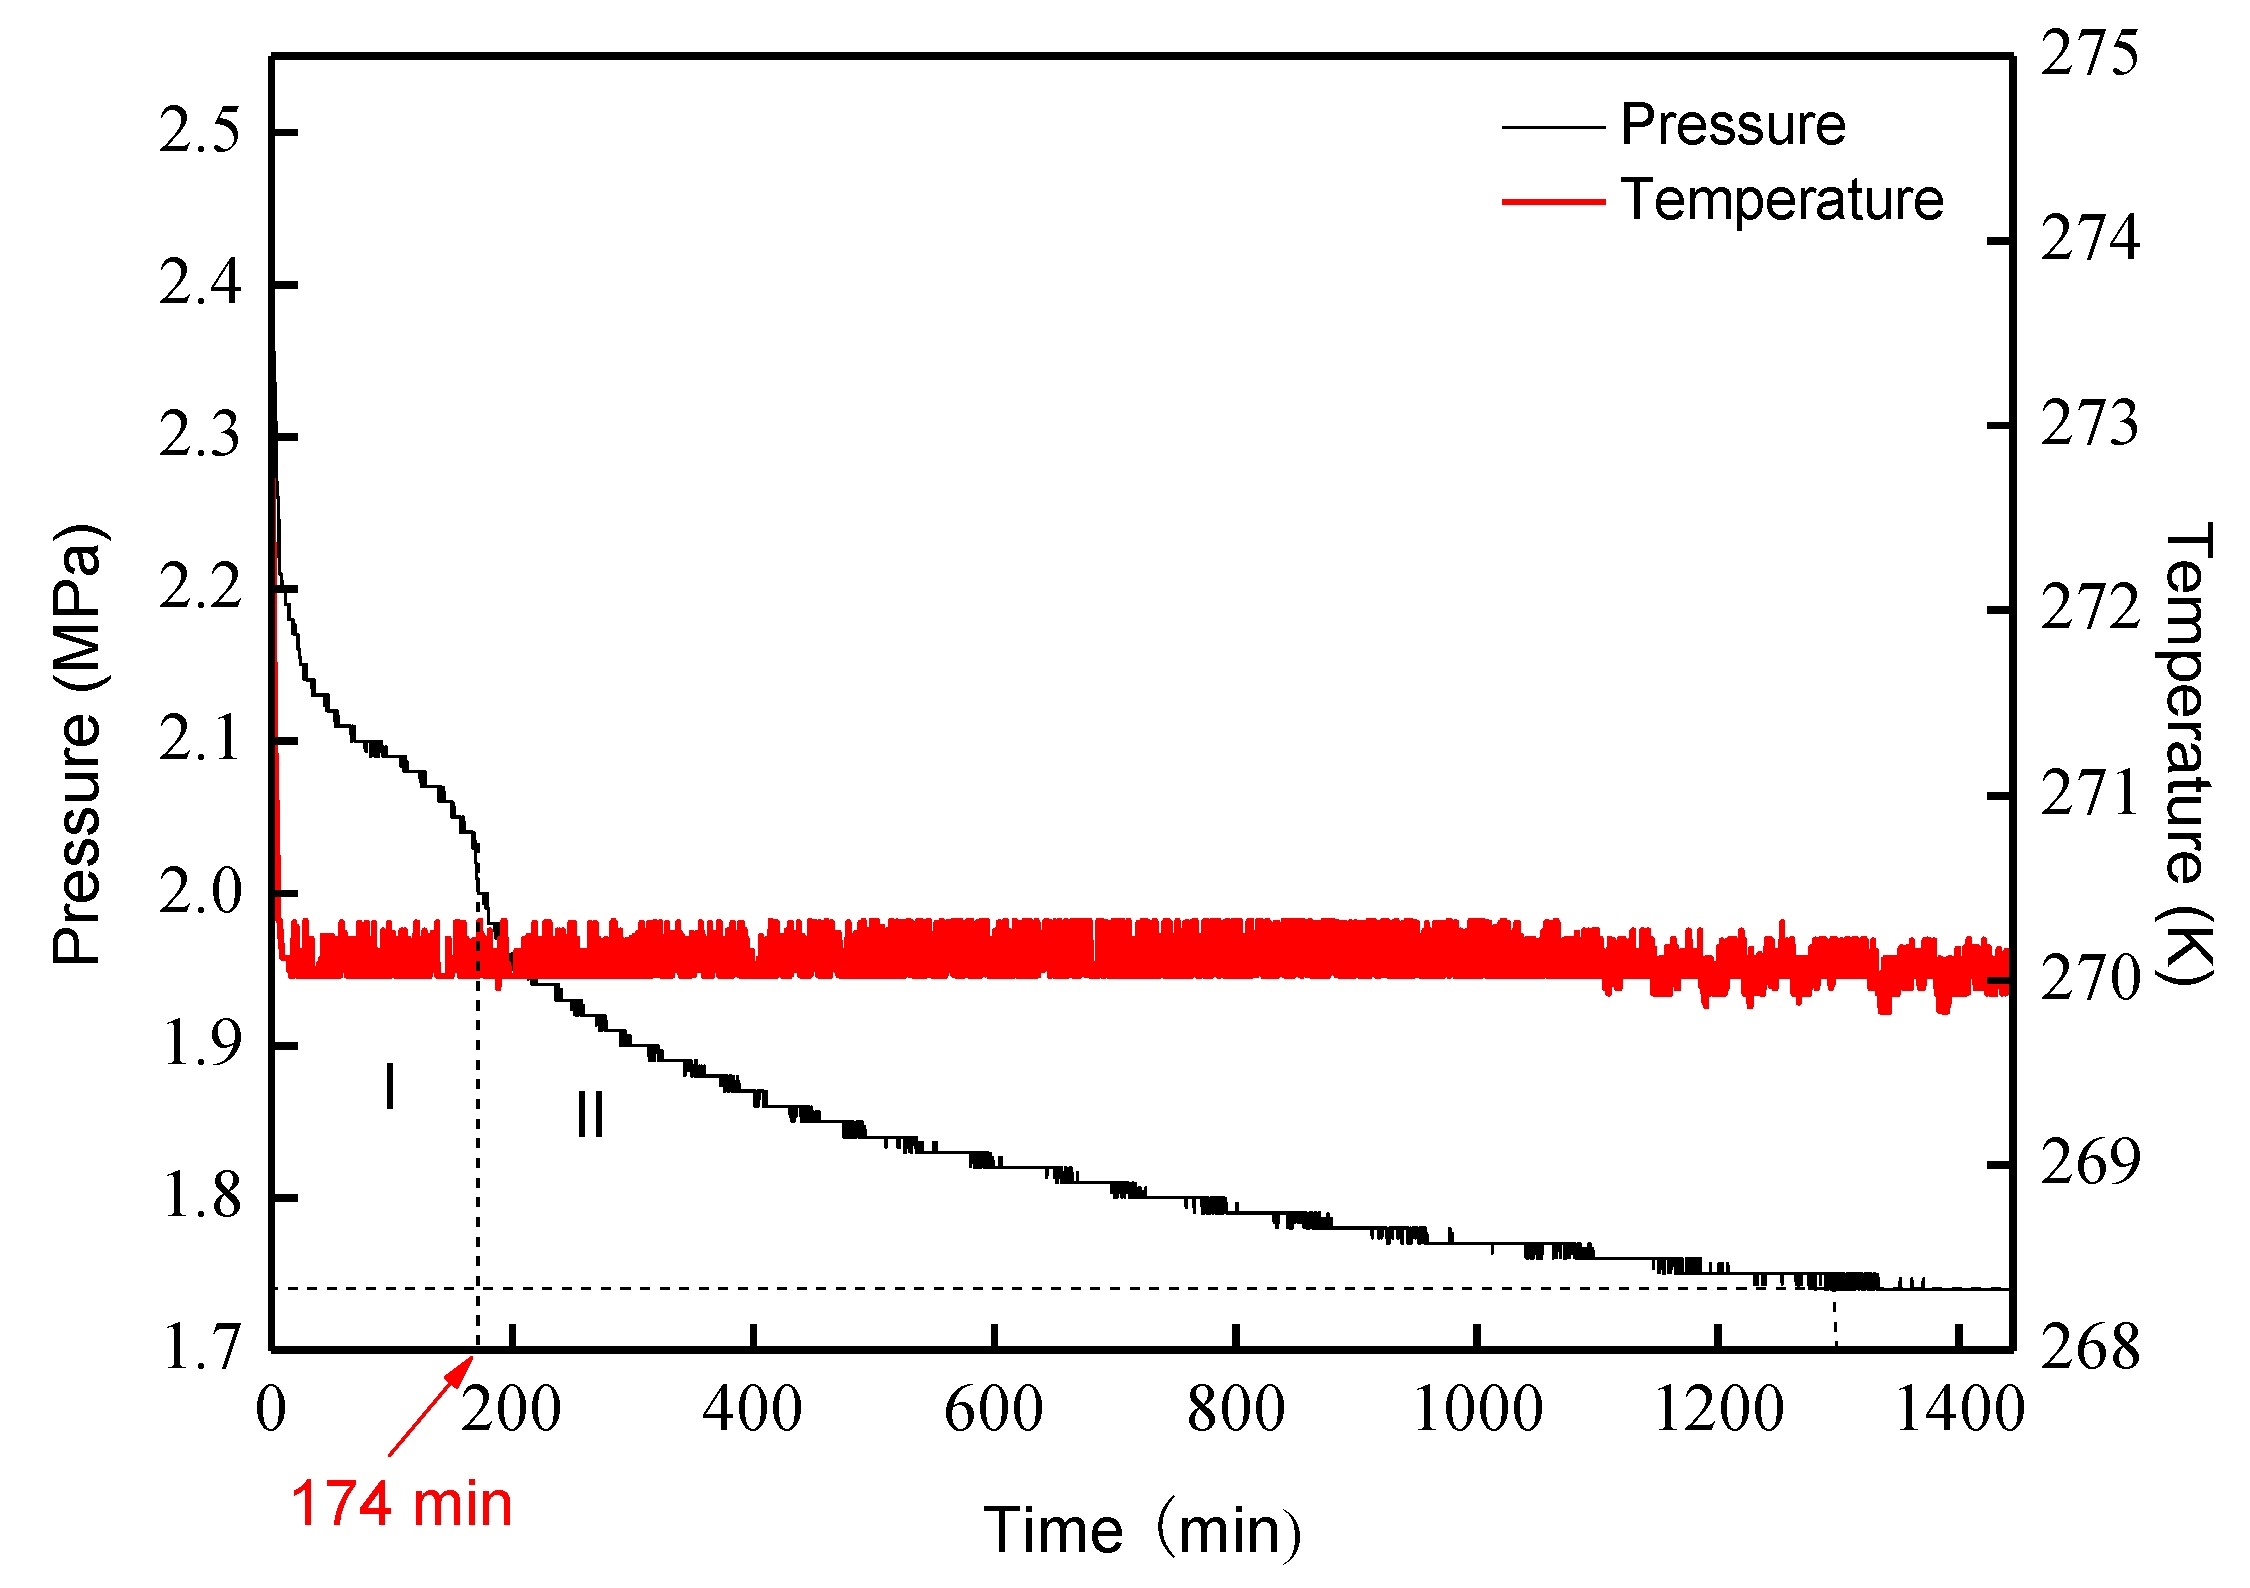
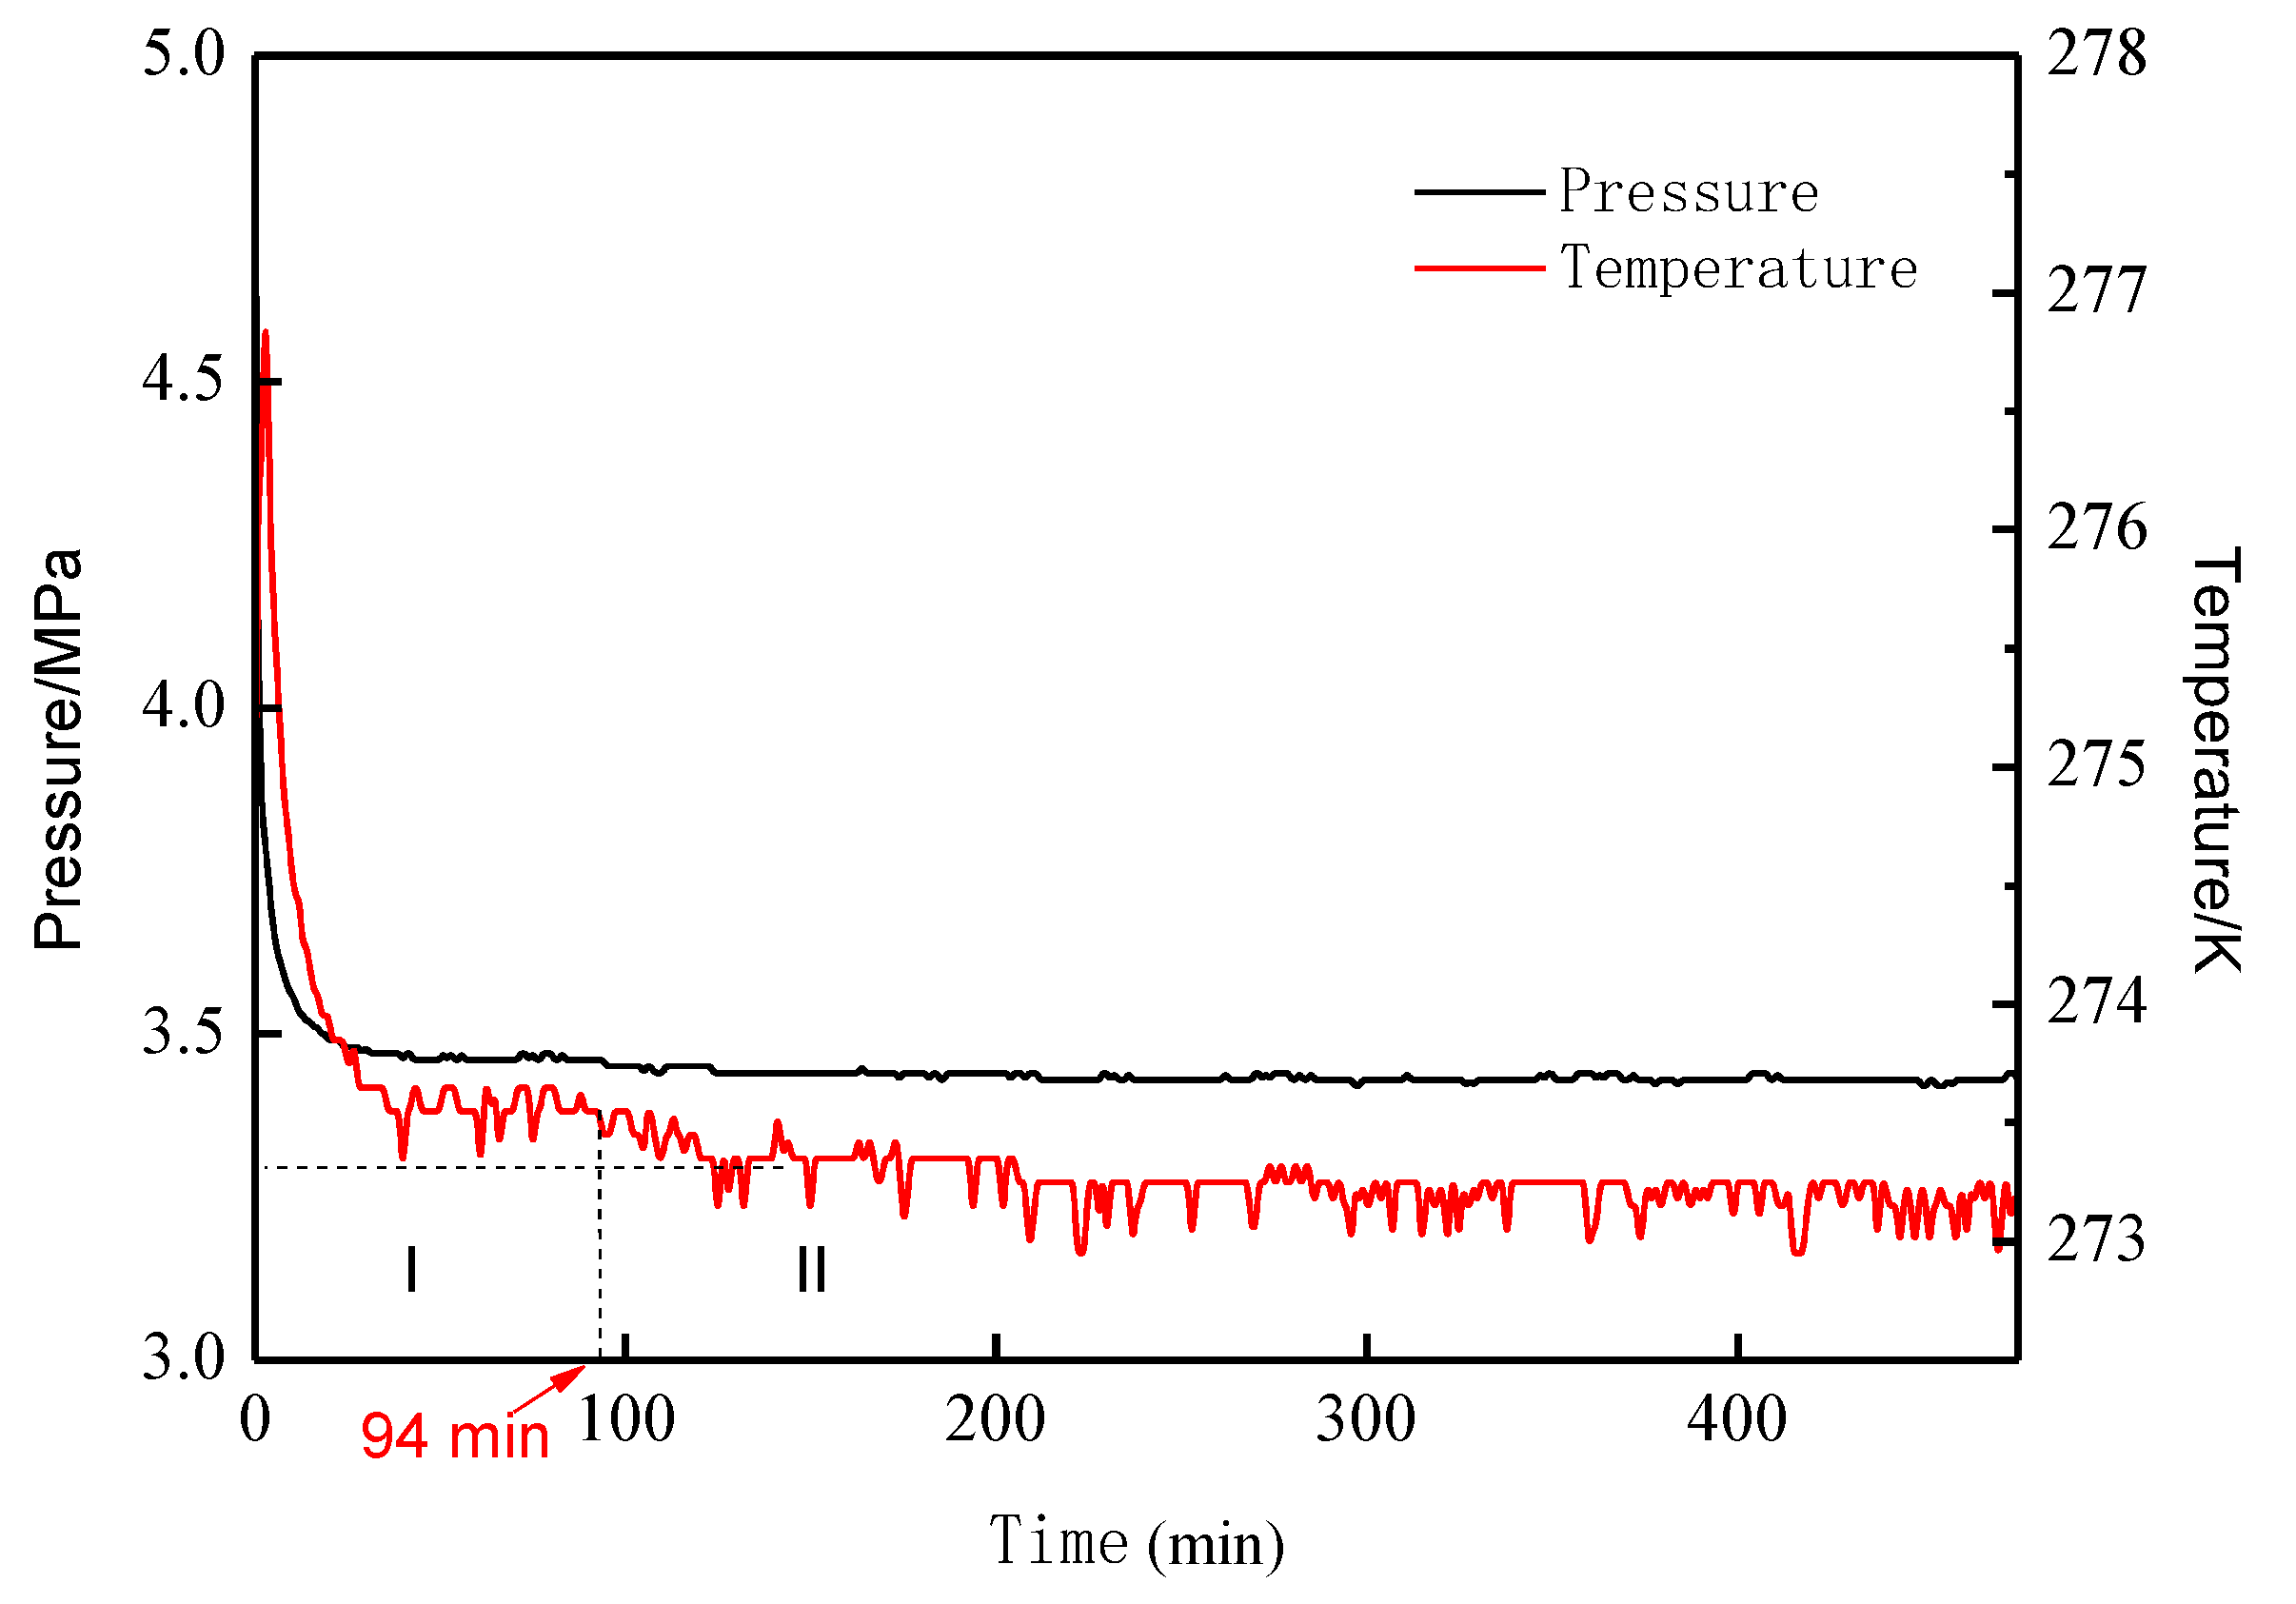
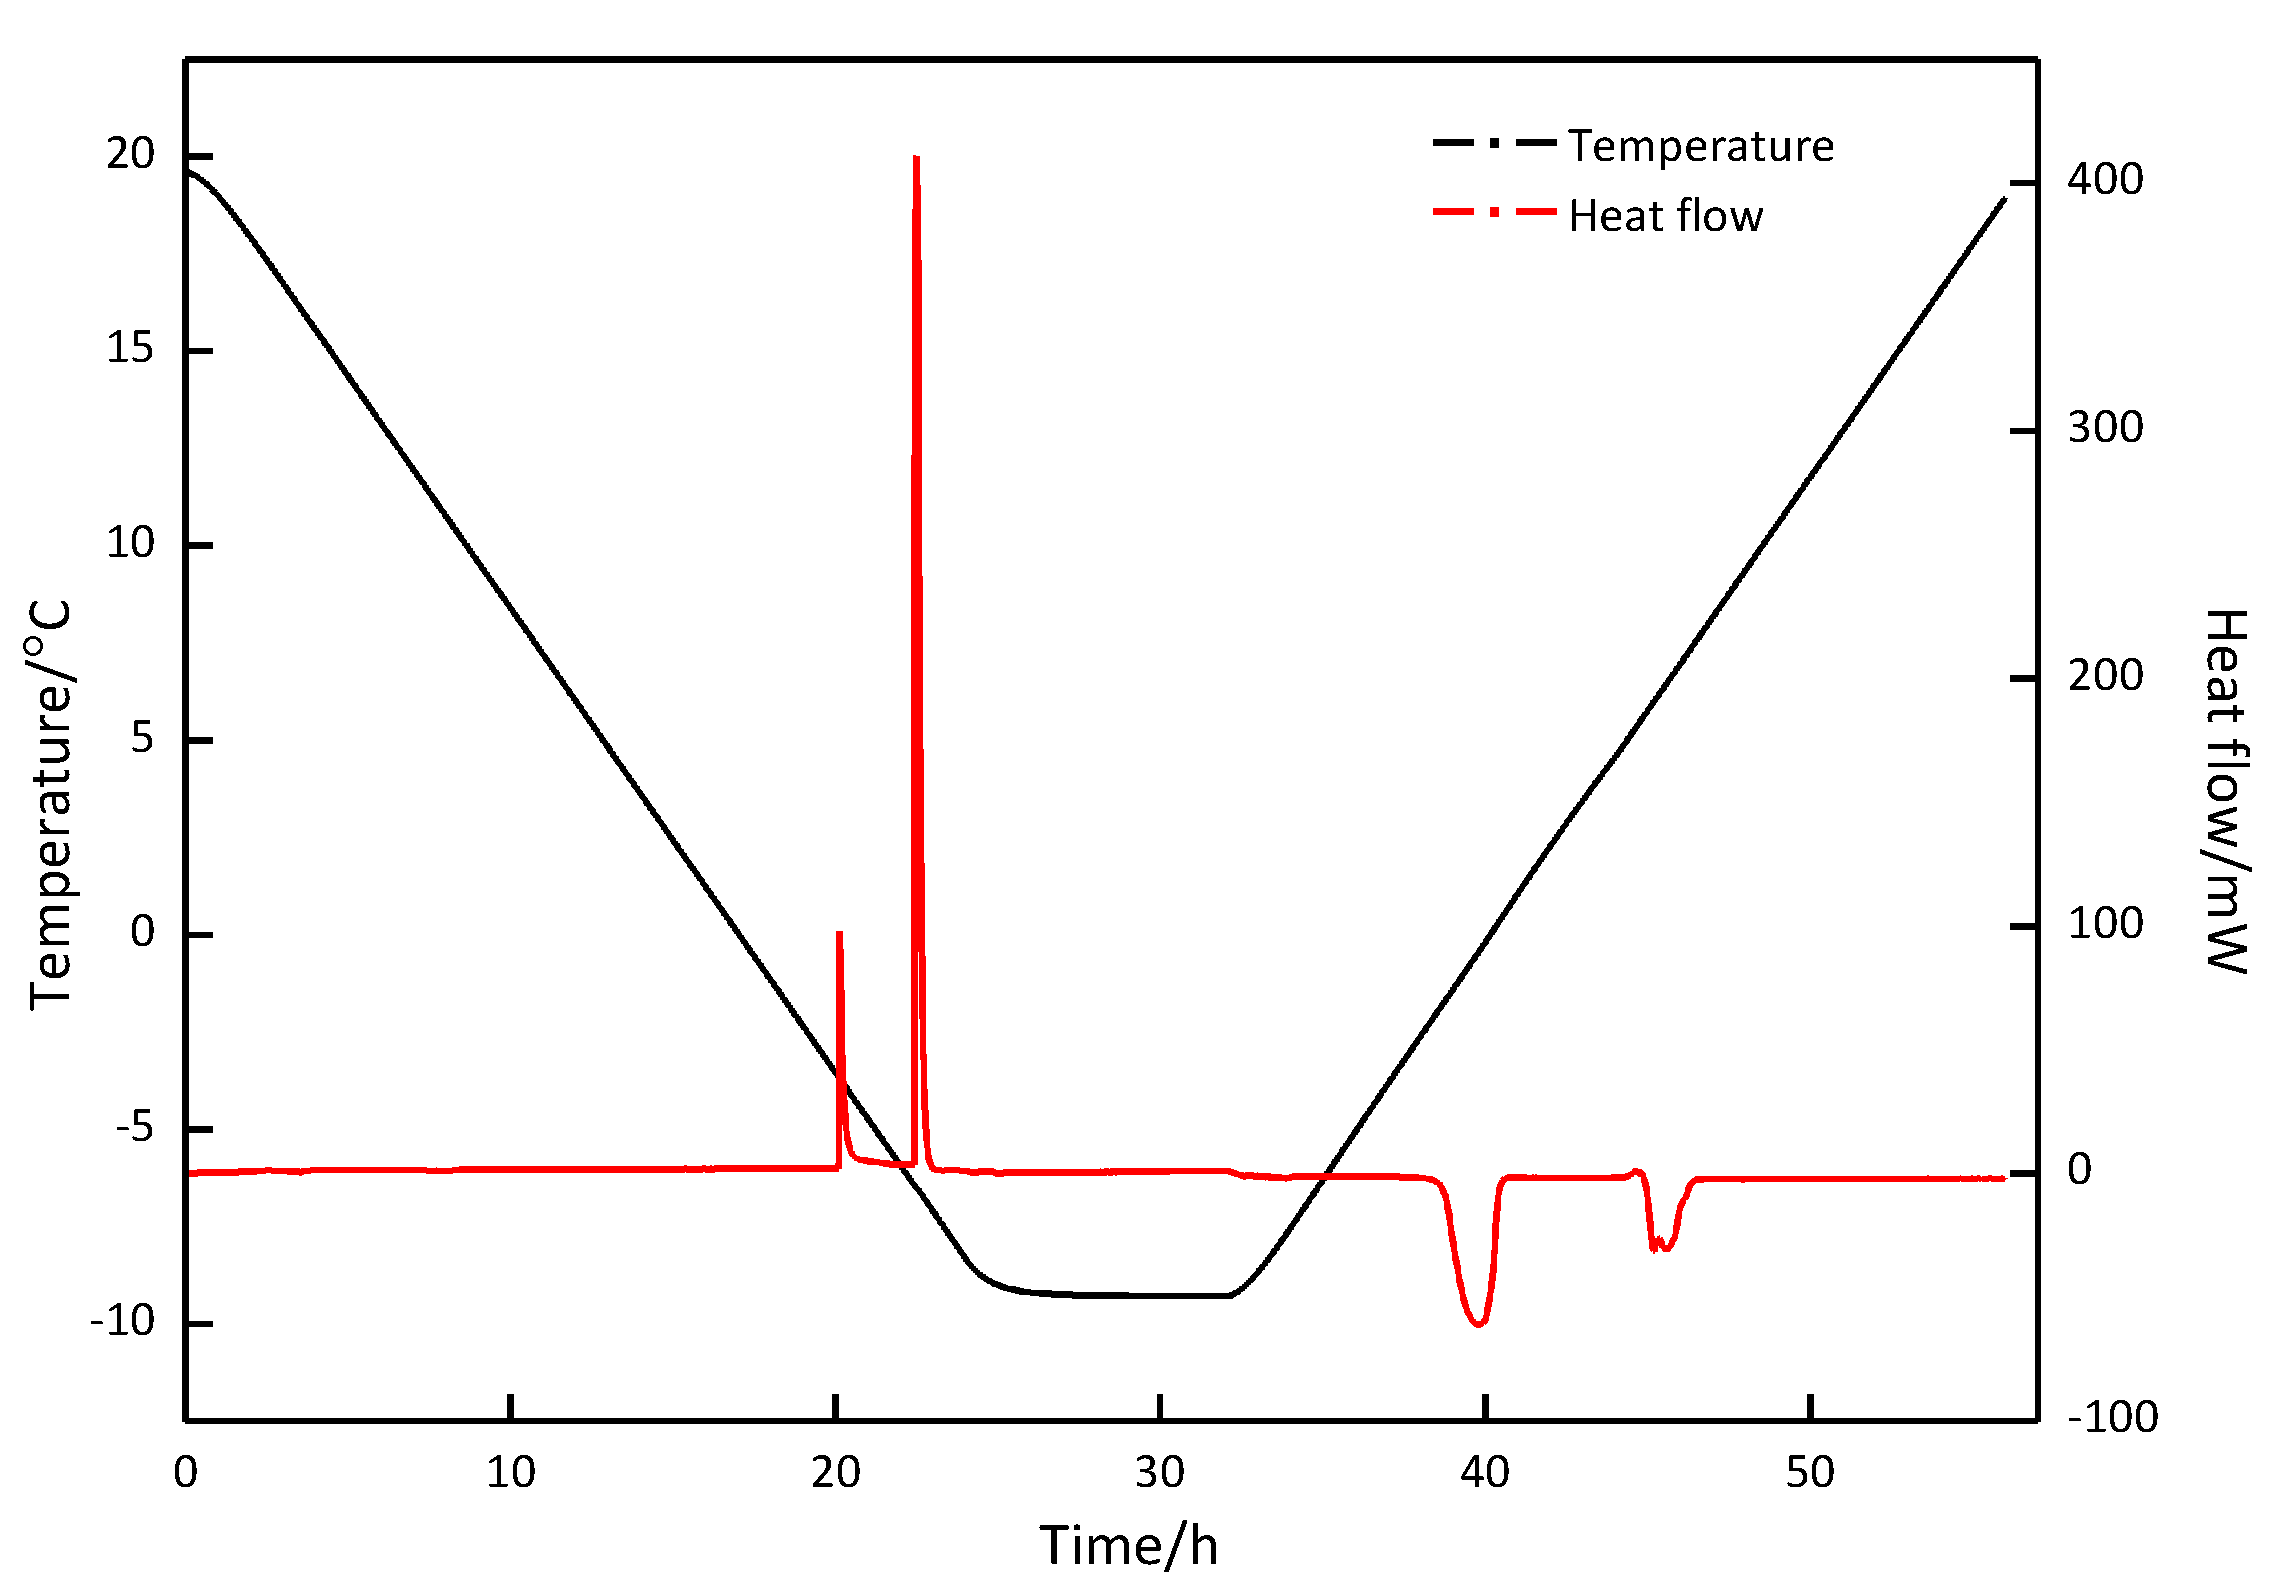
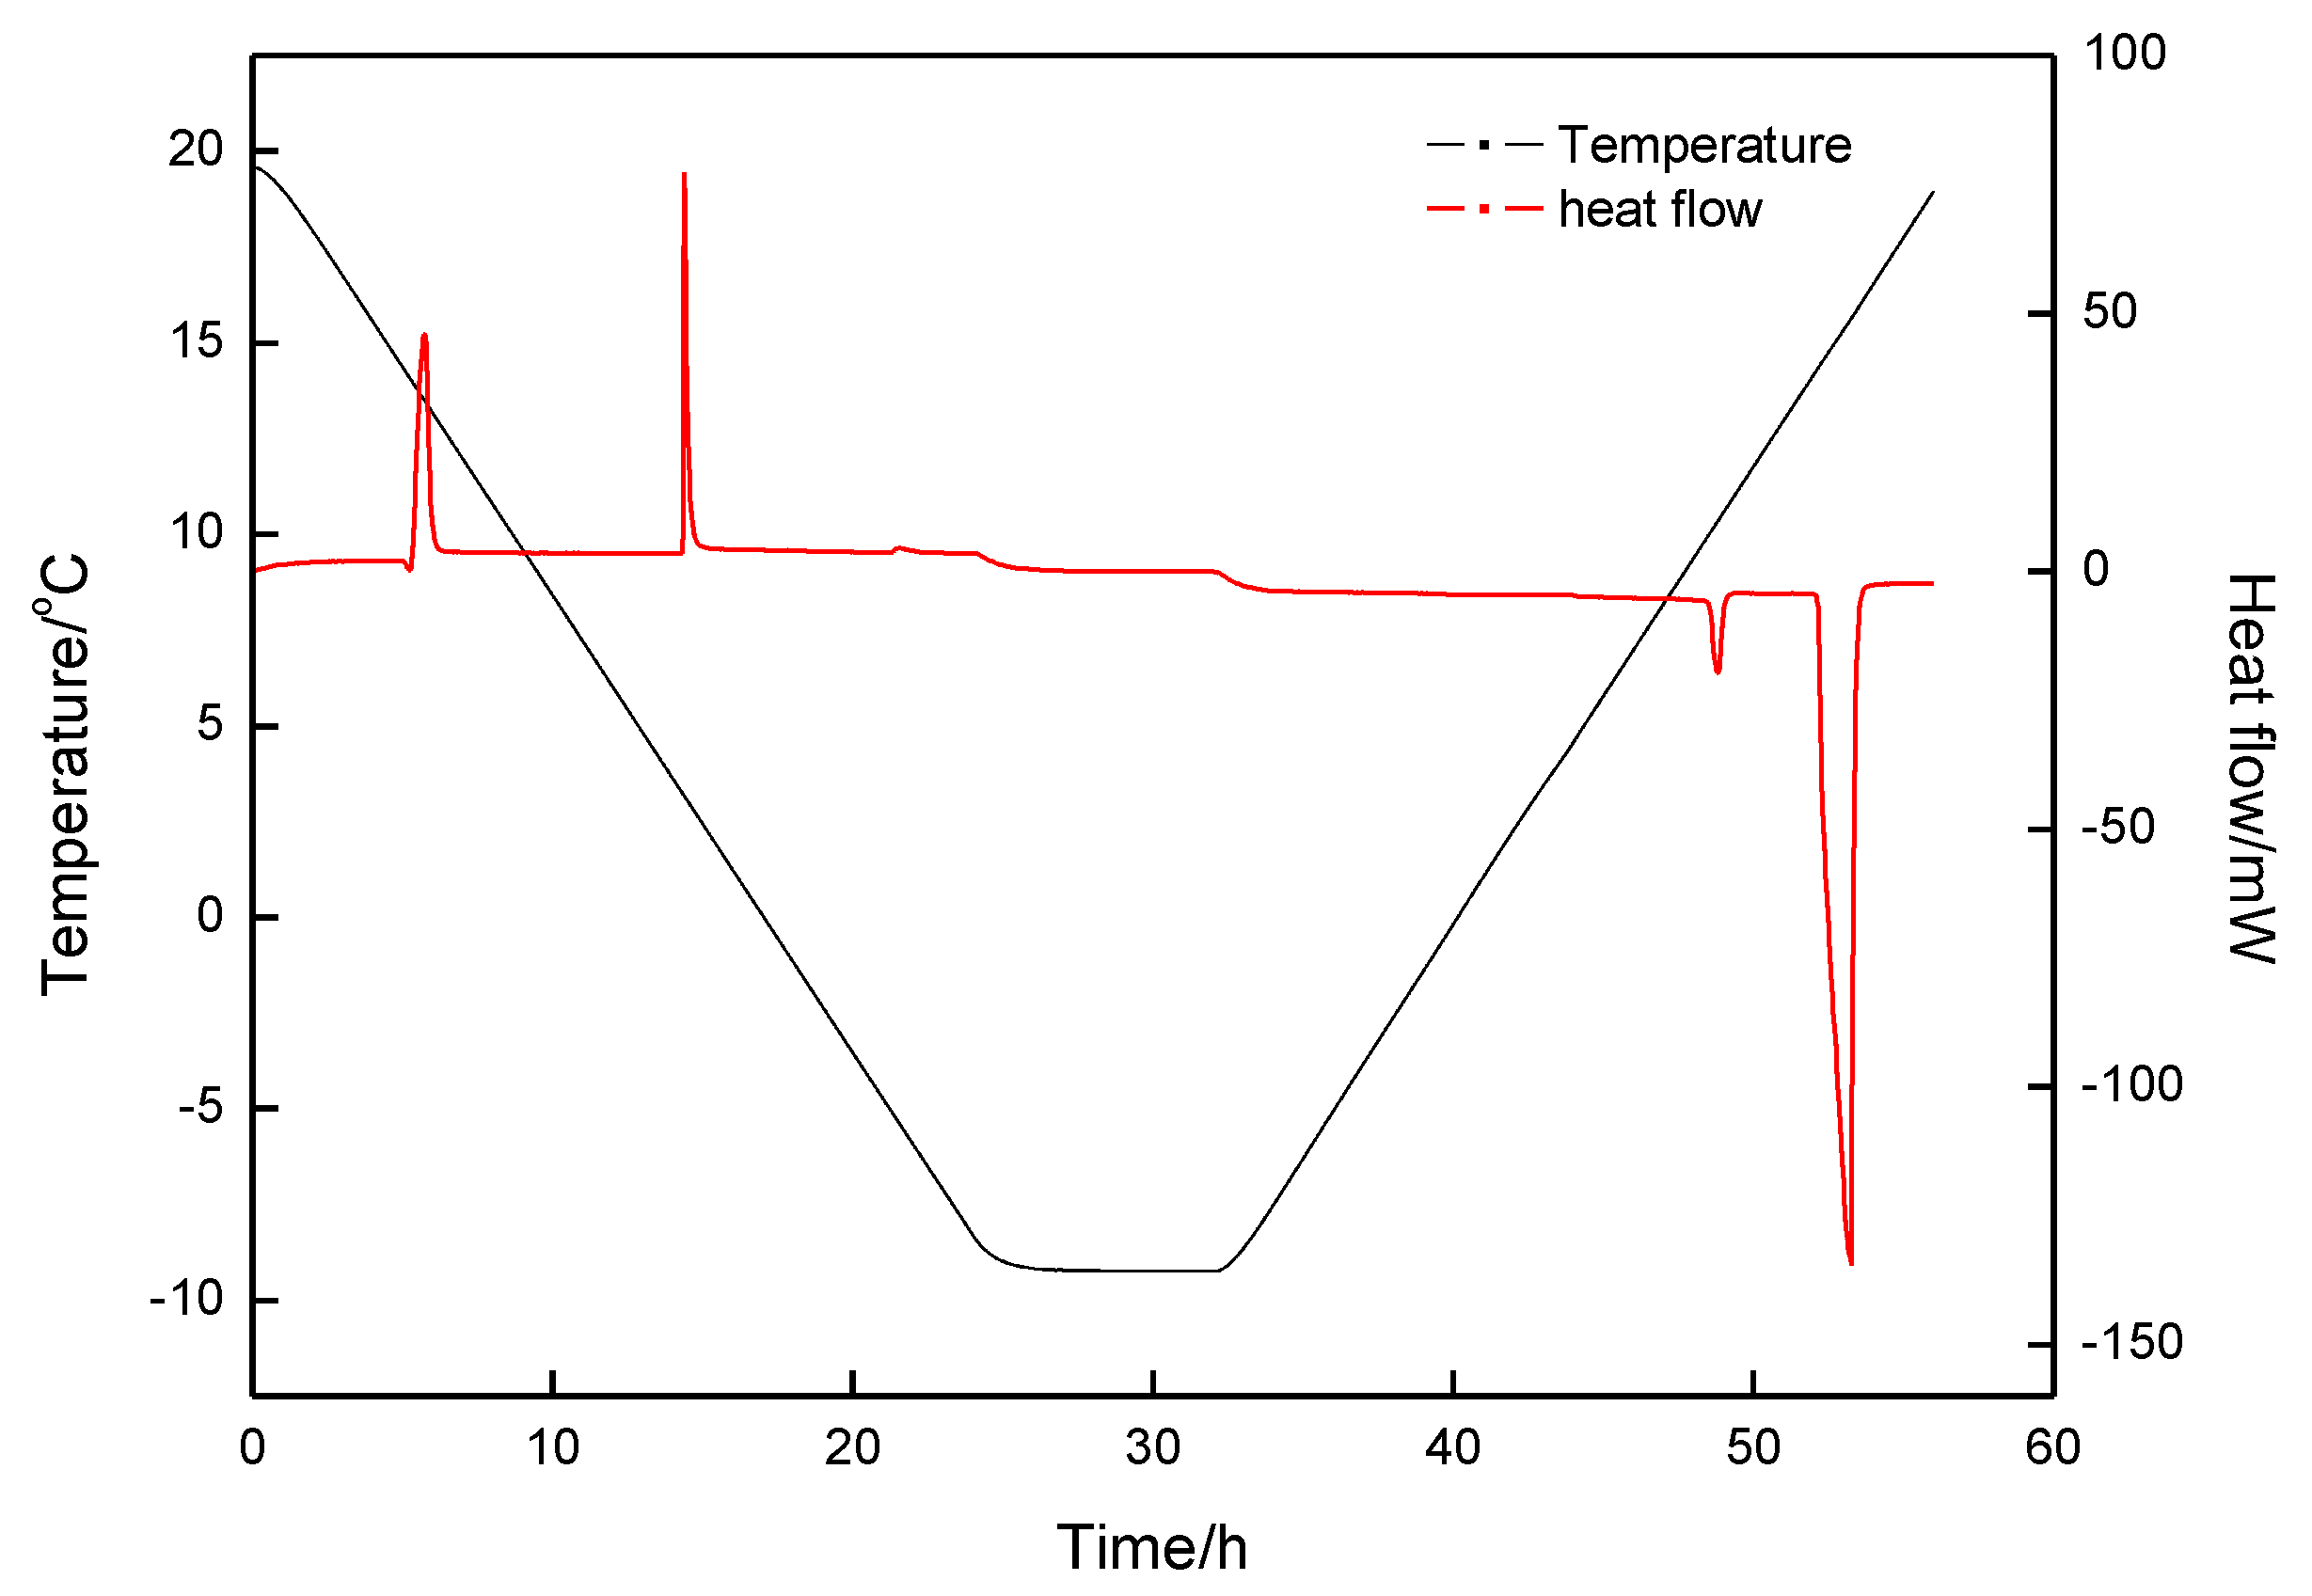
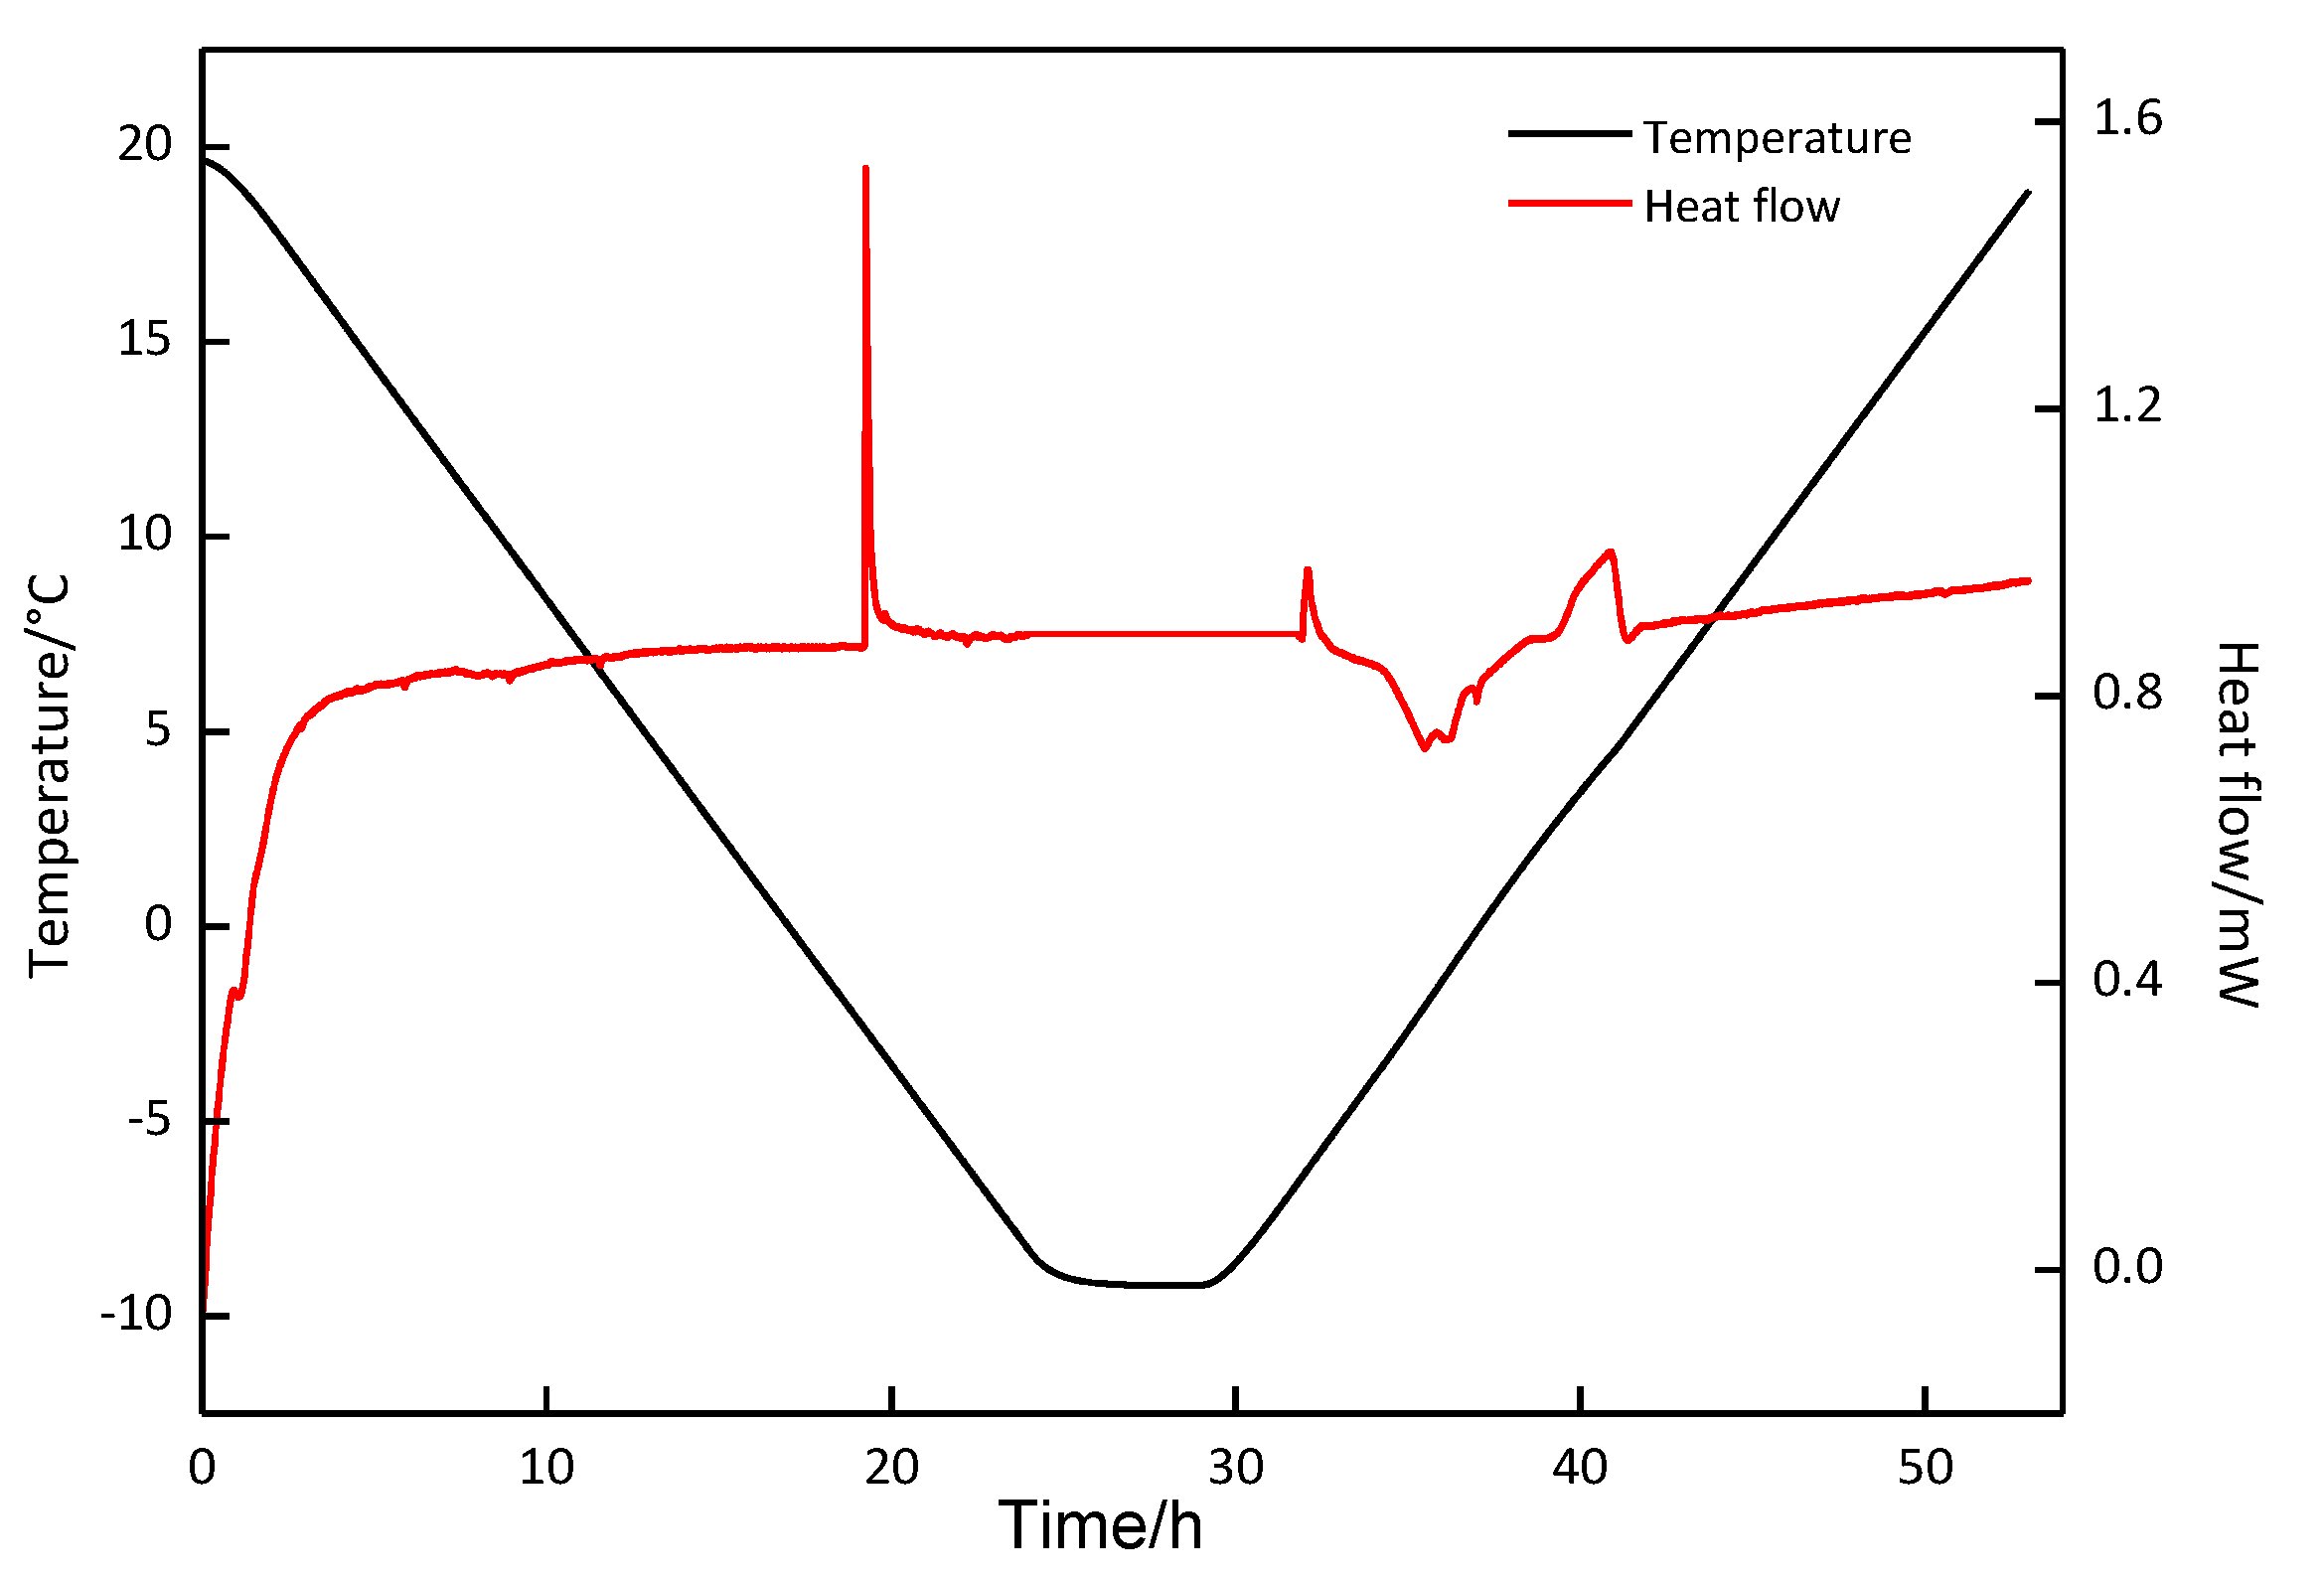
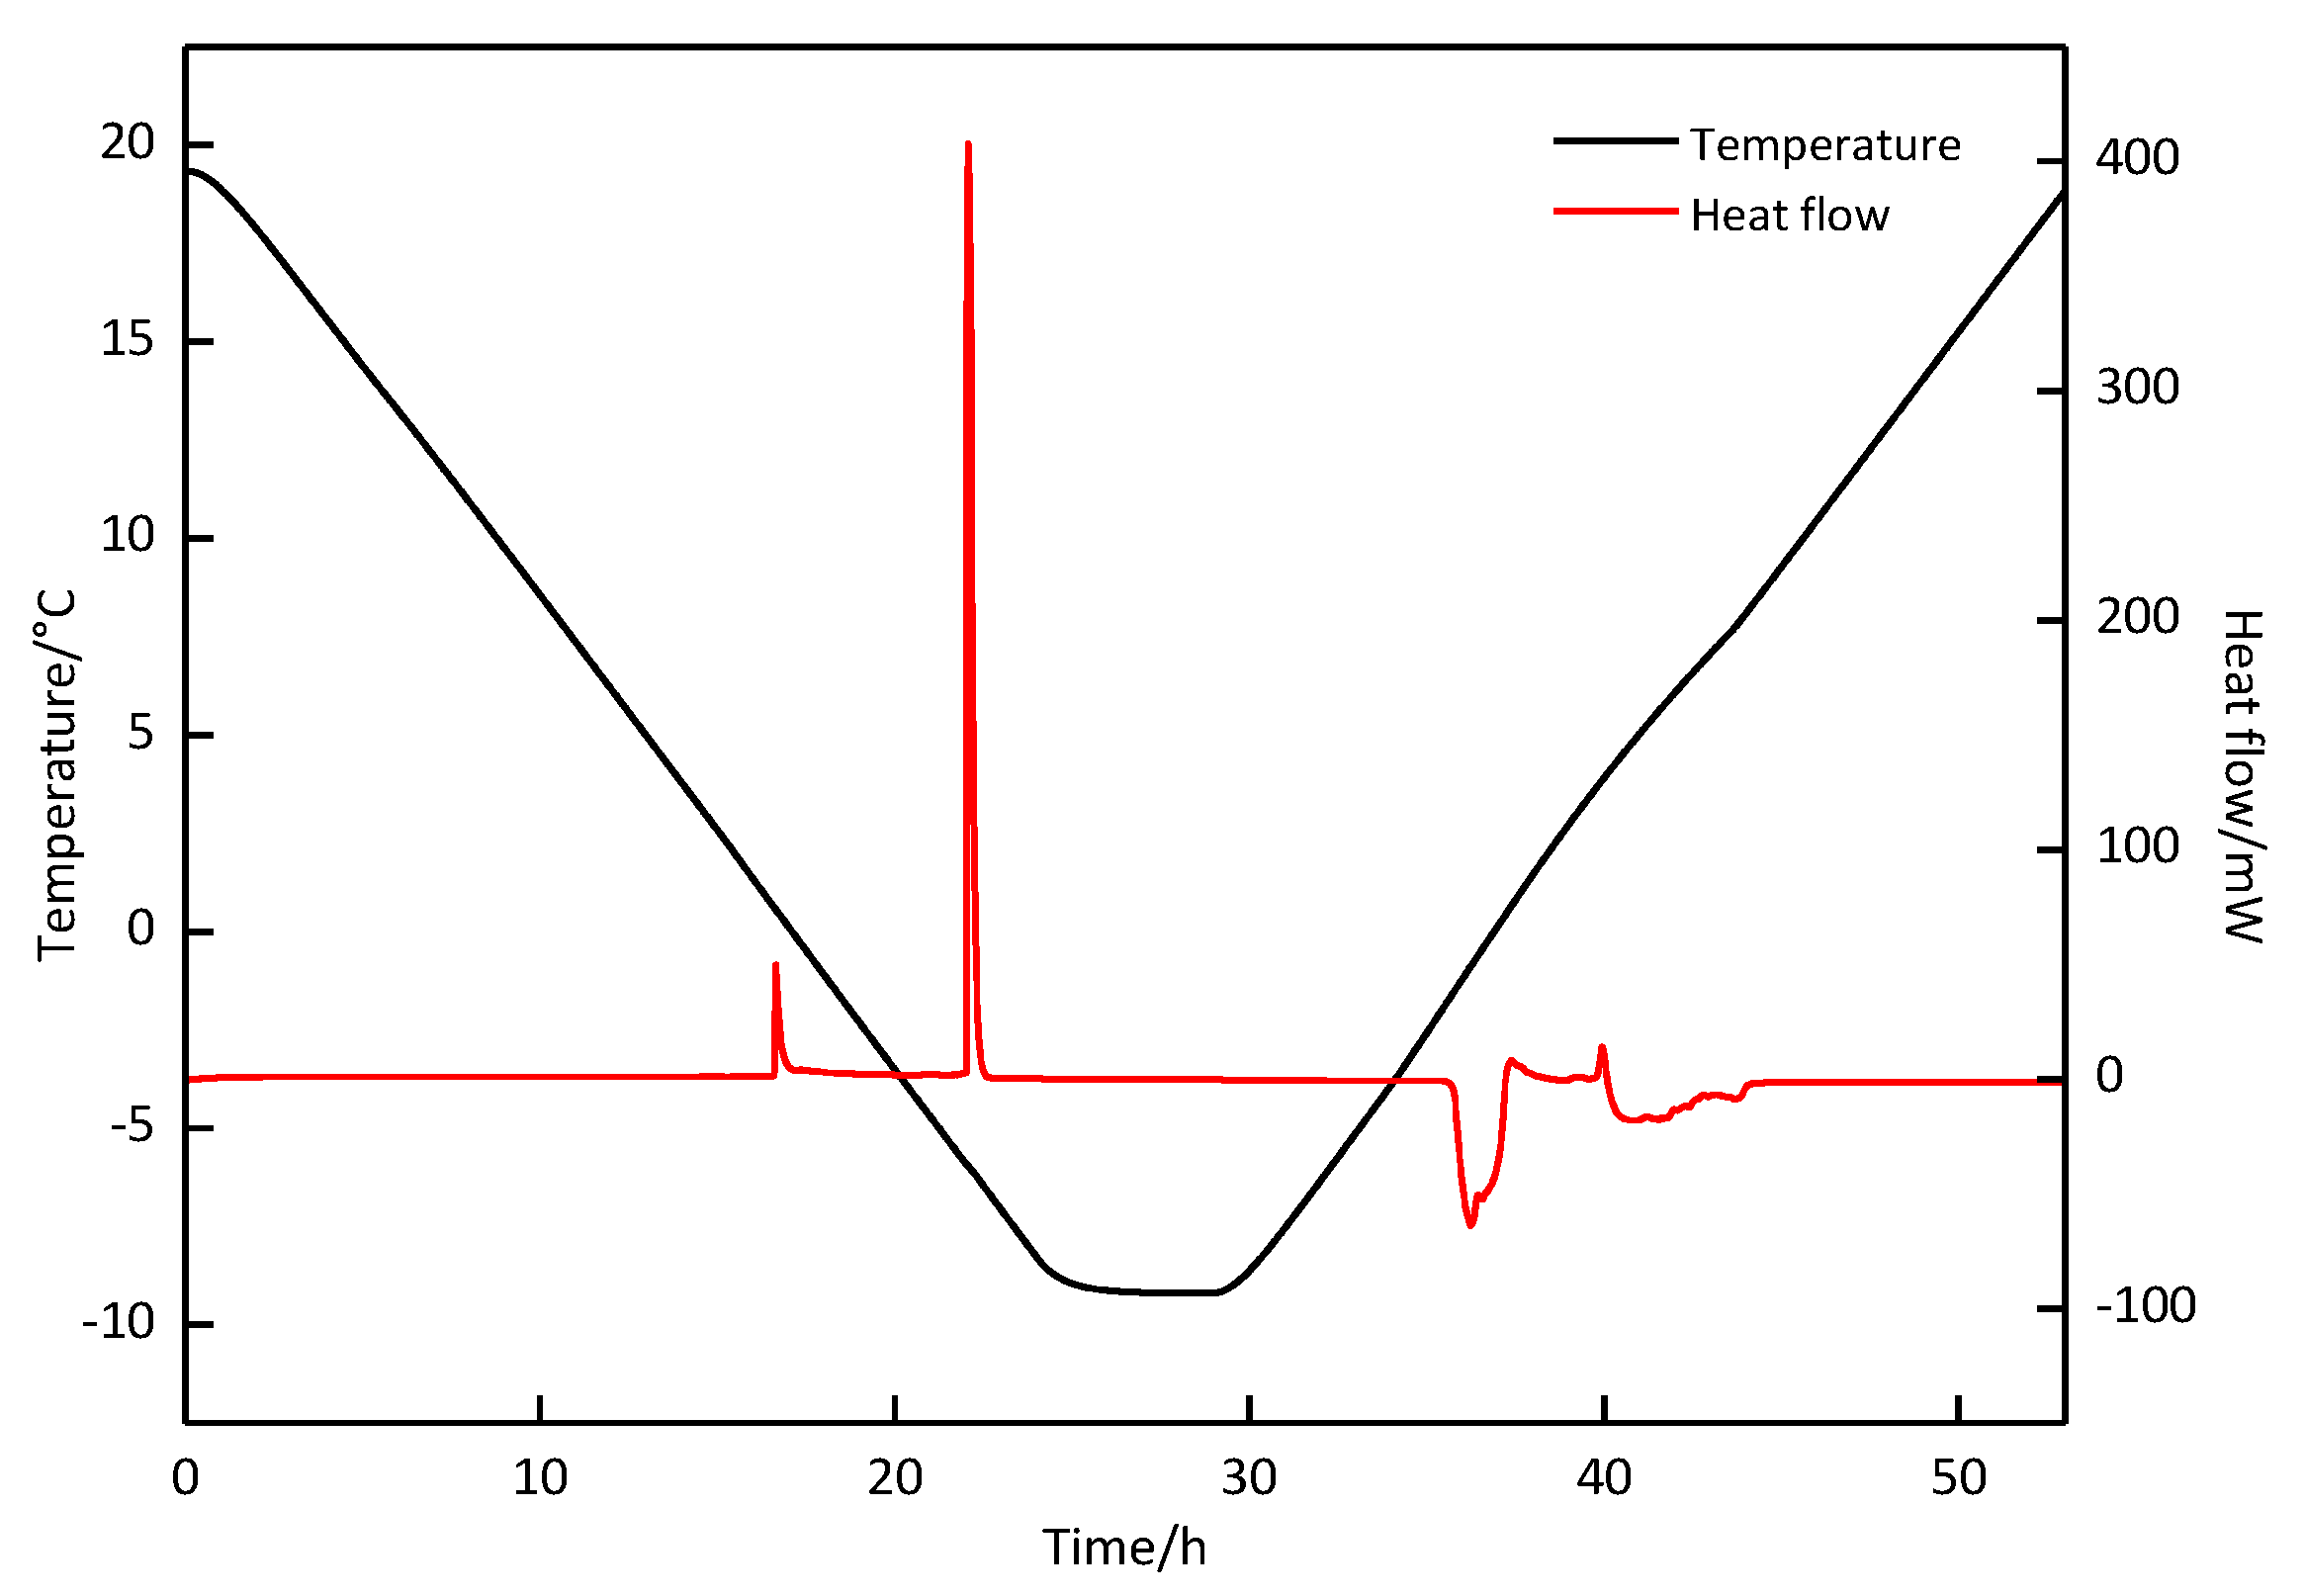
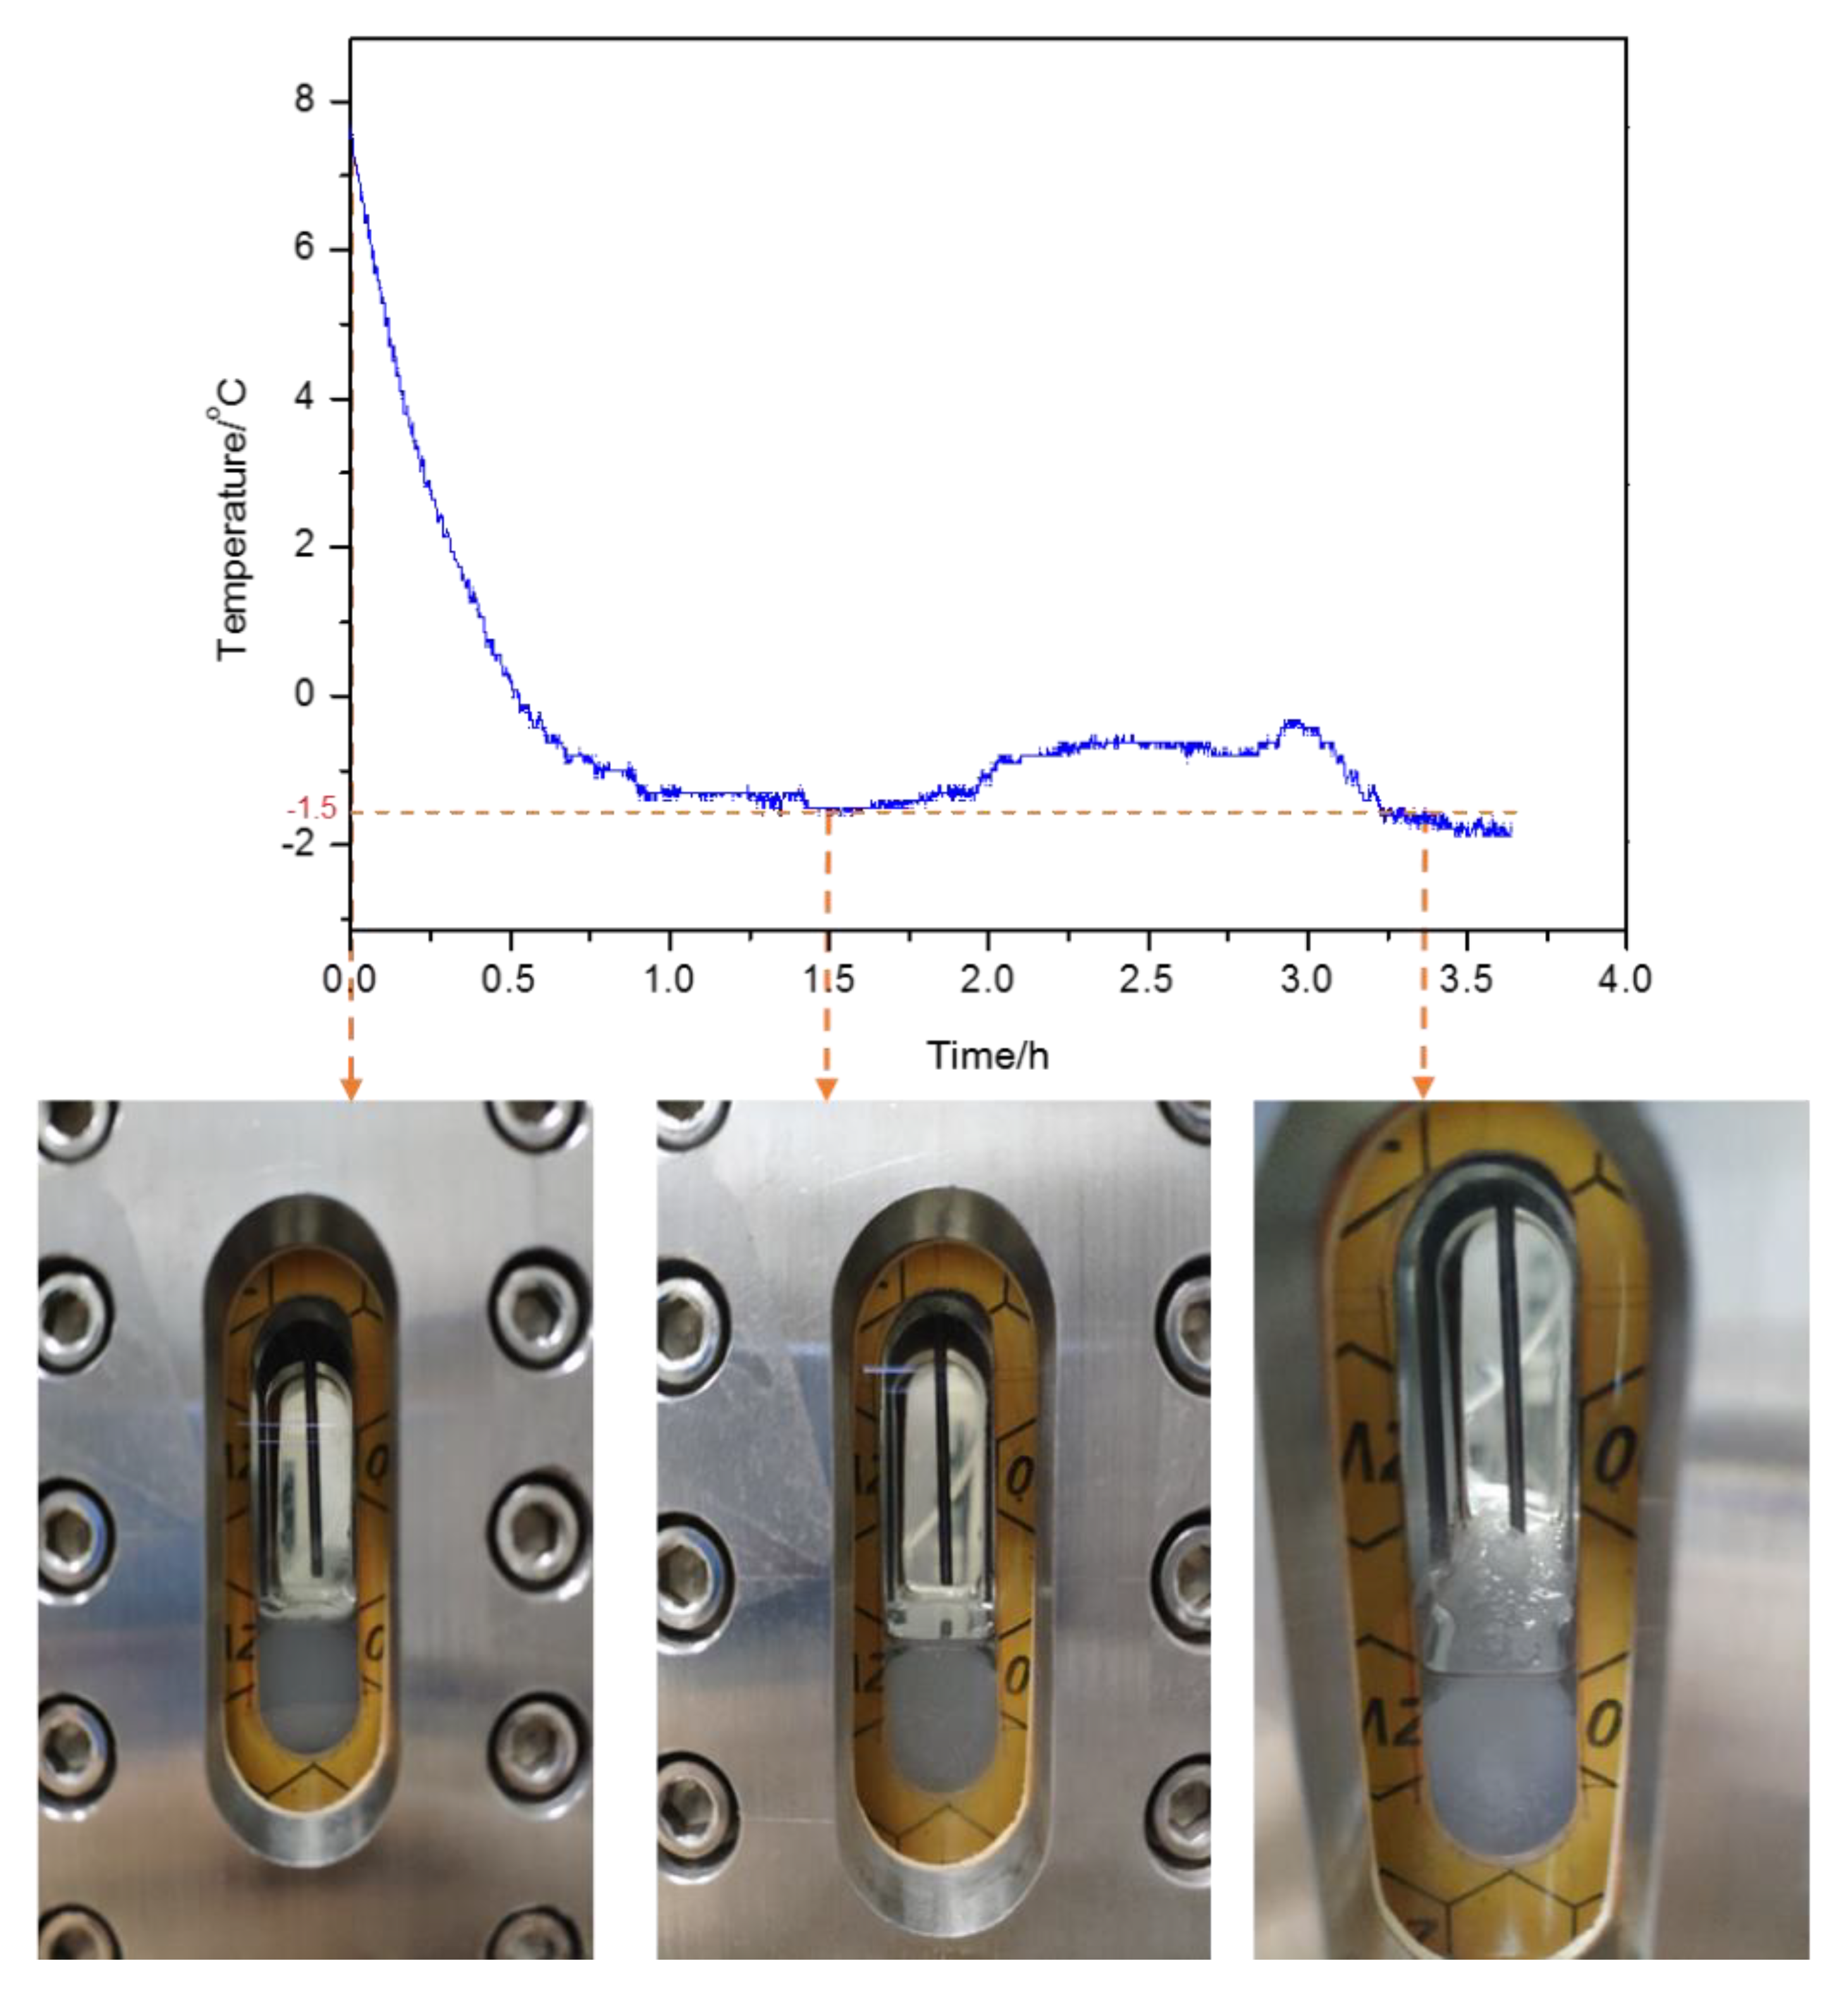
3.1. Analysis of Hydrate Formation Process

First of all, two groups of gas hydrate formation experiments were carried out under different temperature and pressure conditions, and in each group, the same experiment was repeated 3 times. Figure 2 shows the changes of temperature and pressure in the process of CO2 hydrate formation in the presence of CP with initial pressure of 2.5 MPa. Same as other reported figures of pressure-temperature vs. time in the hydrate formation processes, the pressure drops sharply firstly and then becomes stable gradually, and the temperature also remains nearly the same. However, there is a little temperature rise in the time zone where the pressure drops sharply. Actually, the sharp pressure-drop could be attributed to two stages. One is the dissolution of gas, followed by the gas hydrates formation. Because the solubility of gas in solution is very fixed under certain temperature and pressure, especially for those gases with poor solubility or low solubility, the solubility of gas is not the main contributor to pressure drop compared with gas entering hydrate cage. Therefore, it is feasible to use the real gas equation to calculate the gas consumption in the process of gas hydrate formation and then calculate the gas consumption rate to further characterize the relevant hydrate formation kinetics. The equation is shown as following: [52]
Δ n = ( P V z R T ) f ( P V z R T ) 0
where “Δn” is the mole of gas consumed in the hydrate formation or entering the hydrate slurry, and “P”, “V”, “T” are the pressure, volume, temperature of the gas phase in the reactor, respectively. In this work, it is assumed the liquid and hydrate are incompressible. “R” is the gas constant, and “z” is the compressibility factor. The subscript “0” and “f” indicate the starting time and ending time of the hydrate formation, respectively.
As shown in Figure 2, the total gas consumption per mole water is 0.0187 mol−1, and there are two obvious pressure platforms (I and II) over time. According to the trend of the pressure-drop in the figure, the whole pressure drop process is divided into two stages, the first stage (stage I) and the second stage (stage II) with two platforms as the boundary, respectively. The stage I, from 0 to 174 min, is defined as the first hydrate formation platform. And at this stage, there are two processes, including gas dissolution followed by the hydrate formation. The second stage, from the 174th minute to the end of hydrate formation, is the hydrate secondary formation platform. At this stage, a large amount of gas is consumed, but the average gas consumption is relatively slower than that at the stage I. The second platform indicates the existence of hydrate secondary generation in the system. Figure 3 shows the temperature and pressure changes over time in the process of CO2 hydrate formation in the presence of CP with initial pressure of 5.0 MPa. As shown, the general trend of pressure change is similar to Figure 2, and there are two pressure platforms and the pressure-drop rate at the stage II is slower than that at the stage I. Therefore, it also shows that there is a secondary hydrate formation at 5.0 MPa. Unlike Figure 2, the first stage in Figure 3 has a higher pressure drop rate and a shorter time for the second pressure to fall to steady. Additionally different from Figure 2, the pressure drop rate of the first stage in Figure 3 is higher, and the time for the second pressure to fall to stability is shorter, which shows that the increase of pressure is more conducive to the first formation of gas hydrate. In fact, in a fixed system, the pressure-drop is completely caused by the gas consumption in the process of gas hydrate formation. Therefore, in the later content, we use gas consumption instead of pressure-drop. As our previous study [53], the gas consumption at the second stage is slower than that at the first stage, which is mainly due to the hydrate formed at the first stage hinders the gas diffusion at the second stage. However, the diagram only reflects the P-V-T change rule of hydrate formation process, so it can only judge the existence of secondary formation in the whole process, but it is not clear about the information of hydrate structure, composition and thermodynamic characteristics in the hydrate secondary formation. We combine DSC experiment with Raman analysis to obtain these information and show it in the following content.

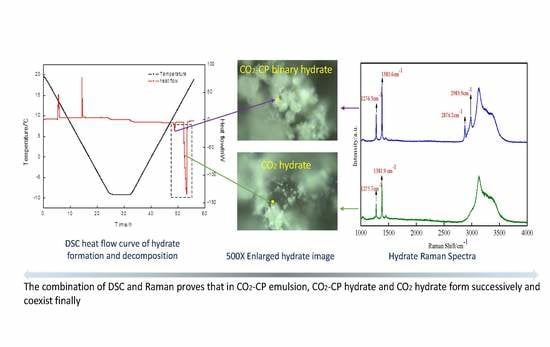
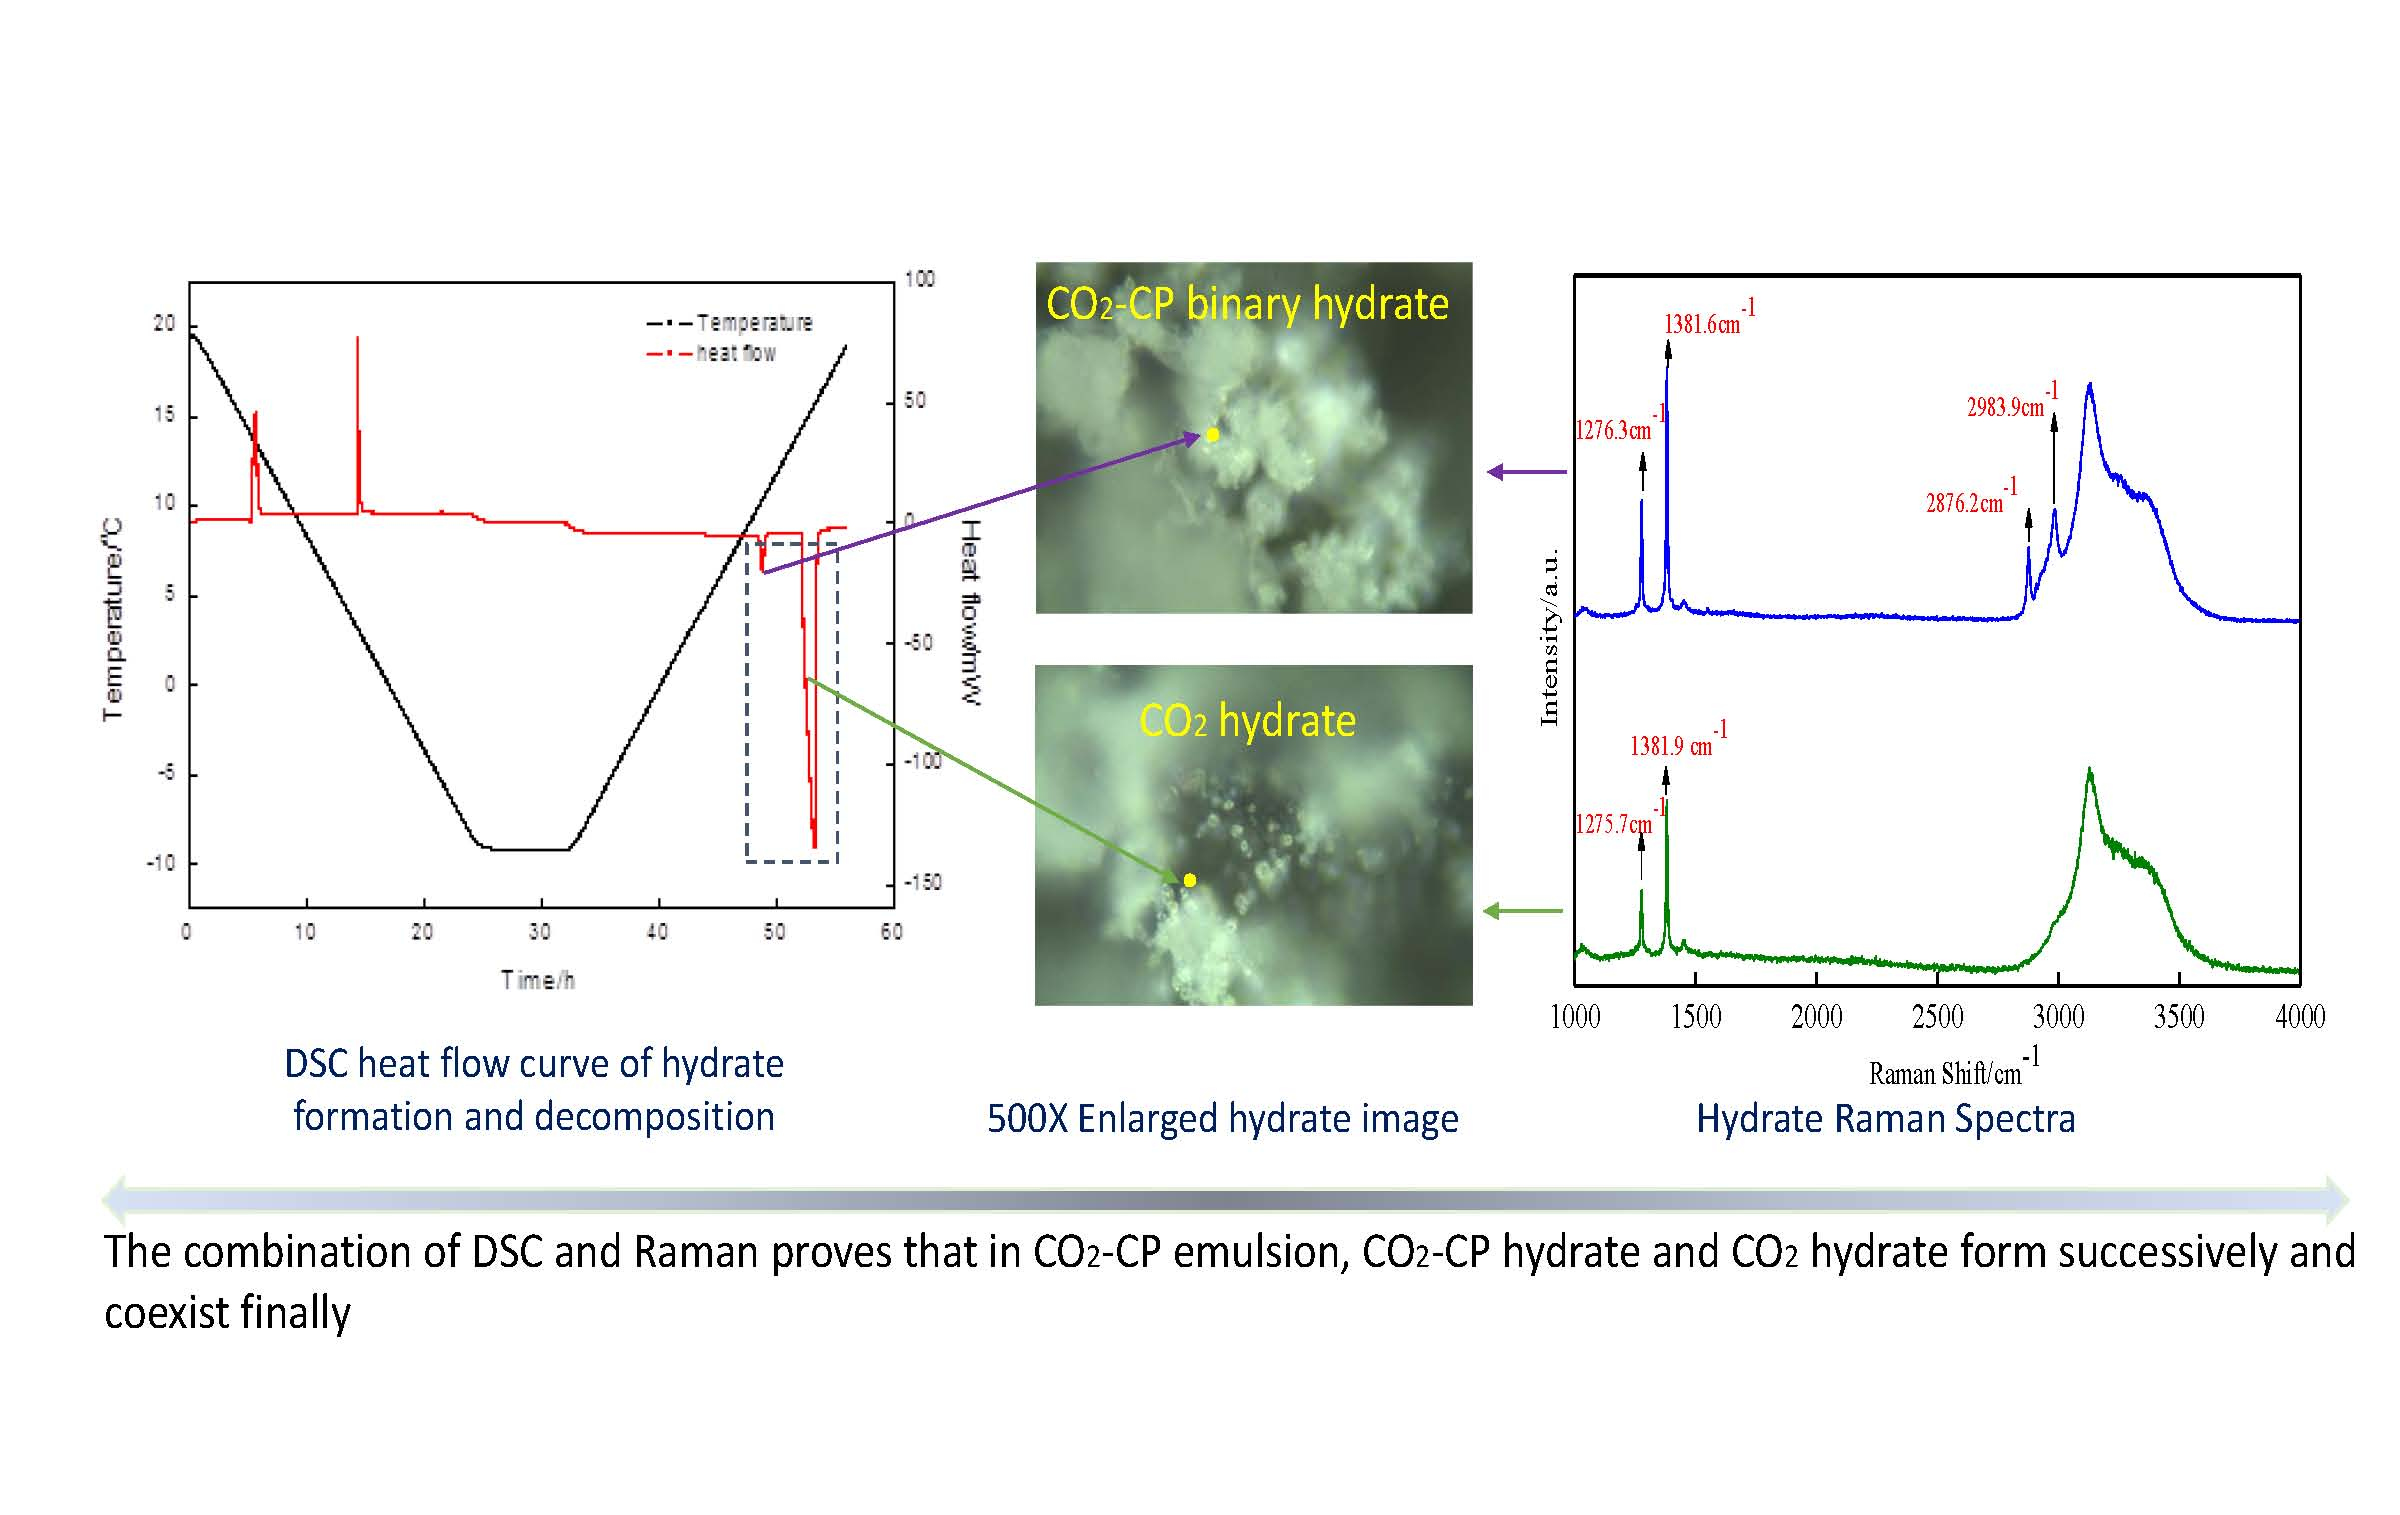
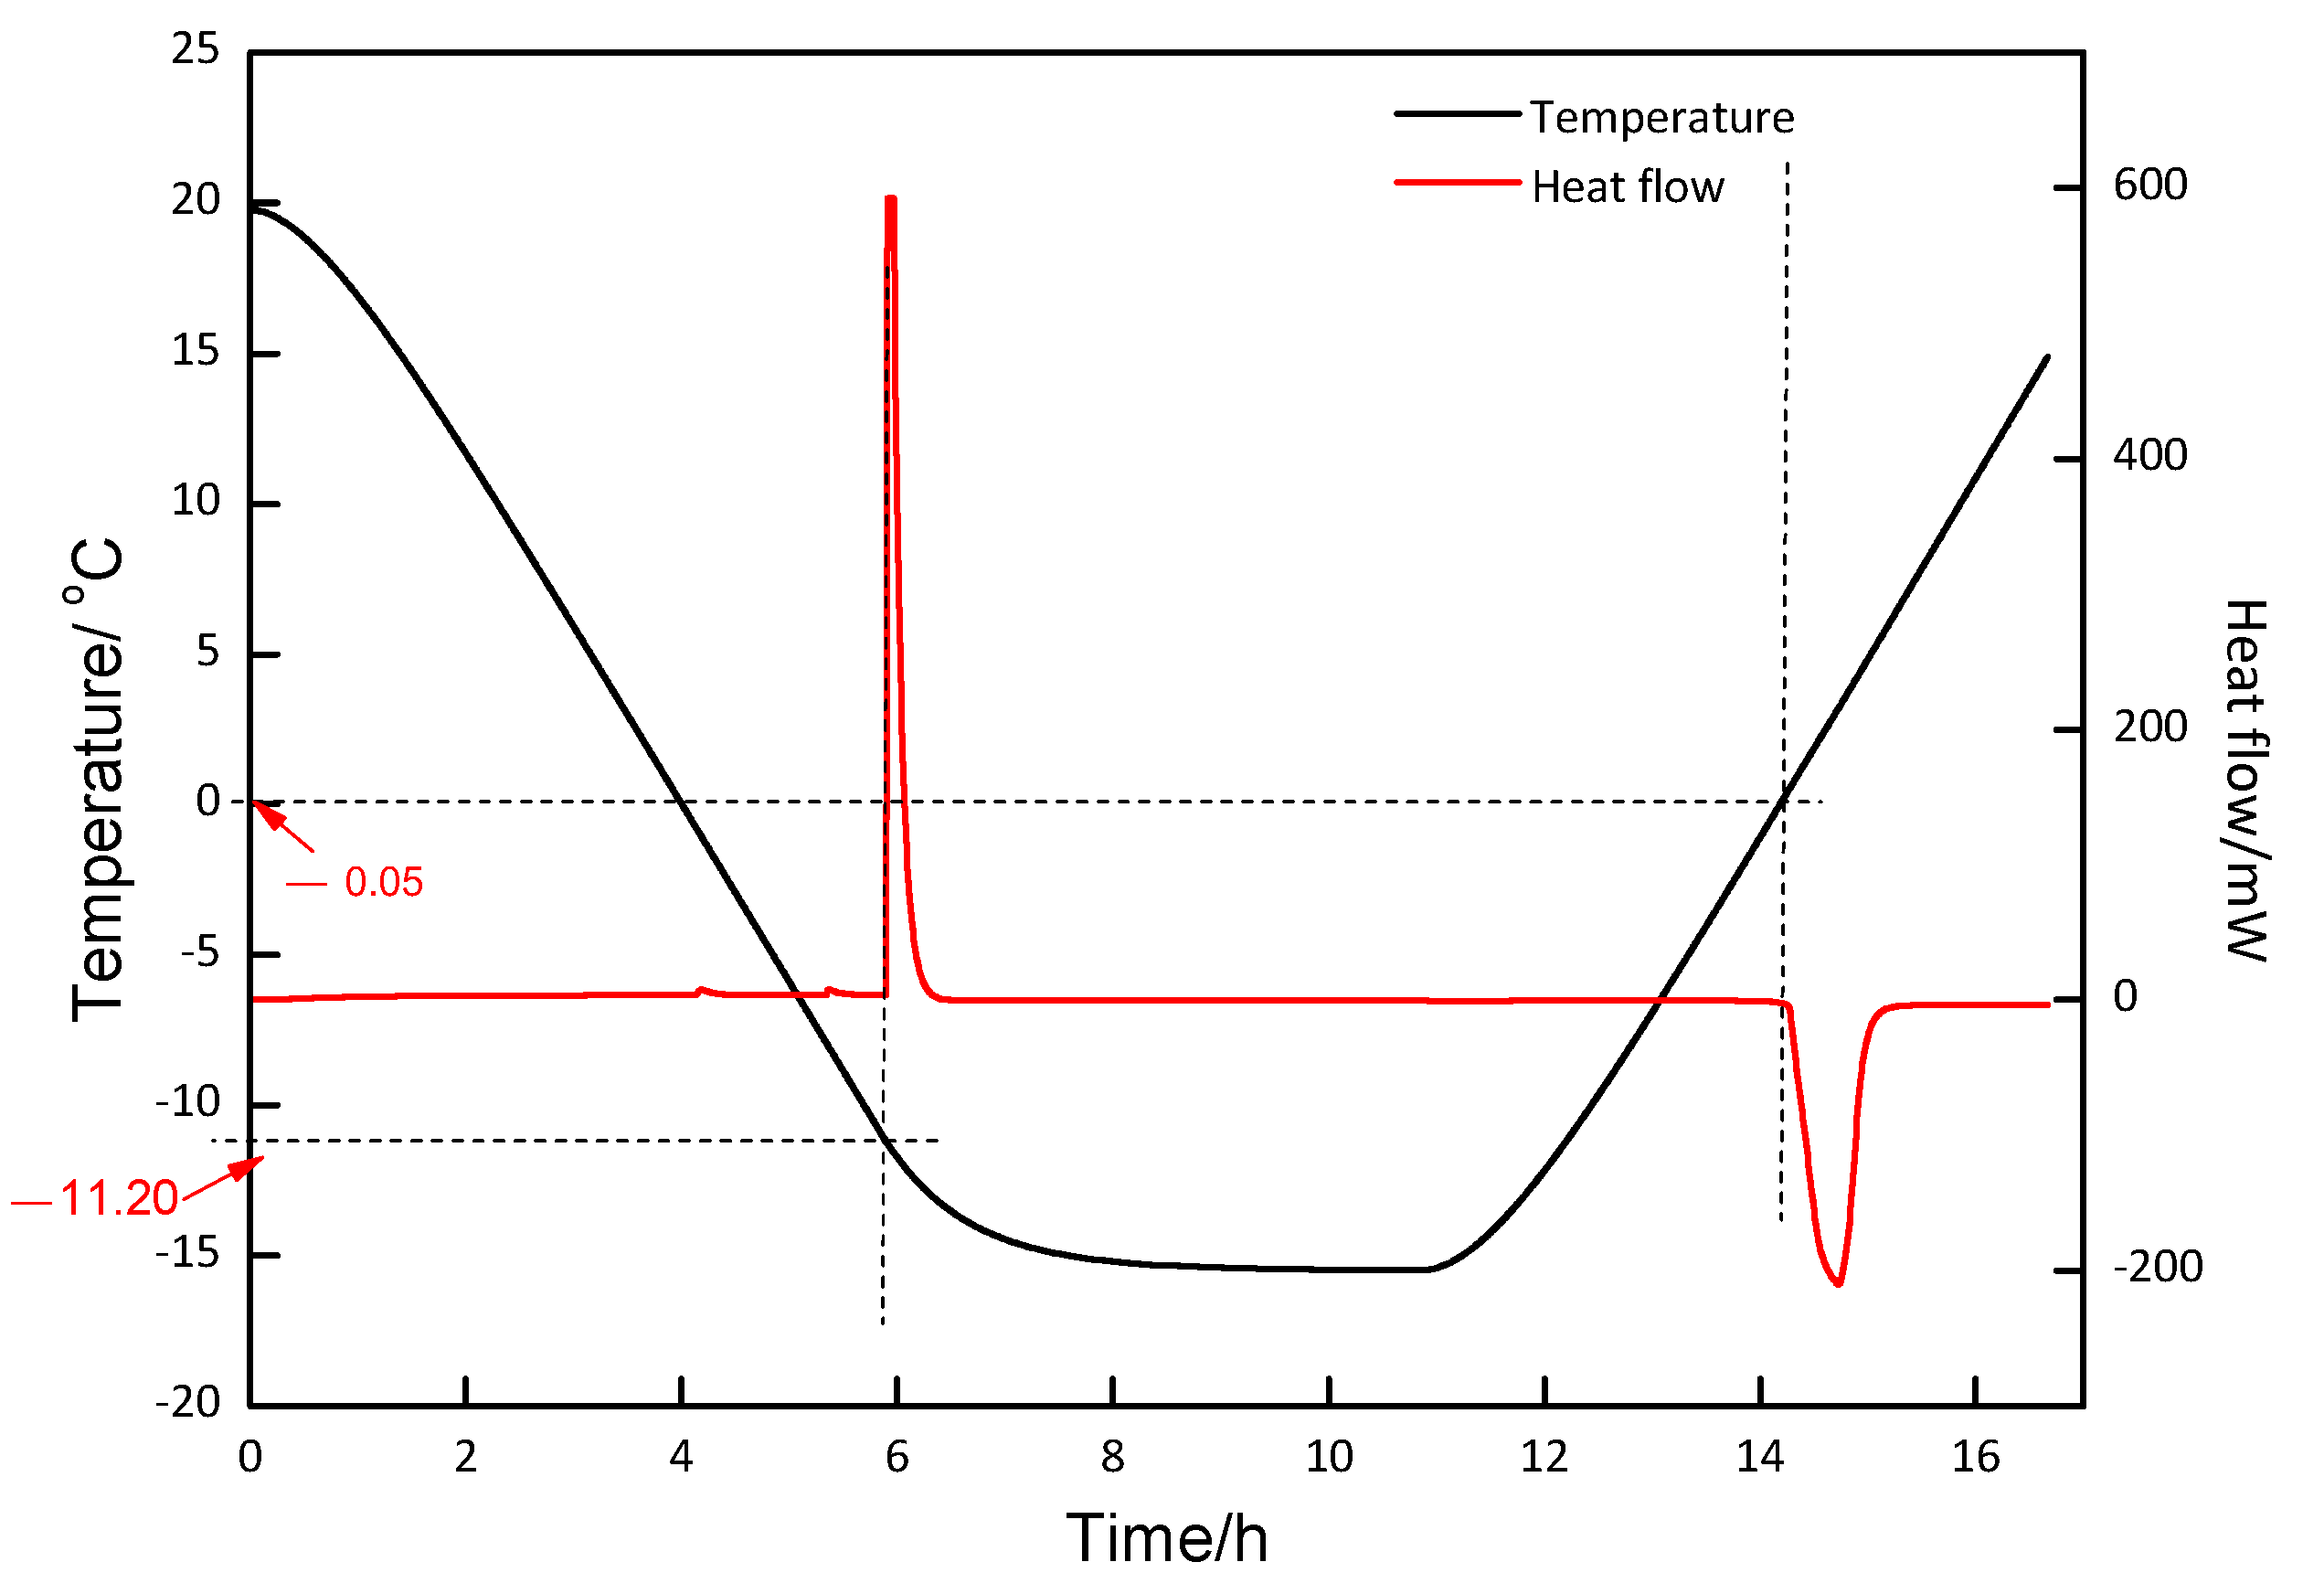
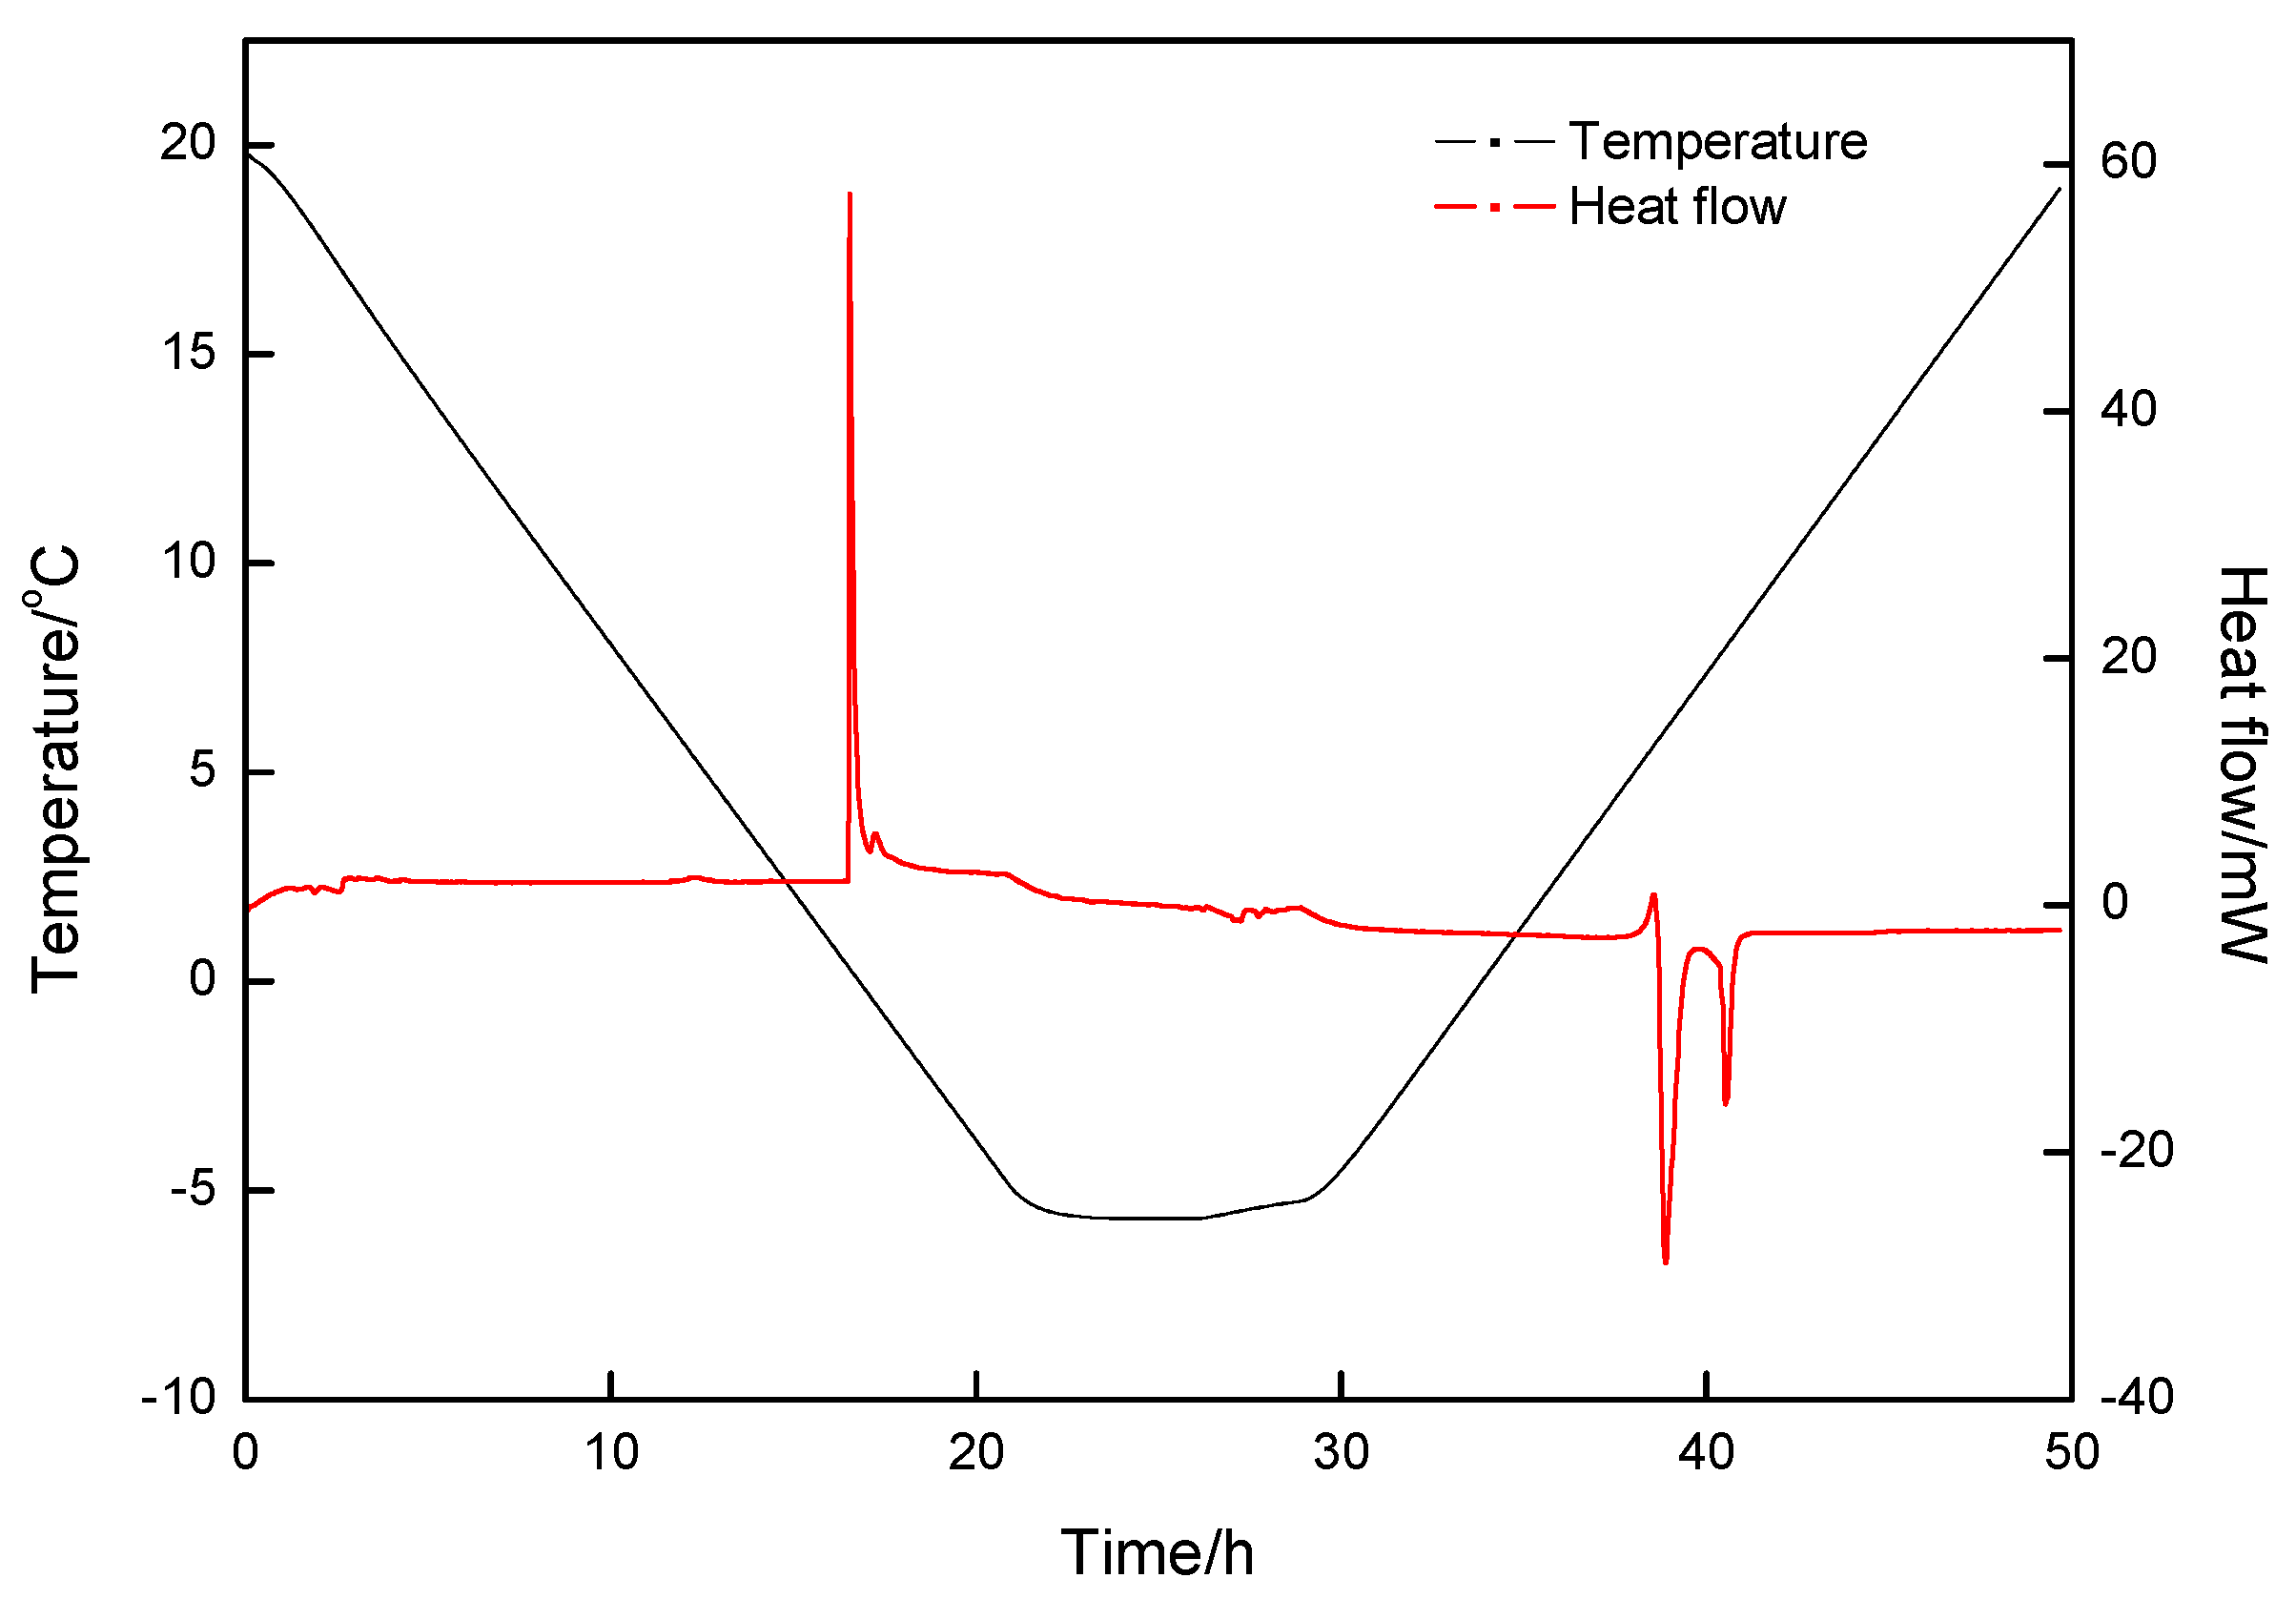
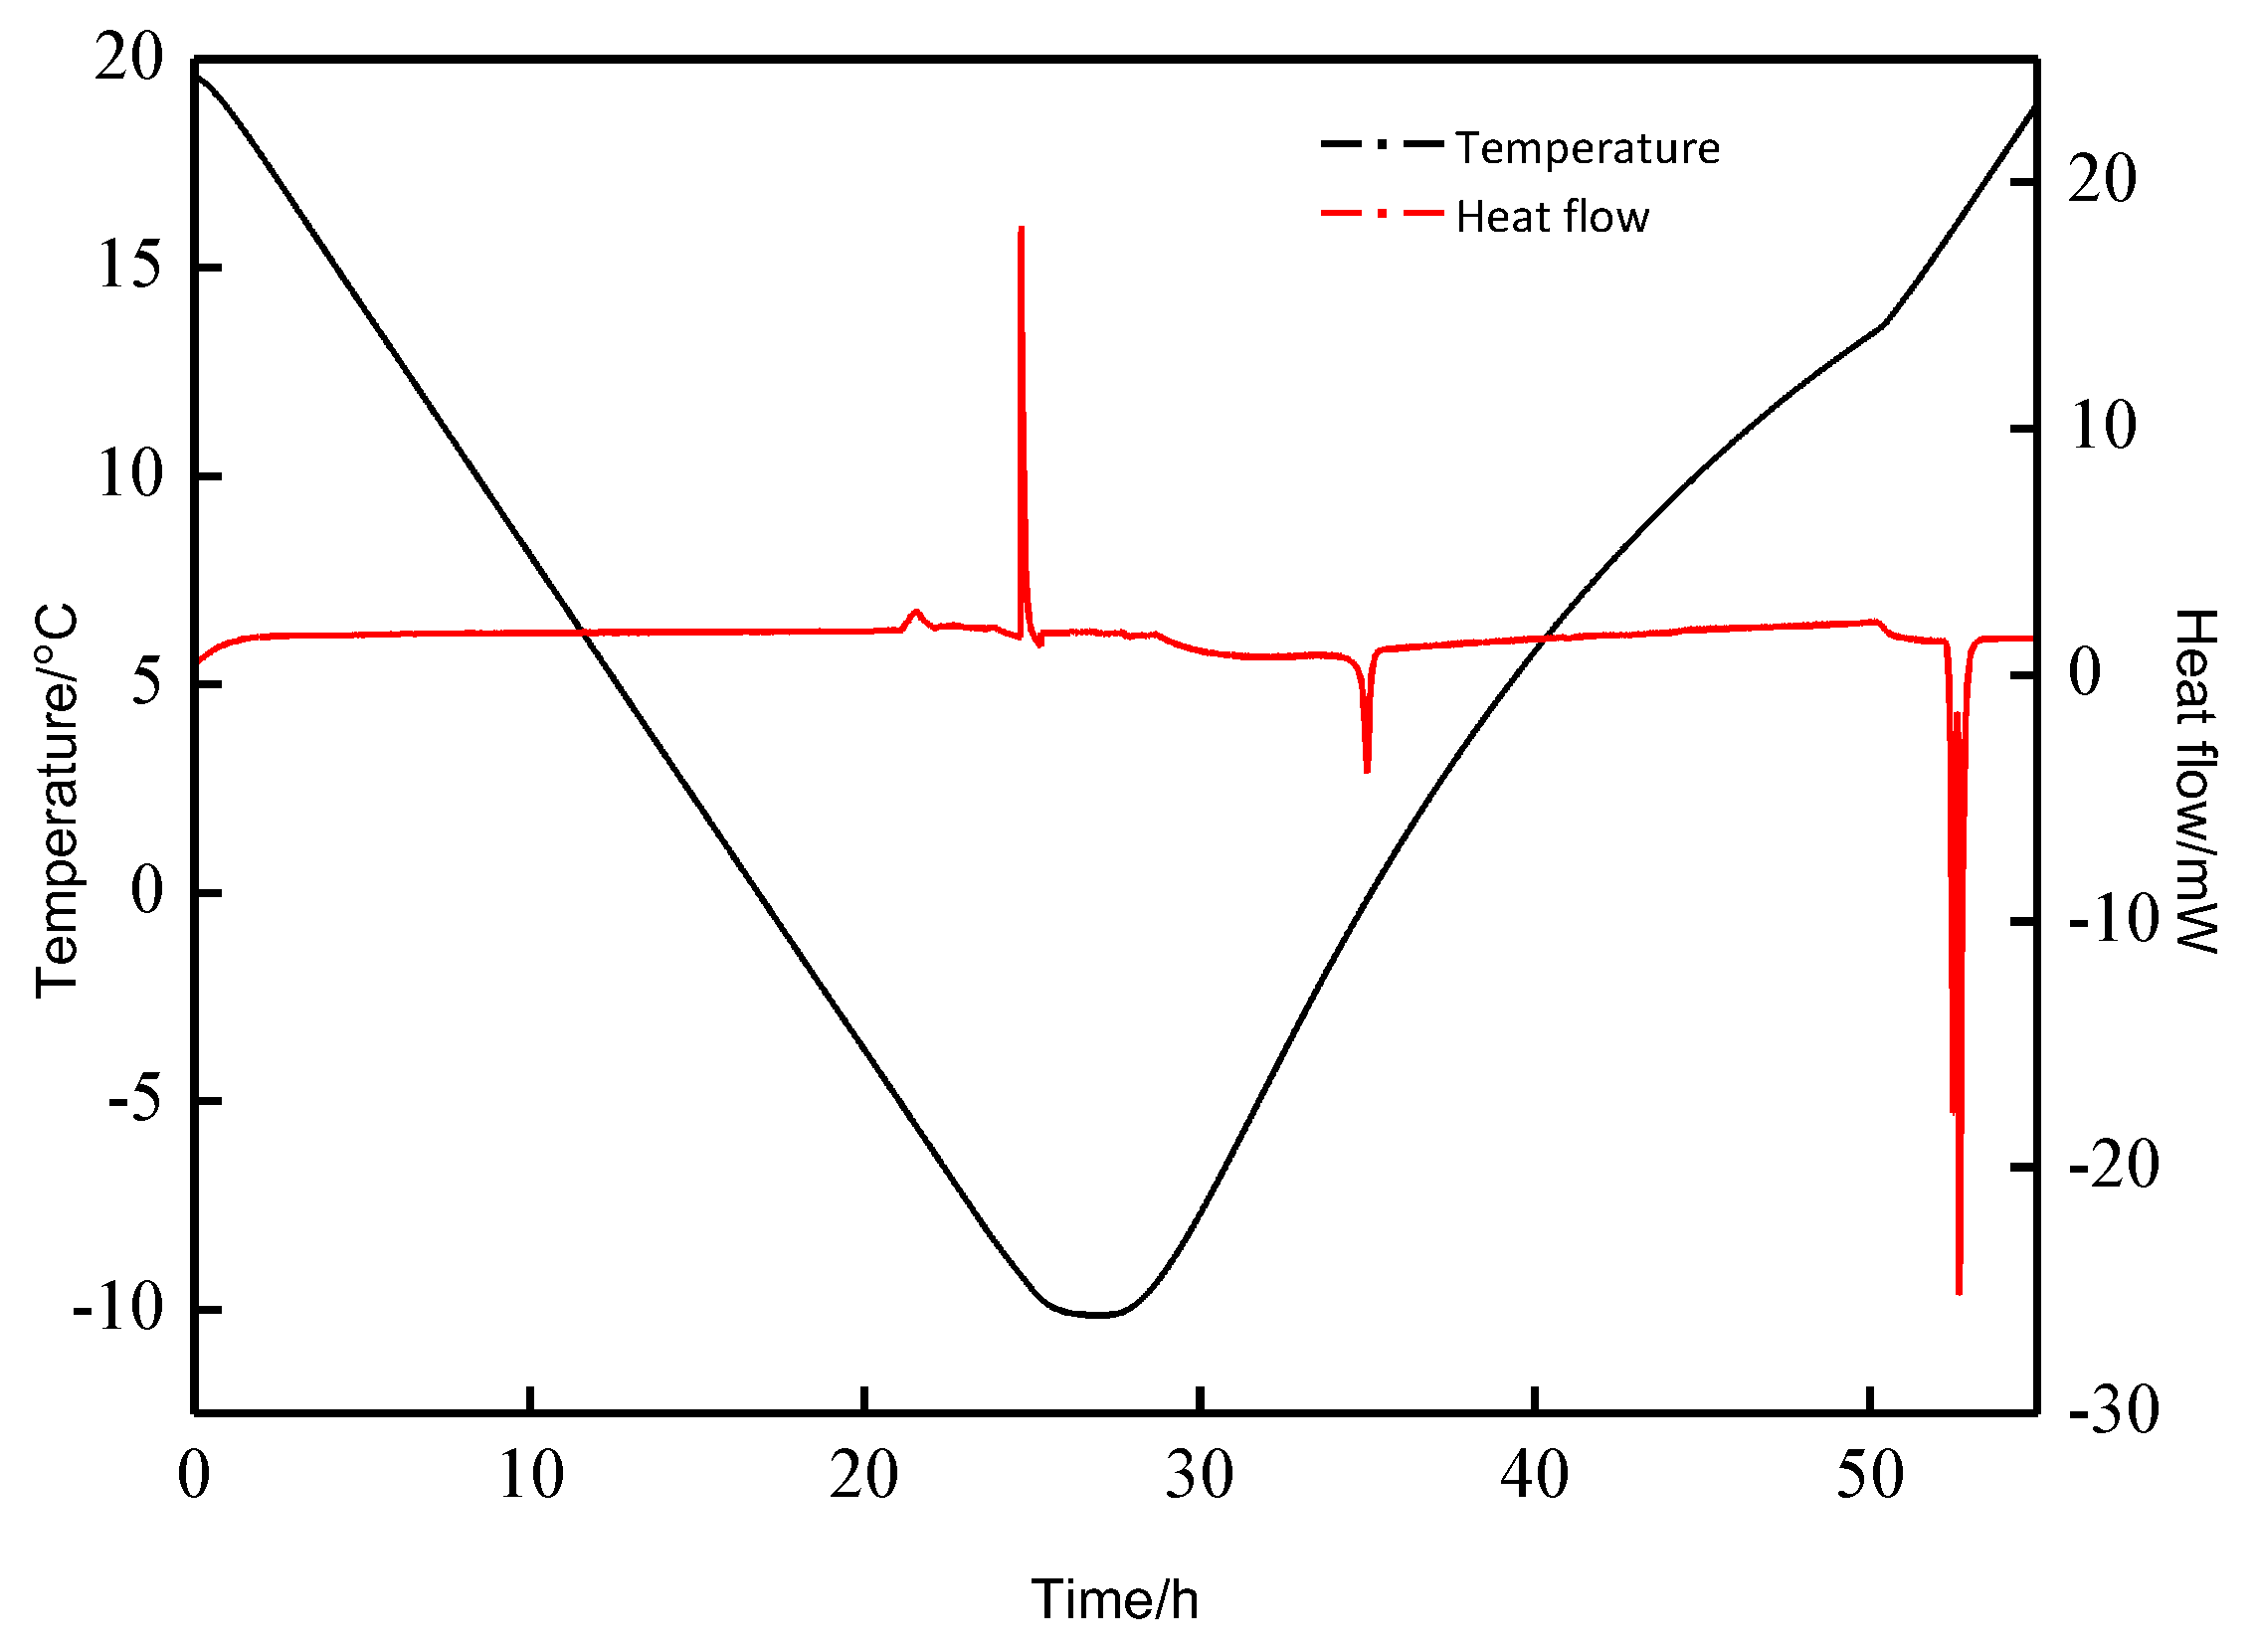
3.2. DSC and Raman Measurement

Figure 4 shows the heat flow and temperature changes vs. time corresponding to the ice formation and melting under atmosphere with the Setaram BT 2.15. As shown, the ice starts to form at about −11.20 °C and melt at 0.05 °C and the corresponding formation enthalpy and melting enthalpy are −335.29 and 334.07 J/g. Because enthalpy is an integral value obtained by the software program through calculating the area of the curve integral, there will inevitably be errors in the integration process, and as long as the error is less than 5%, we think the integral value is reasonable. Generally, in the system, the absolute value of the formation enthalpy and decomposition enthalpy of the same gas hydrate is equal, even if the integration error is considered, the error should be less than 5%. Figure 5, Figure 6, Figure 7, Figure 8, Figure 9, Figure 10 and Figure 11 show the heat flow and temperature changes vs. time corresponding to the experiments listed in Table 1, and Table 2 shows the heat flow and temperature of the peaks corresponding to hydrate formation and dissociation under different experimental runs. In each figure, the black line shows that the sample temperature changes with time with the DSC temperature program, while the red line represents the heat flow changes with time. As shown, there are two exothermic peaks corresponding to hydrate dissociation in each figure, which means there do be two kinds of compounds formed in the system. Moreover, for each figure, the absolute values of hydrate formation enthalpy and decomposition enthalpy are very close. The ratio of hydrate total decomposition enthalpy to hydrate formation enthalpy is 99.26%, 101.52%, 99.48%, 100.23%, 101.46% and 97.15%, respectively, indicating that hydrate formation and decomposition in the system are in accordance with heat conservation. For each experiment as run 2–4, there are two distinct formation peaks and decomposition peaks, and in the time dimension, the earlier formation peak corresponds to the later decomposition peak, while the later formation peak corresponds to the earlier decomposition peak. The absolute value of the enthalpy corresponding to the formation or/and decomposition peaks is almost the same, but the enthalpy values of the two decomposition peaks are quite different, which indicates that two different types of hydrates have been formed in the process. This result is consistent with the results shown in Figure 2 and Figure 3.
During the hydrate formation in the static water system, the decomposition enthalpy may vary greatly under different experimental conditions because of the effects of factors such as interference of ice, the wall-climbing of hydrate and the difficulty of gas diffusion in hydrate. Even so, the gas molecular occupancy in hydrate cage can be qualitatively analyzed according to the absolute value of enthalpy as long as the structure of hydrate is determined. The higher the hydrate decomposition enthalpy, the higher the gas occupancy in the hydrate cages. Temperature is an important index that can qualitatively determine the type of hydrate. In other words, it could be determined what kind of the hydrate is according to the hydrate decomposition temperature. As shown in Table 2 and Figure 5, the two decomposition peaks occur at around 5.80 and 6.93 °C, respectively. Both the temperatures are higher than freezing temperature, indicating that no ice forms in the experiment of run 1. Compared with the results of other experiments, the temperatures corresponding to the two decomposition peaks are relatively close. This is also reflected in the corresponding formation peaks, as shown in Figure 5. In fact, two hydrates have been formed successively, but only one obvious formation peak can be seen. The reason is that the formation temperatures of the two hydrates are almost the same, so that the corresponding peaks are overlapped and hard to be separated. According to the decomposition temperature, actually, the two temperatures are close, thus there might be two possibilities, one, there might be two different kinds of hydrates, CP-CO2 binary hydrate and CO2 hydrate, another, there might be two endothermic processes during the hydrate decomposition that the two kinds of cages (512 and 51264) in the hydrate break down in order.
Admittedly, this result is different from other experimental results. As shown in Table 1, The experimental programs of run 2 and 3 are same except for the lower-limit of temperature, and the results of the run 2 and 3 listed in Table 2 are almost same, indicating that the lower-limit of temperature of 8.8 °C is reasonable for the experiment and the lower temperature is no need. For the experiments of runs 2 and 3, as shown in Table 2 and Figure 6 and Figure 7, on one hand, the temperatures of the two decomposition peaks are around −1.72 and 5.71 °C, respectively, which are different very much. The first decomposition temperature is lower than the freezing point, while the second one is higher than the freezing point. Thus, it is certain that the second peak does not correspond to the ice melting. However, it is difficult to judge whether the first peak is ice peak by DSC result directly. For this reason, we have measured the ice point of CP-water system under atmospheric pressure. The temperature procedure of the DSC measurement is shown in Table 1 as Exp. Run 5, and the results of the DSC measurement are shown in Table 2 and Figure 9. As shown, there are a very sharp exothermic peak at −1.63 °C, a wide and irregular endothermic peak at −1.50 °C, and two small exothermic peaks before and after the endothermic peak. Compared with other DSC results, it can be seen that the heat flow values corresponding to the exothermic and endothermic peaks in Figure 9 are quite small, that’s also the reason there are two small exothermic peaks before and after the endothermic peak. The absence of the secondary formation in other figures does not mean that there is no hydrate secondary formation, but that the heat flow value of hydrate decomposition is larger, so that the heat flow of the smaller hydrate secondary formation is negligible in the figure. In addition, we carried out an experiment to measure the freezing point of CP solution at atmospheric pressure. In the experiment, the reactor was injected with only 30 mL CP emulsion (5 v%) but no gas, then the system cooled gradually. As shown in Figure 12, the CP emulsion began to transfer into solid phase at around −1.50 °C. And about 2 h later, almost all CP emulsions were converted to solid. The solid is a mixture of CP hydrate and ice. According to the law of thermodynamics, the higher the pressure, the lower the freezing point of the liquid. Therefore, for Figure 6 and Figure 7, based on the DSC results of this experiment, we conclude that the first peak presents the ice melting in the mixed system because the temperature is quite close to the freezing point, and the second peak presents the decomposition of CP-CO2 binary hydrate because the temperature is quite close to that showed in Figure 5.
In order to further investigate the effect of the operation pressure on the thermodynamics of the hydrate formation, the experiment of run 4 was carried out under the constant pressure of 5.0 MPa. It is worth noting that in the DSC measurement process, the pressure of 5.0 MPa rather than higher pressure is selected to avoid CO2 liquefaction. As shown in Table 2 and Figure 8, the two decomposition peaks with decomposition enthalpies of 39.01 and 77.78 J·g−1 occur at 10.03 and 14.16 °C, respectively. It can be determined that these two peaks are independent of ice due to their corresponding temperatures much higher than −1.50 °C. And the results are also quite different from those achieved in the experiments of run 1~3. However, from the perspective of decomposition enthalpy, the decomposition heat ( Δ H d ) corresponding to the first decomposition peak in Figure 8 is close to that in Figure 5, while the decomposition heat corresponding to the second decomposition peak is close to that in Figure 6. Therefore, it could be concluded that, firstly, the increase of pressure from 2.5 MPa to 5.0 MPa makes the decomposition temperature of hydrate increase significantly, secondly, it can be clearly determined that there are two different hydrates, and according to the composition of the substances in the system, it can be deduced that the first peak corresponds to CP-CO2 binary hydrate, and the second decomposition peak corresponds to CO2 hydrate. The result is consistent with that obtained by Seo et al. [19]. In order to further clarify the influence of the pressure on the hydrate formation, we carried out another two runs of experiments (Exp. Run 6 and 7 in Table 1) with constant pressures of 3.5 MPa and 6.0 MPa, and the specific heat flow changes during hydrate formation and decomposition are shown in Figure 10 and Figure 11. As shown, there are two decomposition peaks at −1.54 °C and 4.85 °C in Figure 10 and −1.62 °C and 10.22 °C in Figure 11, respectively. For the heat flow peak at around 4.85–6.00 °C under 3.5 MPa or less, what we can determine is the hydrate is CP-CO2 binary hydrate because the Raman spectrum shows both CO2 and CP are included in the hydrate, as shown in Figure 13. In Figure 13, it can be found two peaks appear at 1275.4 and 1379.5 cm−1, and another two peaks appear at 2981.5 and 2875.0 cm−1. The first two peaks are the characteristic peaks of CO2, and the second two peaks correspond to CP. Thus, it could be inferred that CO2 and CP coexist in the hydrate. However, for Figure 11, due to that the heat flow peak corresponding to hydrate decomposition at 10.22 °C is a relatively broad peak, its composition needs to be further determined by peak-differentiating and fitting according to the Gaussian-Lorentzian function [54].
As mentioned above, on one hand, compared the experimental results of runs 3 with run 6, the pressure rises from 2.5 MPa to 3.5 MPa did not affect the formation of ice and hydrate structure in the system, but only increased the temperature of melting and hydrate decomposition. This result is in accordance with the law of thermodynamic equilibrium. In addition, the increase of pressure also leads to the increase of decomposition heat of gas hydrate. Under the assumption that the structure of hydrate does not change, the increase of decomposition heat can be inferred as more gas entering hydrate and releasing more binding energy. On the other hand, compared with the experimental results of runs 4 and 7, the experiment of run 7 also has two decomposition peaks, but the difference is that the first peak appears melting ice, and the other peak appears hydrate decomposition with a wider shoulder. According to the law of peak-differentiating and fitting, we differentiate and fit the broad peak and get two decomposition peaks at 10.22 °C and 14.58 °C, respectively. These two temperatures are very close to the corresponding temperature of the two decomposition peaks in the experiment of run 4. And similarly, there should be two kinds of hydrates were formed in the experiment of run 7, namely, CP-CO2 binary mixture hydrate and CO2 hydrate.
In fact, the results of Raman measurement on hydrate also proved that the hydrate formed in this system (CP emulsion-CO2) is the coexistence of CP-CO2 hydrate and CO2 hydrate. Figure 14 shows the Raman spectra of the hydrates formed at the initial pressure of 5.0 MPa and temperature of 3.0 °C. On the left side of Figure 14 is the image of the real hydrate formed in the reactor after the complete of the hydrate formation, which is taken by Canon EOS 700 D. The two yellow spots “a” and “b” in the image are the focus of the laser for Raman measurement. The upper and lower images in the middle of Figure 14 are the images of hydrates around “a” and “b” points after being magnified by 500 times, which are captured by the software of Raman spectrometer (Type: Renishaw-In Via Reflex). And on the right side of Figure 14 are the Raman spectra of the hydrates at the spots “a” and “b”. The image on the left side of the figure is the optical micrograph of hydrate before Raman measurement. As seen from the Raman spectrum of the hydrate at the spot “a”, there are four sharp peaks, the two occurring at 1276.3 and 1379.6 cm−1 correspond to O=C=O stretch vibrations, indicating that CO2 is included in the hydrate, the other two occurring at 2876.2 and 2983.9 cm−1 correspond to the vibration of cyclopentane carbon chain, indicating that CP is also included in the hydrate. In other words, CO2 and CP coexist in the hydrate to form CP-CO2 binary hydrate at the spot “a”. However, from the Raman spectrum of the hydrate at the spot “b”, only two sharp peaks corresponding to O=C=O vibration appear at 1275.7 and 1381.9 cm−1, indicating that there is only CO2 in the hydrate at the spot “b”, which is called pure CO2 hydrate. Therefore, the results of Raman analysis prove that the hydrates formed the system are the coexistence of CP-CO2 hydrate and CO2 hydrate. Thus, returning to the discussion of on the results of the experiment of runs 4 and 7, it could be concluded that the two decomposition peaks at 10.22 and 14.58 °C represent the decomposition peaks of pure CP-CO2 binary hydrate and CO2 hydrate, respectively.
Indeed, we have also considered that these two peaks might be the heat flow peaks generated by the step-by-step decomposition of the same hydrate. For example, for the CP-CO2 binary hydrate, it is possible that CO2 and CP molecules successively escape from the cages and absorb heat during the decomposition due to that CP and CO2 molecules occupy different cages in the hydrate, respectively. Unfortunately, we do not have more scientific evidence to support this view. Although there are successive collapses of different hydrate cages in the molecular dynamics simulation, this kind of phenomenon only occurs in a relatively small time scale. In the macro experimental study, this kind of successive collapses is difficult to verify, let alone in two different hours. In the future work, we will consider whether this possibility is scientific by measuring the single hydrate crystal.

4. Conclusions

In order to reveal the relationship between the microscopic process and the gas consumption of hydrate formation, hydrate composition and formation mechanism of CP-CO2 system was investigated by DSC and Raman measurements on hydrates formed from CP-CO2 emulsion system under different pressures. DSC results show that except the formation and decomposition of ice, there are two peaks of hydrate formation or/and decomposition heat flow, indicating that the two hydrates in hydrate form successively and coexist. At the pressure of 5.0 MPa and above, the endothermic peaks of CP-CO2 binary hydrate and CO2 hydrate decomposition appeared at 10.22 and 14.58 °C, respectively. The Raman spectra also show that the CP-CO2 binary hydrate and the CO2 hydrate coexist in the hydrate phase. The CP-CO2 binary hydrates forms preferentially, and as crystal seeds, they induce the formation of the CO2 hydrates. And the formation process of these two hydrates is the cause of two pressure-drop processes in the whole hydrate formation process. The finding provides a research idea and scientific basis for further improving the gas consumption during the gas hydrate formation in the presence of promoters. It can be possible to increase the total gas consumption by controlling the formation of binary hydrate.

Author Contributions

Conceptualization, C.-G.X.; X.-S.L.; methodology, C.-G.X.; formal analysis, M.W.; investigation, M.W.; G.X.; W.Z.; data curation, M.W.; writing—original draft preparation, C.-G.X.; M.W.; writing—review and editing, C.-G.X.; project administration, J.C.; funding acquisition, Z.-Y.C.; X.-S.L. All authors have read and agreed to the published version of the manuscript.

Funding

National Natural Science Foundation of China (51736009, 51879254), the Natural Science Fund of Guangdong Province, China (2019A1515011490), the Special project for marine economy development of Guangdong Province (GDME-2018D002), Key Research Program of Frontier Sciences, CAS (ZDBS-LY-SLH041).

Data Availability Statement

The data used to support the findings of this article are available from the corresponding author upon request.

Acknowledgments

The authors would like to thank the National Natural Science Foundation of China, the Natural Science Fund of Guangdong Province, China, the marine economy development of Guangdong Province, and the Frontier Sciences, Chinese Academy of Sciences (CAS), for financial support of this work.

Conflicts of Interest

The authors declare no conflict of interest.

References

  1. Friedlingstein, P.; Jones, M.W.; O’Sullivan, M.; Andrew, R.M.; Hauck, J.; Peters, G.P.; Peters, W.; Pongratz, J.; Sitch, S.; Le Quere, C.; et al. Global Carbon Budget 2019. Earth Syst. Sci. Data 2019, 11, 1783–1838. [Google Scholar] [CrossRef] [Green Version]
  2. Yu, B.Y.; Zhao, G.P.; An, R.Y. Framing the picture of energy consumption in China. Nat. Hazards 2019, 99, 1469–1490. [Google Scholar] [CrossRef]
  3. Xu, C.G.; Cai, J.; Li, X.S.; Lv, Q.N.; Chen, Z.Y.; Deng, H.W. Integrated Process Study on Hydrate-Based Carbon Dioxide Separation from Integrated Gasification Combined Cycle (IGCC) Synthesis Gas in Scaled-Up Equipment. Energ. Fuel 2012, 26, 6442–6448. [Google Scholar] [CrossRef]
  4. English, N.J.; El-Hendawy, M.M.; Mooney, D.A.; MacElroy, J.M.D. Perspectives on atmospheric CO2 fixation in inorganic and biomimetic structures. Coordin Chem Rev 2014, 269, 85–95. [Google Scholar] [CrossRef]
  5. Dijkstra, J.W.; Jansen, D. Novel concepts for CO2 capture. Energy 2004, 29, 1249–1257. [Google Scholar] [CrossRef]
  6. Kotowicz, J.; Chmielniak, T.; Janusz-Szymanska, K. The influence of membrane CO2 separation on the efficiency of a coal-fired power plant. Energy 2010, 35, 841–850. [Google Scholar] [CrossRef]
  7. Li, X.S.; Xu, C.G.; Chen, Z.Y.; Wu, H.J. Tetra-n-butyl ammonium bromide semi-clathrate hydrate process for post-combustion capture of carbon dioxide in the presence of dodecyl trimethyl ammonium chloride. Energy 2010, 35, 3902–3908. [Google Scholar] [CrossRef]
  8. Li, A.R.; Wang, J.; Bao, B.P. High-efficiency CO2 capture and separation based on hydrate technology: A review. Greenh. Gases 2019, 9, 175–193. [Google Scholar] [CrossRef]
  9. English, N.J.; Clarke, E.T. Molecular dynamics study of CO2 hydrate dissociation: Fluctuation-dissipation and non-equilibrium analysis. J. Chem. Phys. 2013, 139. [Google Scholar] [CrossRef]
  10. Larsen, R.; Knight, C.A.; Sloan, E.D. Clathrate hydrate growth and inhibition. Fluid Phase Equilibria 1998, 150, 353–360. [Google Scholar] [CrossRef]
  11. Sum, A.K.; Burruss, R.C.; Sloan, E.D. Measurements of clathrate hydrates properties via Raman spectroscopy. In Proceedings of the Ngh 96: 2nd International Conference on Natural Gas Hydrates, Golden, Toulouse, France, 2–6 June 1996; pp. 51–58. [Google Scholar]
  12. Sum, A.K.; Koh, C.A.; Sloan, E.D. Clathrate Hydrates: From Laboratory Science to Engineering Practice. Ind. Eng. Chem. Res. 2009, 48, 7457–7465. [Google Scholar] [CrossRef]
  13. Duc, N.H.; Chauvy, F.; Herri, J.M. CO2 capture by hydrate crystallization—A potential solution for gas emission of steelmaking industry. Energy Convers. Manag. 2007, 48, 1313–1322. [Google Scholar] [CrossRef]
  14. Xu, C.G.; Yu, Y.S.; Ding, Y.L.; Cai, J.; Li, X.S. The effect of hydrate promoters on gas uptake. Phys. Chem. Chem. Phys. 2017, 19, 21769–21776. [Google Scholar] [CrossRef] [PubMed]
  15. Park, J.; Kang, S.P.; Lee, J.W. C-13 NMR analysis of C2H6+C2H4+THF mixed hydrate for an application to separation of C2H4 and C2H6. Korean J. Chem. Eng. 2016, 33, 2186–2190. [Google Scholar] [CrossRef]
  16. Yang, M.J.; Jing, W.; Zhao, J.F.; Ling, Z.; Song, Y.C. Promotion of hydrate-based CO2 capture from flue gas by additive mixtures (THF (tetrahydrofuran) plus TBAB (tetra-n-butyl ammonium bromide)). Energy 2016, 106, 546–553. [Google Scholar] [CrossRef]
  17. Zhao, J.Z.; Zhao, Y.S.; Liang, W.G. CH4 Separation from Coal Bed Methane by Hydrate in the SDS and THF Solution. J. Chem.-Ny 2016. [Google Scholar] [CrossRef]
  18. Zhang, H.; Du, J.W.; Wang, Y.H.; Lang, X.M.; Li, G.; Chen, J.B.; Fan, S.S. Investigation into THF hydrate slurry flow behaviour and inhibition by an anti-agglomerant. Rsc. Adv. 2018, 8, 11946–11956. [Google Scholar] [CrossRef] [Green Version]
  19. Lee, J.; Kim, K.S.; Seo, Y. Thermodynamic, structural, and kinetic studies of cyclopentane + CO2 hydrates: Applications for desalination and CO2 capture. Chem. Eng. J. 2019, 375. [Google Scholar] [CrossRef]
  20. Mesbah, M.; Soroush, E.; Roham, M.; Shahsavari, S. Phase equilibrium modeling of semi-clathrate hydrates of the CO2+H2/CH4/N2+TBAB aqueous solution system. Petrol. Sci. Technol. 2017, 35, 1588–1594. [Google Scholar] [CrossRef]
  21. Takeya, S.; Muromachi, S.; Maekawa, T.; Yamamoto, Y.; Mimachi, H.; Kinoshita, T.; Murayama, T.; Umeda, H.; Ahn, D.H.; Iwasaki, Y.; et al. Design of Ecological CO2 Enrichment System for Greenhouse Production using TBAB + CO2 Semi-Clathrate Hydrate. Energies 2017, 10, 927. [Google Scholar] [CrossRef] [Green Version]
  22. Michel, N.; Clarke, M.A. A short note on modelling the three-phase equilibrium conditions of TBAB semi-clathrates formed in the presence of gas mixtures containing CO2. J. Chem. Thermodyn. 2018, 117, 97–105. [Google Scholar] [CrossRef]
  23. Li, Z.; Zhong, D.L.; Zheng, W.Y.; Yan, J.; Lu, Y.Y.; Yi, D.T. Morphology and kinetic investigation of TBAB/TBPB semiclathrate hydrates formed with a CO2 + CH4 gas mixture. J. Cryst. Growth 2019, 511, 79–88. [Google Scholar] [CrossRef]
  24. Kakati, H.; Mandal, A.; Laik, S. Synergistic effect of Polyvinylpyrrolidone (PVP) and L-tyrosine on kinetic inhibition of CH4 + C2H4 + C3H8 hydrate formation. J. Nat. Gas Sci. Eng. 2016, 34, 1361–1368. [Google Scholar] [CrossRef]
  25. Lee, Y.; Choi, W.; Seo, Y.J.; Lee, J.Y.; Lee, J.; Seo, Y. Structural transition induced by cage-dependent guest exchange in CH4 + C3H8 hydrates with CO2 injection for energy recovery and CO2 sequestration. Appl. Energy 2018, 228, 229–239. [Google Scholar] [CrossRef]
  26. Khan, M.N.; Warrier, P.; Peters, C.J.; Koh, C.A. Review of vapor-liquid equilibria of gas hydrate formers and phase equilibria of hydrates. J. Nat. Gas Sci. Eng. 2016, 35, 1388–1404. [Google Scholar] [CrossRef]
  27. Nasir, Q.; Suleman, H.; Elsheikh, Y.A. A review on the role and impact of various additives as promoters/inhibitors for gas hydrate formation. J. Nat. Gas Sci. Eng. 2020, 76. [Google Scholar] [CrossRef]
  28. Ricaurte, M.; Dicharry, C.; Broseta, D.; Renaud, X.; Torre, J.P. CO2 Removal from a CO2-CH4 Gas Mixture by Clathrate Hydrate Formation Using THF and SDS as Water-Soluble Hydrate Promoters. Ind. Eng. Chem. Res. 2013, 52, 899–910. [Google Scholar] [CrossRef] [Green Version]
  29. Mohammadi, A.; Pakzad, M.; Mohammadi, A.H.; Jahangiri, A. Kinetics of (TBAF + CO2) semi-clathrate hydrate formation in the presence and absence of SDS. Petrol. Sci. 2018, 15, 375–384. [Google Scholar] [CrossRef] [Green Version]
  30. Yan, K.F.; Li, X.S.; Chen, Z.Y.; Xu, C.G.; Zhang, Y.; Xia, Z.M. The Formation of CH4 Hydrate in the Slit Nanopore between the Smectite Basal Surfaces by Molecular Dynamics Simulation. Energy Fuel 2018, 32, 6467–6474. [Google Scholar] [CrossRef]
  31. Xia, Z.M.; Li, X.S.; Chen, Z.Y.; Yan, K.F.; Xu, C.G.; Lv, Q.N.; Cai, J. Hydrate-based Capture of Acidic Gases for Clean Fuels with New Synergic Additives. Energy Procedia 2017, 105, 648–653. [Google Scholar] [CrossRef]
  32. Li, X.S.; Xu, C.G.; Chen, Z.Y.; Wu, H.J. Hydrate-based pre-combustion carbon dioxide capture process in the system with tetra-n-butyl ammonium bromide solution in the presence of cyclopentane. Energy 2011, 36, 1394–1403. [Google Scholar] [CrossRef]
  33. Xia, Z.M.; Li, X.S.; Chen, Z.Y.; Li, G.; Cai, J.; Wang, Y.; Yan, K.F.; Xu, C.G. Hydrate-based acidic gases capture for clean methane with new synergic additives. Appl. Energy 2017, 207, 584–593. [Google Scholar] [CrossRef]
  34. Hirai, S.; Okazaki, K.; Tabe, Y.; Kawamura, K. CO2 clathrate-hydrate formation and its mechanism by molecular dynamics simulation. Energy Convers. Manag. 1997, 38, S301–S306. [Google Scholar] [CrossRef]
  35. Zhang, M.M.; Anderson, B.J.; Warzinski, R.P.; Holder, G.D. Molecular dynamics simulation of hydrate lattice distortion. Abstr. Pap. Am. Chem. S 2009, 237, 1. [Google Scholar]
  36. Yan, K.F.; Li, X.S.; Chen, Z.Y.; Xu, C.G. Molecular dynamics simulation of CO2 separation from integrated gasification combined cycle syngas via the hydrate formation. Acta Phys. Sin. 2010, 59, 4313–4321. [Google Scholar]
  37. Qi, Y.X.; Ota, M.; Zhang, H. Molecular dynamics simulation of replacement of CH4 in hydrate with CO2. Energy Convers. Manag. 2011, 52, 2682–2687. [Google Scholar] [CrossRef]
  38. Nohra, M.; Woo, T.K.; Alavi, S.; Ripmeester, J.A. Molecular dynamics Gibbs free energy calculations for CO2 capture and storage in structure I clathrate hydrates in the presence of SO2, CH4, N2, and H2S impurities. J. Chem. Thermodyn. 2012, 44, 5–12. [Google Scholar] [CrossRef]
  39. Yan, K.F.; Li, X.S.; Chen, Z.Y.; Xia, Z.M.; Xu, C.G.; Zhang, Z.Q. Molecular Dynamics Simulation of the Crystal Nucleation and Growth Behavior of Methane Hydrate in the Presence of the Surface and Nanopores of Porous Sediment. Langmuir 2016, 32, 7975–7984. [Google Scholar] [CrossRef] [PubMed]
  40. Handa, Y.P. Calorimetric Determinations of the Compositions, Enthalpies of Dissociation, and Heat-Capacities in the Range 85 to 270-K for Clathrate Hydrates of Xenon and Krypton. J. Chem. Thermodyn. 1986, 18, 891–902. [Google Scholar] [CrossRef]
  41. Kang, S.P.; Lee, H.; Ryu, B.J. Enthalpies of dissociation of clathrate hydrates of carbon dioxide, nitrogen, (carbon dioxide plus nitrogen), and (carbon dioxide plus nitrogen plus tetrahydrofuran). J. Chem. Thermodyn. 2001, 33, 513–521. [Google Scholar] [CrossRef]
  42. Koh, C.A.; Westacott, R.E.; Zhang, W.; Hirachand, K.; Creek, J.L.; Soper, A.K. Mechanisms of gas hydrate formation and inhibition. Fluid Phase Equilibria 2002, 194, 143–151. [Google Scholar] [CrossRef]
  43. Dalmazzone, D.; Hamed, N.; Dalmazzone, C.; Rousseau, L. Application of high pressure DSC to the kinetics of formation of methane hydrate in water-in-oil emulsion. J. Therm. Anal. Calorim. 2006, 85, 361–368. [Google Scholar] [CrossRef]
  44. Zhang, J.S.; Lee, J.W. Equilibrium of Hydrogen plus Cyclopentane and Carbon Dioxide plus Cyclopentane Binary Hydrates. J Chem. Eng. Data 2009, 54, 659–661. [Google Scholar] [CrossRef]
  45. Lee, Y.; Choi, W.; Shin, K.; Seo, Y. CH4-CO2 replacement occurring in sII natural gas hydrates for CH4 recovery and CO2 sequestration. Energy Convers. Manag. 2017, 150, 356–364. [Google Scholar] [CrossRef]
  46. Lee, Y.; Lee, D.; Lee, J.W.; Seo, Y. Enclathration of CO2 as a co-guest of structure H hydrates and its implications for CO2 capture and sequestration. Appl. Energy 2016, 163, 51–59. [Google Scholar] [CrossRef]
  47. Koh, C.; Savidge, J.; Soper, A.; Wu, X.; Motie, R.; Westacott, R. Spectroscopic studies of natural gas hydrate nucleation, growth and inhibition. In Proceedings of the Ngh 96: 2nd International Conference on Natural Gas Hydrates, Golden, Toulouse, France, 2–6 June 1996; p. 301. [Google Scholar]
  48. Park, J.; Seo, Y.T.; Lee, J.W.; Lee, H. Spectroscopic analysis of carbon dioxide and nitrogen mixed gas hydrates in silica gel for CO2 separation. Catal. Today 2006, 115, 279–282. [Google Scholar] [CrossRef]
  49. Rojas, Y.; Lou, X. Instrumental analysis of gas hydrates properties. Asia-Pac J. Chem. Eng. 2010, 5, 310–323. [Google Scholar] [CrossRef]
  50. Chen, L.T.; Lu, H.L.; Ripmeester, J.A. Raman spectroscopic study of CO2 in hydrate cages. Chem. Eng. Sci. 2015, 138, 706–711. [Google Scholar] [CrossRef]
  51. Kim, S.; Kim, K.S.; Seo, Y. CH4 enclathration in tetra-iso-amyl ammonium bromide (TiAAB) semiclathrate and its significance for natural gas storage. Chem. Eng. J. 2017, 330, 1160–1165. [Google Scholar] [CrossRef]
  52. Xu, C.G.; Yan, R.; Fu, J.; Zhang, S.H.; Yan, K.F.; Chen, Z.Y.; Xia, Z.M.; Li, X.S. Insight into micro-mechanism of hydrate-based methane recovery and carbon dioxide capture from methane-carbon dioxide gas mixtures with thermal characterization. Appl. Energy 2019, 239, 57–69. [Google Scholar] [CrossRef]
  53. Li, Z.Y.; Xia, Z.M.; Chen, Z.Y.; Li, X.S.; Xu, C.G.; Yan, R. The plateau effects and crystal transition study in Tetrahydrofuran (THF)/CO2/H2 hydrate formation processes. Appl. Energy 2019, 238, 195–201. [Google Scholar] [CrossRef]
  54. Yuan, X.Y.; Mayanovic, R.A. An Empirical Study on Raman Peak Fitting and Its Application to Raman Quantitative Research. Appl. Spectrosc. 2017, 71, 2325–2338. [Google Scholar] [CrossRef] [PubMed]
Figure 1. Schematic diagram of the experimental equipment.
Energies 14 00870 g001
Figure 2. The CP-CO2 system pressure and temperature curves at 2.5 MPa.
Energies 14 00870 g002
Figure 3. The CP-CO2 system pressure and temperature curves at 5.0 MPa.
Energies 14 00870 g003
Figure 4. The heat flow and temperature changes vs. time corresponding to the ice formation and melting with the Setaram BT 2.15.
Energies 14 00870 g004
Figure 5. Heat flow and temperature curve at 20.0~−5.0 °C and 5.0 MPa.
Energies 14 00870 g005
Figure 6. Heat flow and temperature curve at 20.0~−10.0 °C and 2.5 MPa.
Energies 14 00870 g006
Figure 7. Heat flow and temperature curve at 20.0~−8.8 °C and 2.5 MPa.
Energies 14 00870 g007
Figure 8. Heat flow and temperature curve at 20.0~−8.8 °C and 5.0 MPa.
Energies 14 00870 g008
Figure 9. Heat flow and temperature curve at 20.0~−8.8 °C and 0 MPa.
Energies 14 00870 g009
Figure 10. Heat flow and temperature curve at 20.0~−8.8 °C and 3.5 MPa.
Energies 14 00870 g010
Figure 11. Heat flow and temperature curve at 20.0~−8.8 °C and 6.0 MPa.
Energies 14 00870 g011
Figure 12. Phase T-t diagram of 5 v% CP solution.
Energies 14 00870 g012
Figure 13. Raman spectrum of hydrate formed from CO2-CP system at 2.5 MPa and 1.5 °C.
Energies 14 00870 g013
Figure 14. Raman spectra of hydrates formed from CP-CO2 system at different sites.
Energies 14 00870 g014
Table 1. Temperature procedure in DSC measurement.
Exp. RunP
(MPa)
T
(°C)
Cooling Rate
(K·min−1)
Constant Time
(h)
Heating Rate
(K·min−1)
12.520.0~−5.00.0250.02
22.520.0~−10.00.0250.02
32.520.0~−8.80.0250.02
45.020.0~−8.80.0250.02
5020.0~−8.80.0250.02
63.520.0~−8.80.0250.02
76.020.0~−8.80.0250.02
Table 2. The heat flow and temperature of the peaks corresponding to hydrate formation and dissociation under different experimental runs.
Exp. RunP
(MPa)
T
(°C)
First Formation PeakSecond Formation PeakFirst Decomposition PeakSecond Decomposition Peak Δ H d ,   t Δ H f , t
(%)
T
(°C)
Δ H f
(J·g−1)
T
(°C)
Δ H f
(J·g−1)
T
(°C)
Δ H d
(J·g−1)
T
(°C)
Δ H d
(J·g−1)
12.520.0~−5.00.34−50.8235.8037.2116.9313.23499.26
22.520.0~−10.0−3.66−63.974−6.19−217.557−1.72214.0345.7168.209101.52
32.520.0~−8.8−3.65−67.769−6.50−243.679−1.72242.6225.7067.21299.48
45.020.0~−8.813.98−77.0133.21−39.51010.0339.01414.3677.775100.23
5020.0~−8.8−2.63−0.533 −2.050.535 100.37
63.520.0~−8.80.607−113.919−5.90−218.931−1.54219.4444.85118.254101.46
76.020.0~−8.8T: 6.97 Δ H f : −469.133−1.6217.02010.216438.73497.15
Remark: P, T, Δ H f ,   Δ H d ,   Δ H f , t , Δ H d , t presents operation pressure, sample temperate in the DSC cell, hydrate formation enthalpy, hydrate decomposition enthalpy, total hydrate formation enthalpy and totla hydrate decomposition enthalpy, repectively.
Publisher’s Note: MDPI stays neutral with regard to jurisdictional claims in published maps and institutional affiliations.

