
An Experimental Study of In-Tube Condensation and Evaporation Using Enhanced Heat Transfer (EHT) Tubes


Abstract
1. Introduction
2. Procedure
3. Theory
4. Results
4.1. Condensation Correlations
4.2. Condensation Heat Transfer Characteristics
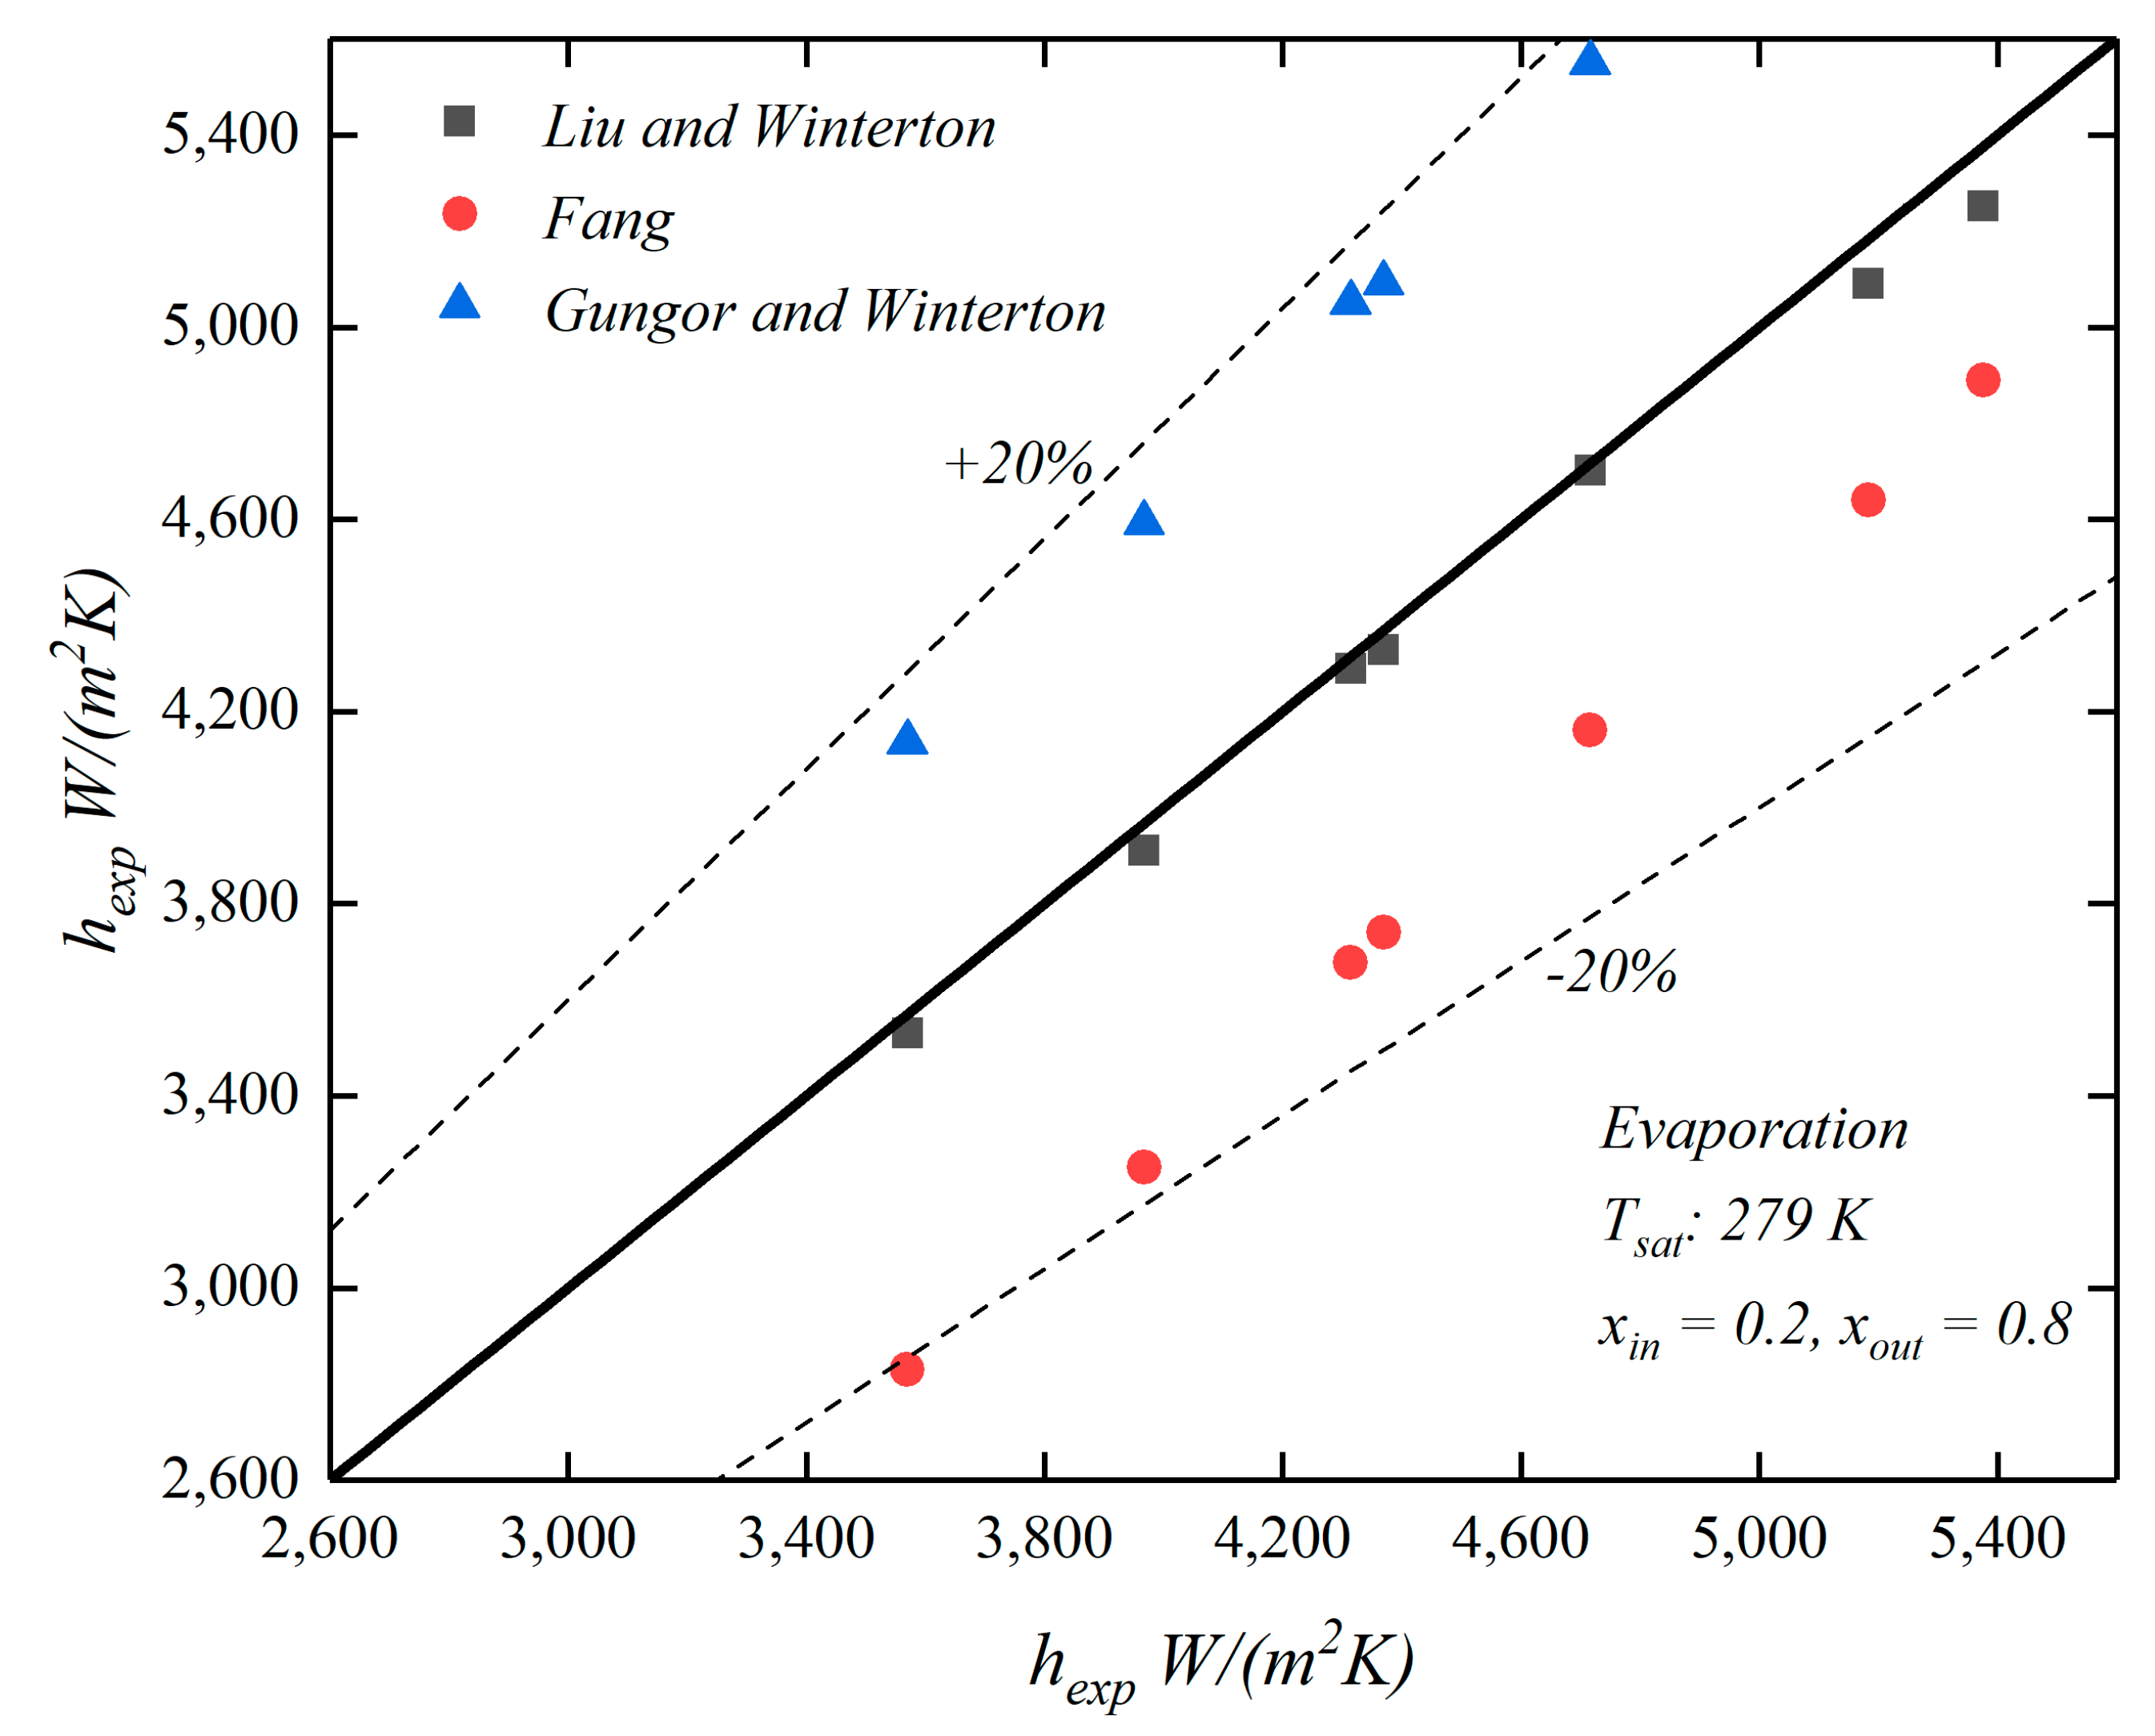
4.3. Evaporation Correlations
4.4. Evaporation Heat Transfer Characteristics
5. Conclusions
- -
- Highest condensation HTCs were exhibited in the EHT—HB/D tube. Initially the HTCs of the enhanced tubes initially decreased; then as G increased above 100 kg/(m2s), the HTC increased slightly. Enhanced surfaces evaluated in this study consisted of classic enhanced (HB and HX) and composite enhanced (HB/D and HB/HY) tubes. These enhancements produce drainage at the lower G values; moving liquid condensate at the groove tips (fins) to the bottom of the tube, producing an enhanced performance. Additionally, the HTCs of the EHT—HB/D flatten out with increasing G. The EHT—HB/D tube produces the largest increase to pressure drop during condensation (0–5.3%).
- -
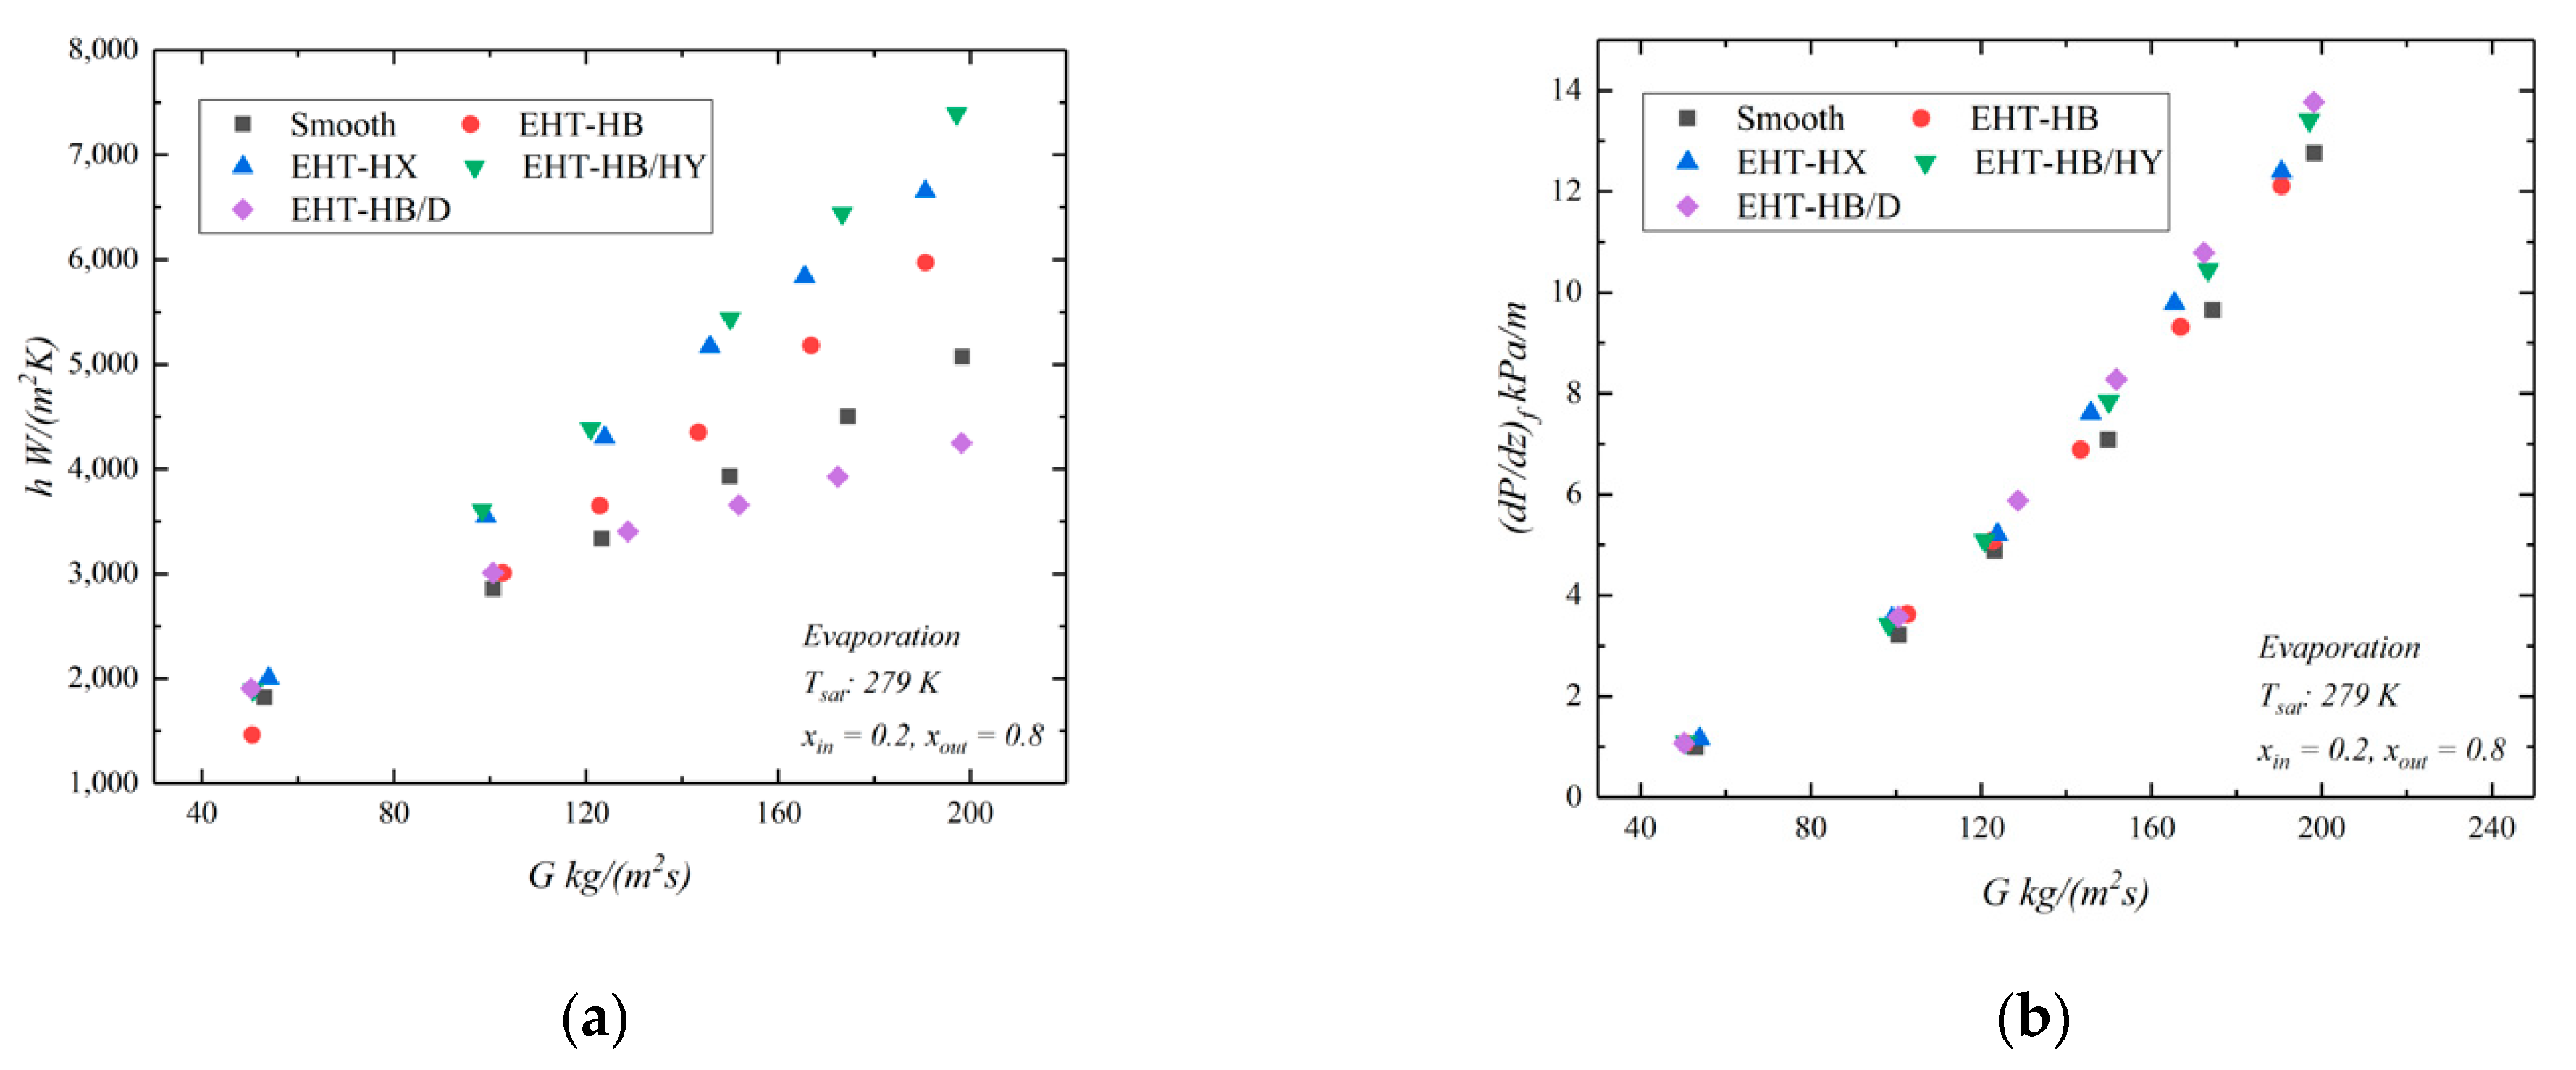
- Similar evaporation HTCs are shown for the tubes at G = 50 kg/(m2s); indicating that at these conditions, enhanced surfaces are not very effective at low mass velocities. For G > 100 kg/(m2s), the EHT—HB/HY and EHT—HX tubes produced higher HTCs than the other enhanced tubes; when compared to a plain tube, the HTCs of the EHT—HB/HY and EHT—HX increase from 3.9 to 45.8%. Lowest evaporation performance is found in the EHT—HB/D tube, for many conditions its performance is worse than a plain tube; the dimples and herringbone grooves produce liquid entrainment that contributes to its poor performance.
- -
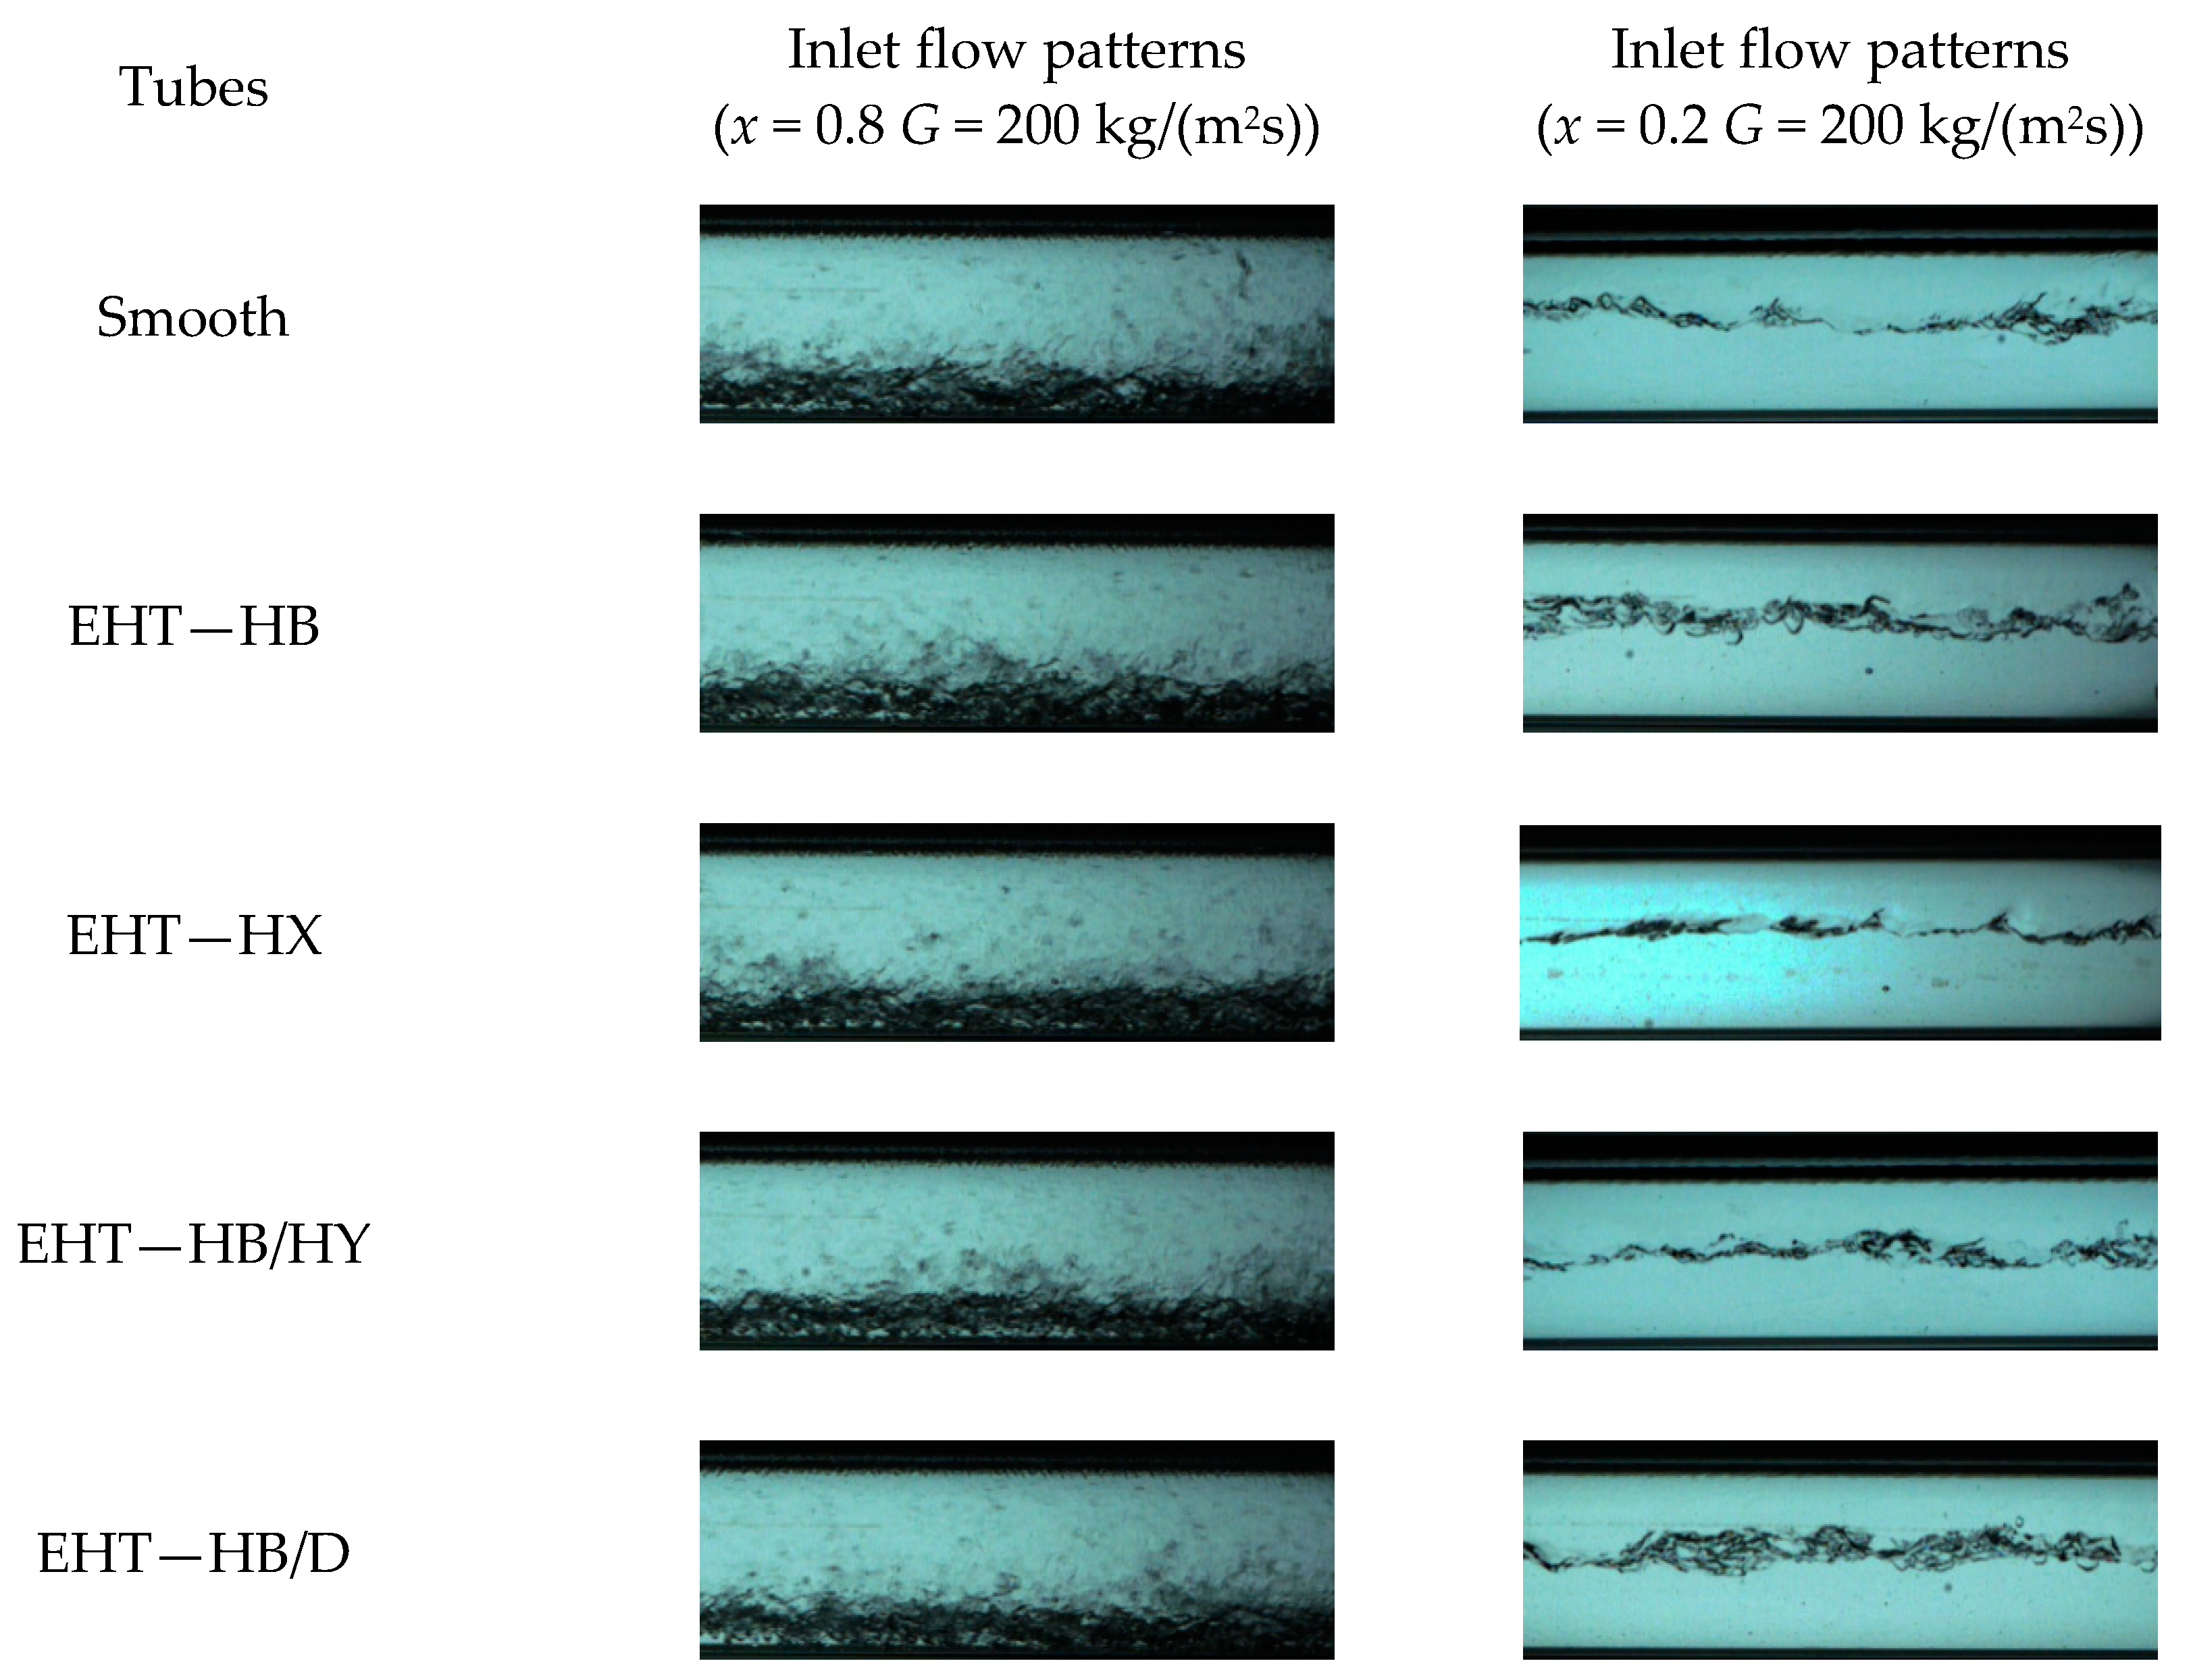
- Two-phase inlet and outlet flow patterns inside the five test tubes are observed; different flow patterns can influence the heat transfer performance.
- -
- -
- Two novel three-dimensional, composite, enhanced surfaces for use in condensation and evaporation applications have been introduced and studied in this investigation. Additional studies that optimize the surface configuration (i.e., height of enhancement structure, number of structures per unit area, geometric characteristics, etc.) need to be studied in more detail and are the topics of future investigations.
Author Contributions
Funding
Institutional Review Board Statement
Informed Consent Statement
Data Availability Statement
Conflicts of Interest
Nomenclature
| A | test tube surface area, m2 |
| C | enhancement ratio |
| cp | specific heat, J/(kg·K) |
| D | dimple |
| d | test tube diameter, m |
| dh | hydraulic diameter, m |
| EHT | enhanced |
| Fa | |
| f | Fanning friction factor |
| G | mass flux, kg/(m2s) |
| g | gravitational acceleration, m/s2 |
| HB | herringbone |
| HX | helix micro-fin |
| HY | hydrophobic |
| h | heat transfer coefficient, W/(m2·K) |
| hlv | latent heat of vaporization, J/kg |
| k | thermal conductivity, W/(m·K) |
| L | tube length, m |
| LMTD | logarithmic mean temperature, K |
| m | mass flux, kg/s |
| P | Pressure, kpa |
| PF | performance factor |
| Pr | Prandtl number |
| Q | heat transfer amount, W |
| q | heat flux, W/m2 |
| Re | Reynolds number |
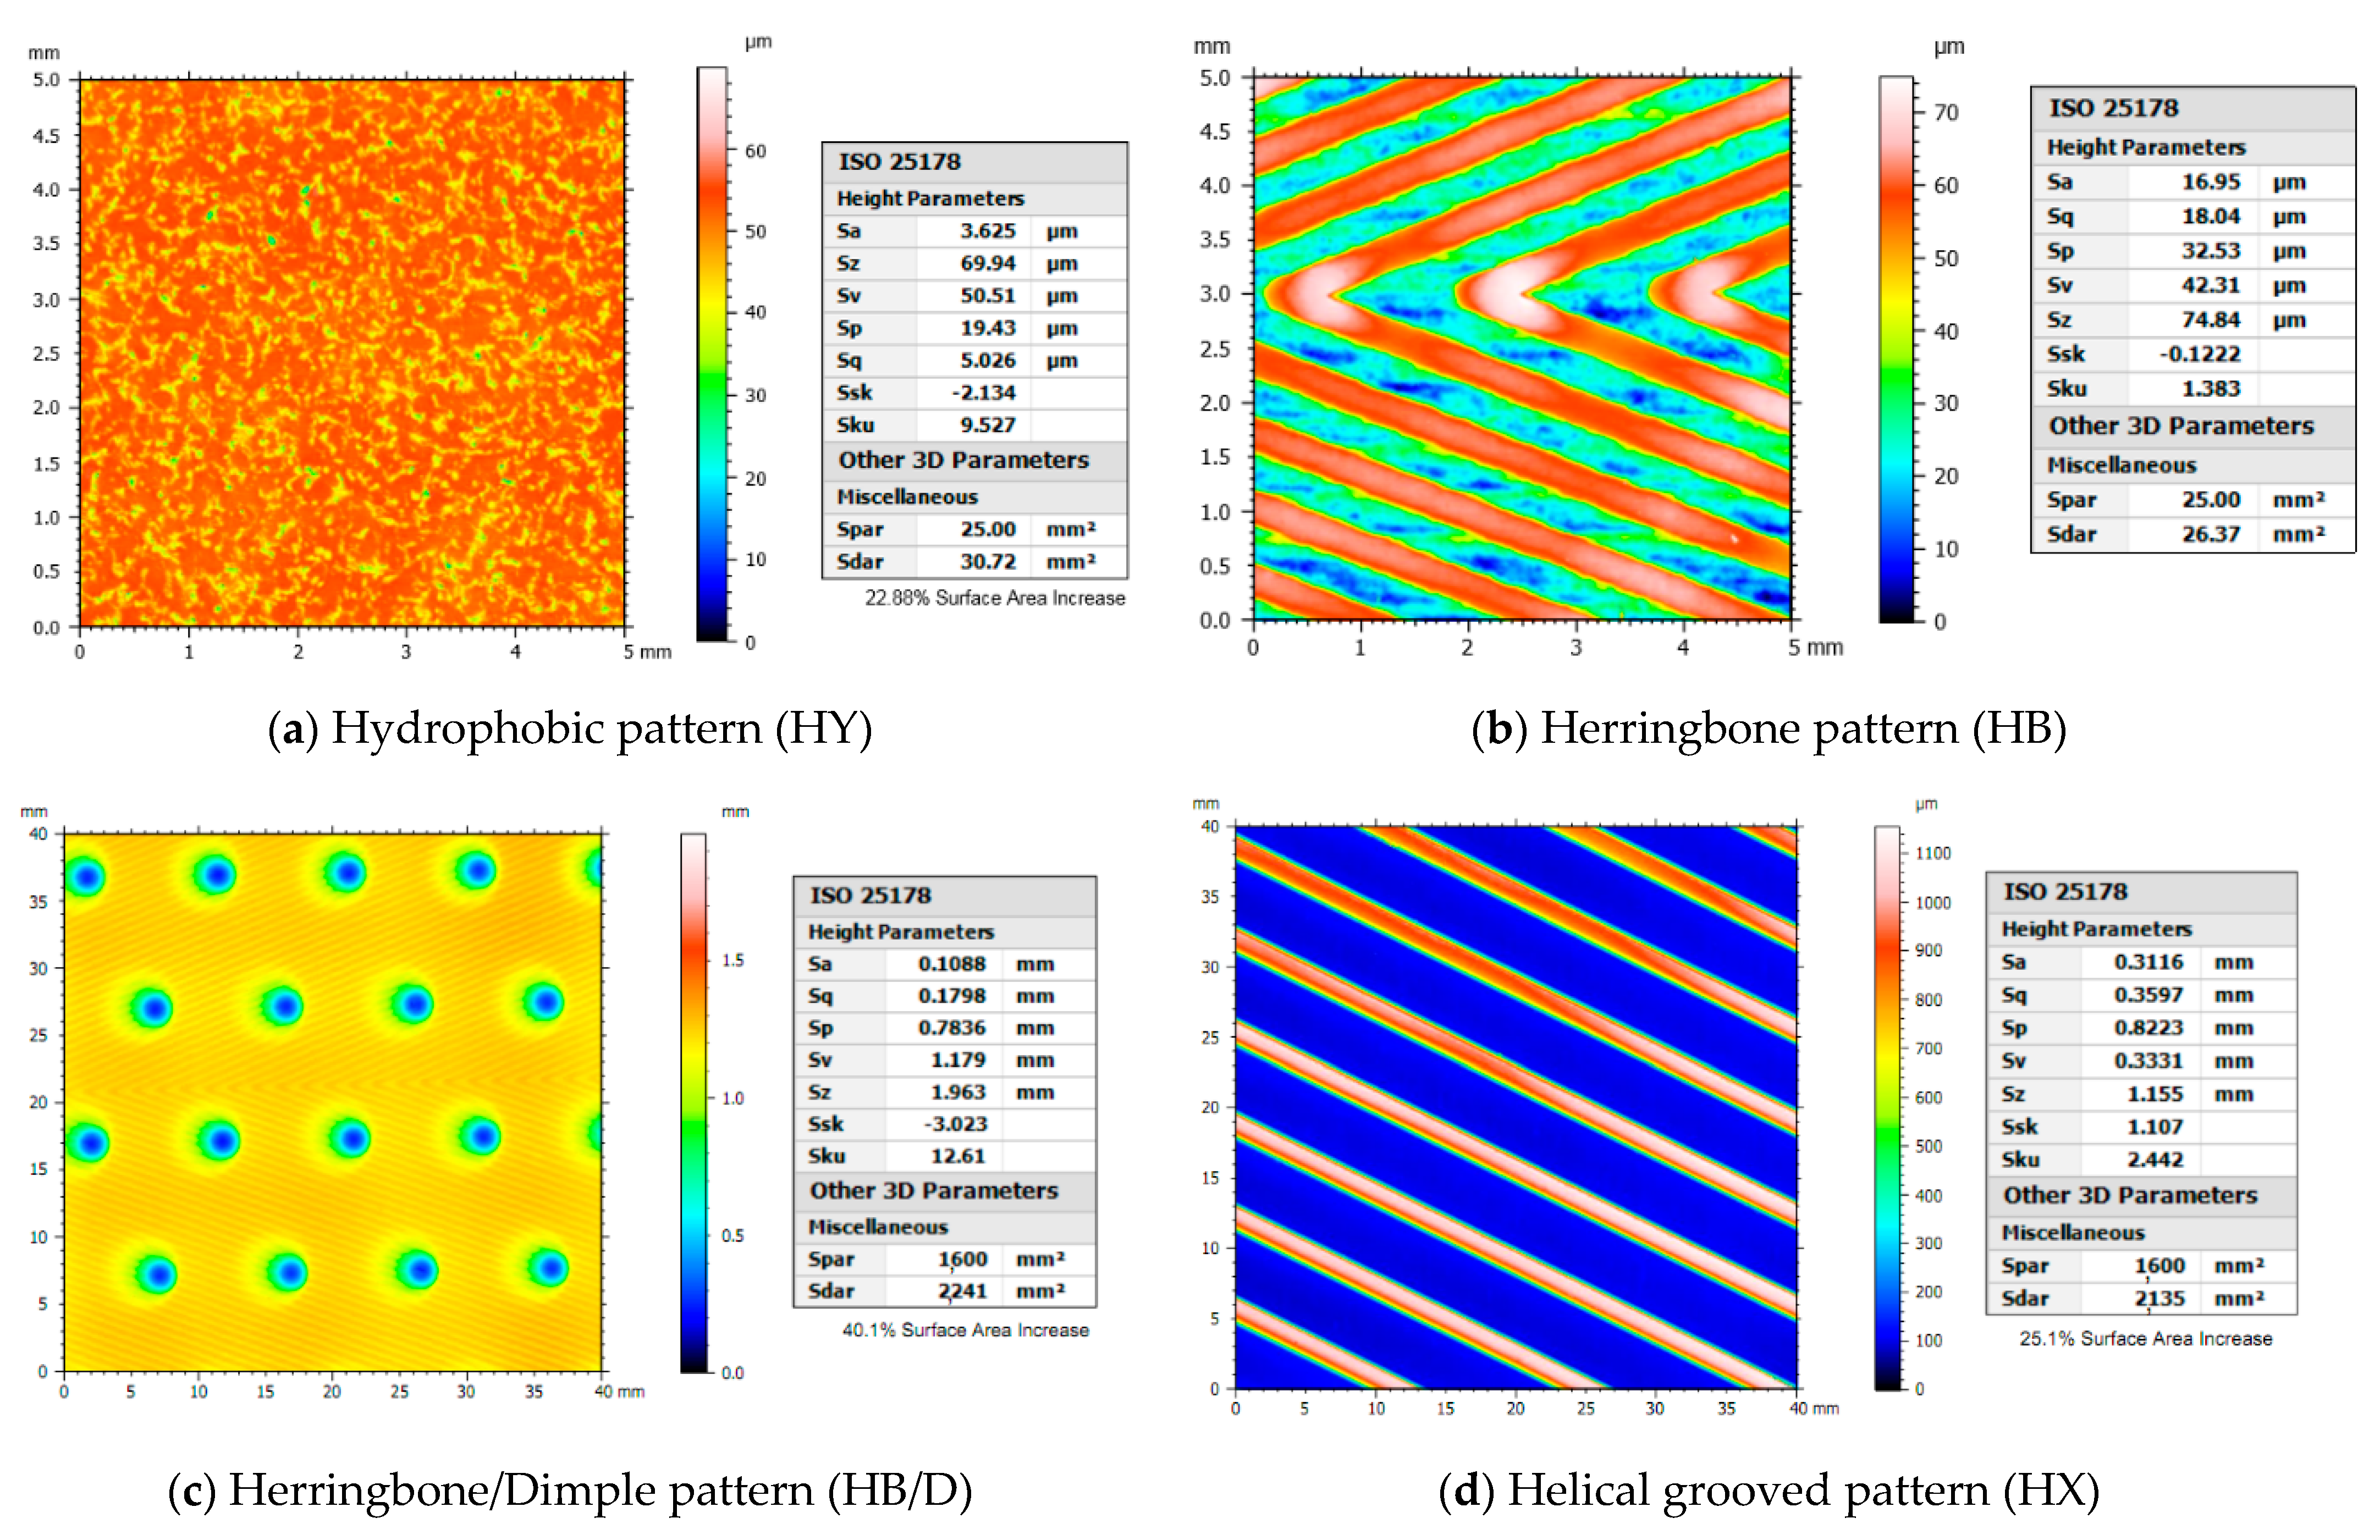
| Sa | arithmetical mean height, mm |
| Sq | root mean square height, mm |
| Sp | maximum peak height, mm |
| Sv | maximum pit height, mm |
| Sz | maximum height, mm |
| Ssk | skewness |
| Sku | kurtosis |
| Spar | projected area, mm2 |
| Sdar | developed area, mm2 |
| T/t | temperature, K/°C |
| U | Total heat transfer coefficient, W/(m2K) |
| x | vapor quality |
| Greek symbols | |
| μ | dynamic viscosity, Pa·s |
| ρ | density, kg/m3 |
| ε | void fraction |
| σ | surface tension, N/m |
| ζ | area ratio |
| Subscripts | |
| bulk | bulk temperature |
| exp | experimental |
| f | frictional |
| g | gravitational |
| i | inner |
| in | inlet |
| l | liquid phase |
| lat | latent heat |
| m | momentum |
| o | outer |
| out | outlet |
| pre | predictive |
| ref | refrigerant |
| s | smooth |
| sat | saturated |
| sc | sudden contraction |
| se | sudden enlargement |
| sens | sensible heat |
| t | total |
| te | test section |
| tp | two-phase |
| ts | test section |
| v | vapor phase |
| wall | wall parameters |
| w | water |
References
- Webb, R.L.; Kim, N.-H. Principles of Enhanced Heat Transfer, 2nd ed.; Taylor & Francis: New York, NY, USA, 2005. [Google Scholar]
- Wang, Y.; He, Y.-L.; Lei, Y.-G.; Zhang, J. Heat transfer and hydrodynamics analysis of a novel dimpled tube. Exp. Therm. Fluid Sci. 2010, 34, 1273–1281. [Google Scholar] [CrossRef]
- Li, M.; Khan, T.S.; Al-Hajri, E.; Ayub, Z.H. Single phase heat transfer and pressure drop analysis of a dimpled enhanced tube. Appl. Therm. Eng. 2016, 101, 38–46. [Google Scholar] [CrossRef]
- Li, M.; Khan, T.S.; Al Hajri, E.; Ayub, Z.H. Geometric optimization for thermal–hydraulic performance of dimpled enhanced tubes for single phase flow. Appl. Therm. Eng. 2016, 103, 639–650. [Google Scholar] [CrossRef]
- Vicente, P.G.; García, A.; Viedma, A. Heat transfer and pressure drop for low Reynolds turbulent flow in helically dimpled tubes. Int. J. Heat Mass Transf. 2002, 45, 543–553. [Google Scholar] [CrossRef]
- Kukulka, D.J.; Smith, R. Thermal-hydraulic performance of Vipertex 1EHT enhanced heat transfer tubes. Appl. Therm. Eng. 2013, 61, 60–66. [Google Scholar] [CrossRef]
- Guo, S.P.; Wu, Z.; Li, W.; Kukulka, D.; Sunden, B.; Zhou, X.P.; Wei, J.J.; Simon, T. Condensation and evaporation heat transfer characteristics in horizontal smooth, herringbone and enhanced surface EHT tubes. Int. J. Heat Mass Transf. 2015, 85, 281–291. [Google Scholar] [CrossRef]
- Li, W.; Chen, J.; Zhu, H.; Kukulka, D.J.; Minkowycz, W.J. Experimental study on condensation and evaporation flow inside horizontal three dimensional enhanced tubes. Int. Commun. Heat Mass 2017, 80, 30–40. [Google Scholar] [CrossRef]
- Li, W.; Tang, W.; Chen, J.; Zhu, H.; Kukulka, D.J.; He, Y.; Sun, Z.; Du, J.; Zhang, B. Convective condensation in three enhanced tubes with different surface modifications. Exp. Therm. Fluid Sci. 2018, 97, 79–88. [Google Scholar] [CrossRef]
- Aroonrat, K.; Wongwises, S. Experimental study on two-phase condensation heat transfer and pressure drop of R-134a flowing in a dimpled tube. Int. J. Heat Mass Transf. 2017, 106, 437–448. [Google Scholar] [CrossRef]
- Aroonrat, K.; Wongwises, S. Condensation heat transfer and pressure drop characteristics of R-134a flowing through dimpled tubes with different helical and dimpled pitches. Int. J. Heat Mass Transf. 2018, 121, 620–631. [Google Scholar] [CrossRef]
- Sarmadian, A.; Shafaee, M.; Mashouf, H.; Mohseni, S.G. Condensation heat transfer and pressure drop characteristics of R-600a in horizontal smooth and helically dimpled tubes. Exp. Therm. Fluid Sci. 2017, 86, 54–62. [Google Scholar] [CrossRef]
- Shafaee, M.; Mashouf, H.; Sarmadian, A.; Mohseni, S.G. Evaporation heat transfer and pressure drop characteristics of R-600a in horizontal smooth and helically dimpled tubes. Appl. Therm. Eng. 2016, 107, 28–36. [Google Scholar] [CrossRef]
- Ayub, Z.H.; Ayub, A.H.; Ribatski, G.; Moreira, T.A.; Khan, T.S. Two-phase pressure drop and flow boiling heat transfer in an enhanced dimpled tube with a solid round rod insert. Int. J. Refrig. 2017, 75, 1–13. [Google Scholar] [CrossRef]
- Kukulka, D.; Smith, R. Comparison of Heat Exchanger Designs Using Vipertex 1EHT Enhanced Heat Transfer Tubes. Chem. Eng. Trans. 2016, 52, 115–120. [Google Scholar]
- Kukulka, D.J.; Smith, R. Experimental Comparison of the Evaporation and Condensation Heat Transfer Coefficients on the Outside of Enhanced Surface Tubes with Different Outer Diameters. Chem. Eng. Trans. 2019, 76, 31–36. [Google Scholar]
- Soontarapiromsook, J.; Mahian, O.; Selim Dalkilic, A.; Wongwises, S. Effect of surface roughness on the condensation of R-134a in vertical chevron gasketed plate heat exchangers. Exp. Therm. Fluid Sci. 2017, 91, 54–63. [Google Scholar] [CrossRef]
- Wang, Y.; Luo, J.; Heng, Y.; Mo, D.; Lyu, S. Wettability modification to further enhance the pool boiling performance of the micro nano bi-porous copper surface structure. Int. J. Heat Mass Transf. 2018, 119, 333–342. [Google Scholar] [CrossRef]
- Wu, Z.; Sunden, B.; Wang, L.; Li, W. Convective Condensation Inside Horizontal Smooth and Microfin Tubes. J. Heat Transf. 2014, 136, 98–99. [Google Scholar] [CrossRef]
- Gnielinski, V. New Equations for Heat and Mass Transfer in Turbulent Pipe and Channel Flow. Int. Chem. Eng. 1976, 16, 8–16. [Google Scholar]
- Petukhov, B.S. Heat Transfer and Friction in Turbulent Pipe Flow with Variable Physical Properties. Adv. Heat Transf. 1970, 6, 503–564. [Google Scholar]
- Rouhani, S.Z.; Axelsson, E. Calculation of void volume fraction in the subcooled and quality boiling regions. Int. J. Heat Mass Tran. 1970, 13, 383–393. [Google Scholar] [CrossRef]
- Moffat, R.J. Describing the uncertainties in experimental results. Exp. Therm. Fluid Sci. 1988, 1, 3–17. [Google Scholar] [CrossRef]
- Shah, M.M. A general correlation for heat transfer during film condensation inside tube. Int. J. Heat Mass Transf. 1979, 22, 547–556. [Google Scholar] [CrossRef]
- Cavallini, A.; Col, D.D.; Doretti, L.; Matkovic, M.; Rossetto, L.; Zilio, C.; Censi, G. Condensation in horizontal smooth tubes: A new heat transfer model for heat exchanger design. Heat Transf. Eng. 2006, 27, 31–38. [Google Scholar] [CrossRef]
- Haraguchi, H.; Koyama, S.; Fujii, T. Condensation of Refrigerants HCFC 22, HFC 134a and HCFC 123 in a Horizontal Smooth Tube (2nd Report, Proposals of Empirical Expressions for the Local Heat Transfer Coefficient). Trans. Jpn. Soc. Mech. Eng. Ser. B 1994, 60, 2117–2124. Available online: https://kyushu-u.pure.elsevier.com/en/publications/condensation-of-refrigerants-hcfc-22-hfc-134a-and-hcfc-123-in-a-h (accessed on 6 February 2021). [CrossRef]
- Li, G.-Q.; Wu, Z.; Li, W.; Wang, Z.-K.; Wang, X.; Li, H.-X.; Yao, S.-C. Experimental investigation of condensation in micro-fin tubes of different geometries. Exp. Therm. Fluid Sci. 2012, 37, 19–28. [Google Scholar] [CrossRef]
- Kedzierski, M.; Goncalves, J.M. Horizontal convective condensation of alternative refrigerants within a micro-fin tube. J. Enhanc. Heat Transf. 1999, 6, 161–178. [Google Scholar] [CrossRef]
- Diani, A.; Brunello, P.; Rossetto, L. R513A condensation heat transfer inside tubes: Microfin tube vs. smooth tube. Int. J. Heat Mass Transf. 2020, 152, 119472. [Google Scholar] [CrossRef]
- Liu, Z.; Winterton, R.H.S. A general correlation for saturated and subcooled flow boiling in tubes and annuli, based on a nucleate pool boiling equation. Int. J. Heat Mass Transf. 1991, 34, 2759–2766. [Google Scholar] [CrossRef]
- Fang, X. A new correlation of flow boiling heat transfer coefficients based on R134a data. Int. J. Heat Mass Transf. 2013, 66, 279–283. [Google Scholar] [CrossRef]
- Gungor, K.E.; Winterton, R.H.S. A general correlation for flow boiling in tubes and annuli. Int. J. Heat Mass Transf. 1986, 29, 351–358. [Google Scholar] [CrossRef]
- Hojati, A.; Akhavan-Behabadi, M.A.; Hanafizadeh, P.; Ahmadpour, M.M. An Experimental Investigation on R134a Evaporation inside an Internally Discrete Inclined Grooved Tube. Heat Transf. Eng. 2020. [Google Scholar] [CrossRef]
- Yang, C.; Hrnjak, P. Effect of helical micro-fins on two-phase flow behavior of R410A evaporating in horizontal round tubes obtained through visualization. Int. J. Heat Mass Transf. 2019, 144, 118654. [Google Scholar] [CrossRef]
- Yang, C.; Hrnjak, P. Diabatic visualization shows effects of micro-fins on evaporation of R410A: Smooth, axial micro-fin, and helical micro-fin tubes. Int. J. Heat Mass Transf. 2020, 150, 119276. [Google Scholar] [CrossRef]
- Li, H.; Hrnjak, P. Heat Transfer Coefficient, Pressure Gradient, and Flow Patterns of R1234yf Evaporating in Microchannel Tube. ASME J. Heat Transfer. 2021. [Google Scholar] [CrossRef]
- Rashidi, S.; Hormozi, F.; Sarafraz, M.M. Fundamental and subphenomena of boiling heat transfer. J. Therm. Anal. Calorim. 2020. [Google Scholar] [CrossRef]


| Parameters | HX | HB | HB/D |
|---|---|---|---|
| Dimple/fin height, mm | 1.14 | 0.08 | 1.21 |
| Dimple/fin pitch, mm | 5 | 0.8 | 4 |
| Dimple/fin width, mm | 2.3 | 0.31 | 3.51 |
| Helix angle, ° | 26.2 | 21 | 63 |
| Primary Parameters | Accuracy |
|---|---|
| Diameter | ±0.05 mm |
| Electricity | ±0.1 A |
| Voltage | ±0.1 V |
| Length | ±0.5 mm |
| Temperature | ±0.1 K |
| Range of Pressure: 0–5000 kPa | ±0.075% of full scale |
| Range Pressure Drop: 0–50 kPa | ±0.075% of full scale |
| Range of the Water Flowrate: 0–1000 kg/h | ±0.2% of reading |
| Range of the Refrigerant Flowrate: 0–130 kg/h | ±0.2% of reading |
| Calculated parameters | Accuracy |
| Mass flux, Gref, kg/(m2 s) | ±1.17% |
| Heat flux, kW/m2 | ±2.64% |
| Vapor quality, x | ±4.12% |
| Condensation heat transfer coefficient, h (W/m2K) | ±13.57% |
| Evaporation heat transfer coefficient, h (W/m2K) | ±10.56% |
Publisher’s Note: MDPI stays neutral with regard to jurisdictional claims in published maps and institutional affiliations. |
© 2021 by the authors. Licensee MDPI, Basel, Switzerland. This article is an open access article distributed under the terms and conditions of the Creative Commons Attribution (CC BY) license (http://creativecommons.org/licenses/by/4.0/).
Share and Cite
Zheng, B.; Wang, J.; Guo, Y.; Kukulka, D.J.; Tang, W.; Smith, R.; Sun, Z.; Li, W. An Experimental Study of In-Tube Condensation and Evaporation Using Enhanced Heat Transfer (EHT) Tubes. Energies 2021, 14, 867. https://doi.org/10.3390/en14040867
Zheng B, Wang J, Guo Y, Kukulka DJ, Tang W, Smith R, Sun Z, Li W. An Experimental Study of In-Tube Condensation and Evaporation Using Enhanced Heat Transfer (EHT) Tubes. Energies. 2021; 14(4):867. https://doi.org/10.3390/en14040867
Chicago/Turabian StyleZheng, Boren, Jiacheng Wang, Yu Guo, David John Kukulka, Weiyu Tang, Rick Smith, Zhichuan Sun, and Wei Li. 2021. "An Experimental Study of In-Tube Condensation and Evaporation Using Enhanced Heat Transfer (EHT) Tubes" Energies 14, no. 4: 867. https://doi.org/10.3390/en14040867
APA StyleZheng, B., Wang, J., Guo, Y., Kukulka, D. J., Tang, W., Smith, R., Sun, Z., & Li, W. (2021). An Experimental Study of In-Tube Condensation and Evaporation Using Enhanced Heat Transfer (EHT) Tubes. Energies, 14(4), 867. https://doi.org/10.3390/en14040867