Article

Performance Analysis of Modular Multilevel Converter and Modular Multilevel Series Converter under Variable-Frequency Operation Regarding Submodule-Capacitor Voltage Ripple

1
Department of Energy Technology, Aalborg University, 9220 Aalborg, Denmark
2
Department of Electrical Engineering, Eindhoven University of Technology, 5612 Eindhoven, The Netherlands
*
Author to whom correspondence should be addressed.
Energies 2021, 14(3), 776; https://doi.org/10.3390/en14030776
Submission received: 18 January 2021 / Revised: 27 January 2021 / Accepted: 29 January 2021 / Published: 2 February 2021
(This article belongs to the Special Issue Modular Multilevel Converters MMC)

Abstract

:
The modular multilevel converter is capable to reach high-voltage levels with high flexibility, high reliability, and high power quality as it became the standard solution for high-power high-voltage applications that operate with fixed frequency. However, in machine-drive applications, the modular multilevel converter shows critical problems since an extremely high submodule-capacitor voltage ripple occurs in the machine start-up and at low-speed operation, which can damage the converter. Recently, a new converter solution named modular multilevel series converter was proposed as a promising alternative for high-power machine-drive applications since it presented many important structural and operational advantages in relation to the modular multilevel converter such as the reduced number of submodule capacitors and the low submodule-capacitor voltage ripple at low frequencies. Even though the modular multilevel series converter presented a reduced number of capacitors, the size of these capacitors was not analyzed. This paper presents a detailed comparison analysis of the performance of the modular multilevel converter and the modular multilevel series converter at variable-frequency operation, which is based on the proposed analytical description of the submodule-capacitor voltage ripple in such topologies. This analysis concludes that the new modular multilevel series converter can be designed with smaller capacitors in comparison to the modular multilevel converter if these converters are used to drive electrical machines that operate within a range of low-frequency values. In other words, the modular multilevel series converter experiences extremely low submodule-capacitor voltage ripple at very low frequencies, which means that this converter solution presents high performance in the electrical machine start-up and at low-speed operation.

1. Introduction

In order to keep up with the development of the modern industry, many high-power electrical applications have been emerging such as the high-voltage-direct-current (HVDC) transmission systems, upscaled wind turbines [1,2,3,4,5], pumped-hydro-storage systems [6,7,8] and heavy industrial motor drives. The invention of the modular multilevel converter (MMC), shown in Figure 1a, represented a breakthrough in the usage of power-electronic devices connected to the electrical grid since this converter topology is capable to reach extremely high voltage levels with high flexibility, high reliability and high power quality. However, the MMC presents some critical limitations when it operates with low-frequency values as in machine-drive applications [9,10,11,12], for example. Due to the MMC topology and operation, an AC current with the fundamental component and with double the fundamental component of the frequency at the AC terminals of the converter appears flowing through the submodule capacitors. Since the MMC submodule-capacitor voltages are floating ones, then a ripple with the two mentioned components will occur in the submodule capacitors. As lower the frequency of the synthesized AC voltage, more critical will be the submodule-capacitor voltage ripple since it is proportional to the capacitor reactance, which is inversely proportional to the current frequency. Thus, in applications such as flexible pumped-hydro-storage systems and heavy industrial drives, the MMC submodule-capacitor voltage-ripple problem can be very serious. These applications often operate close to the 0-Hz point (or even cross this point), which would result in an intolerable submodule-capacitor voltage ripple if the MMC were to be used to drive the electrical machines. In [13], for example, the authors reported that the peak value of the MMC submodule-capacitor voltage ripple in the machine start-up can be four times higher than the nominal DC voltage of the capacitor. Since the submodule IGBTs are typically designed with a maximum tolerable voltage two times higher than the nominal DC voltage of the submodule capacitor, then it means that the submodule-capacitor voltage ripple, in the machine start-up, can be up to two times higher than the maximum tolerable voltage of the IGBTs, which will lead to their destruction if no protective measures are adopted. One way to solve this problem is to build a MMC with bigger capacitors to limit the high voltage ripple at low frequencies but with the downside of increasing the cost, size and weight. Another approach is to modulate an extra common-mode-voltage component in combination with the injection of circulating-current components [10,14] to reduce the MMC submodule-capacitor voltage ripple at low-speed operation. Nonetheless, in this approach, huge overcurrents occur in the MMC arms due to the high peak values of the circulating-current components injected to compensate for the high submodule-capacitor voltage ripple in the machine start-up. This control technique can avoid the need of bigger submodule capacitors but, due to the overcurrents in the MMC arms, semiconductor devices with higher current ratings might be required, which would result in higher costs. Moreover, the extra commom-mode voltage synthesized increases the voltage stress in the machine winding insulation and increases the shaft voltage, which could lead to bearing and shaft failures [14]. Instead of trying to overcome the MMC poor performance at low frequencies through control techniques, many papers in the literature have been proposing new converter topologies [15,16,17,18,19,20,21,22] as alternatives for high-power machine-drive applications mostly aiming at obtaining better performance at low frequencies but also aiming at obtaining solutions with a reduced component count, resulting in reduced costs, size, weight and conduction losses in comparison to the MMC.
Recently, a new converter solution named modular multilevel series converter (MMSC), illustrated in Figure 1b, was proposed [22] as a promising alternative for high-power medium-voltage machine-drive applications. In [22], the authors highlighted operational characteristics of the MMSC that are advantageous in comparison to alternative converter topologies such as the straightforward control and modulation, the high performance under unbalanced grid conditions and the low submodule-capacitor voltage ripple at low frequencies. As explained in [22], there is one component of the MMSC that deserves special attention, which is the bidirectional-switch valve. The MMSC topology is composed of only one submodule string connected between each grid phase and each load phase. This is a characteristic that results in many operational and structural advantages of the MMSC in relation to the MMC. Due to this specific component connection, the MMSC requires bidirectional-switch valves to connect each submodule string to two different phases of the grid. Considering that the MMSC was proposed for medium-voltage applications, then series-connected semiconductor devices might be required to build the bidirectional-switch valves since the most modern semiconductor devices available in the industry present rated voltage of maximum 10 kV. The operation of series-connected semiconductor devices could result in reliability problems. Nonetheless, one special characteristic of the MMSC bidirectional-switch valves is that they operate with an extremely low switching frequency (50 Hz, which is the grid frequency) and, thus, poor reliability should not be a problem. In other words, the operation of series-connected semiconductor devices can be dangerous due to poor dynamic-voltage sharing among the series-connected devices at the moment of the current commutation, which might lead to the destruction of these devices if they end up blocking a voltage value higher than their nominal voltage. This problem is emphasized as higher the switching frequency is. Since the bidirectional-switch valves of the MMSC operate with low switching frequency, then their operation can occur is a safe and reliable fashion. As explained in detail in [22], there are some modern IGBT valves composed of several series-connected devices that operate with high reliability due to advanced drivers that guarantee proper dynamic-voltage sharing among the series-connected devices. Moreover, due to the low switching frequency, other techniques such as the use of snubber circuits can be adopted to protect the switches. Due to the low switching frequency, the losses in the snubber circuits are low since current only flows through these circuits during the current commutation of the switching process. Anyway, the bidirectional-switch valves are components that deserve special attention in the construction of the MMSC.
In [22], a detailed comparison analysis between the MMSC and the MMC in terms of number of components was carried out, which concluded that the MMSC presents a reduced number of semiconductor devices and a considerably reduced number of submodule capacitors in relation to the MMC. However, in [22], no explanation was given regarding the size of these capacitors. Since the applications considered are variable-frequency ones, in order to design the submodule capacitors, a deep analysis of the voltage ripple must be carried out taking into account the entire frequency range of operation.
In this paper, a detailed comparison analysis between the MMC and the MMSC is presented, which is based on the analytical description of the submodule-capacitor voltage ripple for a wide frequency range. Simulation and experimental results are presented to validate the proposed analytical model, leading to concrete conclusions that prove the superior performance of the MMSC at low-frequency operation in relation to the MMC. Even more important, the analysis presented in this paper proves that besides having a considerably reduced number of capacitors, the MMSC also can be built with smaller capacitors in comparison to the MMC in machine-drive applications. This fact further indicates that the MMSC should be a solution with considerably reduced size and weight in relation to the MMC and, thus, it should be an interesting option for applications that require lightness and compactness. Moreover, the analytical model proposed in this paper is a helpful tool that can be used in the design stage of the MMSC in order to define the size of the submodule capacitors for a given application with a given frequency range of operation.

2. Analytical Description of Submodule-Capacitor Voltage Ripple

In this section, an analytical description of the submodule-capacitor voltage ripple of the MMC and the MMSC for different frequencies is carried out, which explains why the MMSC presents superior performance at low frequencies in comparison to the MMC.

2.1. MMC

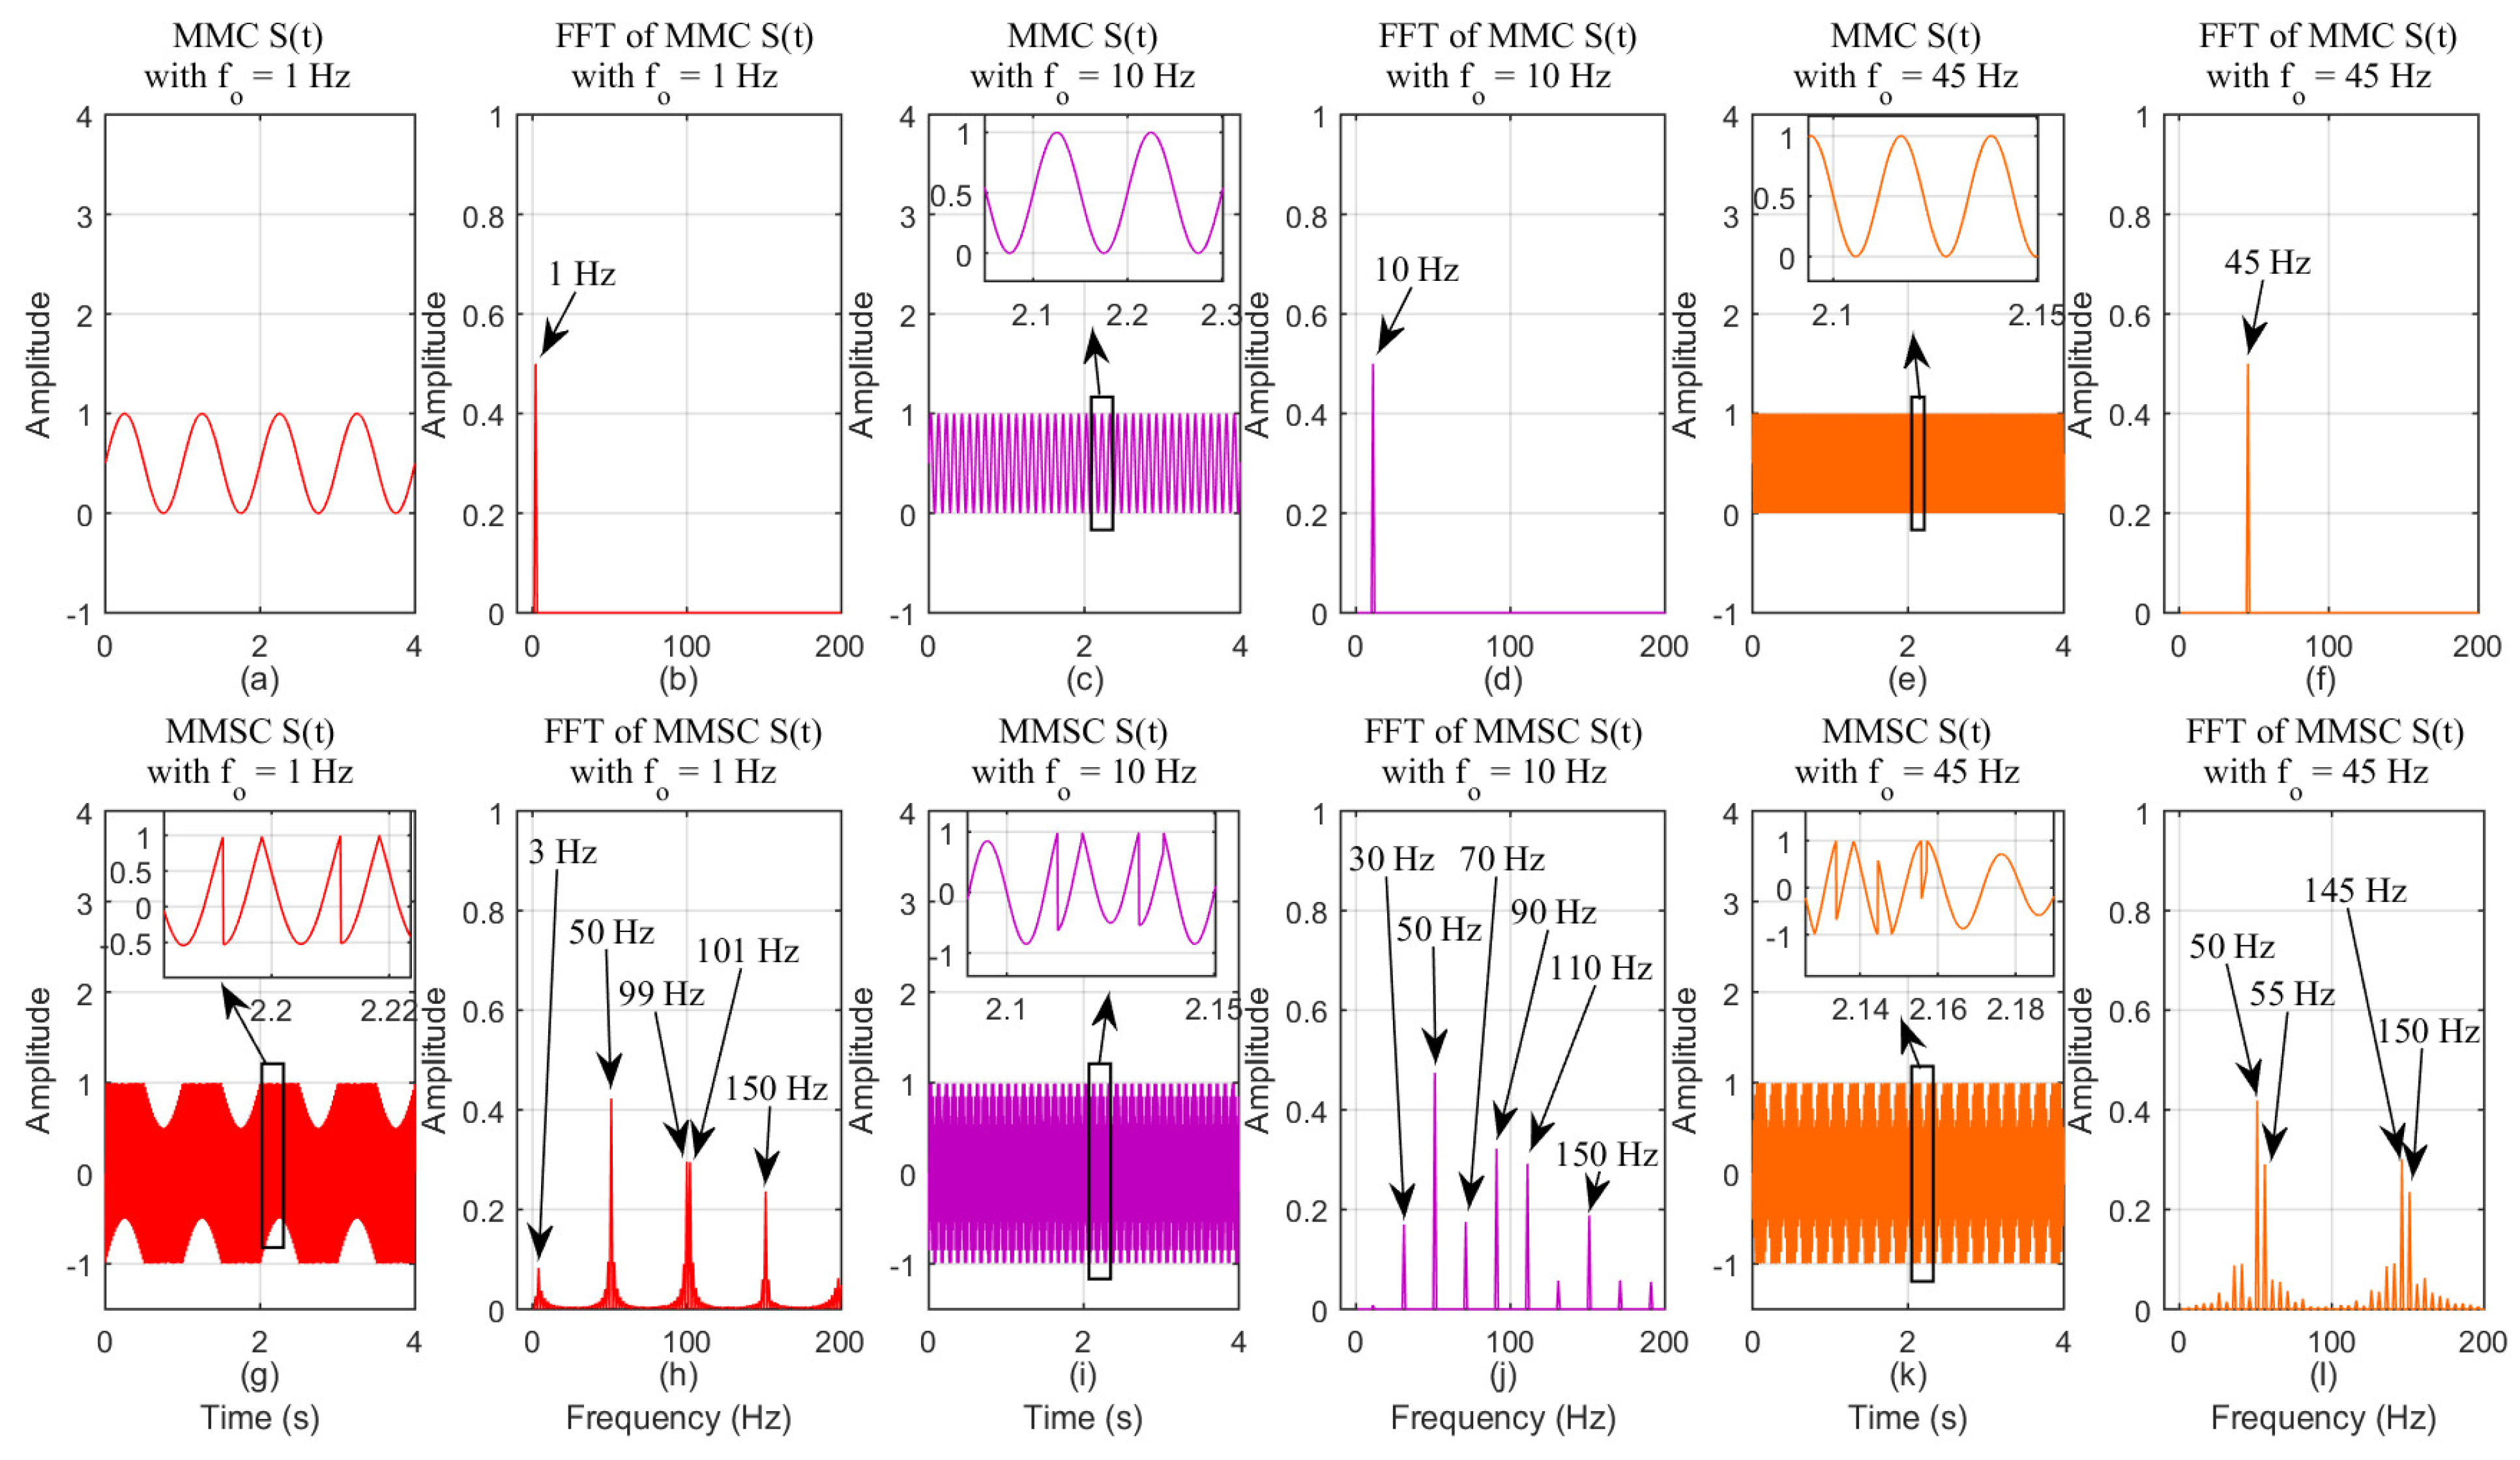
If a MMC is supposed to synthesize a f o -Hz AC voltage, then each MMC arm must operate inserting submodules with a given insertion-index pattern ( S ( t ) ) that is represented by a f o -Hz signal that varies from 0 to N, in a discrete fashion, corresponding to the instantaneous number of submodules inserted in series. In this paper, an approximation is made, which consists in considering S ( t ) to be a continuous signal normalized by the number of submodules in one arm (N). Thus, S ( t ) is a f o -Hz continuous signal that varies from 0 to 1. In this analysis, the authors consider that a MMC with a DC-link voltage equal to V D C = 20 kV must synthesize an AC voltage with amplitude equal to V o = 10 kV (phase-to-ground, peak value), while providing power to a R L load ( R = 100 Ω and L = 10 mH). This load represents an electrical machine being controlled to operate with unit power factor. In other words, in machine-drive applications, the machine speed is controlled according to the necessities and its reactive power is usually kept null to avoid losses and to avoid exceeding the conductor current capacity. Nonetheless, a purely resistive load would not properly represent the machine as there should be an inductance. Thus a low X R ratio was selected that basically means unit power factor for low frequencies. It is also important to emphasize that, as described in detail in [22], V D C = 20 kV is the minimum DC-link-voltage value possible so that the MMC is capable to synthesize the desired load voltage equal to V o = 10 kV. It means that the MMC with minimum voltage ratings is being considered to allow for a fair comparison with the MMSC that will also be designed with its minimum voltage ratings. The MMC has N = 10 half-bridge (HB) submodules in each arm. In Figure 2a,c,e, one can observe the MMC insertion-index signals ( S ( t ) ) when the frequency of the AC voltage to be synthesized presents values equal to f o = 1 , 10 , 45 Hz, respectively. In Figure 2b,d,f, one can observe the fast Fourier transform (FFT) of the signals shown in Figure 2a,c,e, respectively. The insertion-index signals shown in Figure 2a,c,e were mathematically described as follows:
S ( t ) = 0.5 sin ( ω o t ) + 0.5
in which ω o = 2 π f o . The current that flows through the MMC arms, considering that all the undesired AC-circulating-current components are suppressed, is equal to:
i a r m ( t ) = i A C ( t ) 2 + i D C ( t ) 3
The AC voltage synthesized by the MMC is represented by:
v A C ( t ) = V o sin ( ω o t )
Thus, the AC current that flows through the load is equal to:
i A C ( t ) = v A C ( t ) | R + j ω o L | = V o sin ( ω o t + θ ) | R + j ω o L |
in which θ is the load angle that is neglected in this case since R > > L is considered, which basically means unit power factor. Considering the approximation that the AC-side power is equal to the DC-side power ( P A C = P D C ), then the following equation is obtained:
3 ( 3 2 V o ) I A C = V D C I D C
in which I A C is the rms value of the AC current ( i A C ). Thus:
i D C ( t ) = I D C = 3 V o I A C 2 V D C
By substituting (4) and (6) into (2), the final equation for the arm current ( i a r m ) is obtained, which is equal to:
i a r m ( t ) = V o sin ( ω o t + θ ) 2 | R + j ω o L | + V o I A C 2 V D C
The current that flows through the submodule capacitors causing the voltage ripple can be defined as follows:
i c a p ( t ) = i a r m ( t ) S ( t )
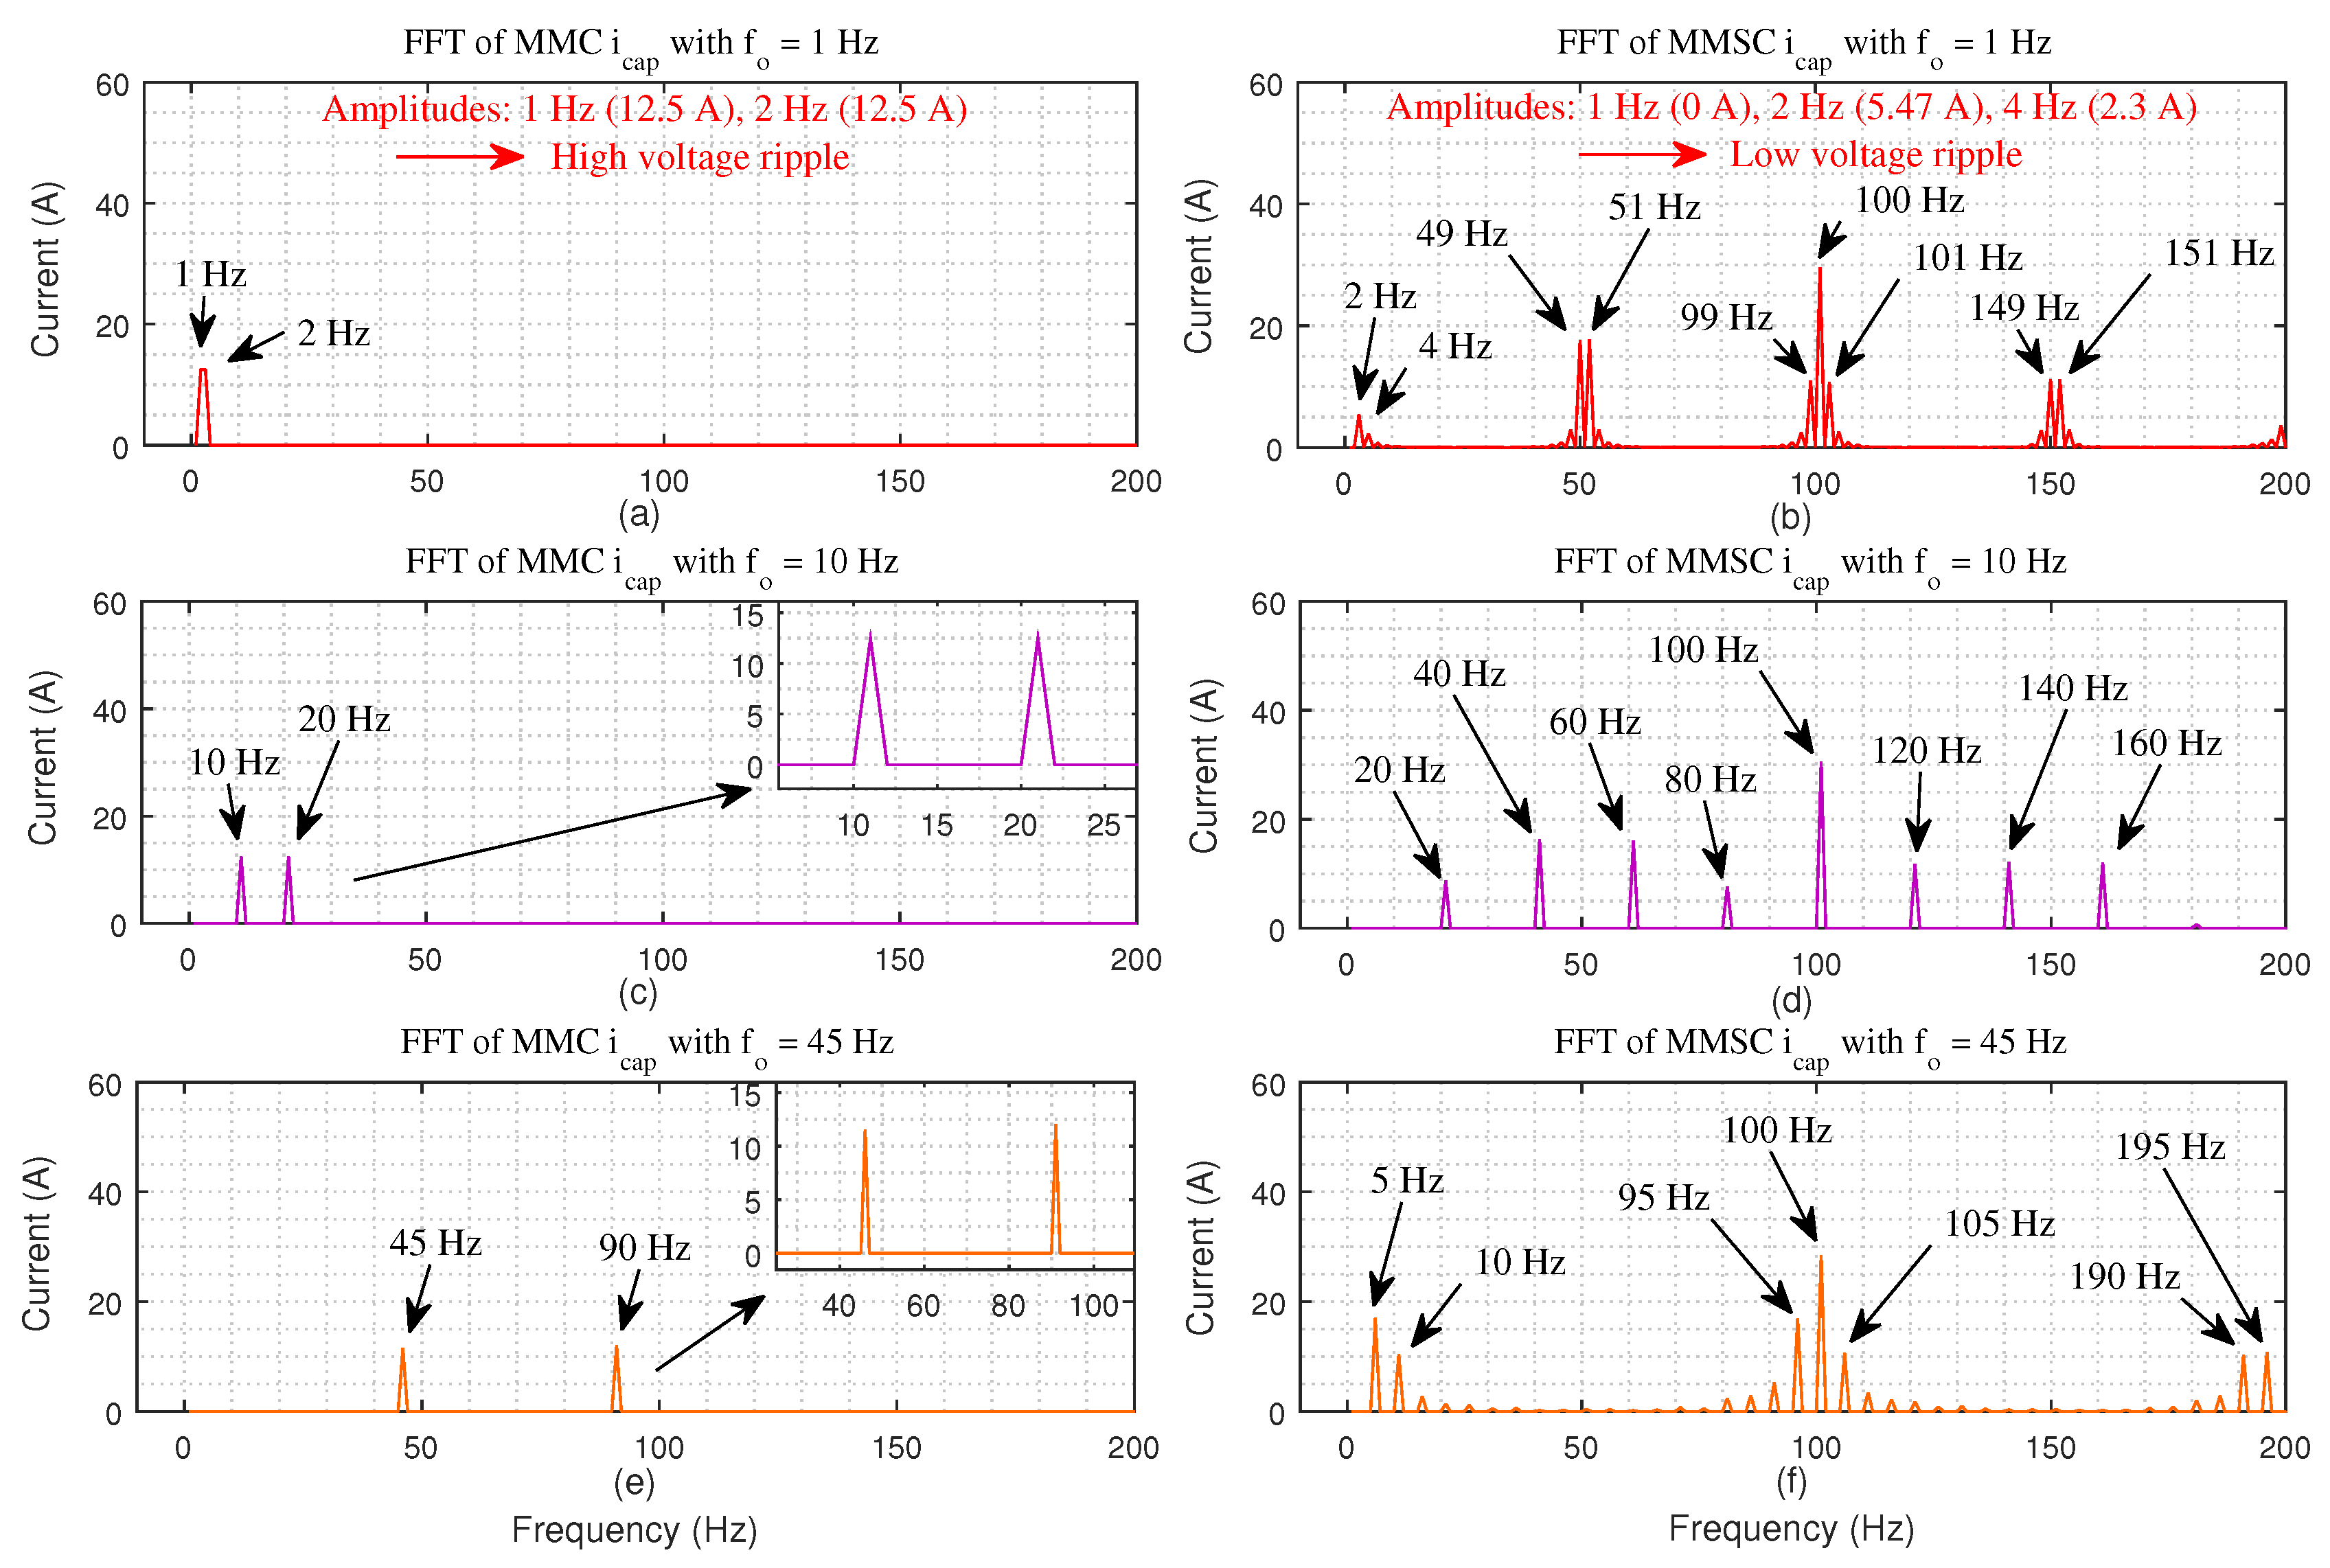
The FFT of the MMC capacitor current ( i c a p ), obtained through (8), when the frequency of the AC voltage to be synthesized presents values equal to f o = 1 , 10 , 45 Hz, is shown in Figure 3a,c,e, respectively. The MMC capacitor current ( i c a p ) was calculated considering V D C = 20 kV, V o = 10 kV, R = 100 Ω and L = 10 mH. For the 1-Hz case, there are 1-Hz and 2-Hz current components flowing through the capacitors. These current components present expressive amplitudes as they are responsible for the high voltage ripple in the MMC submodule capacitors and, thus, its poor performance at low frequencies. These currents will be compared with the MMSC case that is presented in the next subsection.

2.2. MMSC

In this analysis, the authors consider that a MMSC connected to a grid that has voltage amplitude equal to V g = 20 kV (phase-to-ground, peak value) and frequency equal to f i = 50 Hz must synthesize an AC voltage with amplitude equal to V o = 10 kV, while supplying power to a R L load ( R = 100 Ω and L = 10 mH). Similarly to the MMC case, V g = 20 kV is the minimum voltage possible connected to the MMSC input terminals so that the converter is capable to synthesize the desired load voltage equal to V o = 10 kV. The MMSC has N = 10 full-bridge (FB) submodules in each string. These parameters are equivalent to the MMC ones so that it is possible to obtain a fair comparison between the two converters. In other words, both converters were designed with their minimum voltage ratings, as described in [22], and both of them must synthesize the same AC voltage, providing power to the same load, resulting in an identical AC current flowing towards the converters. The detailed operation of the MMSC was presented in [22]. Considering that the bidirectional-switch operation is disabled and, thus, that the phase-A submodule string is always connected to phase A of the grid, then, according to Kirchhoff’s law, the voltage that must be synthesized across the MMSC phase-A submodule string ( v s a ( t ) ) in order to obtain the desired voltage at the load terminals ( v A C ( t ) ) is equal to:
v s a ( t ) = v A C ( t ) v g a ( t ) = V o sin ( ω o t ) V g sin ( ω i t + ϕ )
where ω i = 2 π f i . As described in [22], according to Kirchhoff’s law and conservation of energy, the average value of the capacitor voltages in each submodule of a given string converges to approximately V g N , in steady state. Thus, the voltage that the MMSC is capable to synthesize in series is:
v s a ( t ) = V g N S ( t )
in which S ( t ) is the insertion-index signal that represents the instantaneous number of submodules inserted in series. This signal varies in a discrete fashion from N to N. Positive values of S ( t ) mean that the FB submodules are inserted with positive polarity, whereas negative values mean that the submodules are inserted with negative polarity. Similarly to the MMC case, the insertion-index pattern ( S ( t ) ) is approximated by a continuous signal normalized by the number of submodules N. In other words, S ( t ) is approximated by a continuous signal that varies from 1 to 1 and, thus, (10) is rewritten as follows:
v s a ( t ) = V g N S ( t ) N = V g S ( t )
Through (11), it is clear that the maximum voltage that the MMSC is capable to synthesize in series is equal to V g . However, the voltage that the converter must synthesize in series in order to obtain the desired voltage at the load terminals (see Equation (9)) is higher than V g at some moments since f o f i is considered. At these moments, the MMSC would lose control over the load voltage. That is why the connection to phase B of the grid, through the bidirectional switches, is required. In order to obtain the MMSC insertion-index signal, considering that the bidirectional-switch switching is disabled and, thus, that the phase-A submodule string is always connected to phase A of the grid, then Equation (11) is substituted into Equation (9) resulting in:
S ( t ) = V o V g sin ( ω o t ) sin ( ω i t + ϕ )
Since the MMSC is only capable of properly synthesizing the load voltage because it operates connecting the phase-A submodule string to both phase A and phase B of the grid, then, the real insertion-index pattern is a signal represented by (12) if S ( t ) is within the limits 1 and 1 (phase-A submodule string kept connected to phase A of the grid) and represented by (13) if S ( t ) exceeds the limits 1 and 1 (phase-A submodule string must be connected to phase B of the grid). The addition of the term 2 π 3 in Equation (13) represents the connection of the phase-A submodule string to phase B of the grid. In other words, Equation (13) is obtained by replacing v g a in Equation (9) by v g b = V g sin ( ω i t + ϕ 2 π 3 ) .
S ( t ) = V o V g sin ( ω o t ) sin ( ω i t + ϕ 2 π 3 )
The MMSC insertion-index signal (represented by Equations (12) and (13)) is shown in Figure 2g,i,k for the cases in which the frequency of the AC voltage to be synthesized presents values equal to f o = 1 , 10 , 45 Hz, respectively. The MMSC insertion-index signals ( S ( t ) ) were calculated considering V g = 20 kV, f i = 50 Hz and V o = 10 kV. The FFT of these signals are shown in Figure 2h,j,l, respectively. As illustrated in Figure 1b, the current that flows through the MMSC phase-A string is equal to:
i s t r i n g ( t ) = i A C ( t )
in which:
i A C ( t ) = v A C ( t ) | R + j ω o L | = V o sin ( ω o t + θ ) | R + j ω o L |
The current that flows through the submodule capacitors causing the voltage ripple can be defined as follows:
i c a p ( t ) = i s t r i n g ( t ) S ( t )
By multiplying the insertion-index signals ( S ( t ) ) illustrated in Figure 2g,i,k by the string current ( i s t r i n g ) calculated according to (14) (considering V o = 10 kV, R = 100 Ω and L = 10 mH), the MMSC capacitor currents ( i c a p ) are obtained for the cases in which the frequency of the AC voltage to be synthesized presents values equal to f o = 1 , 10 , 45 Hz. The FFT of these signals are illustrated in Figure 3b,d,f, respectively.
By analyzing Figure 2 and Figure 3, it is possible to understand the improved performance of the MMSC at low frequencies in comparison to the MMC. In order to develop this analysis, let us observe the 1-Hz operation that is illustrated in Figure 2a,b and Figure 3a, for the MMC case, and illustrated in Figure 2g,h and Figure 3b, for the MMSC case. In the MMC case, if a f o = 1 -Hz load voltage is to be synthesized, a f o = 1 -Hz insertion-index signal ( S ( t ) ), as illustrated in Figure 2a,b, will be required. According to Equation (7), the MMC arm current ( i a r m ) will be composed of a f o = 1 -Hz component as well as of a DC component. Thus, the capacitor current ( i c a p ), obtained through Equation (8), will be composed of a f o = 1 -Hz component as well as of a 2 f o = 2 -Hz component, as shown in Figure 3a. In the MMSC case, the main frequency component of the insertion-index signal ( S ( t ) ) that will contribute for a high voltage ripple is the 3-Hz component, as illustrated in Figure 2g,h. In the MMSC case, the capacitor current ( i c a p ), obtained through Equation (16), will present a 2-Hz component as well as a 4-Hz component as illustrated in Figure 3b. These two components are obtained by multiplying the 3-Hz component present in S ( t ) by the f o = 1 -Hz component present in i s t r i n g = i A C . It is very important to notice that, since the 3-Hz component of S ( t ) has a very small amplitude, then the 2-Hz component as well as the 4-Hz component, present in the capacitor-current frequency spectrum, will also have very small amplitudes. The capacitor voltage ripple is proportional to the capacitor reactance, which is inversely proportional to the current frequency as follows:
X c = 1 2 π f C
Thus, if one compares the MMC and MMSC capacitor-current frequency spectrum, which are illustrated in Figure 3a,b, respectively, they will notice that the voltage ripple will be much higher in the MMC case. In other words, the capacitor current in the MMC case presents both a 1-Hz and a 2-Hz components with considerably high amplitudes ( 12.5 A in both cases). The capacitor current in the MMSC case does not present the 1-Hz component (which is the most influential component for the voltage ripple), as it presents only a 2-Hz component with considerable amplitude (equal to 5.47 A), which is still a much smaller amplitude in comparison to the 2-Hz component in the MMC case. The other components present in the MMSC capacitor-current frequency spectrum correspond to higher frequencies that do not result in a considerable voltage ripple according to Equation (17).

3. Simulation Results

A simulation analysis was carried out through the software PSCAD/EMTDC to validate the analytical description of the submodule-capacitor voltage ripple presented in Section 2. Thus, the following parameters were considered, which are exactly the same used in Section 2. For the MMC case, V D C = 20 kV, N = 10 and C = 5 mF (submodule-capacitor capacitance) were considered. For the MMSC case, V g = 20 kV, f i = 50 Hz, N = 10 and C = 5 mF were considered. Moreover, both converters were controlled to synthesize an AC voltage with amplitude equal to V o = 10 kV while supplying power to a R L load ( R = 100 Ω and L = 10 mH). In order to observe the submodule-capacitor voltage-ripple ( Δ V ) behavior of the MMC and the MMSC for different load-frequency values, simulations were carried out for each converter varying the load-voltage frequency ( f o ) by 1 Hz until the whole frequency range was covered. The results obtained are shown in Figure 4. By analyzing Figure 4, one can observe that the MMSC presents a low submodule-capacitor voltage ripple at low frequencies and a high submodule-capacitor voltage ripple at high frequencies whereas the MMC presents a high submodule-capacitor voltage ripple at low frequencies and a low submodule-capacitor voltage ripple at high frequencies. In fact, the MMSC presents higher submodule-capacitor voltage ripple as closer to the grid frequency ( f i = 50 Hz) the load frequency ( f o ) gets. So, let us suppose, for example, that a given electrical machine has a nominal frequency equal to 45 Hz and, thus, it operates within the frequency range from f o = 1 Hz to f o = 45 Hz. Moreover, let us consider that this machine driven by either the MMC or the MMSC is connected to a grid with frequency equal to f i = 50 Hz. In this specific application, it is clear that the highest voltage-ripple value for the MMC case would occur for f o = 1 Hz while the highest voltage-ripple value for the MMSC case would occur for f o = 45 Hz. Moreover, if the 0-Hz operation point needed to be crossed (as in a pumped-hydro-storage system for example), then the MMC would experience critical problems since intolerably high submodule-capacitor voltage ripple would occur. This would not be the case with the MMSC. The hypothetical machine-drive application previously described, that operates within a frequency range from f o = 1 Hz to f o = 45 Hz, is considered as an example for the analysis carried out in this section.

3.1. MMC

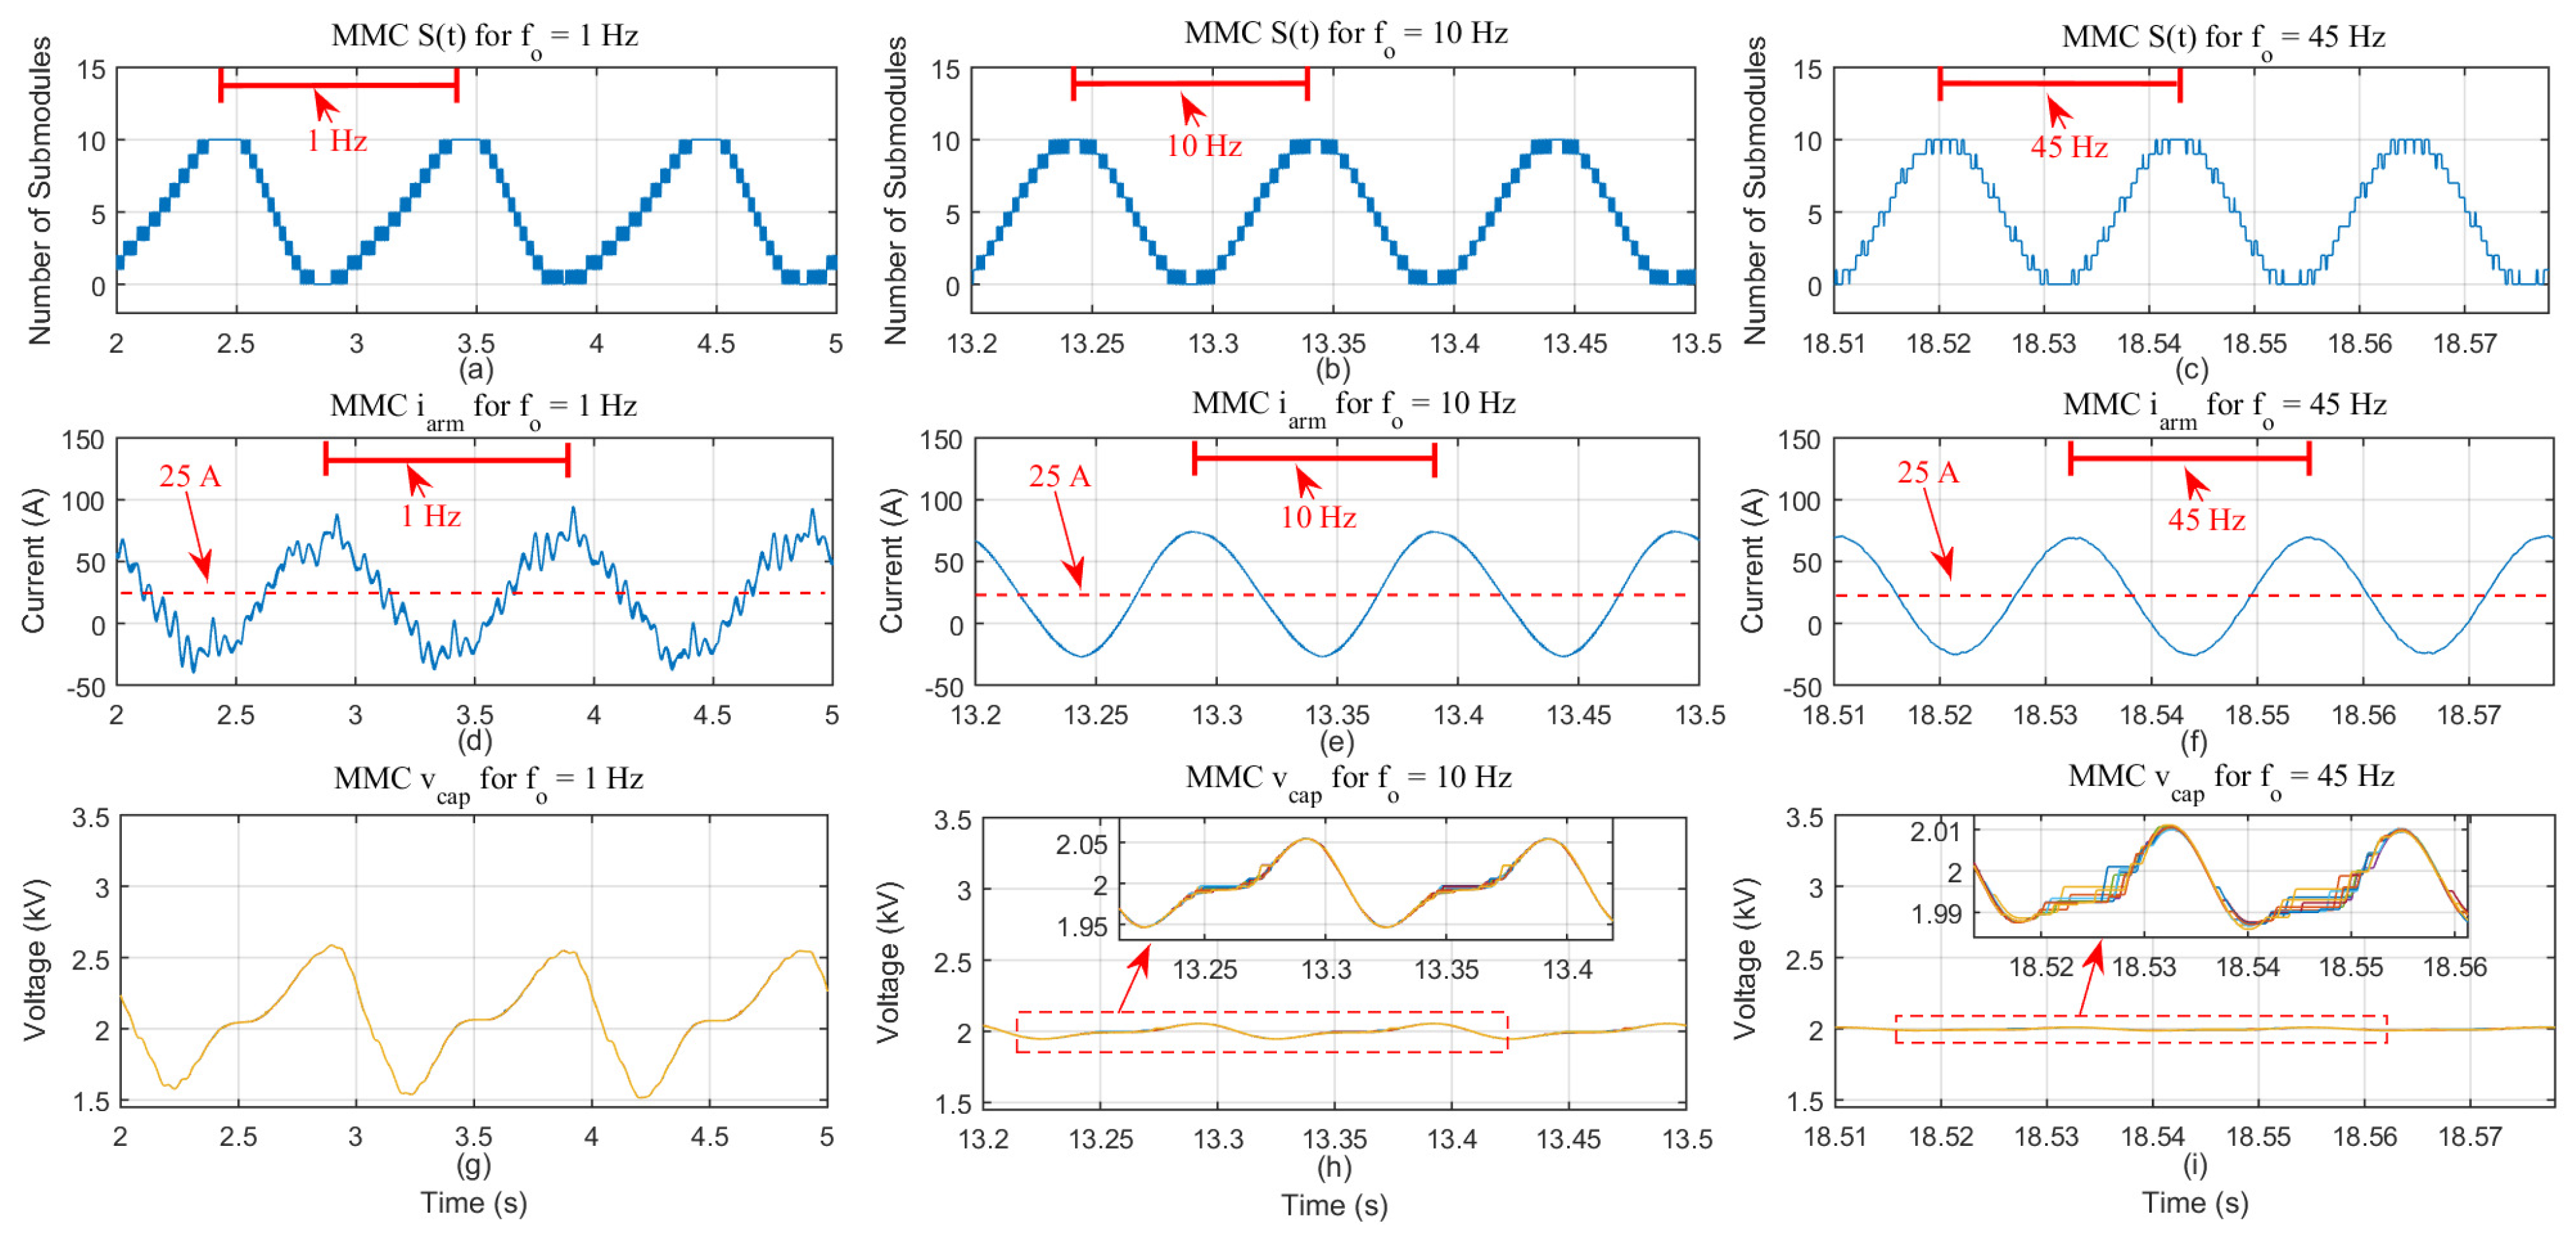
In Section 2, the authors made an approximation to the MMC insertion-index signal, by considering it as a continuous signal varying from 0 to 1 (normalized by N), with frequency f o . In Figure 5a–c, one can see the MMC real insertion-index signals, obtained in simulation, which are discrete signals that vary from 0 to N with frequency f o , for the cases in which f o = 1 , 10 , 45 Hz, respectively. By substituting V o = 10 kV, R = 100 Ω and L = 10 mH (which are the parameters considered for both the analytical model of Section 2 and the simulation analysis of this section) into Equation (4), the following AC current is obtained:
i A C ( t ) = 100 sin ( ω o t + θ ) A
This AC current is the one obtained for any value of f o since R > > L , which means that the inductive reactance can basically be neglected in the impedance calculation. The rms value of (18) is equal to I A C = 70.72 A. By substituting I A C = 70.72 A, V D C = 20 kV and V o = 10 kV into Equation (6), the following is obtained:
i D C ( t ) = 75 A
Finally, by substituting (18) and (19) into (2) the following is obtained:
i a r m ( t ) = [ 50 sin ( ω o t + θ ) + 25 ] A
In Figure 5d–f, the MMC arm current ( i a r m ) obtained in the simulation is shown for the cases in which f o = 1 , 10 , 45 Hz, respectively, and it is clear that, in fact, this current is represented by Equation (20), which means that the equation used in Section 2 to describe the MMC arm current ( i a r m ) is matching the simulation results with high accuracy and, thus, the analytical model is properly describing the real behavior of the MMC quantities. In Figure 5g–i, one can observe the submodule-capacitor voltage ( v c a p ), obtained in simulation, for the cases in which f o = 1 , 10 , 45 Hz, respectively. The submodule-capacitor voltages shown in Figure 5g–i are consequence of the current i a r m , shown in Figure 5d–f, flowing through the MMC arms while operating with the insertion-index pattern shown in Figure 5a–c. As previously proved, since the insertion-index signals and arm currents shown in Figure 5 correspond exactly to the insertion-index signals and arm currents obtained through the analytical model of Section 2, then it is expected that the same voltage-ripple behavior obtained in the simulation can be reproduced through the analytical model. For the 1-Hz case, the capacitor voltage ripple (see Figure 5g) presents a peak-to-peak value equal to approximately 1 kV. For the 10-Hz case, the capacitor voltage ripple (see Figure 5h) presents a peak-to-peak value equal to approximately 0.1 kV. Finally, for the 45-Hz case, the capacitor voltage ripple (see Figure 5i) presents a peak-to-peak value equal to approximately 0.02 kV. These submodule-capacitor-voltage-ripple values are summarized in Table 1.
According to Figure 3, the MMC submodule-capacitor current is composed of a f o -Hz and of a 2 f o -Hz components. These current components will cause a voltage ripple to the submodule capacitors according to the capacitor reactance (see Equation (17)). Thus, for the f o = 1 -Hz case, the MMC submodule capacitor will have a voltage ripple with f o = 1 Hz and 2 f o = 2 Hz components. By applying a FFT to the signal shown in Figure 5g, which illustrates the MMC submodule-capacitor voltage for the 1-Hz case, it is possible to obtain the amplitude of the voltage-ripple components. The peak value of the 1-Hz component is equal to 392 V and the peak value of the 2-Hz component is equal to 184.5 V. With Equation (17), it is possible to obtain the amplitude of the corresponding current responsible for generating this voltage ripple. The peak value of the 1-Hz current component is equal to 12.32 A and the peak value of the 2-Hz current component is equal to 11.6 A. It is very interesting to notice that these two current values are very similar to the values shown in Figure 3a, which were obtained with the analytical description of the voltage ripple. In other words, these results prove that the analytical description of the submodule-capacitor voltage ripple, proposed in this paper, is quite accurate in describing the actual behavior of the MMC. In Table 2, the amplitudes of the two main components of the submodule-capacitor-voltage ripple, obtained by applying a FFT to the submodule-capacitor voltages shown in Figure 5g–i, are shown along with their corresponding current-component amplitudes, for the cases in which f o = 1 , 10 and 45 Hz. It is clear that the amplitude of the current components, shown in Table 2, match with high accuracy with the amplitude of the current components shown in Figure 3a,c,e.

3.2. MMSC

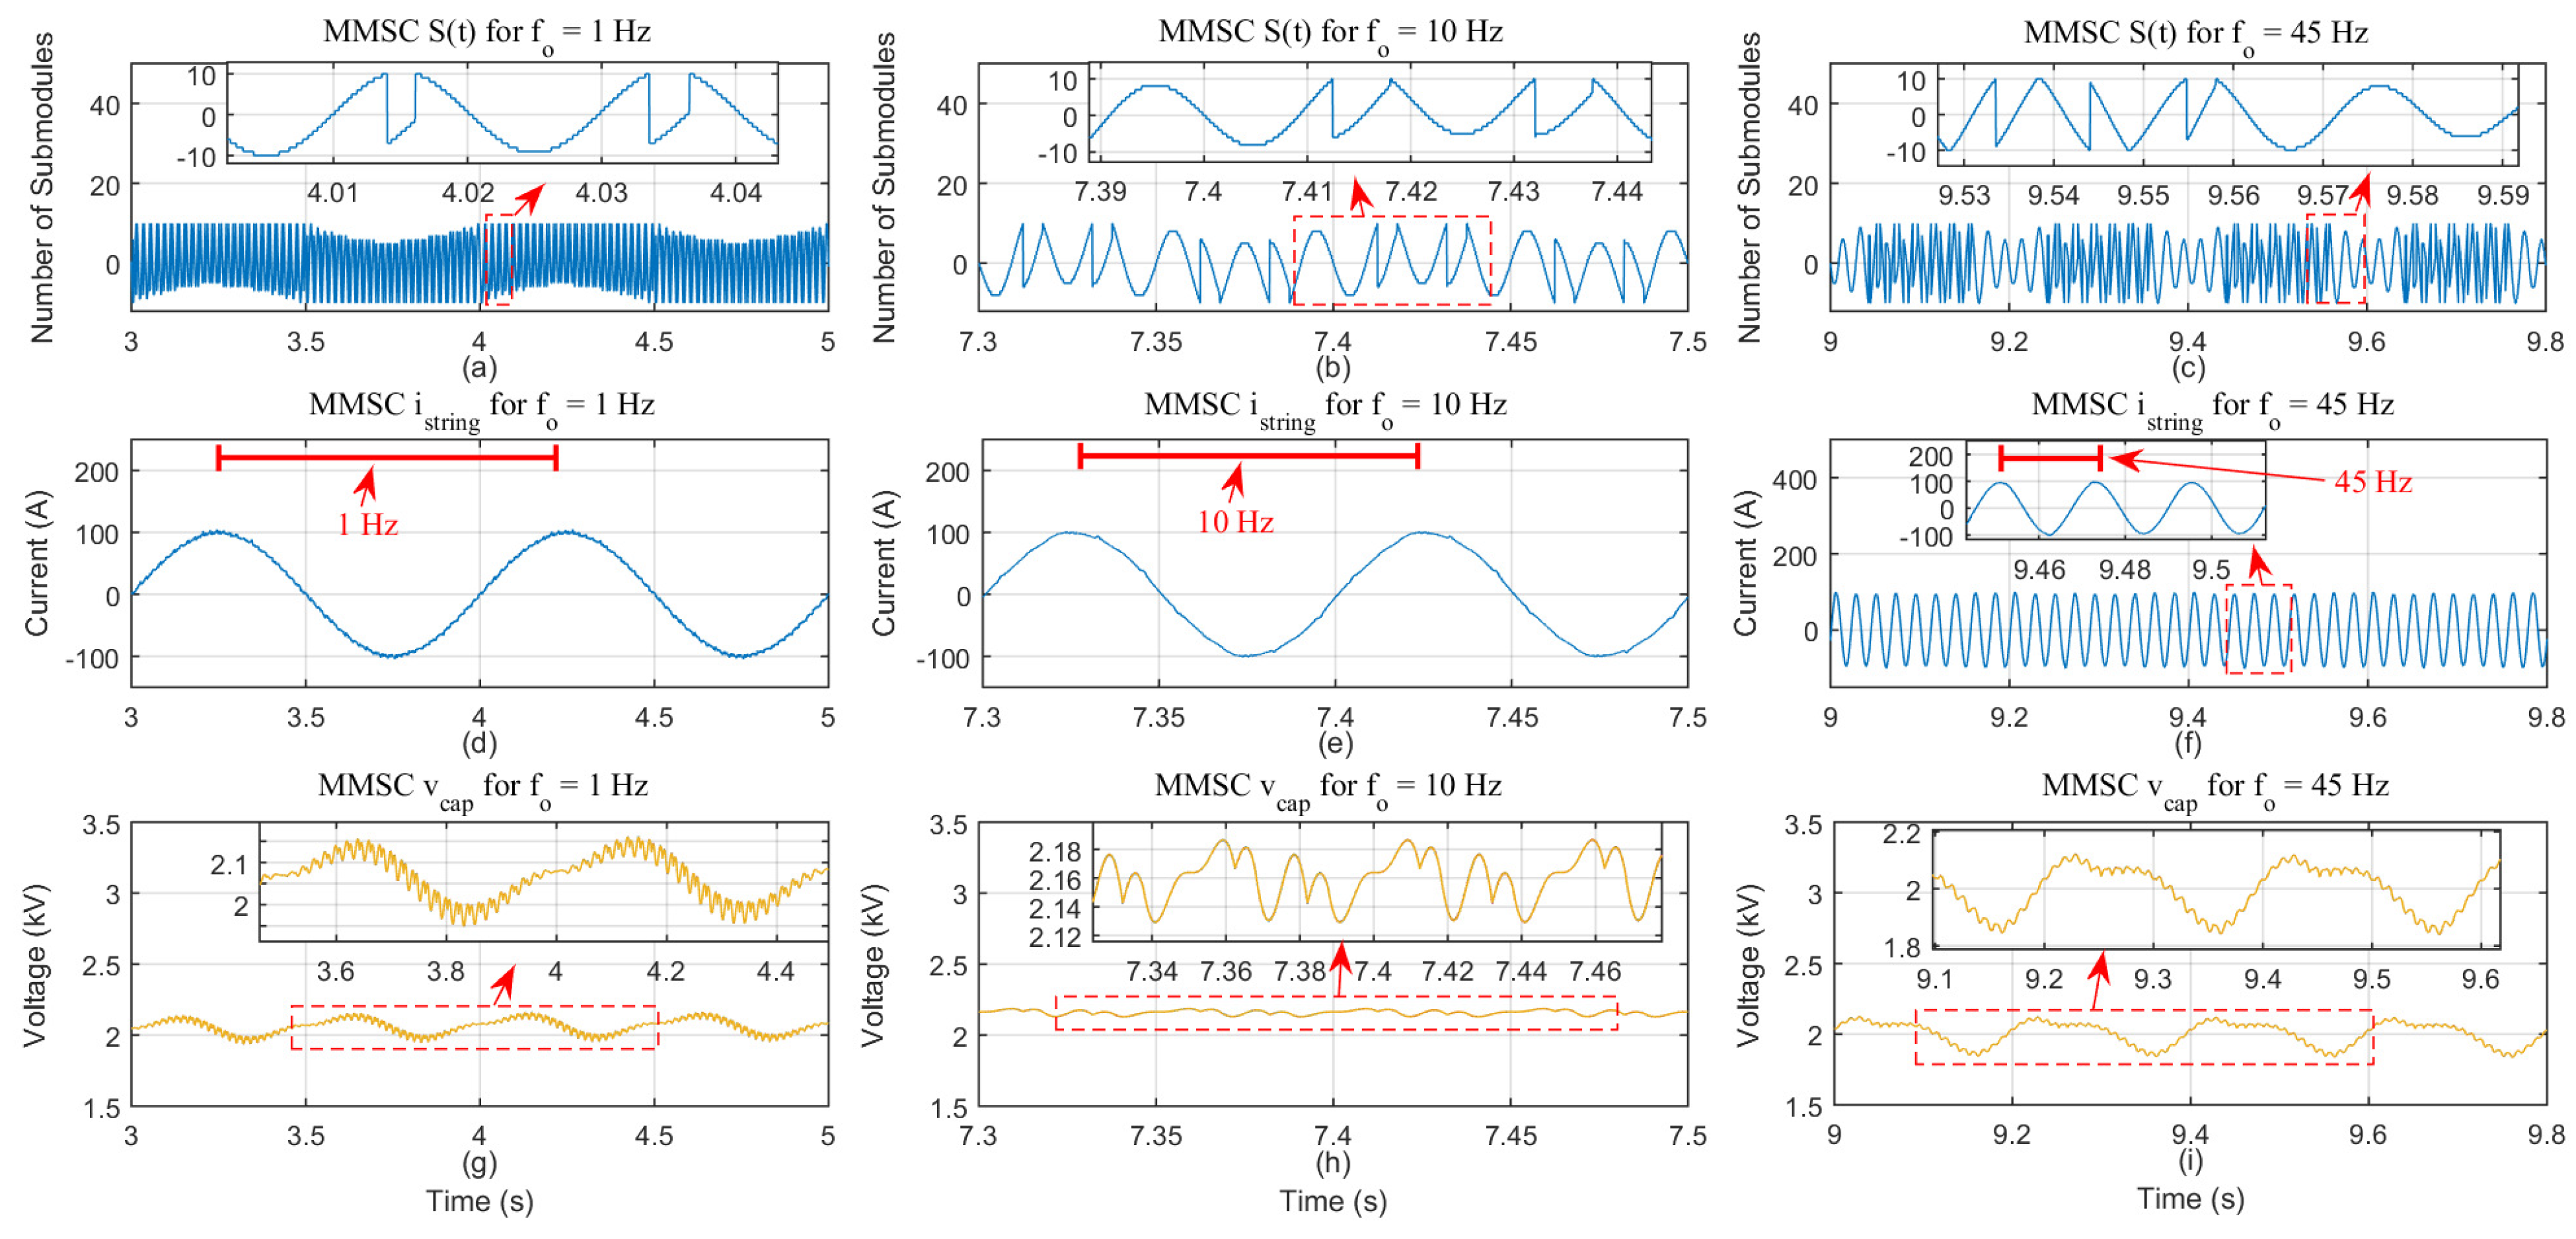
In Section 2, the MMSC insertion-index pattern ( S ( t ) ) was defined as a signal represented by (12) if S ( t ) is within the limits 1 and 1 and represented by (13) if S ( t ) exceeds the limits 1 and 1. These signals were normalized by the number of submodules (N). In Figure 6a–c, one can see the real insertion-index signals, obtained in simulation, which are discrete signals that vary from N to N but with the exact same shape as the approximated insertion-index signals shown in Figure 2g,i,k. The MMSC AC current should be identical to the MMC one, which is described by:
i A C ( t ) = 100 sin ( ω o t + θ ) A
Thus, according to Equation (14), the MMSC string current will be equal to:
i s t r i n g ( t ) = i A C ( t ) = 100 sin ( ω o t + θ ) A
In Figure 6d–f, the MMSC string current ( i s t r i n g ) is shown for the cases in which f o = 1 , 10 , 45 Hz, respectively, and it is clear that, in fact, this current is represented by Equation (22). In Figure 6g–i, one can observe the submodule-capacitor voltages, for the cases in which f o = 1 , 10 , 45 Hz, respectively, obtained as a consequence of the current i s t r i n g , shown in Figure 6d–f, flowing through the MMSC strings, while operating with the insertion-index pattern shown in Figure 6a–c. In other words, the insertion-index signals and string currents shown in Figure 6 correspond to the insertion-index signals and string currents described in the analysis carried out in Section 2 and, thus, it is expected that the same voltage-ripple behavior is obtained. For the 1-Hz case, the capacitor voltage ripple (see Figure 6g) presents a peak-to-peak value equal to approximately 0.2 kV. For the 10-Hz case, the capacitor voltage ripple (see Figure 6h) presents a peak-to-peak value equal to approximately 0.06 kV. Finally, for the 45-Hz case, the capacitor voltage ripple (see Figure 6i) presents a peak-to-peak value equal to approximately 0.28 kV. The submodule-capacitor-voltage-ripple values are summarized in Table 3. It is clear that the ratio between the highest ripple, in the worst-case scenario, for the MMC and the MMSC is equal to r a t i o = 1 kV 0.28 kV = 3.57 . The worst-case scenario, in the MMC case, occurs for f o = 1 Hz and in the MMSC case for f o = 45 Hz.
According to Figure 3b, the two most influential harmonic components present in the MMSC capacitor-current spectrum, for the f o = 1 -Hz case, are the 2-Hz component and the 4-Hz component. By applying a FFT to the signal shown in Figure 6g, which is the submodule-capacitor voltage for the f o = 1 -Hz case, it is possible to obtain the amplitudes of the 2-Hz and the 4-Hz components. The peak value of the 2-Hz voltage component is equal to 69.7 V and the peak value of the 4-Hz voltage component is equal to 18.4 V. Through Equation (17), it is possible to calculate the amplitudes of the capacitor-current components responsible for producing this voltage ripple. The peak value obtained for the 2-Hz current component is equal to 4.38 A and the peak value obtained for the 4-Hz current component is equal to 2.31 A. It is very interesting to compare these results with the ones shown in Figure 3b and notice that they are quite similar. In other words, the submodule-capacitor currents obtained in simulation are quite similar to the ones obtained through the analytical description proposed in Section 2. In Table 4, one can observe the amplitudes of the submodule-capacitor voltage ripple and their corresponding capacitor currents for the cases in which f o = 1 , 10 and 45 Hz. The amplitude of the capacitor-current components are very similar to the ones described in Figure 3b,d,f, proving the accuracy of the analytical description presented in Section 2.
The submodule-capacitor-voltage-ripple components ( V c a p n ) of both topologies are calculated as follows:
V c a p n = I c a p n X c
By substituting (17) into (23) and after some algebraic manipulations the following is obtained:
C = I c a p n 2 π f V c a p n
The highest voltage-ripple component, in the MMC case ( V M a x M M C = 392 V), occurs for the f o = 1 -Hz operation and it is caused by the 1-Hz current component. The highest voltage-ripple component, in the MMSC case ( V M a x M M S C = 105.5 V), occurs for the f o = 45 -Hz operation and it is caused by the f M a x M M S C = 5 -Hz current component with amplitude equal to I M a x M M S C = 16.57 A. By substituting I c a p n , V c a p n and f, in (24), by I M a x M M S C , V M a x M M C and f M a x M M S C , respectively, the following is obtained:
C = 1.35 mF
This means that if the capacitance of the MMSC submodule capacitors were equal to 1.35 mF, instead of being equal to 5 mF, the highest voltage ripple of the MMSC, in the worst-case scenario, would be equal to the highest voltage ripple of the MMC in the worst case scenario ( V M a x M M S C = V M a x M M C = 392 V). In other words, if the MMSC submodule-capacitor capacitance were equal to 1.35 mF, then the f M a x M M S C = 5 -Hz current component, that would flow through the capacitor in the f o = 45 -Hz operation, would lead to a 5-Hz voltage ripple with amplitude equal to 392 V. This is a very important information that leads to the conclusion that if the converter operates within a range of low-frequency values (from 1 Hz to 45 Hz in this case), the capacitance of the submodule capacitors of the MMSC could be reduced in approximately 73% (reduced from 5 mF to 1.35 mF), in relation to the MMC, and still obtain the same voltage-ripple amplitude in the worst-case scenario. Thus, besides the MMSC presenting a 75% reduction in the number of capacitors in comparison to the MMC, as explained in [22], the capacitance of the MMSC capacitors is reduced in 73% in relation to the MMC. This way, the MMSC should be a solution with reduced costs and with extremely reduced size and weight in comparison to the MMC.

4. Experimental Results

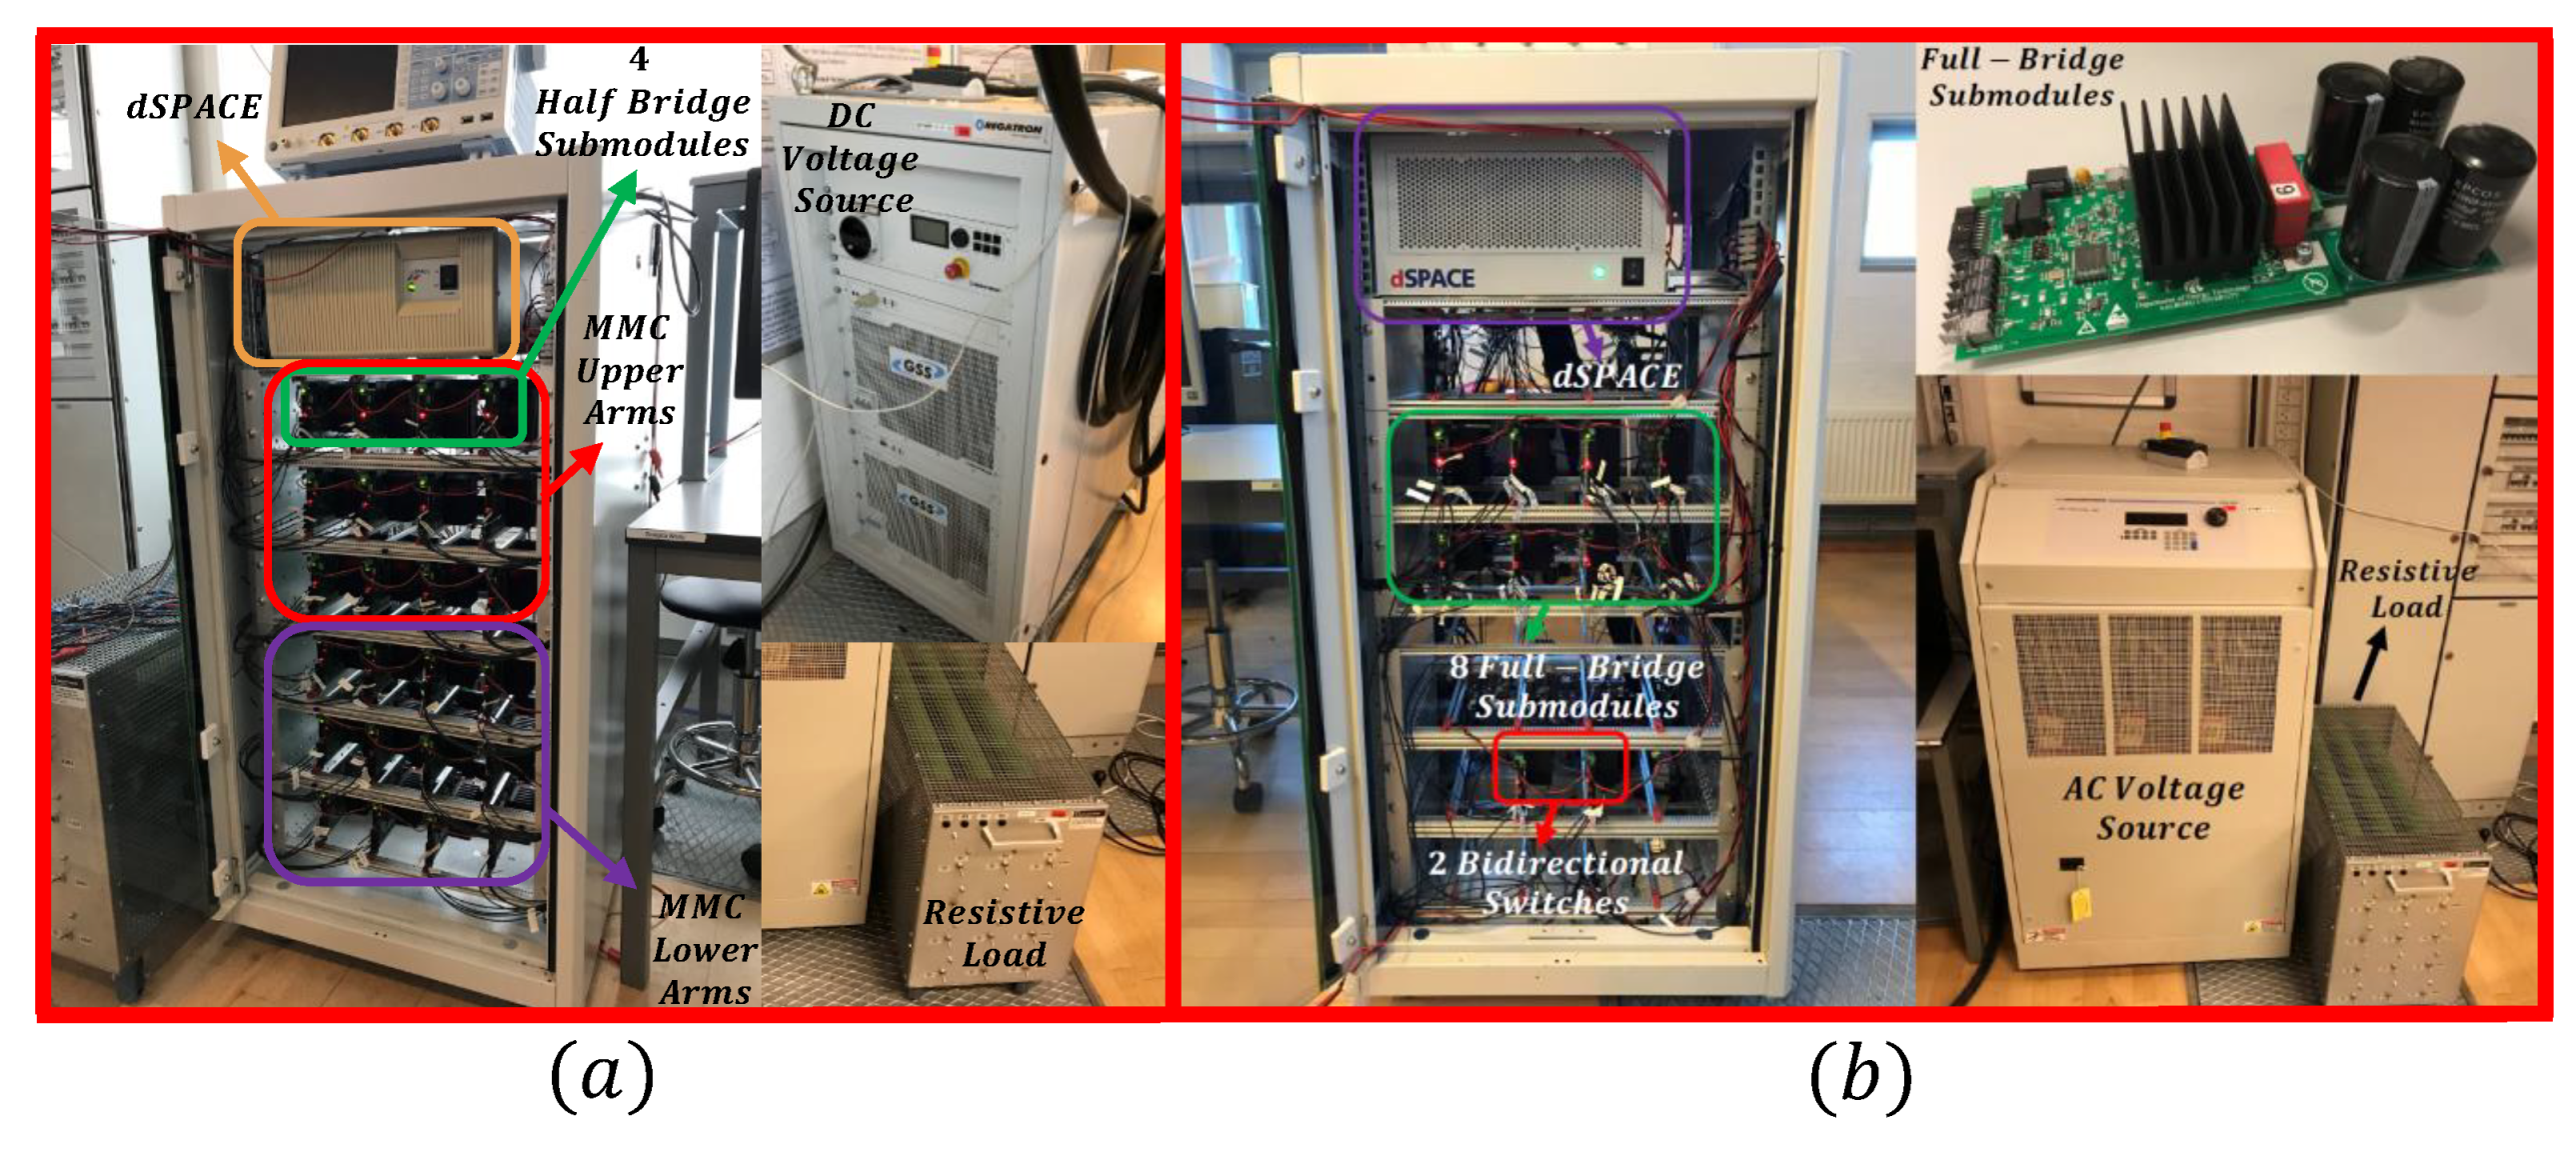
In this section, experimental results are presented to compare the submodule-capacitor voltage ripple in the MMC and in the MMSC. In order to do so, experimental tests were carried out in two different test setups: One representing the MMC and the other representing the MMSC as illustrated in Figure 7a,b, respectively.
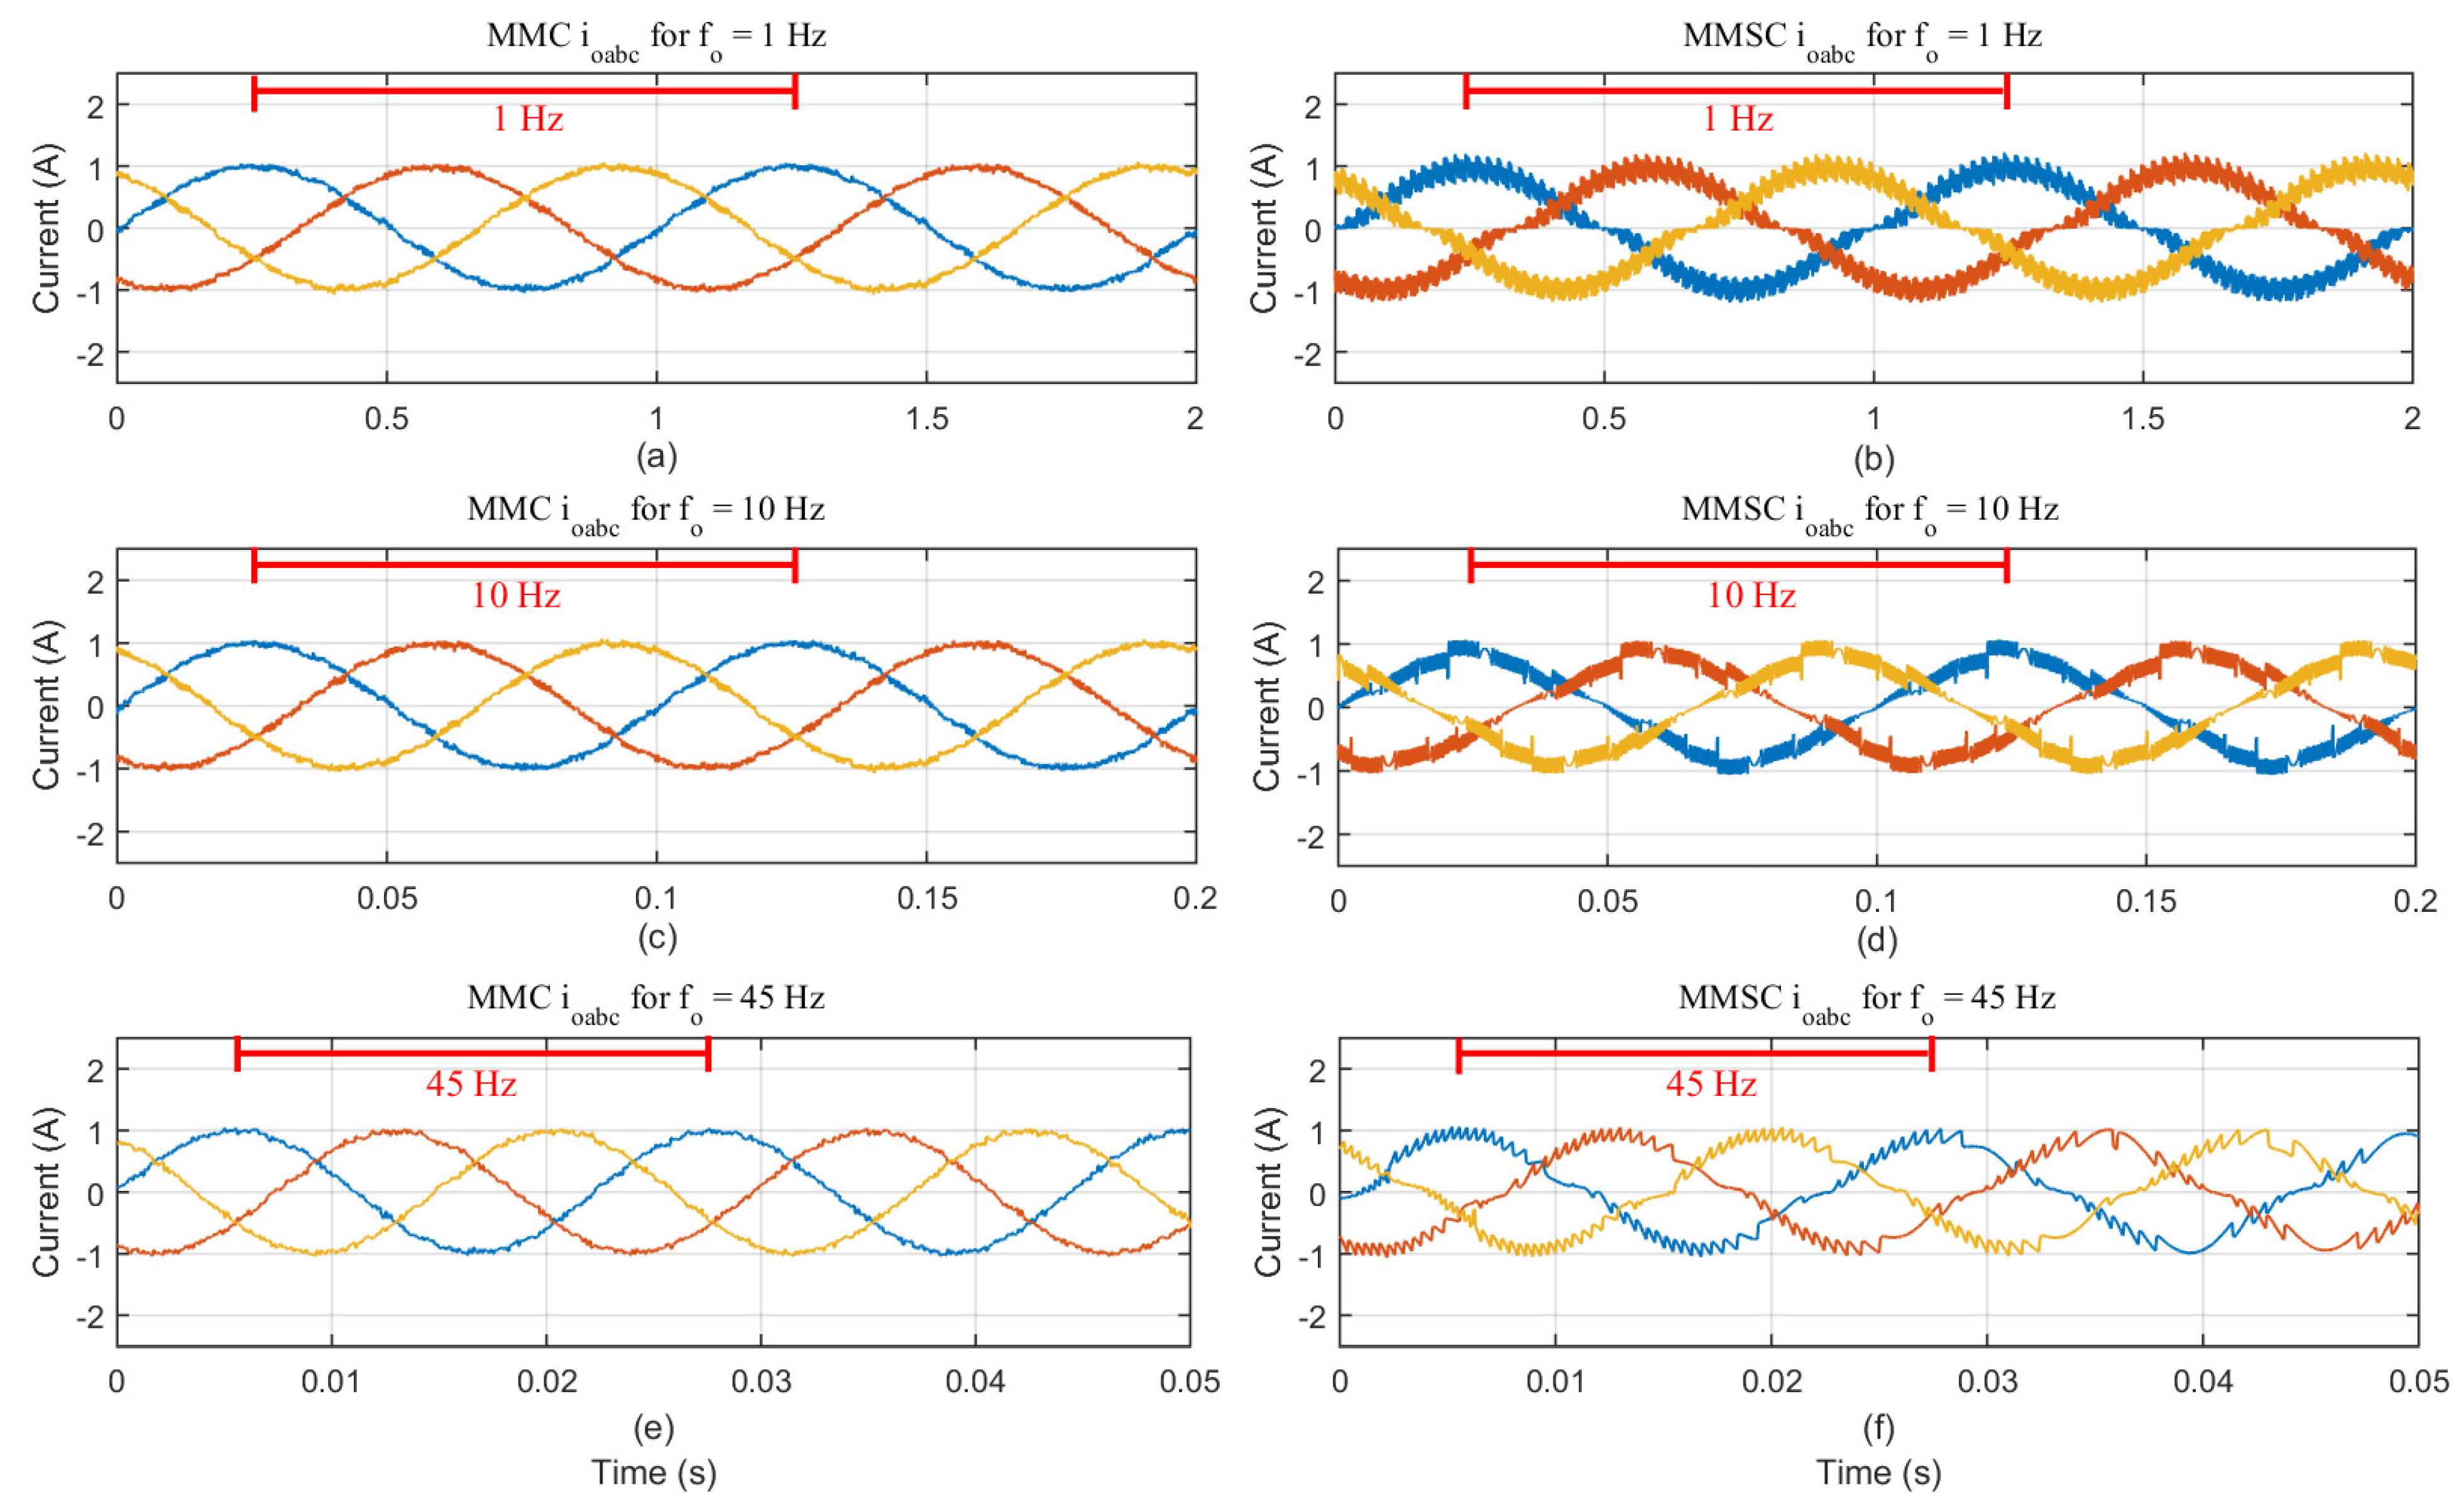
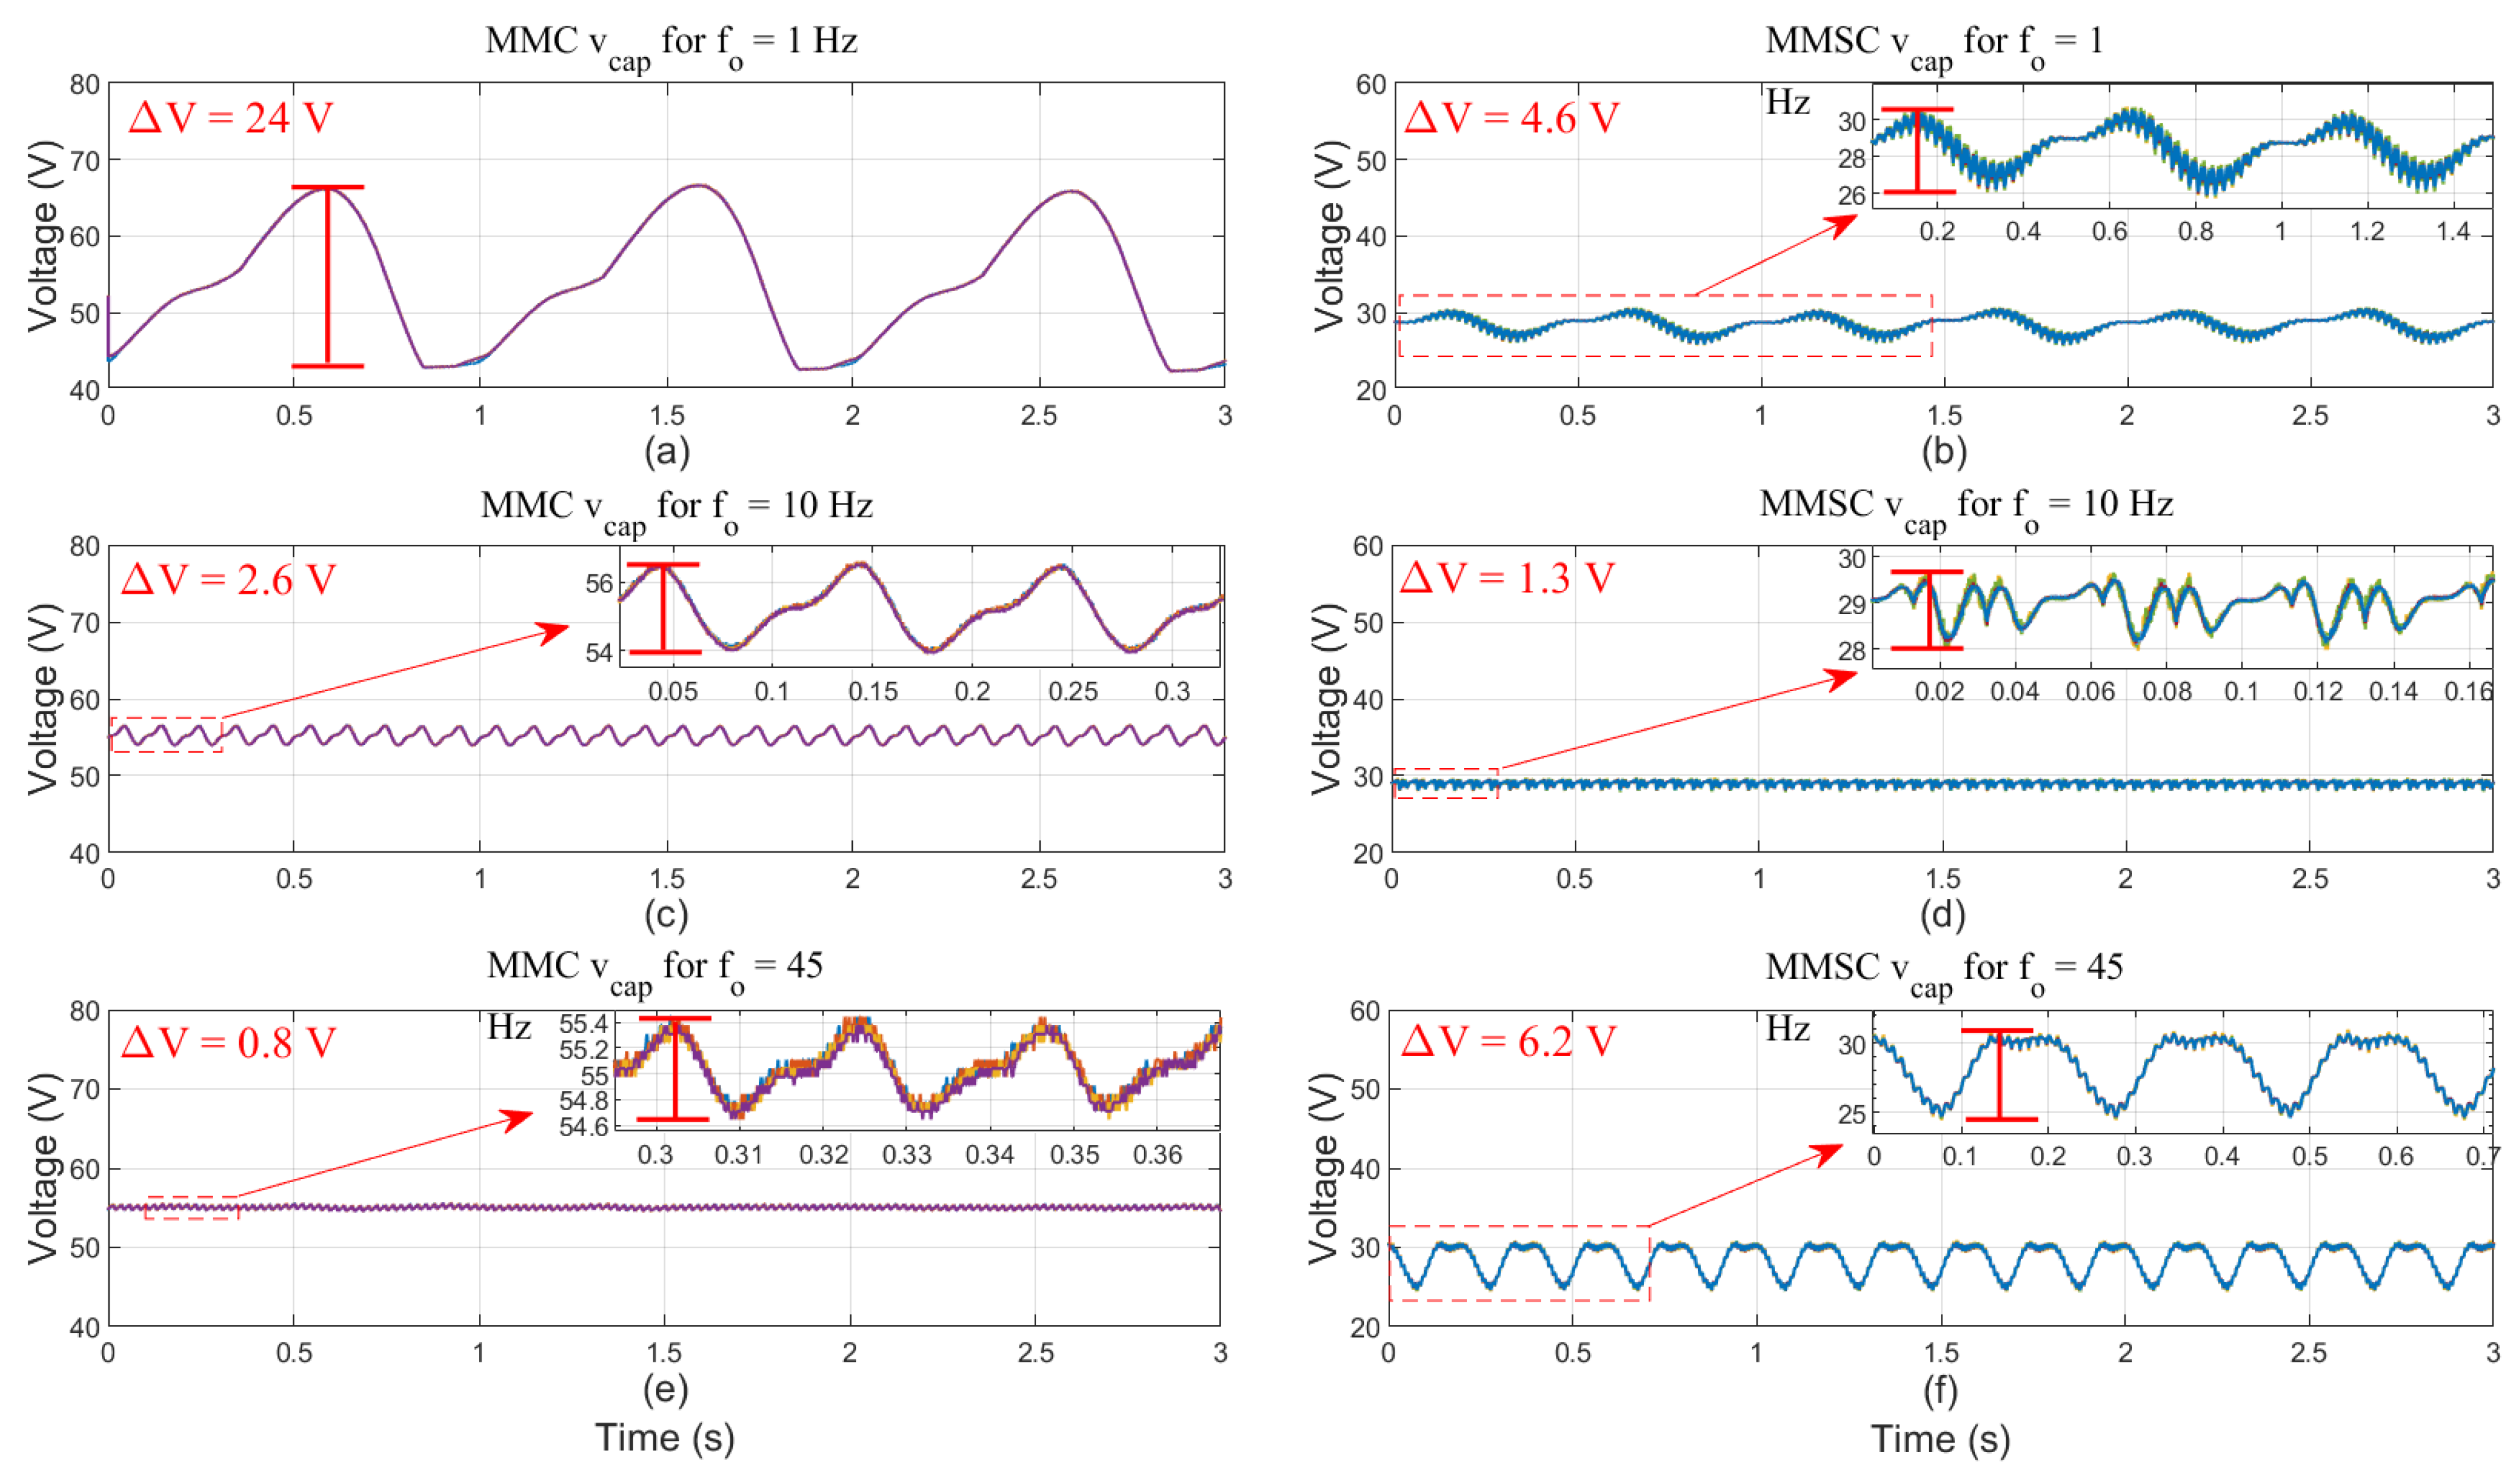
The MMC test setup is composed of a DC-voltage source ( V D C = 220 V), representing the converter DC link, of six arms of HB subomodules (with N = 4 submodules per arm) and of six arm inductors ( L = 5 mH). Each HB submodule is composed of two IGBTs and of one capacitor with capacitance equal to C = 2 mF. This converter supplies power to a resistive load with value equal to R = 100 Ω . In Figure 7b, the MMSC test setup is shown. Since the MMSC is a three-phase converter composed of three completely independent single-phase converters, the authors built a single-phase structure. Thus, the MMSC prototype is composed of a string of FB submodules (with N = 8 submodules connected in series), of two bidirectional switches (connecting the submodule string to two different phases of the grid) and this structure is connected to an AC controlled voltage source that emulates the grid. The peak, phase-to-ground value of the grid voltage is equal to V g = 220 V and its frequency is equal to f i = 50 Hz. Each FB submodule is composed of four IGBTs and one capacitor with capacitance equal to C = 2 mF, which is exactly the same capacitance as in the MMC case. This converter supplies power to a resistive load with value equal to R = 100 Ω , which once again is exactly the same as in the MMC case. In order to obtain a three-phase result, three different tests are carried out representing each of the three phases (A, B and C). In both MMC and MMSC experimental tests, the peak, phase-to-ground value of the load-voltage reference is equal to V o = 100 V, which results in a load current with peak value equal to 1 A. In Figure 8a,c,e, one can observe the MMC load currents ( i o a b c ) for the cases in which, f o = 1 , 10 and 45 Hz, respectively. In Figure 8b,d,f, one can observe the MMSC load currents for the cases in which, f o = 1 , 10 and 45 Hz, respectively. It is clear that in both cases the load current presents same amplitude and same frequency as expected. The power quality of the MMC currents are higher because of the MMC arm inductors that operate as filters, filtering out the high-order harmonics present in the current waveform. It is possible to say that the MMSC currents are high-power-quality signals considering that there are no inductors, nor a load filter was used. It is important to emphasize that the harmonic components present in the MMSC current waveforms are high-order ones, which could be easily filtered out if a load-voltage filter was used. In Figure 9a,c,e, one can observe the MMC submodule-capacitor voltages for the cases in which, f o = 1 , 10 and 45 Hz, respectively. In Figure 9b,d,f, one can observe the MMSC submodule-capacitor voltages for the cases in which, f o = 1 , 10 and 45 Hz, respectively. The peak-to-peak values of the submodule-capacitor-voltage ripple, of the MMC and the MMSC, are summarized in Table 5.
Considering that the MMC and the MMSC operate within the frequency range from f o = 1 Hz to f o = 45 Hz, then the ratio between the worst voltage ripple for the MMC and the MMSC is equal to r a t i o = 24 V 6.2 V = 3.87 , which is very similar to the result obtained in the simulation results shown in Section 3, which was equal to 3.57 . In other words, the experimental results validate the conclusion obtained in the previous sections that the MMSC capacitors could be designed to be approximately 73% smaller than the MMC ones, since ( 1 1 3.87 ) 100 = 74.16 73 %.

5. Conclusions

In this paper, the authors presented a detailed comparison analysis of the MMC and MMSC performances under variable-frequency operation, regarding the submodule-capacitor voltage ripple. In order to carry out this comparison, an analytical description of the submodule-capacitor voltage ripple was proposed for each converter. This analytical description is validated with simulation results. One of the conclusions obtained is that, in fact, the MMSC presents superior performance, in comparison to the MMC, when operating within a range of low-frequency values. Thus, the MMSC should be a promising converter solution for modern medium-voltage high-power machine-drive applications such as pumped-hydro-storage systems, upscaled wind turbines and industrial motor drives. Moreover, in this paper the authors demonstrated, through both simulation and experimental results, that if a given machine-drive application were to operate within the frequency range of 1 Hz and 45 Hz, the MMSC solution, if used to drive such machine, could be designed with submodule capacitors with capacitance 73% smaller than the MMC solution, if used to drive the same machine. Thus, besides being a solution with many operational and structural advantages in relation to the MMC, such as considerably reduced number of submodule capacitors as demonstrated in [22], the MMSC also needs considerably smaller capacitors in comparison to the MMC. This fact further contributes to the cost, size and weight reduction of the general converter solution and, thus, it should be an extremely interesting option for high-power machine-drive applications that require compactness and lightness such as offshore wind turbines. The analysis presented in this paper could be easily extended to other frequency ranges, by using the proposed analytical model, which can be useful to design the converter capacitors for a given application.

Author Contributions

G.G. established the major part of this paper which includes conceptualization, formal analysis, investigation, methodology, software, validation, visualization and was responsible for writing the original draft preparation. S.W. contributed with validation and text review. T.K. provided resources, supervision and text review. R.T. provided resources, supervision and text review. All authors have read and agreed to the published version of the manuscript.

Funding

Part of this work has been supported by Innovation Fund Denmark, though InnoExplorer research project FESST—the flexible and scalable power converter for smart buildings.

Conflicts of Interest

The authors declare no conflict of interest.

References

  1. Diaz, M.; Cárdenas, R.; Espinoza, M.; Mora, A.; Wheeler, P. Modelling and control of the modular multilevel matrix converter and its application to wind energy conversion systems. In Proceedings of the IECON 2016—42nd Annual Conference of the IEEE Industrial Electronics Society, Florence, Italy, 23–26 October 2016. [Google Scholar] [CrossRef]
  2. Diaz, M.; Cardenas, R.; Espinoza, M.; Rojas, F.; Mora, A.; Clare, J.C.; Wheeler, P. Control of Wind Energy Conversion Systems Based on the Modular Multilevel Matrix Converter. IEEE Trans. Ind. Electron. 2017, 64. [Google Scholar] [CrossRef]
  3. Fichaux, N.; Beurskens, J.; Jensen, P.H.; Wilkes, J.; Frandsen, S.; Sorensen, J.D.; Eecen, P.; Malamatenios, C.; Gomez, J.A.; Hemmelmann, J.; et al. UPWIND—Design Limits and Solutions for Very Large Wind Turbines; Technical Report; The European Wind Energy Association: Brussels, Belgium, 2011. [Google Scholar]
  4. Madariaga, A.; Martín, J.L.; Zamora, I.; Martínez De Alegría, I.; Ceballos, S. Technological trends in electric topologies for offshore wind power plants. Renew. Sustain. Energy Rev. 2013, 24, 32–44. [Google Scholar] [CrossRef]
  5. Iversen, T.M.; Gjerde, S.S.; Undeland, T. Multilevel converters for a 10 MW, 100 kV transformer-less offshore wind generator system. In Proceedings of the 2013 15th European Conference on Power Electronics and Applications, EPE 2013, Lille, France, 2–6 September 2013; pp. 1–10. [Google Scholar] [CrossRef] [Green Version]
  6. Basić, M.; Silva, P.C.O.; Dujić, D. High Power Electronics Innovation Perspectives for Pumped Storage Power Plants. In Proceedings of the Hydro, Gdansk, Poland, 15–17 October 2018; Available online: https://www.semanticscholar.org/paper/High-Power-Electronics-Innovation-Perspectives-for-Basi%C4%87-Silva/df0908790e65a6137de2a1827629b82736d12ebe (accessed on 18 January 2021).
  7. Vasiladiotis, M.; Baumann, R.; Häderli, C.; Steinke, J. IGCT-based Direct AC/AC Modular Multilevel Converters for Pumped Hydro Storage Plants. In Proceedings of the 2018 IEEE Energy Conversion Congress and Exposition (ECCE), Portland, OR, USA, 23–27 September 2018. [Google Scholar]
  8. Steimer, P.K.; Senturk, O.; Aubert, S.; Linder, S. Converter-fed synchronous machine for pumped hydro storage plants. In Proceedings of the 2014 IEEE Energy Conversion Congress and Exposition, ECCE 2014, Pittsburgh, PA, USA, 14–18 September 2014; pp. 4561–4567. [Google Scholar] [CrossRef]
  9. Korn, A.J.; Winkelnkemper, M.; Steimer, P. Low output frequency operation of the Modular Multi-Level Converter. In Proceedings of the 2010 IEEE Energy Conversion Congress and Exposition, ECCE 2010, Atlanta, GA, USA, 12–16 September 2010; pp. 3993–3997. [Google Scholar] [CrossRef]
  10. Hagiwara, M.; Hasegawa, I.; Akagi, H. Start-up and low-speed operation of an electric motor driven by a modular multilevel cascade inverter. IEEE Trans. Ind. Appl. 2013, 49, 1556–1565. [Google Scholar] [CrossRef]
  11. Antonopoulos, A.; Ängquist, L.; Norrga, S.; Ilves, K.; Harnefors, L.; Nee, H.P. Modular multilevel converter AC motor drives with constant torque from zero to nominal speed. IEEE Trans. Ind. Appl. 2014, 50, 1982–1993. [Google Scholar] [CrossRef]
  12. Okazaki, Y.; Hagiwara, M.; Akagi, H. A speed-sensorless start-up method of an induction motor driven by a modular multilevel cascade inverter (MMCI-DSCC). IEEE Trans. Ind. Appl. 2014, 50, 2671–2680. [Google Scholar] [CrossRef]
  13. Soares, M.; Watanabe, E.H. MMC Applied to Pumped Hydro Storage using a Differentiable Approximation of a Square Wave as Common-Mode Voltage during Low-Frequency Operation. In Proceedings of the 2020 IEEE 21st Workshop on Control and Modeling for Power Electronics, COMPEL 2020, Aalborg, Denmark, 9–12 November 2020. [Google Scholar] [CrossRef]
  14. Du, S.; Dekka, A.; Wu, B.; Zargari, N. Modular Multilevel Converters Analysis, Control and Applications; Wiley: Hoboken, NJ, USA, 2018. [Google Scholar]
  15. Hammond, P.W. A new approach to enhance power quality for medium voltage AC drives. IEEE Trans. Ind. Appl. 1997, 33, 202–208. [Google Scholar] [CrossRef]
  16. Kawamura, W.; Hagiwara, M.; Akagi, H. Control and experiment of a modular multilevel cascade converter based on triple-star bridge cells. IEEE Trans. Ind. Appl. 2014, 50, 3536–3548. [Google Scholar] [CrossRef]
  17. Fan, B.; Wang, K.; Wheeler, P.; Gu, C.; Li, Y. A Branch Current Reallocation Based Energy Balancing Strategy for the Modular Multilevel Matrix Converter Operating Around Equal Frequency. IEEE Trans. Power Electron. 2018, 33, 1105–1117. [Google Scholar] [CrossRef]
  18. Kawamura, W.; Chen, K.L.; Hagiwara, M.; Akagi, H. A Low-Speed, High-Torque Motor Drive Using a Modular Multilevel Cascade Converter Based on Triple-Star Bridge Cells (MMCC-TSBC). IEEE Trans. Ind. Appl. 2015, 51, 3965–3974. [Google Scholar] [CrossRef]
  19. Fan, B.; Wang, K.; Wheeler, P.; Gu, C.; Li, Y. An Optimal Full Frequency Control Strategy for the Modular Multilevel Matrix Converter Based on Predictive Control. IEEE Trans. Power Electron. 2018, 33, 6608–6621. [Google Scholar] [CrossRef]
  20. Diab, M.S.; Massoud, A.M.; Ahmed, S.; Williams, B.W. A Dual Modular Multilevel Converter With High-Frequency Magnetic Links Between Submodules for MV Open-End Stator Winding Machine Drives. IEEE Trans. Power Electron. 2018, 33, 5142–5159. [Google Scholar] [CrossRef] [Green Version]
  21. Thitichaiworakorn, N.; Hagiwara, M.; Akagi, H. A Medium-Voltage Large Wind Turbine Generation System Using an AC/AC Modular Multilevel Cascade Converter. IEEE J. Emerg. Sel. Top. Power Electron. 2016, 4, 534–546. [Google Scholar] [CrossRef]
  22. Gontijo, G.; Wang, S.; Kerekes, T.; Teodorescu, R. New AC–AC Modular Multilevel Converter Solution for Medium-Voltage Machine-Drive Applications: Modular Multilevel Series Converter. Energies 2020, 13, 3664. [Google Scholar] [CrossRef]
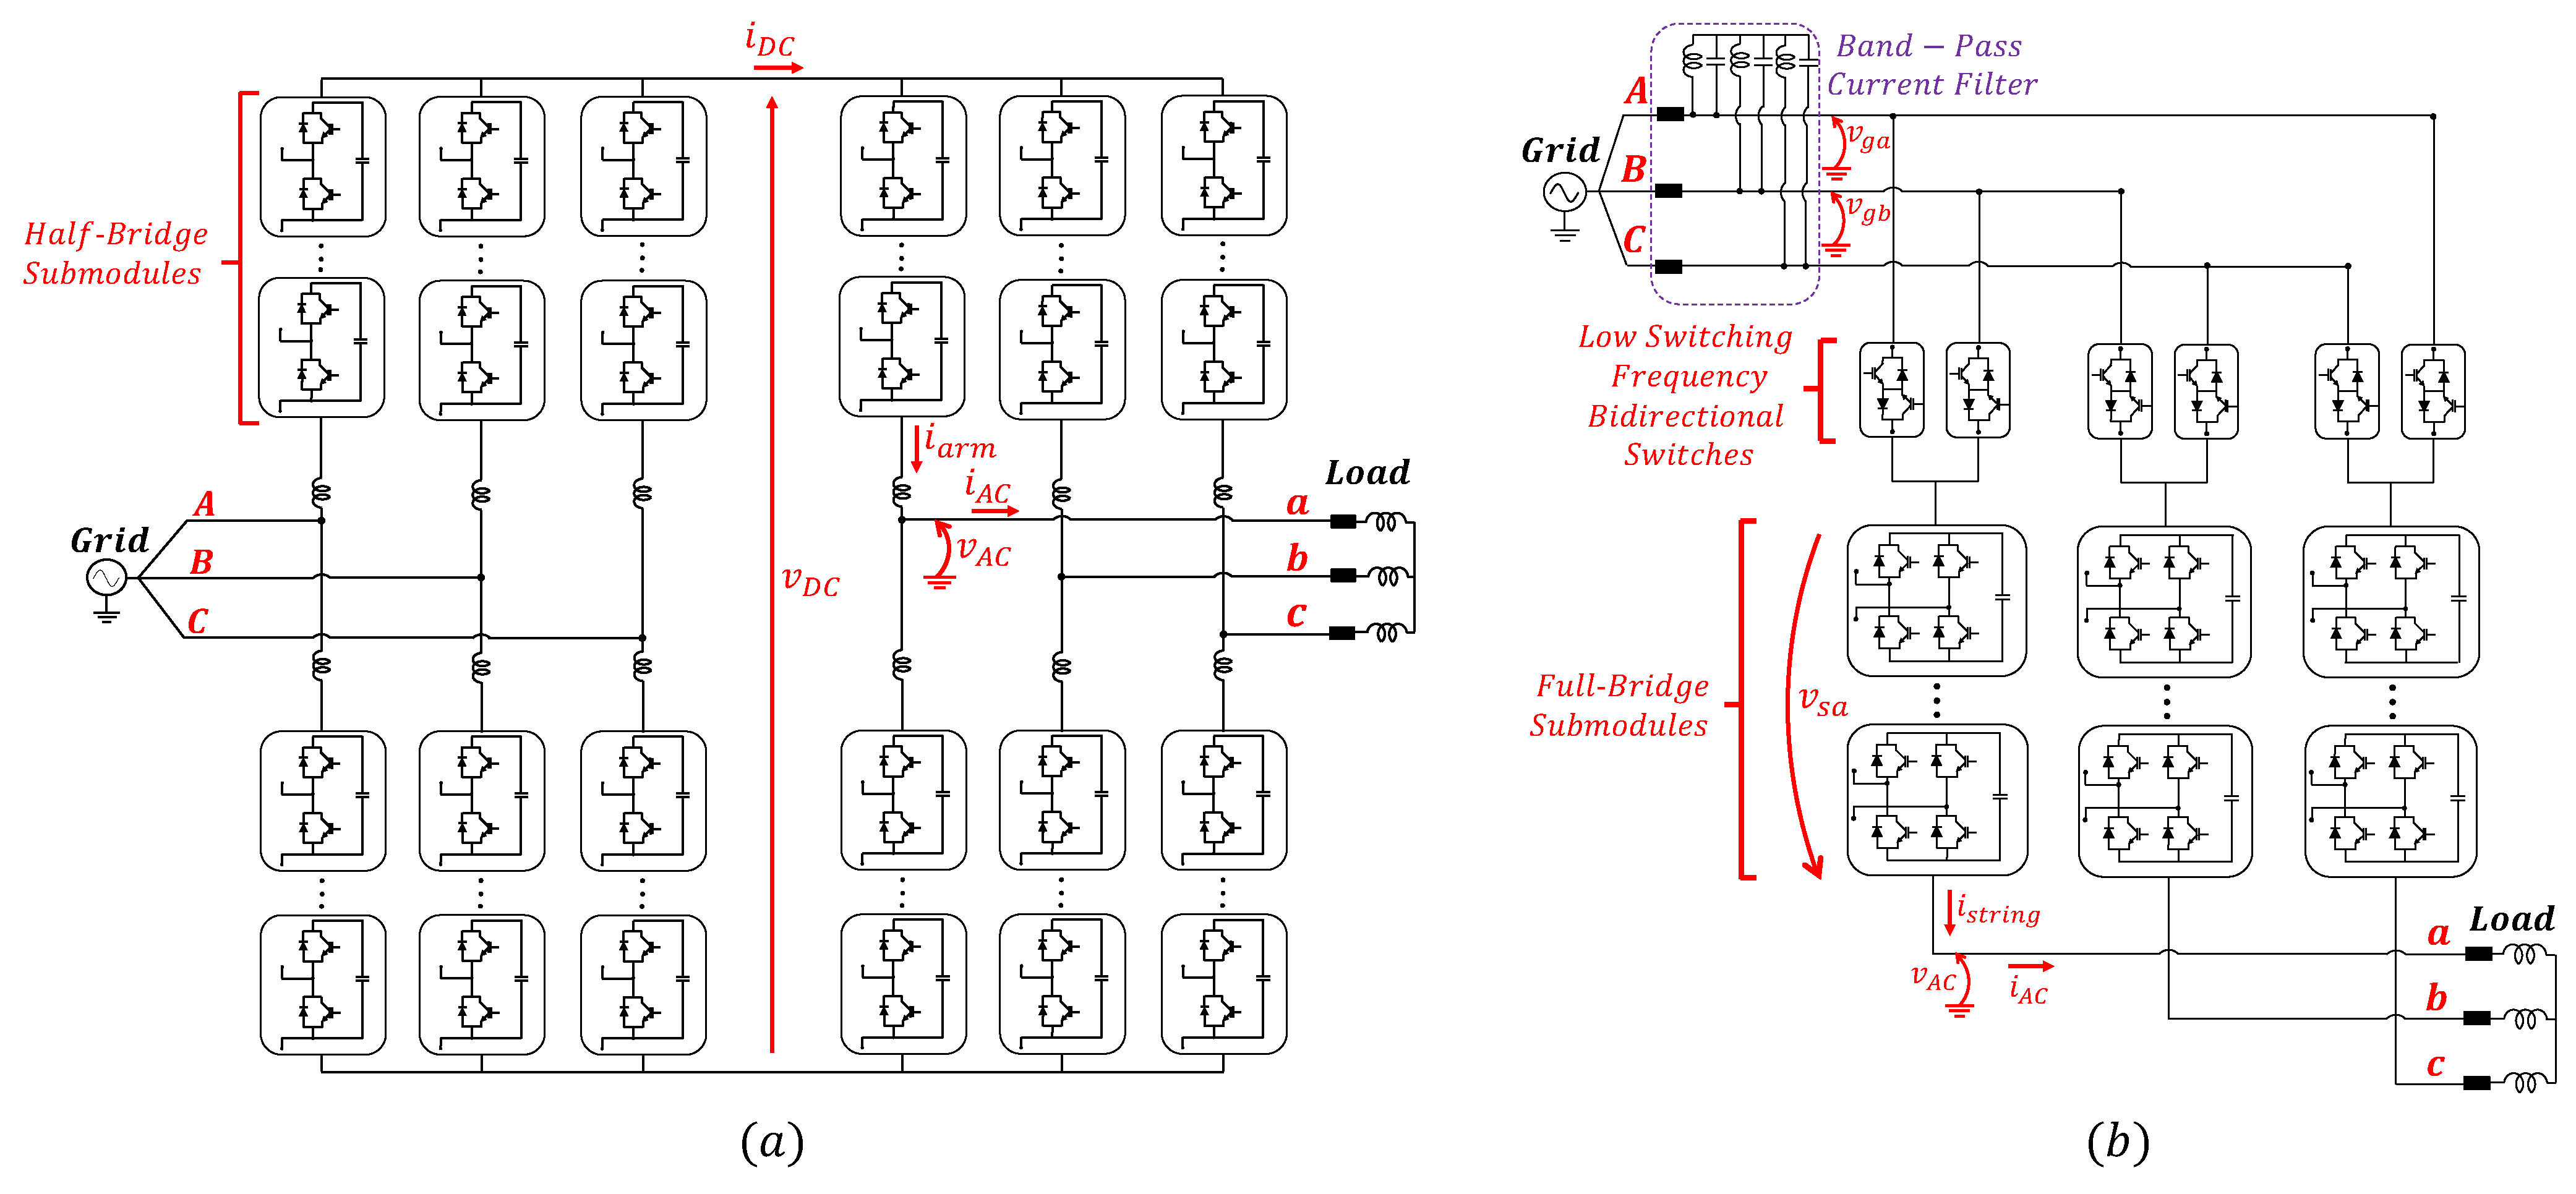
Figure 1. (a) Modular multilevel converter (MMC) topology in the back-to-back configuration and (b) modular multilevel series converter (MMSC) topology.
Energies 14 00776 g001
Figure 2. (a,c,e) show the MMC insertion-index signal ( S ( t ) ) for the cases in which f o = 1 , 10 and 45 Hz, respectively. (b,d,f) show the FFT of the signals shown in (a,c,e), respectively. (g,i,k) show the MMSC insertion-index signal ( S ( t ) ) for the cases in which f o = 1 , 10 and 45 Hz, respectively. (h,j,l) show the FFT of the signals shown in (g,i,k), respectively.
Energies 14 00776 g002
Figure 3. (a,c,e) show the fast Fourier transform (FFT) of the MMC submodule-capacitor current ( i c a p ) for the cases in which f o = 1 , 10 and 45 Hz, respectively. (b,d,f) show the FFT of the MMSC submodule-capacitor current ( i c a p ) for the cases in which f o = 1 , 10 and 45 Hz, respectively.
Energies 14 00776 g003
Figure 4. Submodule-capacitor voltage ripple of MMC and MMSC for the frequency range from f o = 1 Hz to f o = 49 Hz.
Energies 14 00776 g004
Figure 5. MMC simulation results. (ac) show the phase-A-upper-arm insertion-index signal ( S ( t ) ) for the cases in which f o = 1 , 10 and 45 Hz, respectively. (df) show the phase-A-upper-arm current ( i a r m ) for the cases in which f o = 1 , 10 and 45 Hz, respectively. (gi) show the phase-A upper-arm submodule-capacitor voltages ( v c a p ) for the cases in which f o = 1 , 10 and 45 Hz, respectively.
Energies 14 00776 g005
Figure 6. MMSC simulation results. (ac) show the phase-A submodule-string insertion-index signal ( S ( t ) ) for the cases in which f o = 1 , 10 and 45 Hz, respectively. (df) show the phase-A string current ( i s t r i n g ) for the cases in which f o = 1 , 10 and 45 Hz, respectively. (gi) show the phase-A-string submodule-capacitor voltages ( v c a p ) for the cases in which f o = 1 , 10 and 45 Hz, respectively.
Energies 14 00776 g006
Figure 7. (a) MMC test setup and (b) MMSC test setup.
Energies 14 00776 g007
Figure 8. Experimental results. (a,c,e) MMC load current for the cases in which f o = 1 , 10 and 45 Hz, respectively. (b,d,f) MMSC load current for the cases in which f o = 1 , 10 and 45 Hz, respectively.
Energies 14 00776 g008
Figure 9. Experimental results. (a,c,e) MMC submodule-capacitor voltages for the cases in which f o = 1 , 10 and 45 Hz, respectively. (b,d,f) MMSC submodule-capacitor voltages for the cases in which f o = 1 , 10 and 45 Hz, respectively.
Energies 14 00776 g009
Table 1. MMC submodule capacitor voltage ripple.
f o Peak-To-Peak Voltage ( Δ V )
1 Hz1 kV
10 Hz0.1 kV
45 Hz0.02 kV
Table 2. Two most influential harmonic components of MMC submodule capacitor quantities.
f o = 1 Hz
Harmonic Component f h 1 = 1 Hz f h 2 = 2 Hz
Voltage Peak Value392 V184.5 V
Current Peak Value12.32 A11.6 A
f o = 10 Hz
Harmonic Component f h 1 = 10 Hz f h 2 = 20 Hz
Voltage Peak Value38 V17.8 V
Current Peak Value11.94 A11.18 A
f o = 45 Hz
Harmonic Component f h 1 = 45 Hz f h 2 = 90 Hz
Voltage Peak Value9.6 V4.2 V
Current Peak Value13.57 A11.88 A
Table 3. MMSC submodule capacitor voltage ripple.
f o Peak-To-Peak Voltage ( Δ V )
1 Hz0.2 kV
10 Hz0.06 kV
45 Hz0.28 kV
Table 4. Two most influential harmonic components of MMSC submodule capacitor quantities.
f o = 1 Hz
Harmonic Component f h 1 = 2 Hz f h 2 = 4 Hz
Voltage Peak Value69.7 V18.4 V
Current Peak Value4.38 A2.31 A
f o = 10 Hz
Harmonic Component f h 1 = 20 Hz f h 2 = 40 Hz
Voltage Peak Value13 V13 V
Current Peak Value8.17 A16.34 A
f o = 45 Hz
Harmonic Component f h 1 = 5 Hz f h 2 = 10 Hz
Voltage Peak Value105.5 V42 V
Current Peak Value16.57 A13.19 A
Table 5. MMC and MMSC submodule capacitor voltage ripple.
MMCMMSC
f o Peak-To-Peak Voltage ( Δ V )Peak-To-Peak Voltage ( Δ V )
1 Hz24 V4.6 V
10 Hz2.6 V1.3 V
45 Hz0.8 V6.2 V
Publisher’s Note: MDPI stays neutral with regard to jurisdictional claims in published maps and institutional affiliations.