Watt’s up at Home? Smart Meter Data Analytics from a Consumer-Centric Perspective


Abstract
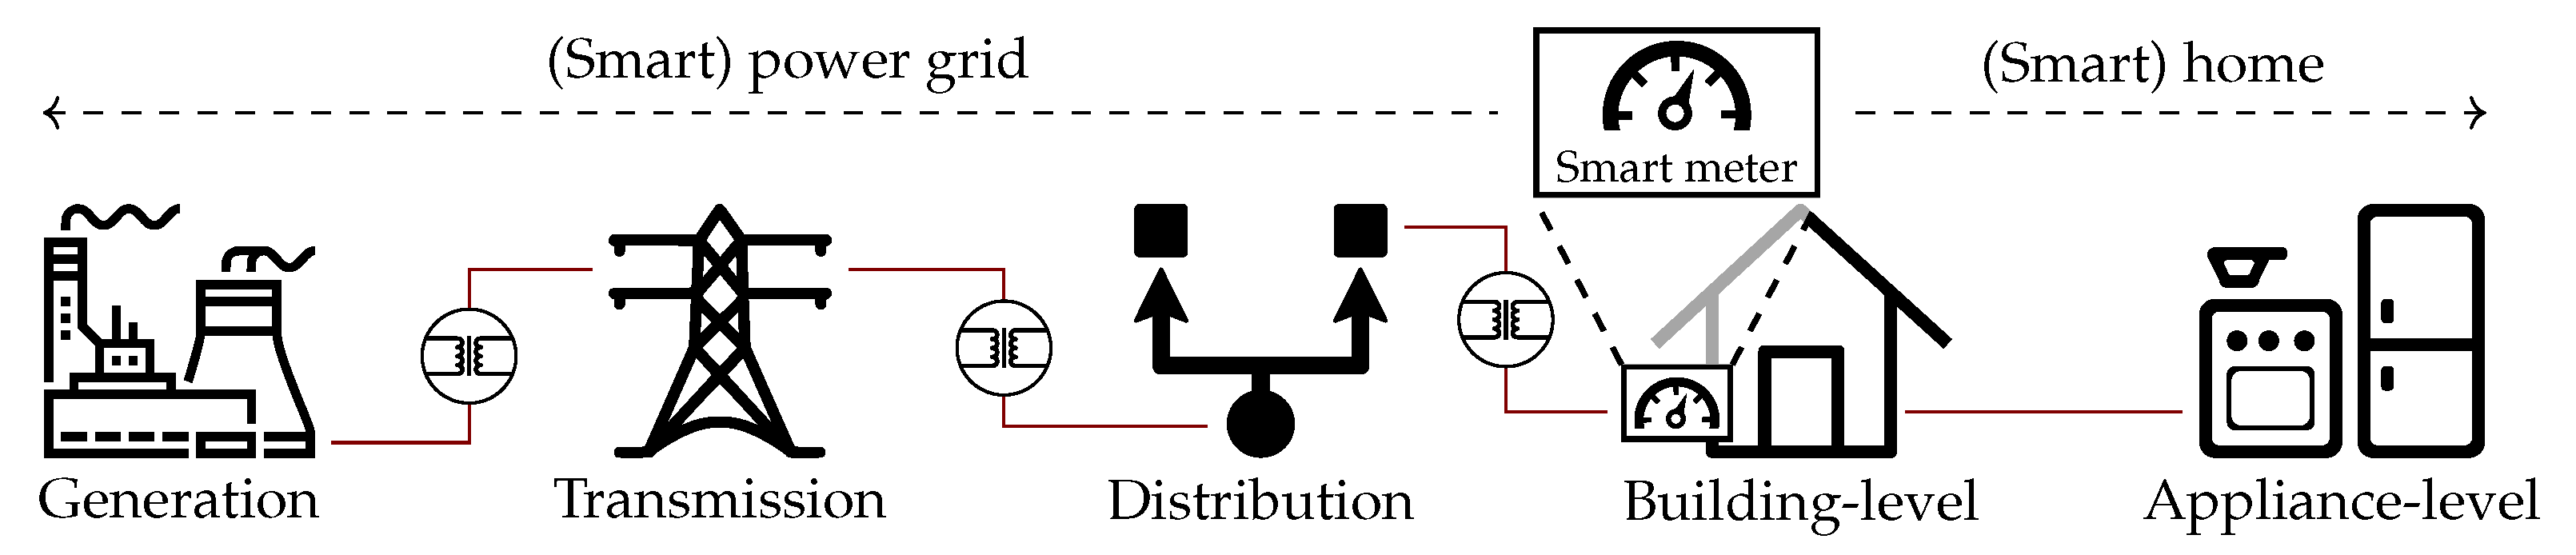
1. Introduction
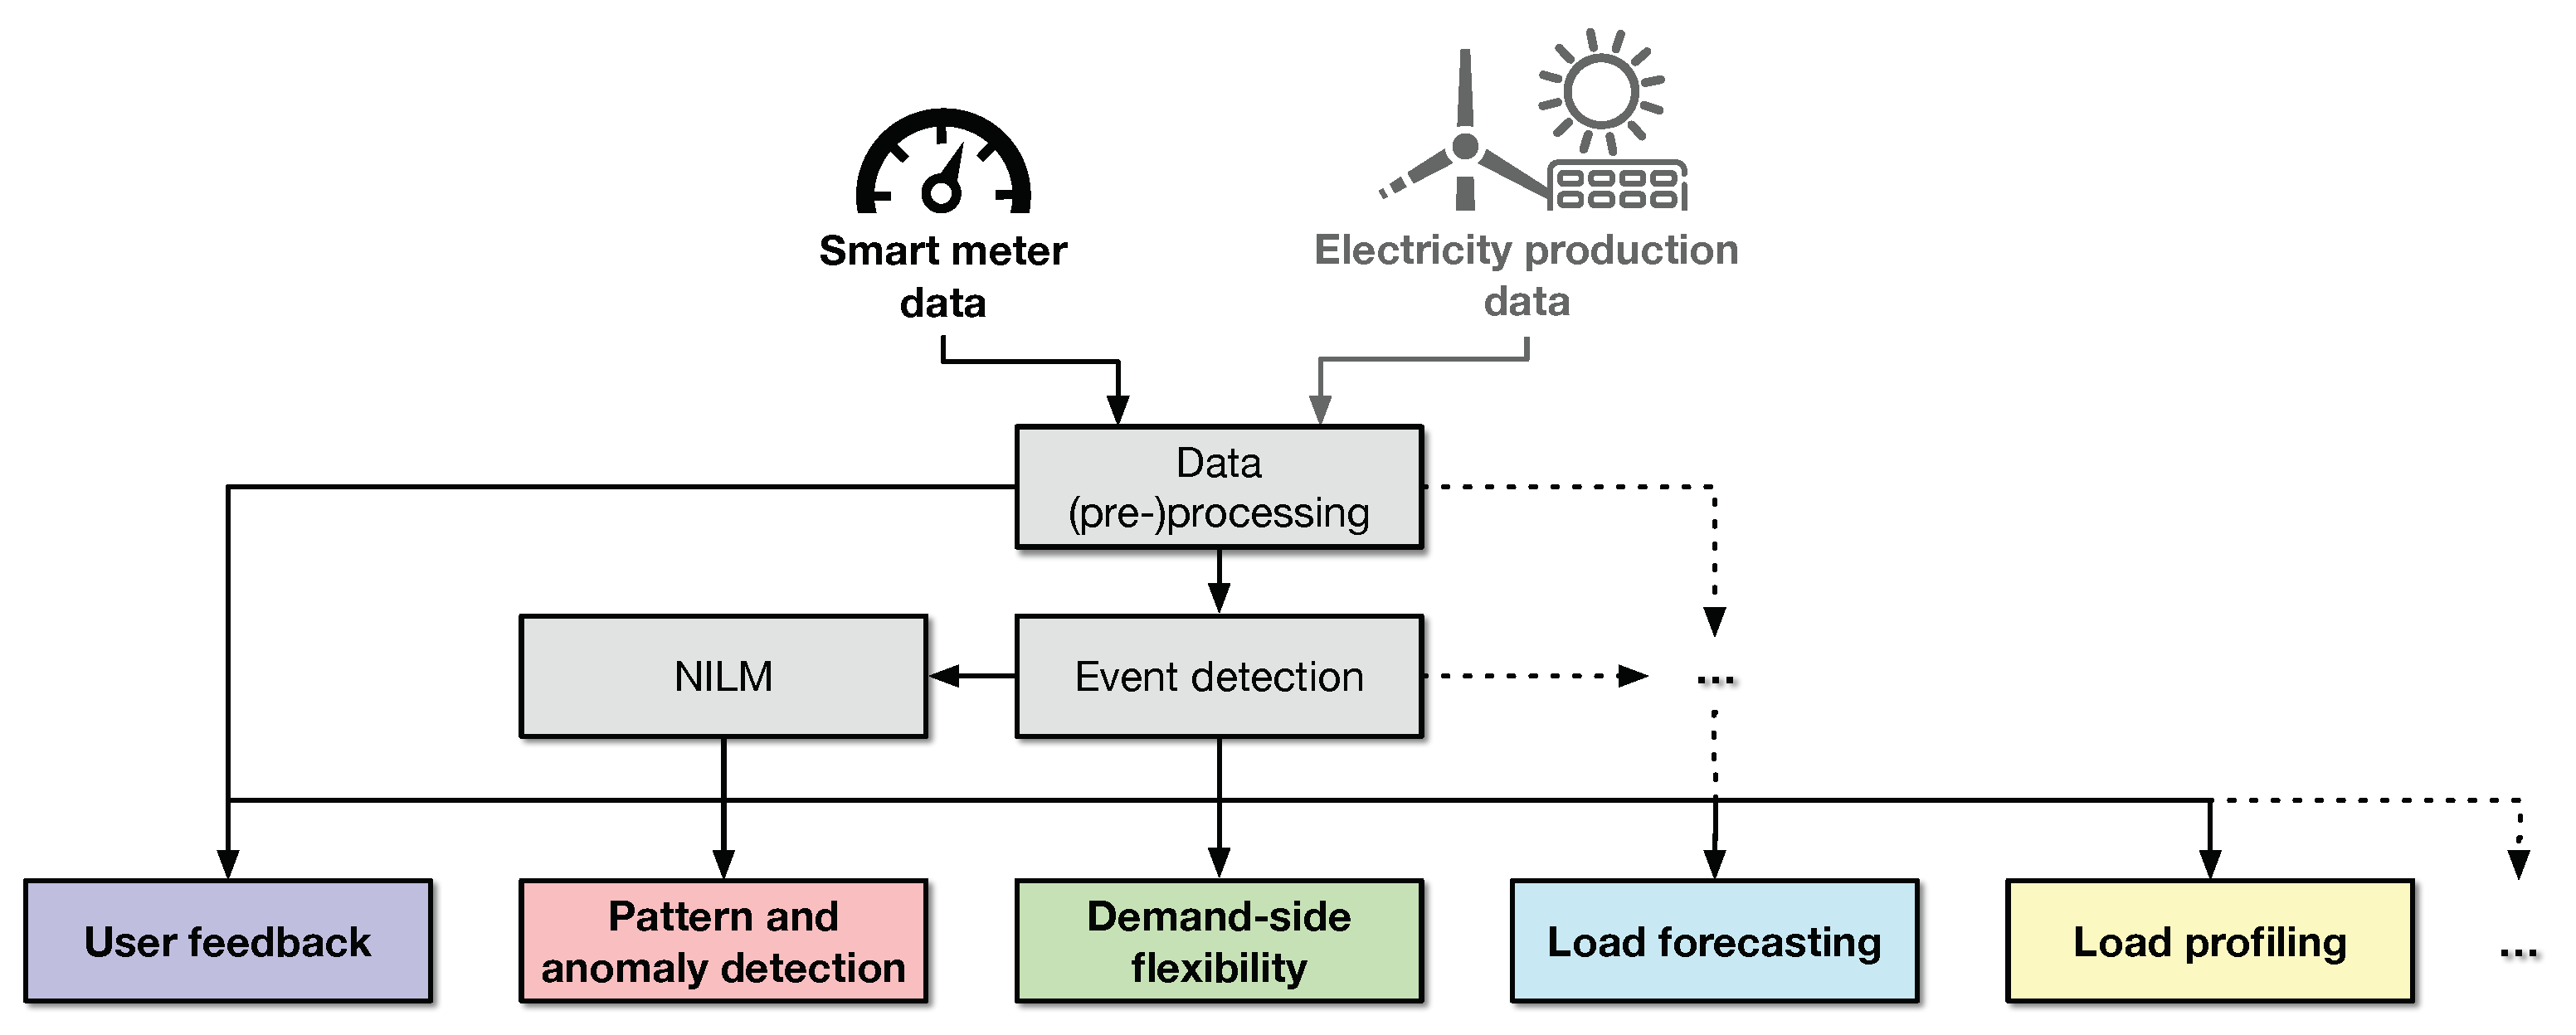
2. Smart Meter Data Collection and Preprocessing
2.1. Data (Pre-)Processing
2.2. Extracting Higher-Level Information
3. Consumer-Centric Use Cases of Smart Meter Data
3.1. Providing User Feedback
3.2. Recognizing Patterns and Anomalies
3.3. Enabling Demand-Side Flexibility
3.4. Forecasting Power Demand and Generation
3.5. Load Profiling
4. Open Research Challenges
4.1. Standardized Hardware and Data Formats
4.2. Innovative Consumer-Centric Data Processing Algorithms
4.3. User Privacy Protection
5. Conclusions
Author Contributions
Funding
Conflicts of Interest
Abbreviations
| AAL | Ambient Assisted Living |
| ADL | Activities of Daily Living |
| AC | Air Conditioning Unit |
| ARIMA | Auto-Regressive Integrated Moving Average |
| BMS | Building Management System |
| CART | Classification and Regression Tree |
| CUSUM | CUmulative SUM |
| DBSCAN | Density-Based Spatial Clustering |
| DER | Distributed Energy Resource |
| DSF | Demand-side flexibility |
| ESS | Energy Storage System |
| EV | Electric Vehicle |
| GDPR | General Data Protection Regulation |
| GMM | Gaussian Mixture Model |
| IEC | International Electrotechnical Commission |
| IHD | In-Home Display |
| KFDA | Kernel Fisher Discriminant Analysis |
| LSTM | Long Short-Term Memory |
| MEC | Multi-access Edge Computing |
| MLP | Multi-Layer Perceptron |
| NILM | Non-Intrusive Load Monitoring |
| P2P | Peer-to-Peer |
| PLR | Piecewise Linear Regression |
| PV | Photovoltaic |
| RES | Renewable Energy Source |
| RMS | Root Mean Square |
| SCP | Switch Continuity Principle |
| SOM | Self-Organizing Map |
| SVM | Support Vector Machine |
References
- Uribe-Pérez, N.; Hernández, L.; De la Vega, D.; Angulo, I. State of the Art and Trends Review of Smart Metering in Electricity Grids. Appl. Sci. 2016, 6, 68. [Google Scholar] [CrossRef]
- Wang, Y.; Chen, Q.; Hong, T.; Kang, C. Review of Smart Meter Data Analytics: Applications, Methodologies, and Challenges. IEEE Trans. Smart Grid 2019, 10, 3125–3148. [Google Scholar] [CrossRef]
- Haney, A.B.; Jamasb, T.; Pollitt, M.G. Smart metering: Technology, economics and international experience. In The Future of Electricity Demand: Customers, Citizens and Loads; Department of Applied Economics Occasional Papers, Cambridge University Press: Cambridge, UK, 2011; pp. 161–184. [Google Scholar]
- Kuralkar, S.; Mulay, P.; Chaudhari, A. Smart Energy Meter: Applications, Bibliometric Reviews and Future Research Directions. Sci. Technol. Libr. 2020, 39, 165–188. [Google Scholar] [CrossRef]
- Wang, Y.; Chen, Q.; Kang, C. Smart Meter Data Analytics: Electricity Consumer Behavior Modeling, Aggregation, and Forecasting; Springer: Berlin/Heidelberg, Germany, 2020; pp. 1–293. [Google Scholar] [CrossRef]
- Alzaatreh, A.; Mahdjoubi, L.; Gething, B.; Sierra, F. Disaggregating high-resolution gas metering data using pattern recognition. Energy Build. 2018, 176, 17–32. [Google Scholar] [CrossRef]
- Vu, T.T.; Sokan, A.; Nakajo, H.; Fujinami, K.; Suutala, J.; Siirtola, P.; Alasalmi, T.; Pitkanen, A.; Roning, J. Feature Selection and Activity Recognition to Detect Water Waste from Water Tap Usage. In Proceedings of the IEEE 17th International Conference on Embedded and Real-Time Computing Systems and Applications, Toyama, Japan, 29–31 August 2011; pp. 138–141. [Google Scholar]
- Guyot, P.; Pinquier, J.; Valero, X.; Alías, F. Two-step detection of water sound events for the diagnostic and monitoring of dementia. In Proceedings of the IEEE International Conference on Multimedia and Expo (ICME), San Jose, CA, USA, 15–19 July 2013; pp. 1–6. [Google Scholar]
- Fogarty, J.; Au, C.; Hudson, S.E. Sensing from the Basement: A Feasibility Study of Unobtrusive and Low-Cost Home Activity Recognition. In Proceedings of the 19th Annual ACM Symposium on User Interface Software and Technology, Montreux, Switzerland, 15–18 October 2006; pp. 91–100. [Google Scholar]
- Fontdecaba, S.; Sánchez-Espigares, J.A.; Marco-Almagro, L.; Tort-Martorell, X.; Cabrespina, F.; Zubelzu, J. An approach to disaggregating total household water consumption into major end-uses. Water Resour. Manag. 2013, 27, 2155–2177. [Google Scholar] [CrossRef]
- Froehlich, J.E.; Larson, E.; Campbell, T.; Haggerty, C.; Fogarty, J.; Patel, S.N. HydroSense: Infrastructure-mediated single-point sensing of whole-home water activity. In Proceedings of the 11th International Conference on Ubiquitous Computing, Orlando, FL, USA, 30 September–3 October 2009; pp. 235–244. [Google Scholar]
- Cabeza, L.F.; Ürge Vorsatz, D.; Palacios, A.; Ürge, D.; Serrano, S.; Barreneche, C. Trends in Penetration and Ownership of Household Appliances. Renew. Sustain. Energy Rev. 2018, 82, 4044–4059. [Google Scholar] [CrossRef]
- Jones, R.V.; Lomas, K.J. Determinants of High Electrical Energy Demand in UK Homes: Appliance Ownership and Use. Energy Build. 2016, 117, 71–82. [Google Scholar] [CrossRef]
- Förderer, K.; Lösch, M.; Növer, R.; Ronczka, M.; Schmeck, H. Smart Meter Gateways: Options for a BSI-Compliant Integration of Energy Management Systems. Appl. Sci. 2019, 9, 1634. [Google Scholar] [CrossRef]
- Elton Law. Impyute—A Library of Missing Data Imputation Algorithms Written in Python 3. 2020. Available online: http://impyute.readthedocs.io (accessed on 28 December 2020).
- Younis, R.; Reinhardt, A. A Study on Fundamental Waveform Shapes in Microscopic Electrical Load Signatures. Energies 2020, 13, 3039. [Google Scholar] [CrossRef]
- Parson, O.; Fisher, G.; Hersey, A.; Batra, N.; Kelly, J.; Singh, A.; Knottenbelt, W.; Rogers, A. Dataport and NILMTK: A building data set designed for non-intrusive load monitoring. In Proceedings of the 2015 IEEE Global Conference on Signal and Information Processing (GlobalSIP), Orlando, FL, USA, 14–16 December 2015; pp. 210–214. [Google Scholar]
- Batra, N.; Gulati, M.; Singh, A.; Srivastava, M.B. It’s Different: Insights into home energy consumption in India. In Proceedings of the 5th ACM Workshop on Embedded Systems for Energy-Efficient Buildings, Rome, Italy, 13–14 November 2013; pp. 1–8. [Google Scholar]
- Makonin, S.; Popowich, F.; Bartram, L.; Gill, B.; Bajić, I.V. AMPds: A public dataset for load disaggregation and eco-feedback research. In Proceeding of the Annual Electrical Power and Energy Conference (EPEC), Halifax, NS, Canada, 21–23 August 2013. [Google Scholar] [CrossRef]
- Makonin, S.; Wang, Z.J.; Tumpach, C. RAE: The rainforest automation energy dataset for smart grid meter data analysis. Data 2018, 3, 8. [Google Scholar] [CrossRef]
- Beckel, C.; Kleiminger, W.; Cicchetti, R.; Staake, T.; Santini, S. The ECO data set and the performance of non-intrusive load monitoring algorithms. In Proceedings of the 1st ACM Conference on Embedded Systems for Energy-Efficient Buildings, Memphis, TN, USA, 5–6 November 2014; pp. 80–89. [Google Scholar]
- Kolter, J.Z.; Johnson, M.J. REDD: A Public Data Set for Energy Disaggregation Research. In Proceedings of the 1st KDD Workshop on Data Mining Applications in Sustainability (SustKDD), San Diego, CA, USA, 21 August 2011; pp. 1–6. [Google Scholar]
- Ribeiro, M.; Pereira, L.; Quintal, F.; Nunes, N. SustDataED: A Public Dataset for Electric Energy Disaggregation Research. In ICT for Sustainability 2016; Advances in Computer Science Research; Atlantis Press: Amsterdam, The Netherlands, 2016; pp. 244–245. [Google Scholar] [CrossRef]
- Kriechbaumer, T.; Jacobsen, H.A. BLOND, a building-level office environment dataset of typical electrical appliances. Sci. Data 2018, 5, 180048. [Google Scholar] [CrossRef] [PubMed]
- Saputro, N.; Akkaya, K. Investigation of Smart Meter Data Reporting Strategies for Optimized Performance in Smart Grid AMI Networks. IEEE Internet Things J. 2017, 4, 894–904. [Google Scholar] [CrossRef]
- Díaz García, J.; Brunet Crosa, P.; Navazo Álvaro, I.; Vázquez Alcocer, P.P. Downsampling methods for medical datasets. In Proceedings of the International Conferences Computer Graphics, Visualization, Computer Vision and Image Processing and Big Data Analytics, Data Mining and Computational Intelligence, Lisbon, Portugal, 21–23 July 2017; IADIS Press: Lisbon, Portugal, 2017; pp. 12–20. [Google Scholar]
- Reinhardt, A.; Englert, F.; Christin, D. Averting the privacy risks of smart metering by local data preprocessing. Pervasive Mob. Comput. 2015, 16, 171–183. [Google Scholar] [CrossRef]
- Kukunuri, R.; Batra, N.; Wang, H. An open problem: Energy data super-resolution. In Proceedings of the 5th International Workshop on Non-Intrusive Load Monitoring, Yokohama, Japan, 18 November 2020; pp. 99–102. [Google Scholar]
- Osathanunkul, K.; Osathanunkul, K. Different Sampling Rates on Neural NILM Energy Disaggregation. In Proceedings of the Joint International Conference on Digital Arts, Media and Technology with ECTI Northern Section Conference on Electrical, Electronics, Computer and Telecommunications Engineering (ECTI DAMT-NCON), Nan, Thailand, 30 January–2 February 2019; pp. 318–321. [Google Scholar]
- Huang, B.; Knox, M.; Bradbury, K.; Collins, L.M.; Newell, R.G. Non-intrusive load monitoring system performance over a range of low frequency sampling rates. In Proceedings of the 6th IEEE International Conference on Renewable Energy Research and Applications (ICRERA), San Diego, CA, USA, 5–8 December 2017; pp. 505–509. [Google Scholar]
- Huchtkoetter, J.; Reinhardt, A. On the Impact of Temporal Data Resolution on the Accuracy of Non-Intrusive Load Monitoring. In Proceedings of the 7th ACM International Conference on Systems for Energy-Efficient Buildings, Cities, and Transportation, Yokohama, Japan, 19–20 November 2020; pp. 270–273. [Google Scholar]
- Huchtkoetter, J.; Reinhardt, A. A study on the impact of data sampling rates on load signature event detection. Energy Inform. 2019, 2, 24. [Google Scholar] [CrossRef]
- Wang, Y.; Chen, Q.; Kang, C.; Xia, Q.; Luo, M. Sparse and Redundant Representation-Based Smart Meter Data Compression and Pattern Extraction. IEEE Trans. Power Syst. 2017, 32, 2142–2151. [Google Scholar] [CrossRef]
- De Souza, J.C.S.; Assis, T.M.L.; Pal, B.C. Data Compression in Smart Distribution Systems via Singular Value Decomposition. IEEE Trans. Smart Grid 2017, 8, 275–284. [Google Scholar] [CrossRef]
- Serrenho, T.; Zangheri, P.; Bertoldi, P. Energy Feedback Systems: Evaluation of Meta-Studies on Energy Savings through Feedback; EUR—Scientific and Technical Research Reports EUR 27992 EN; Publications Office of the European Union: Brussels, Belgium, 2015; ISBN 978-92-79-59778-7. [Google Scholar] [CrossRef]
- Kahl, M.; Haq, A.U.; Kriechbaumer, T.; Jacobsen, H.A. A comprehensive feature study for appliance recognition on high frequency energy data. In Proceedings of the e-Energy 2017—8th International Conference on Future Energy Systems, Hong Kong, China, 16–19 May 2017; pp. 121–131. [Google Scholar] [CrossRef]
- Liang, J.; Ng, S.K.; Kendall, G.; Cheng, J.W. Load signature study—Part I: Basic concept, structure, and methodology. IEEE Trans. Power Deliv. 2010, 25, 551–560. [Google Scholar] [CrossRef]
- Sadeghianpourhamami, N.; Ruyssinck, J.; Deschrijver, D.; Dhaene, T.; Develder, C. Comprehensive feature selection for appliance classification in NILM. Energy Build. 2017, 151, 98–106. [Google Scholar] [CrossRef]
- Hart, G.W. Nonintrusive appliance load monitoring. Proc. IEEE 1992, 80, 1870–1891. [Google Scholar] [CrossRef]
- Makonin, S. Investigating the switch continuity principle assumed in Non-Intrusive Load Monitoring (NILM). In Proceedings of the 2016 IEEE Canadian Conference on Electrical and Computer Engineering (CCECE), Vancouver, BC, Canada, 15–18 May 2016; pp. 1–4. [Google Scholar]
- Anderson, K.D.; Bergés, M.E.; Ocneanu, A.; Benitez, D.; Moura, J.M. Event detection for non intrusive load monitoring. In Proceedings of the the 38th Annual Conference on IEEE Industrial Electronics Society (IECON), Montreal, QC, Canada, 25–28 October 2012; pp. 3312–3317. [Google Scholar]
- Kelly, J.; Knottenbelt, W. The UK-DALE dataset, domestic appliance-level electricity demand and whole-house demand from five UK homes. Sci. Data 2015, 2, 150007. [Google Scholar] [CrossRef]
- Pereira, L.; Nunes, N. An empirical exploration of performance metrics for event detection algorithms in Non-Intrusive Load Monitoring. Sustain. Cities Soc. 2020, 62, 102399. [Google Scholar] [CrossRef]
- Völker, B.; Pfeifer, M.; Scholl, P.M.; Becker, B. Annoticity: A Smart Annotation Tool and Data Browser for Electricity Datasets. In Proceedings of the 5th International Workshop on Non-Intrusive Load Monitoring, Yokohama, Japan, 18 November 2020; pp. 1–5. [Google Scholar]
- Pereira, L.; Nunes, N.J. Semi-automatic labeling for public non-intrusive load monitoring datasets. In Proceedings of the Sustainable Internet and ICT for Sustainability (SustainIT), Madrid, Spain, 14–15 April 2015; pp. 1–4. [Google Scholar]
- Anderson, K.; Ocneanu, A.F.; Benitez, D.; Carlson, D.; Rowe, A.; Bergés, M. BLUED: A Fully Labeled Public Dataset for Event-Based Non-Intrusive Load Monitoring Research. In Proceedings of the 2nd KDD Workshop on Data Mining Applications in Sustainability (SustKDD), Beijing, China, 12–16 August 2012; pp. 1–5. [Google Scholar]
- Völker, B.; Pfeifer, M.; Scholl, P.M.; Becker, B. FIRED: A Fully-labeled hIgh-fRequency Electricity Disaggregation Dataset. In Proceedings of the 7th ACM International Conference on Systems for Energy-Efficient Built Environments (BuildSys), Yokohama, Japan, 18–20 November 2020. [Google Scholar]
- Kahl, M.; Kriechbaumer, T.; Jorde, D.; Ul Haq, A.; Jacobsen, H.A. Appliance Event Detection-A Multivariate, Supervised Classification Approach. In Proceedings of the 10th ACM International Conference on Future Energy Systems (e-Energy), Phoenix, AZ, USA, 25–28 June 2019; pp. 373–375. [Google Scholar]
- Pereira, L.; Ribeiro, M.; Nunes, N. Engineering and deploying a hardware and software platform to collect and label non-intrusive load monitoring datasets. In Sustainable Internet and ICT for Sustainability (SustainIT); IEEE/IFIP: Funchal, Portugal, 2017; pp. 1–9. [Google Scholar] [CrossRef]
- Weiss, M.; Helfenstein, A.; Mattern, F.; Staake, T. Leveraging smart meter data to recognize home appliances. In Proceedings of the IEEE International Conference on Pervasive Computing and Communications, (PerCom 2012), Lugano, Switzerland, 19–23 March 2012; pp. 190–197. [Google Scholar] [CrossRef]
- Meehan, P.; McArdle, C.; Daniels, S. An efficient, scalable time-frequency method for tracking energy usage of domestic appliances using a two-step classification algorithm. Energies 2014, 7, 7041–7066. [Google Scholar] [CrossRef]
- Luo, D.; Norford, L.K.; Shaw, S.R.; Leeb, S.B. Monitoring HVAC equipment electrical loads from a centralized location–methods and field test results/Discussion. ASHRAE Trans. 2002, 108, 841. [Google Scholar]
- Pereira, L. Developing and evaluating a probabilistic event detector for non-intrusive load monitoring. In Sustainable Internet and ICT for Sustainability (SustainIT); IEEE: Funchal, Portugal, 2017; pp. 1–10. [Google Scholar] [CrossRef]
- Völker, B.; Scholl, P.M.; Becker, B. Semi-Automatic Generation and Labeling of Training Data for Non-Intrusive Load Monitoring. In Proceedings of the 10th ACM International Conference on Future Energy Systems (e-Energy), Phoenix, AZ, USA, 25–28 June 2019. [Google Scholar]
- Trung, K.N.; Dekneuvel, E.; Nicolle, B.; Zammit, O.; Van, C.N.; Jacquemod, G. Event detection and disaggregation algorithms for nialm system. In Proceedings of the 2nd International Non-Intrusive Load Monitoring (NILM) Workshop, Austin, TX, USA, 3 June 2014. [Google Scholar]
- Wild, B.; Barsim, K.S.; Yang, B. A new unsupervised event detector for non-intrusive load monitoring. In Proceedings of the IEEE Global Conference on Signal and Information Processing (GlobalSIP), Orlando, FL, USA, 14–16 December 2015; pp. 73–77. [Google Scholar]
- De Baets, L.; Ruyssinck, J.; Deschrijver, D.; Dhaene, T. Event detection in NILM using cepstrum smoothing. In Proceedings of the 3rd International Workshop on Non-Intrusive Load Monitoring, Vancouver, BC, Canada, 14–15 May 2016; pp. 1–4. [Google Scholar]
- Cox, R.; Leeb, S.B.; Shaw, S.R.; Norford, L.K. Transient event detection for nonintrusive load monitoring and demand side management using voltage distortion. In Proceedings of the 21st Annual IEEE Applied Power Electronics Conference and Exposition, Dallas, TX, USA, 19–23 March 2006; p. 7. [Google Scholar]
- Zoha, A.; Gluhak, A.; Imran, M.A.; Rajasegarar, S. Non-intrusive load monitoring approaches for disaggregated energy sensing: A survey. Sensors 2012, 12, 16838–16866. [Google Scholar] [CrossRef]
- Bonfigli, R.; Squartini, S.; Fagiani, M.; Piazza, F. Unsupervised algorithms for non-intrusive load monitoring: An up-to-date overview. In Proceedings of the IEEE 15th International Conference on Environment and Electrical Engineering (EEEIC), Rome, Italy, 10–13 June 2015; pp. 1175–1180. [Google Scholar]
- Faustine, A.; Mvungi, N.H.; Kaijage, S.; Michael, K. A survey on non-intrusive load monitoring methodies and techniques for energy disaggregation problem. arXiv 2017, arXiv:1703.00785. [Google Scholar]
- Alcalá, J.; Ure na, J.; Hernández, Á.; Gualda, D. Event-based energy disaggregation algorithm for activity monitoring from a single-point sensor. IEEE Trans. Instrum. Meas. 2017, 66, 2615–2626. [Google Scholar] [CrossRef]
- Barsim, K.S.; Streubel, R.; Yang, B. Unsupervised adaptive event detection for building-level energy disaggregation. In Proceedings of the Power and Energy Student Summt (PESS), Stuttgart, Germany, 22–24 January 2014. [Google Scholar]
- Meziane, M.N.; Ravier, P.; Lamarque, G.; Le Bunetel, J.C.; Raingeaud, Y. High accuracy event detection for non-intrusive load monitoring. In Proceedings of the 2017 IEEE International Conference on Acoustics, Speech and Signal Processing (ICASSP), New Orleans, LA, USA, 5–9 March 2017; pp. 2452–2456. [Google Scholar]
- Girmay, A.A.; Camarda, C. Simple event detection and disaggregation approach for residential energy estimation. In Proceedings of the 3rd International Workshop on Non-Intrusive Load Monitoring (NILM), Vancouver, BC, Canada, 14–15 May 2016. [Google Scholar]
- Sethom, H.B.A.; Houidi, S.; Auger, F.; Ben, H.; Sethom, A.; Fourer, D.; Miègeville, L. Multivariate Event Detection Methods for Non-Intrusive Load Monitoring in Smart Homes and Residential Buildings. Energy Build. 2019, 208, 109624. [Google Scholar]
- Gomes, E.; Pereira, L. PB-NILM: Pinball Guided Deep Non-Intrusive Load Monitoring. IEEE Access 2020, 8, 48386–48398. [Google Scholar] [CrossRef]
- Faustine, A.; Pereira, L.; Bousbiat, H.; Kulkarni, S. UNet-NILM: A Deep Neural Network for Multi-tasks Appliances State Detection and Power Estimation in NILM. In Proceedings of the 5th International Workshop on Non-Intrusive Load Monitoring, Yokohama, Japan, 18 November 2020; pp. 84–88. [Google Scholar]
- Faustine, A.; Pereira, L.; Klemenjak, C. Adaptive Weighted Recurrence Graphs for Appliance Recognition in Non-Intrusive Load Monitoring. IEEE Trans. Smart Grid 2020. [Google Scholar] [CrossRef]
- Fischer, C. Feedback on household electricity consumption: A tool for saving energy? Energy Effic. 2008, 1, 79–104. [Google Scholar] [CrossRef]
- Froehlich, J.; Findlater, L.; Landay, J. The Design of Eco-feedback Technology. In Proceedings of the SIGCHI Conference on Human Factors in Computing Systems, Atlanta, GA, USA, 10–15 April 2010; ACM: New York, NY, USA, 2010; pp. 1999–2008. [Google Scholar] [CrossRef]
- Armel, K.C.; Gupta, A.; Shrimali, G.; Albert, A. Is Disaggregation the Holy Grail of Energy Efficiency? The Case of Electricity. Energy Policy 2013, 52, 213–234. [Google Scholar] [CrossRef]
- Choi, T.S.; Ko, K.R.; Park, S.C.; Jang, Y.S.; Yoon, Y.T.; Im, S.K. Analysis of energy savings using smart metering system and IHD (in-home display). In Proceedings of the 2009 Transmission Distribution Conference Exposition: Asia and Pacific, Seoul, Korea, 26–30 October 2009; pp. 1–4. [Google Scholar] [CrossRef]
- Paay, J.; Kjeldskov, J.; Skov, M.B.; Lund, D.; Madsen, T.; Nielsen, M. Design of an appliance level eco-feedback display for domestic electricity consumption. In Proceedings of the 26th Australian Computer-Human Interaction Conference on Designing Futures: The Future of Design (OzCHI), Sydney, NSW, Australia, 2–5 December 2014; Association for Computing Machinery: New York, NY, USA, 2014; pp. 332–341. [Google Scholar] [CrossRef]
- Broms, L.; Katzeff, C.; Bang, M.; Nyblom, A.; Hjelm, S.I.; Ehrnberger, K. Coffee maker patterns and the design of energy feedback artefacts. In Proceedings of the 8th ACM Conference on Designing Interactive Systems (DIS), Aarhus, Denmark, 16–20 August 2010; Association for Computing Machinery: New York, NY, USA, 2010; pp. 93–102. [Google Scholar] [CrossRef]
- Rodgers, J.; Bartram, L. Exploring Ambient and Artistic Visualization for Residential Energy Use Feedback. IEEE Trans. Vis. Comput. Graph. 2011, 17, 2489–2497. [Google Scholar] [CrossRef] [PubMed]
- Spagnolli, A.; Corradi, N.; Gamberini, L.; Hoggan, E.; Jacucci, G.; Katzeff, C.; Broms, L.; Jonsson, L. Eco-Feedback on the Go: Motivating Energy Awareness. Computer 2011, 44, 38–45. [Google Scholar] [CrossRef]
- Costanza, E.; Ramchurn, S.D.; Jennings, N.R. Understanding Domestic Energy Consumption Through Interactive Visualisation: A Field Study. In Proceedings of the ACM Conference on Ubiquitous Computing, Pittsburgh, PA, USA, 5–8 September 2012; ACM: New York, NY, USA, 2012; pp. 216–225. [Google Scholar] [CrossRef]
- Quintal, F.; Pereira, L.; Nunes, N.; Nisi, V.; Barreto, M. WATTSBurning: Design and Evaluation of an Innovative Eco-Feedback System. In Human-Computer Interaction—INTERACT; Lecture Notes in Computer Science; Springer: Berlin/Heidelberg, Germany, 2013; pp. 453–470. [Google Scholar] [CrossRef]
- Moere, A.V.; Tomitsch, M.; Hoinkis, M.; Trefz, E.; Johansen, S.; Jones, A. Comparative Feedback in the Street: Exposing Residential Energy Consumption on House Façades. In Human-Computer Interaction—INTERACT 2011; Campos, P., Graham, N., Jorge, J., Nunes, N., Palanque, P., Winckler, M., Eds.; Lecture Notes in Computer Science; Springer: Berlin/Heidelberg, Germany, 2011; pp. 470–488. [Google Scholar] [CrossRef]
- Quintal, F.; Barreto, M.; Nunes, N.; Nisi, V.; Pereira, L. WattsBurning on My Mailbox: A Tangible Art Inspired Eco-feedback Visualization for Sharing Energy Consumption. In Human-Computer Interaction—INTERACT; Lecture Notes in Computer Science; Springer: Berlin/Heidelberg, Germany, 2013; pp. 133–140. [Google Scholar] [CrossRef]
- Foster, D.; Lawson, S.; Blythe, M.; Cairns, P. Wattsup? motivating reductions in domestic energy consumption using social networks. In Proceedings of the 6th Nordic Conference on Human-Computer Interaction: Extending Boundaries, Reykjavik, Iceland, 16–20 October 2010; Association for Computing Machinery: New York, NY, USA, 2010; pp. 178–187. [Google Scholar] [CrossRef]
- Filonik, D.; Medland, R.; Foth, M.; Rittenbruch, M. A Customisable Dashboard Display for Environmental Performance Visualisations. In Persuasive Technology; Springer: Berlin/Heidelberg, Germany, 2013; pp. 51–62. [Google Scholar] [CrossRef]
- Kelly, J.; Knottenbelt, W. Does disaggregated electricity feedback reduce domestic electricity consumption? A systematic review of the literature. arXiv 2016, arXiv:1605.00962. [Google Scholar]
- Pereira, L.; Quintal, F.; Barreto, M.; Nunes, N.J. Understanding the Limitations of Eco-feedback: A One-Year Long-Term Study. In Human-Computer Interaction and Knowledge Discovery in Complex, Unstructured, Big Data; Holzinger, A., Pasi, G., Eds.; Lecture Notes in Computer Science; Springer: Maribor, Slovenia, 2013; pp. 237–255. [Google Scholar]
- Buchanan, K.; Russo, R.; Anderson, B. Feeding back about eco-feedback: How do consumers use and respond to energy monitors? Energy Policy 2014, 73, 138–146. [Google Scholar] [CrossRef]
- Ma, G.; Lin, J.; Li, N. Longitudinal assessment of the behavior-changing effect of app-based eco-feedback in residential buildings. Energy Build. 2018, 159, 486–494. [Google Scholar] [CrossRef]
- Pereira, L.; Nunes, N. Understanding the practical issues of deploying energy monitoring and eco-feedback technology in the wild: Lesson learned from three long-term deployments. Energy Rep. 2019, 6, 94–106. [Google Scholar] [CrossRef]
- Schwartz, T.; Denef, S.; Stevens, G.; Ramirez, L.; Wulf, V. Cultivating Energy Literacy: Results from a Longitudinal Living Lab Study of a Home Energy Management System. In Proceedings of the SIGCHI Conference on Human Factors in Computing Systems, Paris, France, 27 April–2 May 2013; ACM: New York, NY, USA, 2013; pp. 1193–1202. [Google Scholar] [CrossRef]
- Geelen, D.; Mugge, R.; Silvester, S.; Bulters, A. The use of apps to promote energy saving: A study of smart meter–related feedback in the Netherlands. Energy Effic. 2019, 12, 1635–1660. [Google Scholar] [CrossRef]
- Hansen, M.; Hauge, B. Prosumers and smart grid technologies in Denmark: Developing user competences in smart grid households. Energy Effic. 2017, 10, 1215–1234. [Google Scholar] [CrossRef]
- Barreto, M.; Pereira, L.; Quintal, F. The Acceptance of energy monitoring technologies: The case of local prosumers. In Proceedings of the 6th International Conference on ICT for Sustainability, Lappeenranta, Finland, 10–14 June 2019; CEUR-WS: Lappeenranta, Finland, 2019; Volume 2382. [Google Scholar]
- Sobe, A.; Elmenreich, W. Smart Microgrids: Overview and Outlook. In Proceedings of the GI Informatik Smart Grid Workshop, Braunschweig, Germany, 16–21 September 2012. [Google Scholar]
- Meeuw, A.; Schopfer, S.; Ryder, B.; Wortmann, F. LokalPower: Enabling Local Energy Markets with User-Driven Engagement. In Extended Abstracts of the 2018 CHI Conference on Human Factors in Computing Systems; Association for Computing Machinery: Montreal QC, Canada, 2018; pp. 1–6. [Google Scholar] [CrossRef]
- Scuri, S.; Tasheva, G.; Barros, L.; Nunes, N.J. An HCI Perspective on Distributed Ledger Technologies for Peer-to-Peer Energy Trading. In Human-Computer Interaction—INTERACT 2019; Lamas, D., Loizides, F., Nacke, L., Petrie, H., Winckler, M., Zaphiris, P., Eds.; Lecture Notes in Computer Science; Springer: Cham, Switzerland, 2019; pp. 91–111. [Google Scholar] [CrossRef]
- Scuri, S.; Nunes, N.J. PowerShare 2.0: A Gamified P2P Energy Trading Platform. In Proceedings of the International Conference on Advanced Visual Interfaces, Lacco Ameno d’Ischia, Italy, 28 September–2 October 2020; Association for Computing Machinery: New York, NY, USA, 2020; pp. 1–3. [Google Scholar] [CrossRef]
- Ableitner, L.; Tiefenbeck, V.; Meeuw, A.; Wörner, A.; Fleisch, E.; Wortmann, F. User behavior in a real-world peer-to-peer electricity market. Appl. Energy 2020, 270, 115061. [Google Scholar] [CrossRef]
- Clement, J.; Ploennigs, J.; Kabitzsch, K. Smart Meter: Detect and Individualize ADLs. In Ambient Assisted Living; Springer: Berlin/Heidelberg, Germany, 2012; pp. 107–122. [Google Scholar] [CrossRef]
- Chalmers, C.; Fergus, P.; Curbelo Montanez, C.A.; Sikdar, S.; Ball, F.; Kendall, B. Detecting Activities of Daily Living and Routine Behaviours in Dementia Patients Living Alone Using Smart Meter Load Disaggregation. IEEE Trans. Emerg. Top. Comput. 2020. [Google Scholar] [CrossRef]
- Bousbiat, H.; Klemenjak, C.; Leitner, G.; Elmenreich, W. Augmenting an Assisted Living Lab with Non-Intrusive Load Monitoring. In Proceedings of the 2020 IEEE International Instrumentation and Measurement Technology Conference (I2MTC), Dubrovnik, Croatia, 25–28 May 2020; pp. 1–5. [Google Scholar] [CrossRef]
- Reinhardt, A.; Klemenjak, C. Device-Free User Activity Detection using Non-Intrusive Load Monitoring: A Case Study. In Proceedings of the 2nd ACM Workshop on Device Free Human Sensing (DFHS), Yokohama, Japan, 16 November 2020; pp. 1–5. [Google Scholar]
- Liao, J.; Stankovic, L.; Stankovic, V. Detecting Household Activity Patterns from Smart Meter Data. In Proceedings of the International Conference on Intelligent Environments, Shanghai, China, 2–4 July 2014; pp. 71–78. [Google Scholar] [CrossRef]
- Jokar, P.; Arianpoo, N.; Leung, V.C.M. Electricity Theft Detection in AMI Using Customers’ Consumption Patterns. IEEE Trans. Smart Grid 2016, 7, 216–226. [Google Scholar] [CrossRef]
- Yip, S.C.; Tan, W.N.; Tan, C.; Gan, M.T.; Wong, K. An anomaly detection framework for identifying energy theft and defective meters in smart grids. Int. J. Electr. Power Energy Syst. 2018, 101, 189–203. [Google Scholar] [CrossRef]
- Liu, M.; Liu, D.; Sun, G.; Zhao, Y.; Wang, D.; Liu, F.; Fang, X.; He, Q.; Xu, D. Deep Learning Detection of Inaccurate Smart Electricity Meters: A Case Study. IEEE Ind. Electron. Mag. 2020, 14, 79–90. [Google Scholar] [CrossRef]
- Sial, A.; Singh, A.; Mahanti, A. Detecting anomalous energy consumption using contextual analysis of smart meter data. Wirel. Netw. 2019, 8. [Google Scholar] [CrossRef]
- Buzau, M.M.; Tejedor-Aguilera, J.; Cruz-Romero, P.; Gómez-Expósito, A. Detection of Non-Technical Losses Using Smart Meter Data and Supervised Learning. IEEE Trans. Smart Grid 2019, 10, 2661–2670. [Google Scholar] [CrossRef]
- Persson, M.; Lindskog, A. Detection and localization of non-technical losses in distribution systems with future smart meters. In Proceedings of the 2019 IEEE Milan PowerTech, Milan, Italy, 23–27 June 2019; pp. 1–6. [Google Scholar] [CrossRef]
- Raggi, L.M.R.; Trindade, F.C.L.; Cunha, V.C.; Freitas, W. Non-Technical Loss Identification by Using Data Analytics and Customer Smart Meters. IEEE Trans. Power Deliv. 2020, 35, 2700–2710. [Google Scholar] [CrossRef]
- Buzau, M.; Tejedor-Aguilera, J.; Cruz-Romero, P.; Gómez-Expósito, A. Hybrid Deep Neural Networks for Detection of Non-Technical Losses in Electricity Smart Meters. IEEE Trans. Power Syst. 2020, 35, 1254–1263. [Google Scholar] [CrossRef]
- International Renewable Energy Agency. Demand-Side Flexibility for Power Sector Transformation—Analytical Brief; Technical Report; IRENA: Abu Dhabi, UAE, 2019; ISBN 978-92-9260-159-1. [Google Scholar]
- Shoreh, M.H.; Siano, P.; Shafie-khah, M.; Loia, V.; Catalão, J.P.S. A survey of industrial applications of Demand Response. Electr. Power Syst. Res. 2016, 141, 31–49. [Google Scholar] [CrossRef]
- Bilton, M.; Aunedi, M.; Woolf, M.; Strbac, G. Smart Appliances for Residential Demand Response; Technical Report A10 for the “Low Carbon London” LCNF Project; Imperial College London: London, UK, 2014. [Google Scholar]
- Neupane, B.; Pedersen, T.B.; Thiesson, B. Towards Flexibility Detection in Device-Level Energy Consumption. In Data Analytics for Renewable Energy Integration; Number 8817 in Lecture Notes in Computer Science; Springer: Berlin/Heidelberg, Germany, 2014; pp. 1–16. [Google Scholar]
- D’hulst, R.; Labeeuw, W.; Beusen, B.; Claessens, S.; Deconinck, G.; Vanthournout, K. Demand response flexibility and flexibility potential of residential smart appliances: Experiences from large pilot test in Belgium. Appl. Energy 2015, 155, 79–90. [Google Scholar] [CrossRef]
- Afzalan, M.; Jazizadeh, F. Residential loads flexibility potential for demand response using energy consumption patterns and user segments. Appl. Energy 2019, 254, 113693. [Google Scholar] [CrossRef]
- Pecan Street Inc. Dataport—Researcher Access to Pecan Street’s Groundbreaking Energy and Water Data. 2020. Available online: https://www.pecanstreet.org/dataport/ (accessed on 21 January 2021).
- Mesarić, P.; Krajcar, S. Home demand side management integrated with electric vehicles and renewable energy sources. Energy Build. 2015, 108, 1–9. [Google Scholar] [CrossRef]
- Li, P.H.; Pye, S. Assessing the benefits of demand-side flexibility in residential and transport sectors from an integrated energy systems perspective. Appl. Energy 2018, 228, 965–979. [Google Scholar] [CrossRef]
- Fanitabasi, F.; Pournaras, E. Appliance-Level Flexible Scheduling for Socio-Technical Smart Grid Optimization. IEEE Access 2020, 8, 119880–119898. [Google Scholar] [CrossRef]
- Ciabattoni, L.; Comodi, G.; Ferracuti, F.; Foresi, G. AI-Powered Home Electrical Appliances as Enabler of Demand-Side Flexibility. IEEE Consum. Electron. Mag. 2020, 9, 72–78. [Google Scholar] [CrossRef]
- Lucas, A.; Jansen, L.; Andreadou, N.; Kotsakis, E.; Masera, M. Load Flexibility Forecast for DR Using Non-Intrusive Load Monitoring in the Residential Sector. Energies 2019, 12, 2725. [Google Scholar] [CrossRef]
- Zhai, S.; Zhou, H.; Wang, Z.; He, G. Analysis of dynamic appliance flexibility considering user behavior via non-intrusive load monitoring and deep user modeling. CSEE J. Power Energy Syst. 2020, 6, 41–51. [Google Scholar] [CrossRef]
- Yue, H.; Yan, K.; Zhao, J.; Ren, Y.; Yan, X.; Zhao, H. Estimating Demand Response Flexibility of Smart Home Appliances via NILM Algorithm. In Proceedings of the 2020 IEEE 4th Information Technology, Networking, Electronic and Automation Control Conference (ITNEC), Chongqing, China, 12–14 June 2020; Volume 1, pp. 394–398. [Google Scholar] [CrossRef]
- Gajowniczek, K.; Ząbkowski, T. Electricity forecasting on the individual household level enhanced based on activity patterns. PLoS ONE 2017, 12, e0174098. [Google Scholar] [CrossRef]
- Pirbazari, A.M.; Farmanbar, M.; Chakravorty, A.; Rong, C. Short-Term Load Forecasting Using Smart Meter Data: A Generalization Analysis. Processes 2020, 8, 484. [Google Scholar] [CrossRef]
- Amin, P.; Cherkasova, L.; Aitken, R.; Kache, V. Automating Energy Demand Modeling and Forecasting Using Smart Meter Data. In Proceedings of the 2019 IEEE International Congress on Internet of Things (ICIOT), Milan, Italy, 8–13 July 2019; pp. 133–137. [Google Scholar] [CrossRef]
- Dinesh, C.; Makonin, S.; Bajic, I.V. Residential Power Forecasting Based on Affinity Aggregation Spectral Clustering. IEEE Access 2020, 8, 99431–99444. [Google Scholar] [CrossRef]
- Hashmi, M.U.; Mukhopadhyay, A.; Bušić, A.; Elias, J. Optimal control of storage under time varying electricity prices. In Proceedings of the 2017 IEEE International Conference on Smart Grid Communications (SmartGridComm), Dresden, Germany, 23–26 October 2017; pp. 134–140. [Google Scholar] [CrossRef]
- Hashmi, M.U.; Pereira, L.; Bušić, A. Energy storage in Madeira, Portugal: Co-optimizing for arbitrage, self-sufficiency, peak shaving and energy backup. In IEEE Milan PowerTech; IEEE: Milan, Italy, 2019; pp. 1–6. [Google Scholar]
- Kiedanski, D.; Hashmi, M.U.; Bušić, A.; Kofman, D. Sensitivity to Forecast Errors in Energy Storage Arbitrage for Residential Consumers. In Proceedings of the 2019 IEEE International Conference on Communications, Control, and Computing Technologies for Smart Grids (SmartGridComm), Beijing, China, 21–23 October 2019; pp. 1–7. [Google Scholar] [CrossRef]
- Xydas, E.S.; Marmaras, C.E.; Cipcigan, L.M.; Hassan, A.S.; Jenkins, N. Forecasting Electric Vehicle charging demand using Support Vector Machines. In Proceedings of the 2013 48th International Universities’ Power Engineering Conference (UPEC), Dublin, Ireland, 2–5 September 2013; pp. 1–6. [Google Scholar] [CrossRef]
- Ai, S.; Chakravorty, A.; Rong, C. Household EV Charging Demand Prediction Using Machine and Ensemble Learning. In Proceedings of the 2018 IEEE International Conference on Energy Internet (ICEI), Beijing, China, 21–25 May 2018; pp. 163–168. [Google Scholar] [CrossRef]
- Fachrizal, R.; Munkhammar, J. Improved Photovoltaic Self-Consumption in Residential Buildings with Distributed and Centralized Smart Charging of Electric Vehicles. Energies 2020, 13, 1153. [Google Scholar] [CrossRef]
- Vassileva, I.; Campillo, J. Adoption barriers for electric vehicles: Experiences from early adopters in Sweden. Energy 2017, 120, 632–641. [Google Scholar] [CrossRef]
- Svangren, M.K.; Jensen, R.H.; Skov, M.B.; Kjeldskov, J. Driving on sunshine: Aligning electric vehicle charging and household electricity production. In Proceedings of the 10th Nordic Conference on Human-Computer Interaction, Oslo, Norway, 1–3 October 2018; Association for Computing Machinery: New York, NY, USA, 2018; pp. 439–451. [Google Scholar] [CrossRef]
- Barros, L.; Barreto, M.; Pereira, L. Understanding the challenges behind Electric Vehicle usage by drivers—A case study in the Madeira Autonomous Region. In Proceedings of the 7th International Conference on ICT for Sustainability, Bristol, UK, 21–27 June 2020; Association for Computing Machinery: New York, NY, USA, 2020; pp. 88–97. [Google Scholar] [CrossRef]
- Vasudevarao, B.V.M.; Stifter, M.; Zehetbauer, P. Methodology for creating composite standard load profiles based on real load profile analysis. In Proceedings of the IEEE PES Innovative Smart Grid Technologies Conference Europe (ISGT-Europe), Ljubljana, Slovenia, 9–12 October 2016; pp. 1–6. [Google Scholar]
- Marlen, A.; Maxim, A.; Ukaegbu, I.A.; Kumar Nunna, H.S.V.S. Application of Big Data in Smart Grids: Energy Analytics. In Proceedings of the 2019 21st International Conference on Advanced Communication Technology (ICACT), PyeongChang, Korea, 17–20 February 2019; pp. 402–407. [Google Scholar] [CrossRef]
- Røsok, J.M. Combining smart energy meters with social media: Increasing energy awareness using data visualization and persuasive technologies. In Proceedings of the 2014 International Conference on Collaboration Technologies and Systems (CTS), Minneapolis, MN, USA, 19–23 May 2014; pp. 27–32. [Google Scholar] [CrossRef]
- Toma, A.R.; Gheorghe, C.M.; Neacşu, F.L.; Dumitrescu, A. Conversion of smart meter data in user-intuitive carbon footprint information. In Proceedings of the 2017 5th International Symposium on Electrical and Electronics Engineering (ISEEE), Galati, Romania, 20–22 October 2017; pp. 1–6. [Google Scholar] [CrossRef]
- Park, K.; Son, S. A Novel Load Image Profile-Based Electricity Load Clustering Methodology. IEEE Access 2019, 7, 59048–59058. [Google Scholar] [CrossRef]
- Lee, E.; Kim, J.; Jang, D. Load profile segmentation for effective residential demand response program: Method and evidence from Korean pilot study. Energies 2020, 16, 1348. [Google Scholar] [CrossRef]
- Zhan, S.; Liu, Z.; Chong, A.; Yan, D. Building categorization revisited: A clustering-based approach to using smart meter data for building energy benchmarking. Appl. Energy 2020, 269, 114920. [Google Scholar] [CrossRef]
- Choksi, K.A.; Jain, S.; Pindoriya, N.M. Feature based clustering technique for investigation of domestic load profiles and probabilistic variation assessment: Smart meter dataset. Sustain. Energy Grids Netw. 2020, 22, 100346. [Google Scholar] [CrossRef]
- Alonso, A.M.; Nogales, F.J.; Ruiz, C. Hierarchical Clustering for Smart Meter Electricity Loads Based on Quantile Autocovariances. IEEE Trans. Smart Grid 2020, 11, 4522–4530. [Google Scholar] [CrossRef]
- Varga, E.D.; Beretka, S.F.; Noce, C.; Sapienza, G. Robust Real-Time Load Profile Encoding and Classification Framework for Efficient Power Systems Operation. IEEE Trans. Power Syst. 2015, 30, 1897–1904. [Google Scholar] [CrossRef]
- Ullah, A.; Haydarov, K.; Haq, I.U.; Muhammad, K.; Rho, S.; Lee, M.; Baik, S.W. Deep Learning Assisted Buildings Energy Consumption Profiling Using Smart Meter Data. Sensors 2020, 20, 873. [Google Scholar] [CrossRef]
- Sun, M.; Wang, Y.; Teng, F.; Ye, Y.; Strbac, G.; Kang, C. Clustering-Based Residential Baseline Estimation: A Probabilistic Perspective. IEEE Trans. Smart Grid 2019, 10, 6014–6028. [Google Scholar] [CrossRef]
- Haben, S.; Singleton, C.; Grindrod, P. Analysis and Clustering of Residential Customers Energy Behavioral Demand Using Smart Meter Data. IEEE Trans. Smart Grid 2016, 7, 136–144. [Google Scholar] [CrossRef]
- Sun, M.; Konstantelos, I.; Strbac, G. C-Vine Copula Mixture Model for Clustering of Residential Electrical Load Pattern Data. IEEE Trans. Power Syst. 2017, 32, 2382–2393. [Google Scholar] [CrossRef]
- Hurst, W.; Montañez, C.A.C.; Shone, N. Time-Pattern Profiling from Smart Meter Data to Detect Outliers in Energy Consumption. IoT 2020, 1, 92–108. [Google Scholar] [CrossRef]
- Donaldson, D.L.; Jayaweera, D. Effective solar prosumer identification using net smart meter data. Int. J. Electr. Power Energy Syst. 2020, 118, 105823. [Google Scholar] [CrossRef]
- Berges, M.E.; Goldman, E.; Matthews, H.S.; Soibelman, L. Enhancing Electricity Audits in Residential Buildings with Nonintrusive Load Monitoring. J. Ind. Ecol. 2010, 14, 844–858. [Google Scholar] [CrossRef]
- Çimen, H.; Çetinkaya, N.; Vasquez, J.C.; Guerrero, J.M. A Microgrid Energy Management System based on Non-Intrusive Load Monitoring via Multitask Learning. IEEE Trans. Smart Grid 2020. [Google Scholar] [CrossRef]
- Uihlein, A.; Caramizaru, A. Energy Communities: An Overview of Energy and Social Innovation; Technical Report EUR 30083 EN; Publications Office of the European Union: Luxembourg, 2020. [Google Scholar]
- IEC. Sensing Devices for Non-Intrusive Load Monitoring (NILM) Systems; Norm DIN IEC/TS 63297; International Electrotechnical Commission: Geneva, Switzerland, 2020. [Google Scholar]
- Hart, G.W. Prototype Nonintrusive Appliance Load Monitor; Technical Report; MIT Energy Laboratory and Electric Power Research Institute: Cambridge, MA, USA, 1985. [Google Scholar]
- Reinhardt, A.; Klemenjak, C. How does load disaggregation performance depend on data characteristics? Insights from a benchmarking study. In Proceedings of the Eleventh ACM International Conference on Future Energy Systems, Melbourne, Australia, 22–26 June 2020; pp. 167–177. [Google Scholar]
- European Union. Regulation (EU) 2016/679 of the European Parliament and of the Council of 27 April 2016 on the protection of natural persons with regard to the processing of personal data and on the free movement of such data, and repealing Directive 95/46/EC (General Data Protection Regulation). Off. J. L110 2016, 59, 1–88. [Google Scholar]
- Egarter, D.; Prokop, C.; Elmenreich, W. Load hiding of household’s power demand. In Proceedings of the IEEE International Conference on Smart Grid Communications (SmartGridComm), Venice, Italy, 3–6 November 2014; pp. 854–859. [Google Scholar]
- Reinhardt, A.; Konstantinou, G.; Egarter, D.; Christin, D. Worried About Privacy? Let Your PV Converter Cover Your Electricity Consumption Fingerprints. In Proceedings of the IEEE International Conference on Smart Grid Communications (SmartGridComm) Symposium on Cyber Security and Privacy, Miami, FL, USA, 2–5 November 2015; pp. 25–30. [Google Scholar]
- Okta. The Cost of Privacy: Reporting on the State of Digital Identity in 2020. Available online: https://www.okta.com/cost-of-privacy-report/2020/ (accessed on 28 December 2020).
- Jacobsen, R.; Torring, N.; Danielsen, B.; Hansen, M.; Pedersen, E. Towards an app platform for data concentrators. In Proceedings of the IEEE PES Innovative Smart Grid Technologies Conference, ISGT 2014, Washington, DC, USA, 19–22 February 2014; pp. 1–5. [Google Scholar]


| Dataset | Smart Meter Model | Captured Parameters | Sampling Rate | Interface |
|---|---|---|---|---|
| Dataport [17] | EG3000 + EG201X | 1 Hz | Modbus | |
| iAWE [18] | EM6400 | 1 Hz | Modbus | |
| AMPds [19] | Powerscout18 | Hz | Modbus | |
| RAE [20] | Powerscout24 | 1 Hz | Modbus | |
| ECO [21] | E750 | 1 Hz | ||
| REDD [22] | custom design | 16.5 kHz | USB | |
| SustDataED [23] | custom design | 12.8 kHz | USB | |
| BLOND [24] | custom design | 250 kHz | TCP |
| Dataset | # Events | Timespan | Source of Event Count |
|---|---|---|---|
| UK-DALE [42] | 5440 | 7 days | Pereira and Nunes [43] |
| REDD [22] | 1944 | 8 days | Völker et al. [44] |
| REDD [22] | 1258 | 7 days | Pereira and Nunes [45] |
| BLUED [46] | 2335 | 8 days | Anderson et al. [46] |
| FIRED [47] | 4379 | 14 days | Völker et al. [47] |
| BLOND-50 [24] | 3310 | 30 days | Kahl et al. [48] |
| AMPds [19] | 651 | 7 days | Pereira and Nunes [45] |
| SustDataED [23] | 2196 | 11 days | Pereira et al. [49] |
Publisher’s Note: MDPI stays neutral with regard to jurisdictional claims in published maps and institutional affiliations. |
© 2021 by the authors. Licensee MDPI, Basel, Switzerland. This article is an open access article distributed under the terms and conditions of the Creative Commons Attribution (CC BY) license (http://creativecommons.org/licenses/by/4.0/).
Share and Cite
Völker, B.; Reinhardt, A.; Faustine, A.; Pereira, L. Watt’s up at Home? Smart Meter Data Analytics from a Consumer-Centric Perspective. Energies 2021, 14, 719. https://doi.org/10.3390/en14030719
Völker B, Reinhardt A, Faustine A, Pereira L. Watt’s up at Home? Smart Meter Data Analytics from a Consumer-Centric Perspective. Energies. 2021; 14(3):719. https://doi.org/10.3390/en14030719
Chicago/Turabian StyleVölker, Benjamin, Andreas Reinhardt, Anthony Faustine, and Lucas Pereira. 2021. "Watt’s up at Home? Smart Meter Data Analytics from a Consumer-Centric Perspective" Energies 14, no. 3: 719. https://doi.org/10.3390/en14030719
APA StyleVölker, B., Reinhardt, A., Faustine, A., & Pereira, L. (2021). Watt’s up at Home? Smart Meter Data Analytics from a Consumer-Centric Perspective. Energies, 14(3), 719. https://doi.org/10.3390/en14030719