Article

Implications of Nonlinear Material Parameters on the Dielectric Loss under Harmonic Distorted Voltages

1
Chair of High Voltage and High Current Engineering, Faculty of Electrical and Computer Engineering, Institute of Electrical Power Systems and High Voltage Engineering (IEEH), Technische Universität Dresden, 01069 Dresden, Germany
2
Department of High Voltage Engineering/Materials/Electromagnetic Theory, Faculty of Electrical Engineering and Informatics, University of Applied Sciences Zittau/Görlitz, 02763 Zittau, Germany
*
Author to whom correspondence should be addressed.
These authors contributed equally to this work.
Energies 2021, 14(3), 663; https://doi.org/10.3390/en14030663
Submission received: 18 December 2020 / Revised: 21 January 2021 / Accepted: 23 January 2021 / Published: 28 January 2021
(This article belongs to the Section F: Electrical Engineering)

Abstract

:
The increasing number of power electronic devices in electrical grids may lead to harmonic distorted voltages, which are considered to be possible causes of component failures. In this study, the dielectric losses of epoxy polymer and functionally filled silicone rubber (f-SiR) samples are investigated under harmonic distorted voltages in terms of their dielectric losses and the consequent heat source density within the material. The results suggest that the epoxy polymer samples behave linearly to the electric field strength and therefore allow good predictability of the dielectric losses. The investigated f-SiR samples exhibit a nonlinear behaviour when an electric field threshold is exceeded. The subsequent direct loss measurements under harmonic distorted voltage reveal a sharp rise of the dielectric loss with increasing electrical field strength. This leads to a higher risk of excessive heat in the material when harmonics are present. In conclusion, the investigation highlights the difficulties of estimating dielectric losses in nonlinear dielectric materials when distorted voltages are present.

Graphical Abstract

1. Introduction

The increasing number of inverters and power electronic converters in medium-voltage (MV) grids can lead to the distortion of voltage waveforms [1,2,3]. The consequences of the voltage distortion may include additional dielectric heating [4,5] and altered partial discharge patterns or parameters [6,7]. As a result, degradation and ageing of insulation are stronger when medium-frequency components of the voltage are present [8,9]. A well-investigated and frequently-cited example is the Eagle Pass back-to-back tie, where cable terminations with stress grading failed because the stressing voltage contained high frequency components [10]. The subsequent analysis showed that several kV of voltage of frequencies between 180 Hz (third harmonic of a 60 Hz fundamental frequency) and 12.4 kHz (207th harmonic) were present and caused significant additional dielectric losses in the stress grading layer, which ultimately led to the failure [10]. While the low order harmonics dominated with regard to the amplitude, the higher order harmonics caused more dielectric losses [10]. The Eagle Pass example, although already several years in the past, demonstrates that power electronic devices introduce new challenges to the design of insulation and the requirements of insulation materials. It is not an isolated case as a recent review of MV cable termination failures showed [1].
Dielectric loss describes energy loss, mainly in the form of dissipated heat in a material, due to conduction and polarisation phenomena in a time-varying electric field [11]. The dissipated heat can cause dielectric heating, leading to accelerated ageing of the material and consequently to failure of the power system. The additional dielectric losses of materials under the influence of harmonics and temperature have been calculated, simulated and measured before [4,5,12,13]. The dielectric properties of the insulation material have to be measured across a several kHz-wide frequency spectrum in order to account for the high order harmonics of the semiconductor switching technology. The corresponding measurement methods rely on low voltage broadband measurements below 200 V, which in turn require very thin material samples in order to achieve sufficient measurement accuracy. To calculate the dielectric loss under distorted voltage waveforms, the underlying assumption is that the material’s losses respond linearly to the stressing electrical field strength. While this is true for many materials, e.g., polyvinyl chloride [14] or unfilled silicone rubber (SiR) [15], composites consisting of functional fillers typically do not exhibit linear material properties.
For nonlinear materials, there is still a lack of research on the influence of harmonic distorted voltages. Therefore, this paper presents investigations of the dielectric losses of two different materials, a conventional epoxy resin and a functionally filled silicone rubber (f-SiR), when harmonic distortions are present in the voltage. Epoxy resin is a typical dry-type insulation material for medium-voltage equipment such as transformers or generators. The assumption is that the dielectric properties of epoxy are principally independent of the electric field strength, hence allowing good predictability of the dielectric losses even under distorted voltages. The f-SiR is filled with ferroelectric particles and is used as a nonlinear refractive field grading material in, e.g., cable joints and terminations. Unlike epoxy, the dielectric properties and losses of field grading materials are strongly dependent on the electric field strength.
The fundamental causes of dielectric losses in materials are reviewed in Section 2. Section 3 describes dielectric losses in materials when harmonics are present. The major influencing factors on the dielectric losses are put into context. The test setup, samples and methods are outlined in Section 4. Finally, the measurement results of the heat source density Q d within the materials are presented in relation to the harmonic order, field strength and the level of distortion in Section 5. Temperature as an influence is exempted in this contribution.

2. Dielectric Properties

The major influence factors on the dielectric properties, such as the complex permittivity, are the frequency of the stressing voltage and the temperature of the material. For polymeric insulation materials such as epoxy-, silicone-, polypropylene- and polyethylene-based compounds, the independence of their dielectric properties from the operational electrical field strength is assumed [14,15]. The addition of functional fillers results in the purposely nonlinear dielectric parameters of field grading materials. In this section, the fundamental causes for dielectric losses—conductivity and polarisation—are revisited with the emphasis on their electric field strength dependency.

2.1. Conductivity

Generally, electrical conduction is caused by charge carriers that “enter and escape” from the material due to the applied electric field [16]. At low electric field strengths, the migration of ionic charge carriers dominantly contributes to the conduction in solid dielectrics [14,17]. Such extrinsic charge carriers originate in impurities [18], water and other degradation and dissociation products [13,17]. Ionic conduction increases with the applied field strength [17,19]. The increase can be explained by the potential-energy well model of ionic conduction, which states that the number and velocity of ionic charges increase with the electric field strength [19]. At high electric field strengths, electrons contribute to the conduction by generation (Poole–Frenkel and Fowler–Nordheim mechanisms) and their stepwise drift in the electric field (hopping mechanism) [14,20]. For polymers, additional changes of the electrical properties occur around the glass transition temperature T g [13,17]. Above the glass transition temperature T g , the ionic mobility increases significantly and thus results in a higher conductivity [17]. The temperature, electric field strength, atmospheric humidity and water content of the sample can influence the conductivity. Therefore, it cannot be seen as a material constant [14].
The conductivity is usually measured at a DC voltage. The DC conductivity σDC of conventional polymeric insulators such as epoxy resin or unfilled SiR is assumed to be very low and hence contributes subordinately to the entire dielectric losses [5,21]. In certain high voltage applications, however, insulation materials with electrical field dependent conductivity are required, e.g., as resistive field grading materials in cable accessories to enable electrical field control [22,23,24]. Resistive field grading can be achieved by adding functional fillers, e.g., semiconductors like silicone carbide (SiC), where the field dependent conductivity allows a uniform field distribution to avoid a localised field stress enhancement. Such nonlinear composite materials typically result in a non-sinusoidal current in relation to the applied sinusoidal voltage [22].

2.2. Polarisation

As opposed to conduction (Section 2.1), an external electric field induces electric dipoles due to charge displacement—electronic and ionic polarisation—or cause the orientation of pre-existing permanent dipoles in the direction of the electric field—orientational polarisation [11,19]. Additionally, in inhomogeneous materials such as composites consisting of insulating material and fillers with different permittivity and conductivity, interfacial polarisation can occur due to the congestion of charges at the macro- and micro-scopic interface [16,25].
To describe polarisation, the complex relative permittivity ε r * is applied:
ε r * = ε r j ε r ,
in which the real part ε r describes the polarisability of the material and is equivalent to the relative permittivity ε r . The imaginary part ε r quantifies the total loss due to polarisation and conduction processes [11]. The complex relative permittivity is highly frequency and temperature dependent. As frequency increases, the ability of the dipoles to align themselves in the direction of the electric field decreases, resulting in a reduced real permittivity ε r and consequently in the transition of one polarisation mechanism to another [15].
Under an applied AC voltage, the induction, as well as the orientation of (permanent) dipoles can fully take place even at very low field strengths [12,16]. The corresponding polarisability, in terms of the real relative permittivity ε r , is at its maximum and does not increase further with enhanced field strengths [26]. In a material where orientational polarisation predominantly occurs, the real relative permittivity ε r is typically field independent [15]. Kremer and Schönhals specified that most materials have a linear response at field strengths below 1 kV mm−1 [25]. This was confirmed experimentally by [12,14], where the tested polymeric materials behaved linearly at field strengths up to 1.5 kV mm−1.
This is however not the case for composites with functional filling, which exhibit a strong field dependency due to interfacial polarisation. A higher field strength can provoke the release of charge carriers from their traps, subsequently affecting the permittivity [26]. The charge transport within the material also leads to additional dielectric losses. The electric field dependent permittivity is utilized in refractive field grading materials, e.g., in cable terminations. The composite of high permittivity fillers and low permittivity insulation polymer enables the refraction of the field equipotential lines at the interface between different insulation materials, e.g., from polyethylene to air [15,23,24].
In summary, since the frequency, as well as the amplitude of the applied electric field have a significant influence on the dielectric losses of insulation materials, further investigations of the dielectric losses under distorted voltage waveforms are necessary.

3. Dielectric Losses under Distorted Voltage Waveforms

The methods to measure the dielectric losses require revisiting, since the nonlinear dielectric properties challenge the current approaches of loss quantification. A harmonic distorted voltage consists of the dominant grid frequency voltage with a high amplitude and one or more higher frequency components with lower amplitudes, as shown in Figure 1. Distorted voltage waveforms are usually quantified by the total harmonic distortion (THD):
THD = n = 2 U n 2 U 1 ,
with U n being the RMS voltage of each frequency component n above the fundamental frequency and U 1 being the RMS voltage of the fundamental frequency. Based on the RMS voltage U of the entire waveform:
U = n = 1 U n 2 ,
the fundamental frequency RMS voltage U 1 can be calculated with the THD:
U 1 = U 1 + THD 2 .
The harmonic RMS voltage U H then equals:
U H = U 1 · THD
when two frequency components one and H are superimposed [27].
In the case of homogeneous field conditions, the distorted voltage across a specimen with thickness d results in the electric field strength:
E RMS = U d .
The general calculation principle of the dielectric loss under distorted voltage waveforms as used in [4,5,12] is based on the spectral decomposition of the voltage waveforms via Fourier transformation into the respective sinusoidal components. Equation (7) rests on the hypotheses that the dielectric properties described by the imaginary relative permittivity ε r , n are independent of the electric field strength E n , RMS .
P δ = V ( n = 1 ε 0 ε r , n ( 2 π n f s ) E n , RMS 2 ) d V ,
f s is the grid frequency, and n is the harmonic order [12]. If the volume of the stressed specimen is known and the electrical field is homogeneous, Equation (7) can be simplified to:
P δ = n = 1 E n , RMS 2 ( 2 π n f s ) ε r , n C 0 d 2
with C 0 being the geometric capacitance of the specimen. In the case of harmonic distorted voltages, E n has a fundamental component with the magnitude E 1 and (several) higher frequency components with THD · E 1 . Hence, the equation may be simplified to:
P δ = P δ , 1 + P δ , n
P δ = E 1 , RMS 2 ( 2 π f s ) ε r , 1 C 0 d 2 + n = 3 ( THD · E 1 , RMS ) 2 ( 2 π n f s ) ε r , n C 0 d 2
P δ = E 1 , RMS 2 C 0 d 2 ( 2 π f s ) ( ε r , 1 + n = 3 THD 2 n ε r , n )
To obtain results independent of the sample’s geometry, the results are depicted in terms of the heat source density Q d [14]:
Q d = P δ V .
V is the effective volume of the insulation material that is subjected to the homogeneous electric field stress.
The influence factors on the dielectric losses according to Equation (11) are the stressing electric field strength E n , RMS , the total harmonic distortion (THD), the harmonic order n and the imaginary relative permittivity ε r . Figure 2 shows the heat source density as a function of the influence factors and serves as a theoretical example of the quadratic influence of electric field strength and THD, as well as the linear influence of the harmonic order.
Based on the analysis of the material properties such as the DC conductivity (Section 2.1) and the complex relative permittivity ε r * (Section 2.2), as well as their possibly nonlinear impact on the dielectric losses, the question arises if the materials behave as expected and to what extent the electric field strength affects the measured dielectric losses under distorted voltages.

4. Methods

The measurements of the DC conductivity σDC, as well as the complex permittivity ε r and ε r as a function of the electric field strength and frequency provide information about the linearity of the investigated materials, epoxy polymer and f-SiR. Eventually, the quantification of the heat source density Q d in W m−3 within the dielectric material under harmonic distorted voltages is the centrepiece of the measurements. Section 4.1 presents the test samples. Then, Section 4.2 specifies the parameters and steps necessary to calculate the DC conductivity σDC, real relative permittivity ε r , imaginary relative permittivity ε r and heat source density Q d . Finally, Section 4.3 explains the required measurement technology.

4.1. Samples

Three samples of an epoxy polymer and a refractive field grading silicone rubber (f-SiR) are utilized in this study (Table 1). The two-component cast resin is based on bisphenol A epoxy cured with monocarboxylic acid anhydrides. The cast resin is filled with 67% quartz flour. Typically, the resin exhibits linear dielectric properties. Two different sample thicknesses are utilized due to the technical limitations of the applied DC and AC test methods. A guard ring electrode arrangement is spray painted onto the epoxy’s surface according to [28] to compensate for the surface roughness of the brittle specimens. The epoxy polymer specimens are stored at room conditions of (23 … 25) °C and (40 … 60)% humidity.
The f-SiR samples have a functional filling resulting in nonlinear refractive material properties. To remove moisture absorbed during production, the f-SiR samples are preliminarily heated in an oven at 90 °C for 96 h. Afterwards, the specimens are conditioned at room temperature (around 24 °C) for 24 h.

4.2. Procedure

4.2.1. DC Conductivity

The utilized Keithley 6517B Electrometer with an integrated stabilized voltage source up to 1 kV measures the DC currents as low as 20 pA with an accuracy of below 1%. The measurements were carried out using a guard ring electrode arrangement according to [28]. Under an applied DC voltage UDC, the conductivity σDC can be determined by measuring the current I flowing through the specimen with an effective area A and thickness d:
σ DC = I · d U DC A .
The impact of the DC conductivity on the dielectric losses can be calculated via:
Q d DC = σ DC E 2 .
The DC conductivity of three epoxy samples is measured at 1 kV mm−1. Meanwhile, investigations on one f-SiR sample are conducted at electric field strengths between (0.25 … 1) kV mm−1.

4.2.2. AC Dielectric Properties

The real and imaginary parts of the complex permittivity, ε r and ε r , of the samples are determined under a pure sinusoidal AC voltage of variable frequency f. The measured quantities are the voltage u and current i, each recorded for one second. Together with the period T = f 1 of the voltage, the active power P can be calculated:
P = 1 T t = 0 T u · i d t .
The apparent power:
S = U · I ,
where U and I are the RMS voltage and current, respectively, is required to calculate the reactive power Q:
Q = S 2 P 2 .
Then, the loss tangent tan δ is computed:
tan δ = P Q .
Finally, both the real ( ε r ) and imaginary ( ε r ) parts of the complex relative permittivity ε r * can be obtained:
ε r = C C 0 = Q 2 π f U 2 C 0 ,
ε r = ε r tan δ ,
where C 0 is the geometric capacity of the specimen.

4.2.3. Dielectric Loss under Harmonic Distorted Voltages

For these investigations, three epoxy and f-SiR samples are stressed by a dominant 50 Hz and one superimposed harmonic voltage. At various values of electric field strength E, harmonic order n and total harmonic distortion (THD), the total dielectric loss P δ of the specimens is calculated based on the measured voltage and current as described in Equation (15). For such calculations, the period length T of the dominant 50 Hz voltage is applied. With the values of the total dielectric loss P δ known, the heat source density Q d can then be determined using Equation (12).

4.3. Setup

The harmonic distorted voltages required in order to directly measure the losses of the samples are generated by an arbitrary waveform generator (AWG), amplified and passed on to the primary winding of a high voltage transformer (HVT) (Figure 3). Considering that a typical iron core HVT does not exhibit a linear transformer ratio across the investigated frequency spectrum, a control algorithm is created to adjust the voltage signal before each measurement. The discrepancy from the targeted distorted voltage waveform is below 0.5% of the magnitude of each frequency component. The 39th harmonic (1950 Hz) is the highest frequency component that is superimposed with the fundamental frequency (50 Hz). The phase- and amplitude-sensitive measurement of the voltage for the control feedback loop and the dielectric loss computation is carried out with a gas filled capacitive voltage divider C G and C M . A 1 k Ω coaxial shunt R S is utilized to measure the current through the sample DUT or through the reference capacitor C R . All measurement connections within the setup are shielded in order to reduce superimposed noise on the low measurement signals. A 16 bit 2 MS/s National Instruments USB-6366 data acquisition system (DAQ) digitizes the signals and serves as a controllable AWG. All measurements and waveform generations are controlled via the National Instruments’ DAQmx interface. The measurements of both epoxy and f-SiR samples are carried out on two separate setups that are principally equal [27,29].
The disc shaped specimens of both materials are measured in a plate-plate guard ring electrode arrangement in order to achieve a homogeneous field. All measurements are carried out in oil filled test vessels to avoid partial discharges at the electrode’s edges due to the high voltages. The samples are only temporarily inserted into the oil filled test vessel.
In order to obtain adequate measurement accuracy, a reference measurement method as proposed by [30,31] was used. Originally used for purely sinusoidal voltages, the method was adapted for harmonic distorted voltages in this study. At first, the lossless gas capacitor C R is measured to record the baseline system loss tangent ( tan δ ) R . The loss tangent is utilized for the correction since it is a dimensionless quantity and therefore independent of the capacity of C R or the DUT (Equation (18)). “The recording settings such as the vertical range of the DAQ’s measurement channels are preserved in order to avoid systematic errors. The current measurement connection is then switched to the test object (DUT) that is measured analogous to the previous reference recording” [27]. Under the assumption of identical transfer coefficients in the measuring circuit, the intrinsic error is eliminated by correcting the loss tangent (Equation (21)).
tan δ = tan ( arctan ( tan δ DUT ) arctan ( tan δ R ) )
A more detailed description of the procedure was presented in [13,27,30]. To test its eligibility, the introduced test setup was compared to a commercial loss tangent measurement system (Omicron MI600) in terms of the dielectric properties of both epoxy and f-SiR samples, measured at purely sinusoidal AC voltages. As an example, the results for epoxy samples are depicted in Figure 4. The deviation of the real relative permittivity ε r across the entire frequency spectrum ranging from 50 Hz to 850 Hz is below 3%. The results for f-SiR can be found in [29], in which the error of the measured values of the real relative permittivity ε r for (350 … 1950) Hz ranged between 2% and 4%.
An overview of the measurement parameters is given in the table below (Table 2).

5. Results

In this section, the measurements of the DC conductivity, AC dielectric properties and the heat source density under harmonic distorted voltages conducted on both epoxy polymer and f-SiR samples are presented.

5.1. DC Conductivity

A constant current in the epoxy polymer samples under DC voltage was achieved after several tens of hours and at the very lowest measurable limit of the applied electrometer. The calculated conductivity of three epoxy polymer samples was reproducibly below κ = 5 · 10 16 S m−1 at 23 °C when stressed with the highest utilisable electric field strength of 1 kV mm−1. Due to its highly insulating property and technical limitations, a field dependent conductivity of the epoxy polymer samples cannot be obtained at electric field strengths E < 1 kV mm−1. The DC conductivity accounts for a heat source density of Qd DC = 0.125 W m−3 at 5 kV mm−1 according to Equation (14).
While the conductivity of polymers such as epoxy resin around 10 16 S m−1 is very low, the conductivity of f-SiR is significantly higher at approximately 10 11 S m−1. A distinct field dependency of the f-SiR samples was obtained, where the DC conductivity increased linearly at electrical field strengths from 0.25 kV mm−1 to 1 kV mm−1 (Figure 5a). The linear increase indicates that no substantial change in the conduction mechanism (Section 2.1) occurred within the investigated range of electrical field strength. Figure 5b shows that the calculated heat source density is proportional to the square of the electric field strength (Equation (14)). The measurement of a stationary value of the DC conductivity σ DC of the f-SiR samples has proven to be very difficult, with preliminary examinations showing a change in the values even after a week. Hence, it should be noted that the depicted values of the DC conductivity σ DC and the heat source density Q d DC of f-SiR in this paper are defined as the values obtained after 24 h of measurement.

5.2. AC Dielectric Properties

Both epoxy polymer and f-SiR samples were measured at AC voltages without distortion in order to determine the baseline of the frequency and electric field dependent real ε r and imaginary relative permittivity ε r . For epoxy polymer samples, the real relative permittivity ε r at a constant electric field of 1 kV mm−1 in the narrow frequency range between (50 … 850) Hz decreases slightly (Figure 6). The imaginary relative permittivity ε r decreases more significantly with the frequency. In contrast, both parameters are independent of the electric field strength when varied from 1.25 kV mm−1 to 5 kV mm−1 at a constant frequency. The measurements confirm the hypothesis introduced in Section 2 that the epoxy polymer behaves linearly for the most part.
In comparison to the epoxy polymer samples (Figure 6) and unfilled SiR samples in [32], the investigated functionally filled f-SiR possesses a significantly higher relative permittivity due to it refractive field grading property (Figure 7).
A decrease of the real relative permittivity ε r from 17.5 to 15 is observed with increasing frequency (Figure 7a). Polarisation mechanisms such as spontaneous polarisation can occur due to the presence of ferroelectric fillers [11]. Besides that, interfacial and orientational polarisation can also occur within the tested frequency range. The former is based on the permittivity difference between the filler particles and the insulating rubber, while the latter is caused by silicone (Si)-oxygen (O) bonds forming Si-O dipoles [33]. As frequency increases, dipoles present in the polymer chain cannot instantaneously follow the field variation, leading to the decline of the real relative permittivity ε r and subsequently the imaginary permittivity ε r as well. Both real ε r and imaginary relative permittivity ε r increase with higher electric field strength (Figure 7b), contrasting the field independence of the unfilled SiR where the real relative permittivity ε r typically stays constant for field strengths up to 20 kV mm−1 [33]. The steeper slopes between 0.75 kV mm−1 and 1 kV mm−1 as compared to the lower field strengths indicate a certain threshold, where the current becomes nonlinear (non-proportional) in relation to the voltage when the field threshold is exceeded. This nonlinearity is depicted in Figure 8, which compares the voltage and current of 450 Hz, measured at two different field strengths. At 0.75 kV mm−1, the voltage and current waveforms are both sinusoidal. At 1 kV mm−1, however, in spite of the sinusoidal voltage, the current waveform exhibits a distortion around its peak. It is worth noting that the distortion only occurs in the positive half-wave and is not observed in the negative half-wave.

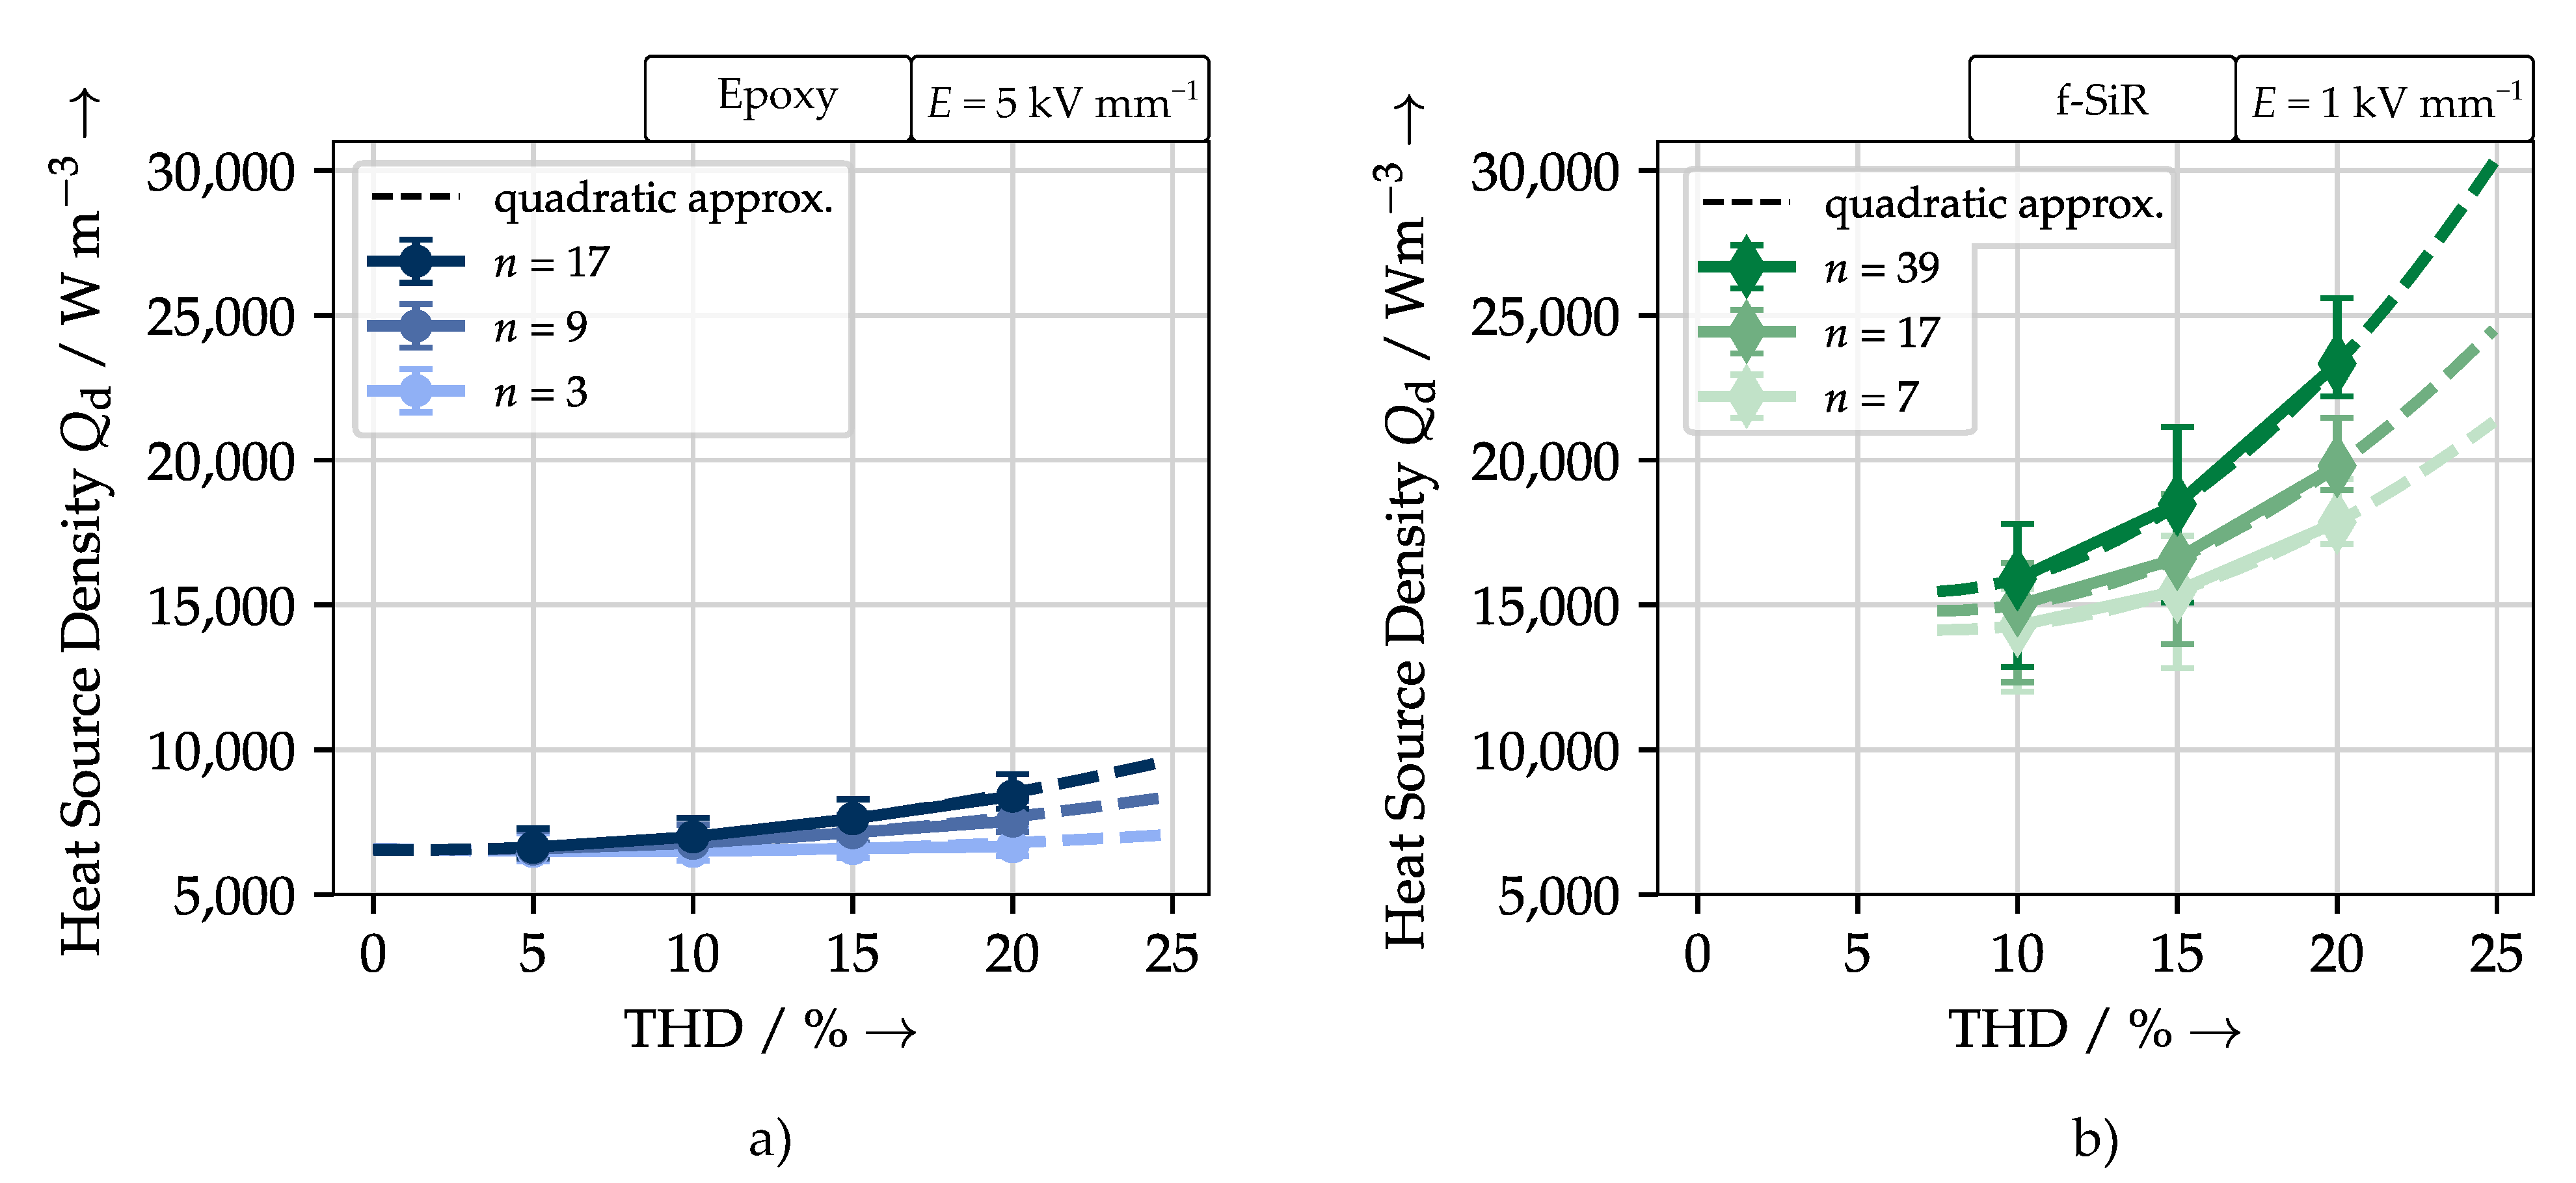
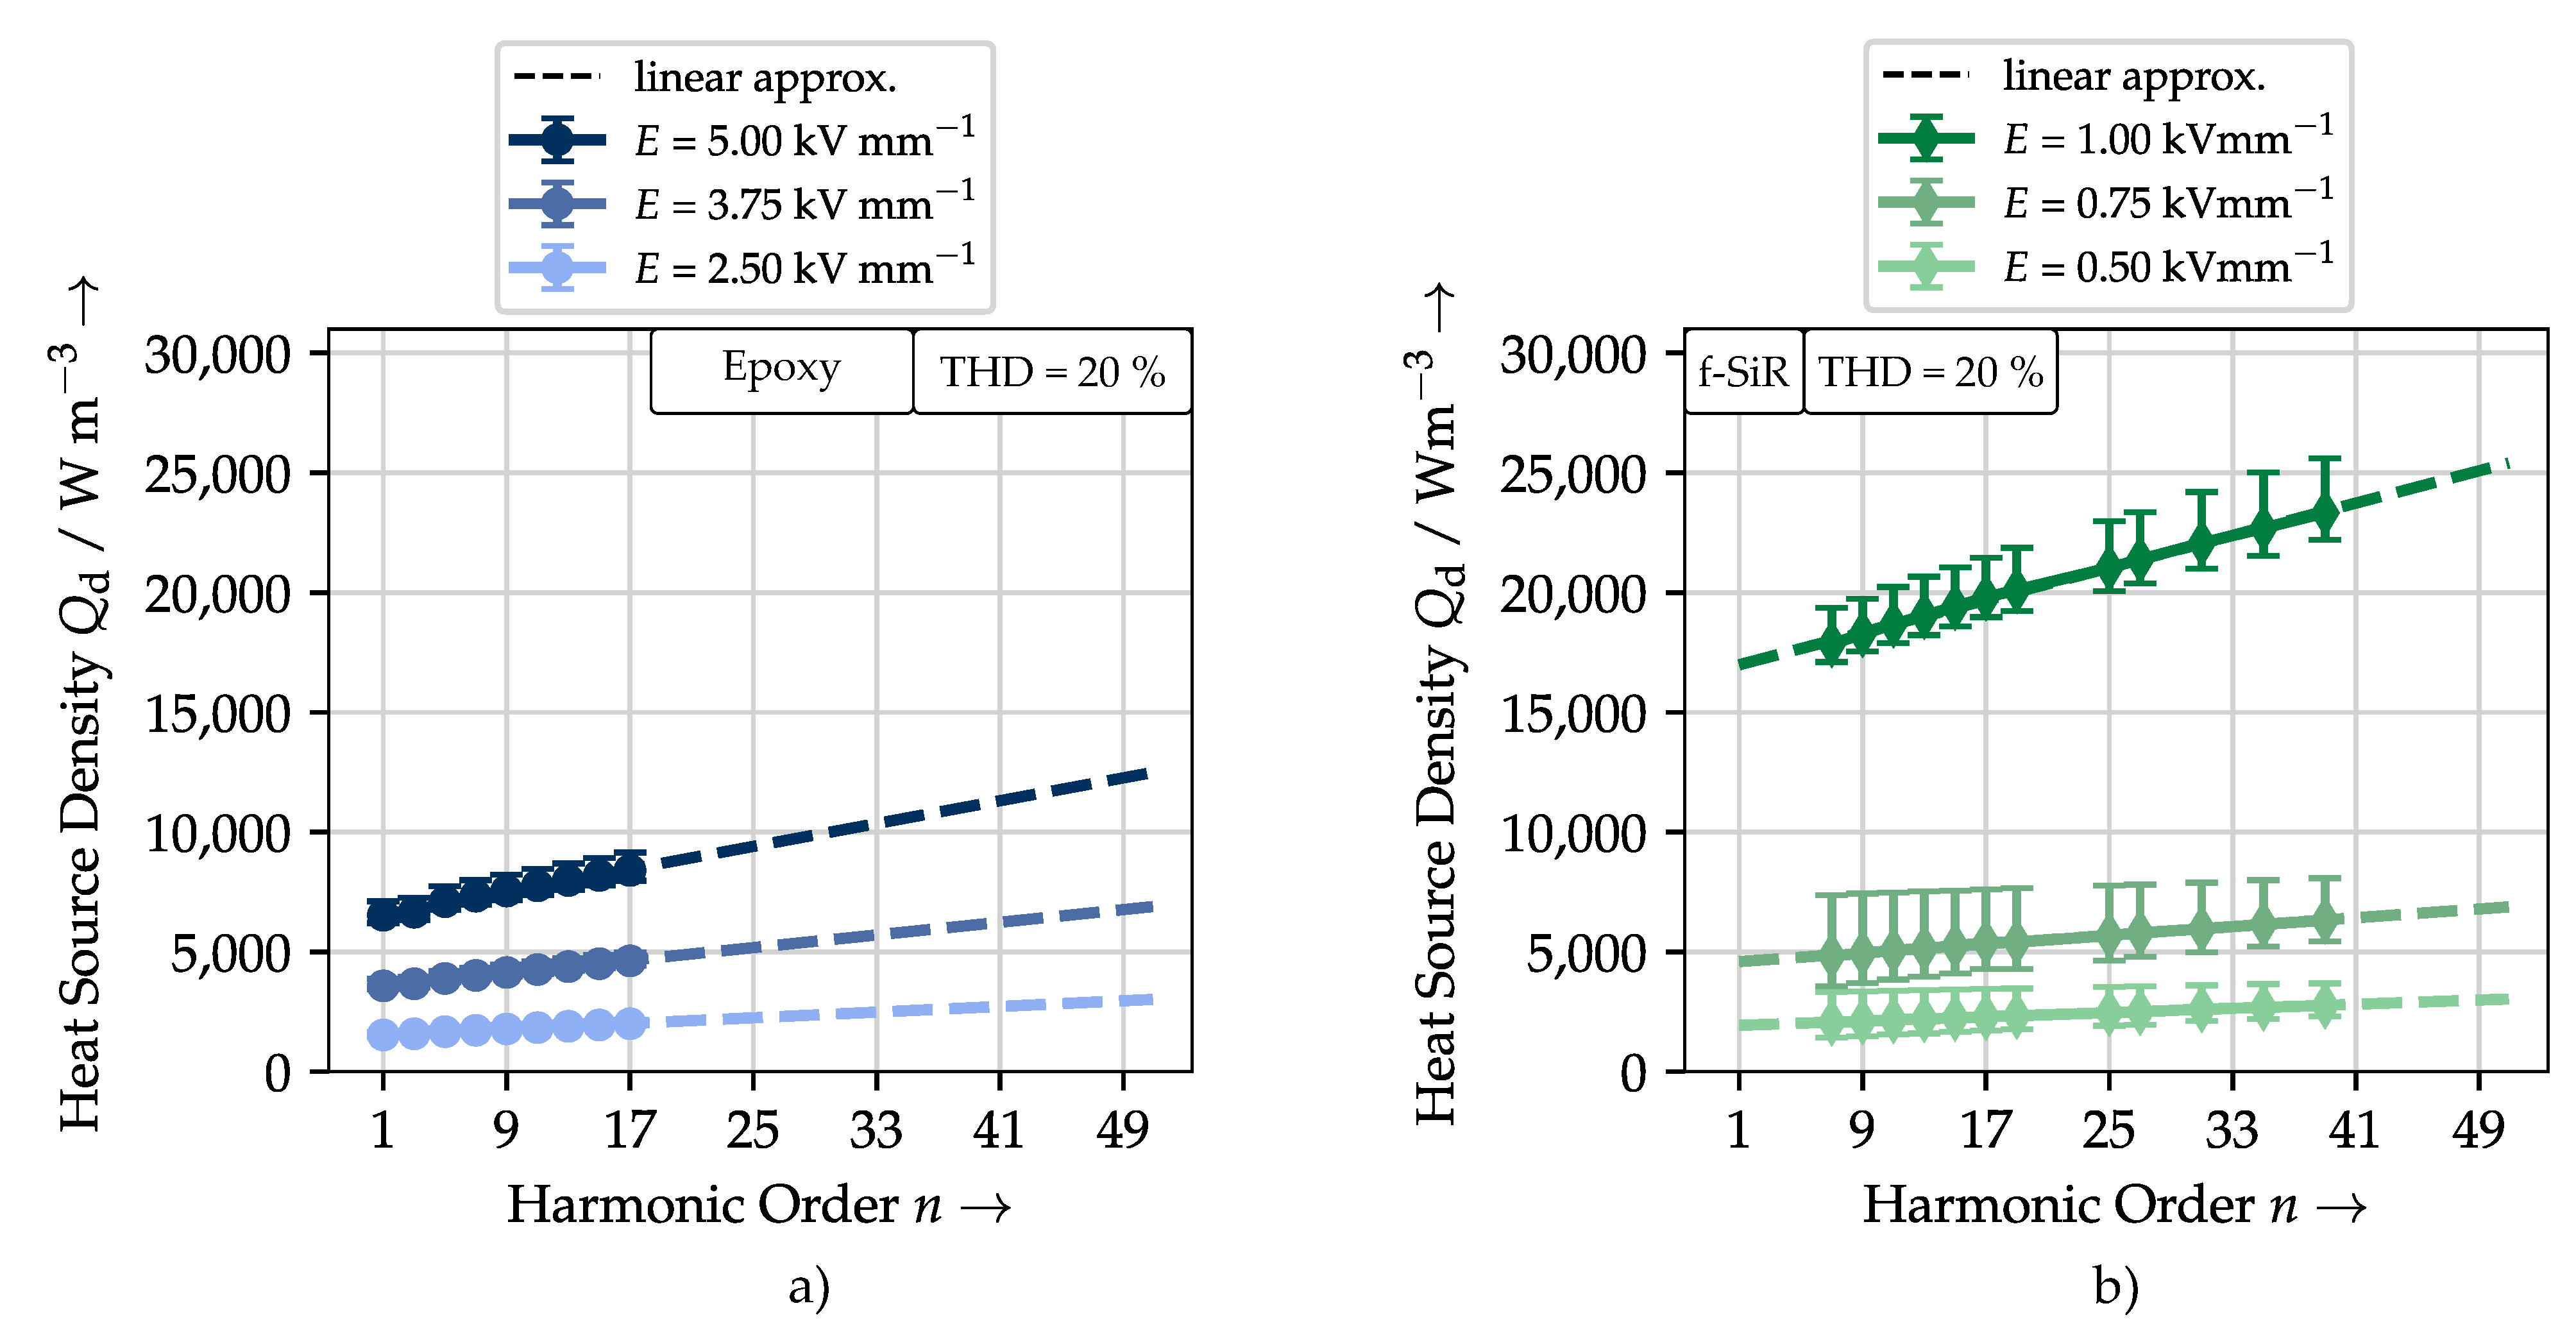
5.3. Dielectric Loss under Harmonic Distorted Voltage

While Section 5.1 and Section 5.2 discuss the frequency and field strength dependent material parameters without voltage distortion, the following section presents the dielectric loss measurement results of the materials stressed by distorted waveforms (e.g., Figure 1). The results are presented in terms of the measured heat source density Q d in W m−3.
First of all, the measured relationship between the electric field strength and the dielectric losses of the principally linear epoxy polymer and the nonlinear f-SiR samples is presented. The measured dielectric losses within the epoxy samples increase with the square of the applied electric field strength ( Q d E 2 , Figure 9). The selected measurements in the range of (1.25 … 5) kV mm−1 and a voltage distortion of THD = 20% are complemented by the quadratic approximation (approx.) based on the values between 1.25 kV mm−1 and 3.75 kV mm−1. The approximation provides a good fit to the measured data, which in turn confirms the square dependency of the dielectric losses on the electric field strength as discussed in Equation (11). This is valid for different distorting harmonics between the third and 17th.
On the contrary, the measured heat source density Q d of the f-SiR test objects shows a significant deviation from the square dependence of the electric field strength (Figure 10). The measured heat source density Q d at 1 kV mm−1 is about four times higher than that at 0.75 kV mm−1. The expected dielectric losses according to the assumption (Equation (11)) are illustrated by the quadratic approximation in Figure 10. This suggests that the nonlinear properties become increasingly dominant after exceeding the threshold of field strength. Moreover, the measured heat source density Q d of f-SiR is considerably higher than epoxy despite the lower imposed field strengths. This can be due to the greater polarisability ε r and dissipated losses ε r presented in Section 5.2, resulting in a generally higher dielectric loss.
With increasing THD, but constant RMS voltage U, the higher frequency components of the harmonics increasingly dominate the voltage waveform. As a result of the higher amplitudes of the harmonic voltage, the current values increase subsequently, leading to additional dielectric loss in both epoxy polymer and f-SiR samples (Figure 11). The measurements confirm the compressed quadratic behaviour that is expected from the theoretical derivation presented in Section 3. It should be noted that Figure 11 shows the increase of heat source density Q d as a function of the THD of epoxy and f-SiR for respectively different field strengths E and harmonic orders n.
For both epoxy polymer and f-SiR, the heat source density Q d increases with the harmonic order (Figure 12), which is caused by enhanced levels of current, as well as dielectric loss due to the increasing frequency. This linear increase confirms the expectations illustrated in Figure 2. It is worthwhile noting the strong rise and the significantly higher growth of the losses of f-SiR between 0.75 kV mm−1 and 1 kV mm−1.

6. Discussion

Primarily, it is important to acknowledge the difficulty of measuring the material properties and dielectric losses of insulation material in close-to-reality conditions due to the multitude of influences. This includes the effects of humidity, geometry and temperature. The samples were stored under constant conditions for several tens of hours in order to achieve a steady water content within the samples. Large sized samples were used intentionally in these investigations in order to incorporate the effects of large-scale structures within the materials, e.g., phase boundaries and manufacturing defects. The dielectric measurements on several millimetres of epoxy polymer and one millimetre of f-SiR require high voltages in order to achieve a sufficient field strength and measurement signal. Furthermore, the limited availability of voltage sources with sufficient power and frequency bandwidth poses an additional challenge.
The main goal of this study was to present the influence of nonlinear dielectric parameters on the dielectric loss within insulation materials under harmonic distorted voltages. Fundamentally, the DC conductivity of the investigated materials is field dependent due to underlying physical processes. The measured DC conductivity of the utilized epoxy resin is in the range of 10 16 S m−1, which corresponds to a heat source density of less than 1 W m−3 at a realistic electric field strength of 5 kV mm−1. As compared to epoxy, the f-SiR sample possesses a higher DC conductivity with 10−11 S m−1. A linear dependency on the electric field strength is obtained; however, the measurement of the field dependent conductivity of f-SiR revealed no observable change in the conduction mechanism up to 1 kV mm−1. This contrasts typical resistive field grading materials that rely on nonlinear field dependent DC conductivity. For both epoxy and f-SiR samples, their conductivity-related heat source density had a negligible contribution to the measured total heat source density presented in Section 5.3. In other words, the majority of the heat source density can be attributed to polarisation losses. A significant influence of the DC conductivity on the dielectric losses can however be possible at very high field strengths or temperatures.
In terms of the dielectric properties (real relative permittivity ε r and imaginary relative permittivity ε r ), the epoxy polymer samples exhibit minimal field dependency up to 5 kV mm−1. Between 1.25 kV mm−1 and 5 kV mm−1, the imaginary part of the complex permittivity ε r increased by 3% per kV mm−1. This ultimately leads to a good predictability of the dielectric losses and no perceivable deviation from the dependency on E 2 . Depending on the frequency, harmonic distortion and electrical field strength, voltage harmonics result in additional dielectric losses in the epoxy polymer, but within a calculable range with sufficient accuracy. As opposed to that, in spite of the lower electrical field strengths up to 1 kV mm−1 that are imposed on the f-SiR samples, a significant field dependency is obtained, which complies with their refractive field grading property. Predictably, the real ε r and imaginary relative permittivity ε r , as well as the heat source density Q d increase with the electric field strength. The nonlinear increase of the real ε r and imaginary relative permittivity ε r with the electric field strength reflects the refractive properties of the f-SiR. Consequently, a threshold is observed at field strengths as low as 0.75 kV mm−1, resulting in the increase of the heat source density Q d above the expected quadratic growth. As such, the accuracy of Equation (11) in estimating the total dielectric loss P δ and consequently the heat source density Q d is deemed accurate for materials with linear properties, but questionable for nonlinear materials at high field strengths.
To determine if the enhanced heat can result in critical ageing of the material, a mathematical model is required to calculate the temperature of the material with varied harmonic order, field strength and THD value. Consequently, by incorporating the calculated temperature as an additional parameter, an electrothermal model that is adapted to harmonic distorted voltages can be simulated.

7. Conclusions

The dielectric losses of epoxy polymer and f-SiR samples were investigated under harmonic distorted voltages with regard to the heat source density. Together with the analysis of their dielectric properties in the context of frequency and field dependency, the following conclusions can be drawn:
  • A method to directly quantify the dielectric losses under harmonic distorted voltage waveforms is introduced;
  • The dielectric properties of epoxy polymer are weakly dependent on the electrical field strength (linear behaviour), while strongly changing with increasing frequency;
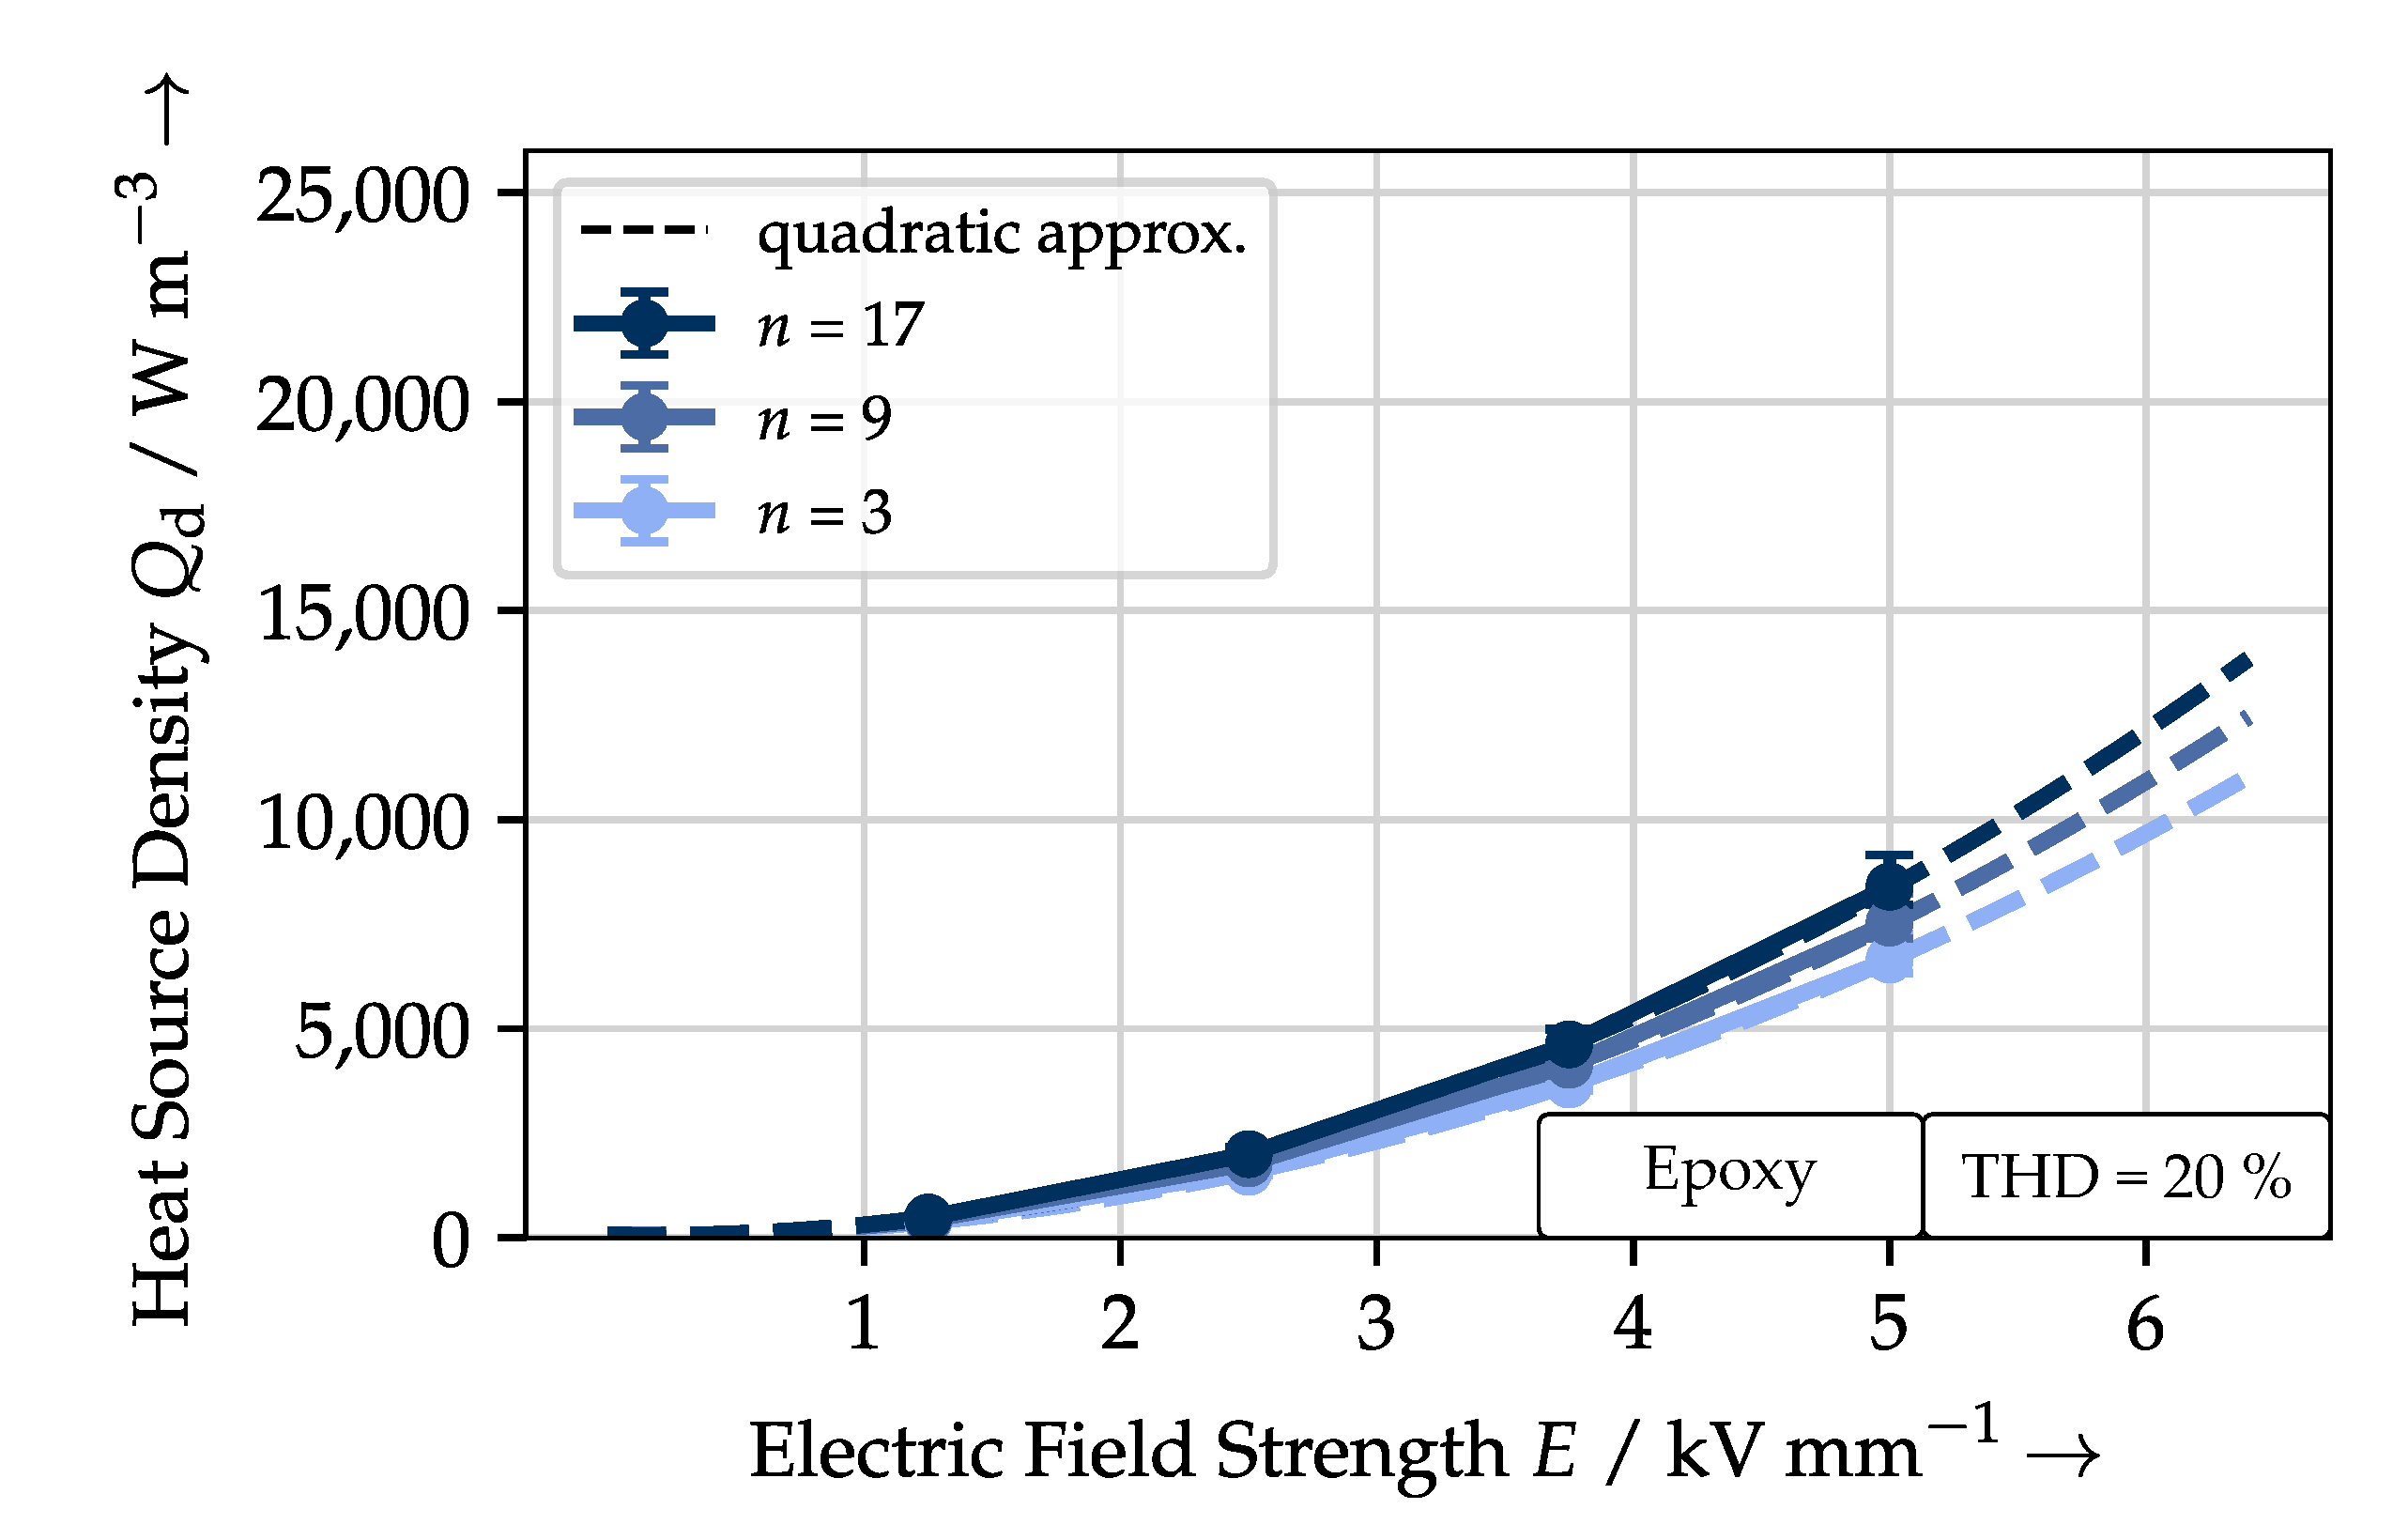
  • The dissipated heat of the epoxy polymer due to the dielectric losses as a result of harmonic distortion can be calculated via linear extrapolation with sufficient accuracy;
  • The f-SiR exhibits a significant field dependency: the complex permittivity increases with the electric field strength;
  • The complex permittivity of the f-SiR becomes nonlinear above an electric field strength threshold value;
  • The nonlinearity leads to a sharp increase of the measured dielectric loss above the threshold;
  • The estimation of the dielectric losses based on the linear superposition of several frequency components (Equation (11)) is valid for linear materials, but invalid for materials with nonlinear field dependence;
  • Generally, advanced models for dielectric loss dissipation are necessary in order to incorporate the multiple dependencies on frequency, electric field strength and temperature.
The major cause of failure in the initial example of the Eagle Pass station was the high temperature within the field grading layer as a consequence of high dielectric losses. Excess heat can be managed by the careful design of the components and in-depth knowledge of the insulation material’s properties with regard to frequency, electric field strength and temperature behaviour. Special care must be taken in the dimensioning of the insulation when significantly distorted voltages are to be expected, e.g., as a result of inverter operation.
The aspect of temperature dependency was intentionally not covered in this study, but is essential for further investigations. The interdependency between the dielectric properties and the temperature, in addition to the frequency and field strength behaviour, adds a new dimension to the predictability of heat dissipation within insulation materials. Hence, to get the full picture, the effects of temperature should be investigated to replicate the real operational stresses that linear and nonlinear materials have to withstand.

Author Contributions

Conceptualization, T.L., J.T.L., and K.B.; methodology, T.L., J.T.L., K.B., and S.K.; software, T.L. and J.T.L.; validation, T.L. and J.T.L.; formal analysis, T.L. and J.T.L.; investigation, T.L. and J.T.L.; resources, S.K., S.S., and S.G.; data curation, T.L. and J.T.L.; writing, original draft preparation, T.L. and J.T.L.; writing, review and editing, K.B., S.K., S.S., T.L., and J.T.L.; visualization, T.L. and J.T.L.; supervision, S.K., S.S., and S.G.; project administration, S.K., S.S., and S.G.; funding acquisition, S.K., K.B., and S.G. All authors read and agreed to the published version of the manuscript.

Funding

This research was funded by the European Social Fund (ESF) and the Free State of Saxony (https://www.strukturfonds.sachsen.de).
Energies 14 00663 i001

Institutional Review Board Statement

Not applicable.

Informed Consent Statement

Not applicable.

Data Availability Statement

Not applicable.

Acknowledgments

The authors thank RITZ Messwandler GmbH and Cellpack BBC Radeberg GmbH for providing the specimens.

Conflicts of Interest

The authors declare no conflict of interest.

References

  1. Espin-Delgado, A.; Letha, S.S.; Rönnberg, S.K.; Bollen, M.H.J. Failure of MV Cable Terminations Due to Supraharmonic Voltages: A Risk Indicator. IEEE Open J. Ind. Appl. 2020, 1, 42–51. [Google Scholar] [CrossRef]
  2. Temma, H.; Ishiguro, F.; Toki, N.; Iyoda, I.; Paserba, J.J. Clarification and Measurements of High Frequency Harmonic Resonance by a Voltage Sourced Converter. IEEE Trans. Power Deliv. 2005, 20, 450–457. [Google Scholar]
  3. Rönnberg, S.K.; Bollen, M.H.J.; Amaris, H.; Chang, G.W.; Gu, I.Y.H.; Kocewiak, Ł.H.; Meyer, J.; Olofsson, M.; Ribeiro, P.F.; Desmet, J. On Waveform Distortion in the Frequency Range of 2 kHz–150 kHz—Review and Research Challenges. Electr. Power Syst. Res. 2017, 150, 1–10. [Google Scholar]
  4. Birle, M.; Leu, C. Dielectric Heating in Insulating Materials at High DC and AC Voltages Superimposed by High Frequency High Voltages. In Proceedings of the 18th International Symposium on High Voltage Engingeering (ISH 2013), Seoul, Korea, 25–30 August 2013. [Google Scholar]
  5. Sonerud, B.; Bengtsson, T.; Blennow, J.; Gubanski, S. Dielectric Heating in Insulating Materials Subjected to Voltage Waveforms with High Harmonic Content. IEEE Trans. Dielectr. Electr. Insul. 2009, 16, 926–933. [Google Scholar] [CrossRef]
  6. Florkowski, M.; Florkowska, B.; Zydroń, P. High Voltage Harmonics Induced Modifications of PD Phase-Resolved Patterns. Arch. Electr. Eng. 2018, 67, 231–246. [Google Scholar] [CrossRef]
  7. Florkowski, M.; Blaszczyk, P.; Klimczak, P. Partial Discharges in Insulation Systems Subjected to Multilevel Converters. In Proceedings of the 2016 IEEE International Power Modulator and High Voltage Conference (IPMHVC), San Francisco, CA, USA, 5–9 July 2016; pp. 320–324. [Google Scholar] [CrossRef]
  8. Fabiani, D.; Montanari, G. The Effect of Voltage Distortion on Ageing Acceleration of Insulation Systems under Partial Discharge Activity. IEEE Electr. Insul. Mag. 2001, 17, 24–33. [Google Scholar] [CrossRef]
  9. Bengtsson, T.; Dijkhuizen, F.; Ming, L.; Sahlen, F.; Liljestrand, L.; Bormann, D.; Papazyan, R.; Dahlgren, M. Repetitive Fast Voltage Stresses-Causes and Effects. IEEE Electr. Insul. Mag. 2009, 25, 26–39. [Google Scholar] [CrossRef]
  10. Paulsson, L.; Ekehov, B.; Halen, S.; Larsson, T.; Palmqvist, L.; Edris, A.A.; Kidd, D.; Keri, A.; Mehraban, B. High-Frequency Impacts in a Converter-Based Back-to-Back Tie; The Eagle Pass Installation. IEEE Trans. Power Deliv. 2003, 18, 1410–1415. [Google Scholar] [CrossRef]
  11. Kao, K.C. Dielectric Phenomena in Solids—With Emphasis on Physical Concepts of Electronic Processes; Elsevier Academic Press: San Diego, CA, USA, 2004. [Google Scholar]
  12. Guillod, T.; Faerber, R.; Rothmund, D.; Krismer, F.; Franck, C.M.; Kolar, J.W. Dielectric Losses in Dry-Type Insulation of Medium-Voltage Power Electronic Converters. IEEE J. Emerg. Sel. Top. Power Electron. 2019, 2716–2732. [Google Scholar] [CrossRef] [Green Version]
  13. Färber, R. Endurance of Polymeric Insulation under Mixed-Frequency Medium-Voltage Stress. Ph.D. Thesis, ETH Zurich, Zurich, Switzerland, 2019. [Google Scholar]
  14. Birle, M. Beanspruchung von Polymeren durch höherfrequente Anteile einer Mischspannung. Ph.D. Thesis, Shaker, Aachen, Germany, 2015. [Google Scholar]
  15. Bärsch, R.; Kindesberger, J. Nichtlineare dielektrische Funktionseigenschaften von Dielektrika. In Werkstoffe mit Nichtlinearen Dielektrischen Eigenschaften; VDE-Verlag GmbH: Stuttgart, Germany, 2008; Volume 110, pp. 7–33. [Google Scholar]
  16. Zaengl, W. Dielectric Spectroscopy in Time and Frequency Domain for HV Power Equipment. I. Theoretical Considerations. IEEE Electr. Insul. Mag. 2003, 19, 5–19. [Google Scholar] [CrossRef]
  17. Bartnikas, R.; Eichhorn, R. (Eds.) Engineering Dielectrics Volume IIA Electrical Properties of Solid Insulating Materials: Molecular Structure and Electrical Behavior; ASTM International: West Conshohocken, PA, USA, 1983. [Google Scholar] [CrossRef]
  18. Menczel, J.D.; Prime, R.B. Thermal Analysis of Polymers, 1st ed.; John Wiley & Sons, Ltd.: Hoboken, NJ, USA, 2009. [Google Scholar] [CrossRef] [Green Version]
  19. Blythe, A.R.; Blythe, T.; Bloor, D. Electrical Properties of Polymers; Cambridge University Press: Cambridge, UK, 2005. [Google Scholar]
  20. Han, Y.; Li, S.; Min, D. Nonlinear Conduction and Surface Potential Decay of Epoxy/SiC Nanocomposites. IEEE Trans. Dielectr. Electr. Insul. 2017, 24, 3154–3164. [Google Scholar] [CrossRef]
  21. Guillod, T. Modeling and Design of Medium-Frequency Transformers for Future Medium-Voltage Power Electronics Interfaces. Ph.D. Thesis, ETH Zurich, Zurich, Switzerland, 2018. [Google Scholar]
  22. Martensson, E. Modelling Electrical Properties of Composite Materials. Ph.D. Thesis, Kungl Tekniska Högskolan, Stockholm, Sweden, 2003. [Google Scholar]
  23. Christen, T.; Donzel, L.; Greuter, F. Nonlinear Resistive Electric Field Grading Part 1: Theory and Simulation. IEEE Electr. Insul. Mag. 2010, 26, 47–59. [Google Scholar] [CrossRef]
  24. Hinrichsen, V.; Küchler, A. Grundlagen der Feldsteuerung. In Feldsteuernde Isoliersysteme: Werkstoffe, Design, Prüfung und Simulation; VDE Verlag: Berlin, Germany, 2011. [Google Scholar]
  25. Kremer, F.; Schönhals, A. (Eds.) Broadband Dielectric Spectroscopy; Springer: Berlin/Heidelberg, Germany, 2003. [Google Scholar] [CrossRef]
  26. Kahle, M. Elektrische Isoliertechnik; Springer-Verlag: Berlin/Heidelberg, Germany, 1989. [Google Scholar]
  27. Linde, T.; Backhaus, K. Comparison of Dielectric Loss Measuring Methods on Epoxy Samples under Harmonic Distorted Voltages; VDE-Hochspannungstechnik; VDE e.V.: Berlin, Germany, 2020. [Google Scholar]
  28. DIN EN IEC 62631-2-1:2018—Dielectric and Resistive Properties of Solid Insulating Materials—Part 2-1: Relative Permittivity and Dissipation Factor—Technical Frequencies (0.1 Hz to 10 MHz)—AC Methods; Technical Report; Beuth Verlag: Berlin, Germany, 2018.
  29. Loh, J.T.; Kornhuber, S. Influence of Harmonic Distorted Voltages on the Power Loss of Functionally Filled Silicone Elastomers. In VDE-Hochspannungstechnik; VDE e.V.: Berlin, Germany, 2020. [Google Scholar]
  30. Faerber, R.; Franck, C.M. Modular Arbitrary Waveform Dielectric Spectrometer for Aging Diagnostics of Recessed Specimens. In Proceedings of the 2016 IEEE Conference on Electrical Insulation and Dielectric Phenomena (CEIDP), Toronto, ON, Canada, 16–19 October 2016; pp. 763–767. [Google Scholar] [CrossRef] [Green Version]
  31. Sonerud, B.; Bengtsson, T.; Blennow, J.; Gubanski, S. Dielectric Response Measurements Utilizing Non-Sinusoidal Waveforms. In Proceedings of the IEEE Conference on Electrical Insulation and Dielectric Phenomena (CEIDP), Kansas, MO, USA, 15–18 October 2006. [Google Scholar] [CrossRef]
  32. Winter, H.J. Dielektrische Eigenschaften von Silikonelastomeren Als Isolierstoffe. ETG-Fachber 2003, 93, 29–35. [Google Scholar]
  33. Oesterheld, J. Dielektrisches Verhalten von Silikongummi-Isolierungen Bei Hohen Elektrischen Feldstärken. Ph.D. Thesis, TU Dresden, Dresden, Germany, 1994. [Google Scholar]
Figure 1. Harmonic distorted voltage waveforms with THD = 20%. (a) Third harmonic; (b) fifth harmonic; (c) 13th harmonic.
Energies 14 00663 g001
Figure 2. Heat source density of dielectrics as a function of different influence factors according to Equation (12).
Energies 14 00663 g002
Figure 3. Test setup for measurements at AC and distorted voltages.
Energies 14 00663 g003
Figure 4. Comparison of measured permittivity values between a commercial loss tangent measurement system and the presented test setup on epoxy samples; no voltage distortion.
Energies 14 00663 g004
Figure 5. (a) Measured DC conductivity and (b) calculated heat source density as a function of the electric field strength, one f-SiR sample.
Energies 14 00663 g005
Figure 6. Real and imaginary part of the complex relative permittivity of epoxy polymer as a function of (a) frequency and (b) electric field strength, the mean and range of three test objects.
Energies 14 00663 g006
Figure 7. Real and imaginary part of the complex permittivity of f-SiR as a function of (a) frequency and (b) electric field strength, the mean and range of three test objects, approximated increases for (0.25 … 0.75) kV mm−1 and (0.75 … 1) kV mm−1
Energies 14 00663 g007
Figure 8. Measured voltage and current at E = 0.75 kV mm−1 and 1 kV mm−1 (450 Hz); highlighted current waveform distortion in the positive and negative half-wave.
Energies 14 00663 g008
Figure 9. Heat source density of an epoxy polymer as a function of the electric field strength under distorted voltage THD = 20%, quadratic approximation for E = (1.25 … 3.75) kV mm−1, the mean and range of three test objects.
Energies 14 00663 g009
Figure 10. Heat source density of f-SiR as a function of the electric field strength under distorted voltage THD = 20%, quadratic approximation for E = (0.25 … 0.75) kV mm−1, the mean and range of three test objects.
Energies 14 00663 g010
Figure 11. Heat source density as a function of the total harmonic distortion for different orders of harmonic n. (a) Epoxy polymer samples, quadratic approximations for THD = (5 … 15)% and (b) f-SiR samples, quadratic approximations for THD = (10 … 20)%, the mean and range of three test objects.
Energies 14 00663 g011
Figure 12. Heat source density as a function of the harmonic order n with a linear approximation. Results for different electrical field strengths E. (a) Epoxy polymer and (b) f-SiR, the mean and range of three test objects.
Energies 14 00663 g012
Table 1. Samples and their characteristics. f-SiR, functionally filled silicone rubber.
Epoxyf-SiR
Filler 67% quartz flourferroelectric particles
ThicknessmmAC: (3.9 ± 0.1)(1 ± 0.05)
DC: (1 ± 0.1)(1 ± 0.05)
Effective volume c m 3 (7.65 ± 0.2)(1.92 ± 0.1)
Vacuum capacitance p F (4.4 ± 0.1)(17.7 ± 0.9)
Table 2. Overview of the measurements.
SectionMeasured QuantityVoltageParameter Epoxyf-SiR
Section 5.1 σ DC DCE kV mm−110.25 … 1
Section 5.2 ε r and ε r ACEkV mm−11.25 … 50.25 … 1
sinusoidalfHz50 … 850350 … 1950
Section 5.3 Q d ACE kV mm−11.25 … 50.25 … 1
distortedn 1 … 177 …39
THD%5 … 2010 … 20
Publisher’s Note: MDPI stays neutral with regard to jurisdictional claims in published maps and institutional affiliations.

