Abstract
Thermal comfort, indoor air quality (IAQ), and energy use are closely related, even though these have different aspects with respect to building performance. We analyzed thermal comfort and IAQ using real-time multiple environmental data, which include indoor air temperature, relative humidity, carbon dioxide (CO2), and particulate matter (e.g., PM10 and PM2.5), as well as electricity use from an energy recovery ventilation (ERV) system for a childcare center. Thermal comfort frequency and time-series analyses were conducted in detail to thoroughly observe real-time thermal comfort and IAQ conditions with and without ERV operation, and to identify energy savings opportunities during occupied and unoccupied hours. The results show that the highest CO2 and PM10 concentrations were reduced by 51.4% and 29.5%, respectively, during the occupied hours when the ERV system was operating. However, it was also identified that comfort frequencies occurred during unoccupied hours and discomfort frequencies during occupied hours. By analyzing and communicating the three different types of real-time monitoring data, it is concluded that the ERV system should be controlled by considering not only IAQ (e.g., CO2 and PM2.5) but also thermal comfort and energy use to enhance indoor environmental quality and save energy based on real-time multiple monitoring data.
1. Introduction
Multiple environmental monitoring systems have expanded the possibility of integrative research on three different aspects for building performance: energy use, thermal comfort, and indoor air quality (IAQ). Basically, a cloud-based monitoring system can simultaneously allow several types of services [1,2] by collecting multiple environmental data using the Internet of Things (IoT), which can enhance the performance of energy use, thermal comfort, and IAQ through real-time data and analysis [3,4]. The development of wireless communication, data storage, small electronics, etc., will provide more and useful big data for improving building performance.
In terms of building performance, thermal comfort, IAQ, and energy use are closely related, even though these have different characteristics. Thermal comfort can affect occupants’ productivity through indoor air temperature and humidity. IAQ can affect occupants’ health through exposure to viruses, fine particles, etc. Particularly, for children’s health, IAQ is important in childcare and daycare centers [5]. In addition, efficient energy operation and control will reduce energy use and cost as well as greenhouse gas emissions, while maintaining targeted thermal comfort and IAQ levels. Some studies have tested the three components of energy use, thermal comfort, and IAQ using experimental data. Barbosa et al. [6] studied a school in Porto, Portugal, in terms of energy use, thermal comfort, and IAQ. Using a prototype classroom of the school, they closely observed the indoor temperature, relative humidity, carbon dioxide (CO2), and energy consumption after the refurbishment (e.g., exterior blinds, roof insulation, ventilation, etc.) in a Mediterranean climate. Their results showed that the discomfort indicators were decreased under free-running conditions and heating schedule changes after the refurbishment. The researchers also found no relationship between occupants’ perception and indoor thermal comfort and IAQ. Che et al. [7] examined thermal comfort and IAQ in an office located in Hong Kong using a retrofitted HVAC system, which had indoor temperature and CO2 concentration sensors, as well as dehumidification coils. Their results showed that significant energy use and particulate matter reductions in a hot and humid climate were possible with proper design and measures for HVAC systems.
Other studies were conducted through surveys and literature reviews. Yang et al. [8] studied 650 energy-efficient residences in Switzerland. They compared 217 green-certified residences with 433 energy-renovated residences using a questionnaire and field measurements of IAQ data. They found that the green-certified residences using mechanical ventilation had much better IAQ than the energy-renovated residences using natural ventilation (i.e., open windows). In addition, they found no significant differences between occupants’ satisfaction and health symptoms. Guyot et al. [9] conducted a meta-analysis of 38 studies on smart ventilation systems (e.g., CO2, humidity, outside temperature, and/or occupancy-based control) in residences in France, the Netherlands, and Belgium. Their results showed that smart ventilation systems could save up to 60% of energy, but they overused energy by up to 26% in some cases. They suggested more suitable IAQ metrics, contaminant source analysis between occupied and unoccupied schedules, and air cleaning for future smart ventilation systems.
In addition, simulation-related studies have been conducted for energy use, thermal comfort, and IAQ. Pantazaras et al. [10] analyzed CO2 setpoint, occupancy, ventilation rate, and cooling load for a demand controlled ventilation system in a case study of a lecture theater in a tropical climate. They suggested a decision tool to balance energy use and IAQ using several scenarios from the whole-building energy simulation program (i.e., EnergyPlus) along with measured CO2 concentrations from three calibrated sensors. Cheng et al. [11] studied stratum ventilation to provide better IAQ and energy savings in an office. Using a TRNSYS program, they optimized a fresh outdoor air ratio for the stratum ventilation, and showed an energy use reduction of 6.4% while meeting the targeted CO2 concentration in the breathing zone of occupants.
Several studies have analyzed energy recovery ventilation (ERV) systems to provide energy savings and improved thermal comfort and IAQ [12,13,14]. Rasouli et al. [12] studied ERV systems by modeling and simulating a 10-story office building in Chicago, Helena, Miami, and Phoenix in the U.S. Using a TRNSYS program, they demonstrated that an ERV system could save up to 40% heating energy. They found that the ERV system needed an optimum control strategy for the cooling load by considering the latent-to-sensible effectiveness ratio of the ERV system. Fan et al. [13] conducted field studies to observe the thermal performance of an air conditioning system along with ERV at the ceilings in a two-story office building in Japan. Their results, which were obtained from the use of the ERV system based on CO2 concentrations, showed heating and cooling energy use reductions of approximately 30% and 20%, respectively, from the field measurements over a few days. In addition, they found that the ERV system could reduce the ventilation-related heating load up to approximately 60% in the heating period and approximately 70% in the cooling period. Guillen-Lambea et al. [14] evaluated the necessity of ERV in the residences in several cities in Southern Europe in a mild and warm climate. Their results showed that some cities required a high sensible/latent energy demand and others required a less sensible/latent energy demand from the ERV systems. These three studies showed the potential of ERV systems to provide energy savings and improved thermal comfort and IAQ. However, the three studies were not conducted in real time; operation data were not measured after the installation of ERV systems.
In summary, all the previous studies analyzed energy use and indoor environmental quality (i.e., thermal comfort and IAQ) along with ventilation, air conditioning, and heating systems using ERV. The previous studies observed energy use, thermal comfort, and IAQ using several approaches (i.e., experimental data, simulations, and field measurements). However, studies on analyzing real-time energy use, thermal comfort, and IAQ data for childcare centers are lacking even though children are significantly affected by IAQ [15,16], and their thermal comfort levels are sensitive when compared to adults [17]. Therefore, we analyzed thermal comfort and IAQ using real-time multiple environmental data collected from a cloud monitoring system, including indoor air temperature and humidity, carbon dioxide (CO2), and particulate matters (e.g., PM10 and PM2.5), as well as electricity use from the ERV system for a case study building in South Korea.
In the next section, we introduce the overall methodology of this study. The section includes a description of the case study childcare center and approaches of graphical comfort zone and time-series analysis. The results from the analyses are summarized in Section 3. The meaning and limitations of the methodology in this study are described in Section 4. Finally, the conclusions and contributions of this study are presented in Section 5.
2. Methods
2.1. Case Study Building Description
The case study building is a two-story childcare center as shown in Figure 1 (left). The location of the childcare center is approximately 15.6 km northwest from the center of Seoul, South Korea. The childcare center, with a total conditioned space of 577 m2, has six and four rooms on the first and second floors, respectively. About 30 teachers and 130 children use the building. Four 500 m3/h ERV systems and one 200 m3/h ERV system were installed at the ceilings to ventilate the six rooms on the first floor. In addition, two ERV systems (1000 m3/h) were installed to ventilate the four rooms on the second floor. The ERV systems on the first and second floors were installed in May 2020 and December 2019, respectively. All the installed ERV systems had fixed-plate cross-flow heat exchangers with CO2 and PM2.5 concentration-based control. Testing, adjusting, and balancing (TAB) was conducted to check the amount of air volume (m3/h) to/from the diffusers installed at the ceilings for all the ERV systems. In addition, to monitor electricity use from the ERV systems, smart meters were individually installed.
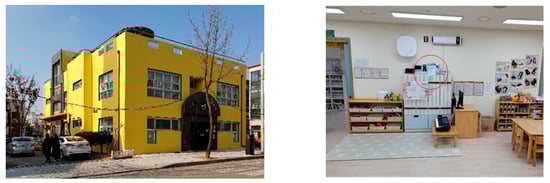
Figure 1.
The view of the childcare center (left) and inside the childcare room with the multiple monitoring sensor installed (right).
ERVs exchange the inside temperature for the outside temperature (i.e., sensible energy) [14]. For example, during winter, the inside temperature heated by a heating system helps warm the outside air when it enters the room through a heat exchanger in the ERV system. The cooled inside temperature helps cool the outside air in the ERV system during summer. In addition, ERVs exchange the inside humidity for the outside humidity (i.e., latent energy) [18]. The air volume helps transfer the sensible and latent energy. The sensible and latent energy recovered by the ERV system can be expressed using Equation (1) and (2), respectively:
where is the recovered energy from the ERV system, is the effectiveness of the ERV exchanger, is the product of the ventilation air mass flow and the specific heat or water heat vaporization at 0 °C, is temperature, is air specific humidity, and is the ERV’s working hours (h).
The specific sensible and latent energy were not investigated in this study. However, using the real-time data, the operational advantages from the ERV system were observed.
For the analysis, we selected one room (57 m2) on the second floor, as shown in Figure 1 (right) and Figure 2. There were, on average, two teachers and eight children (5 years old) during the occupied hours from 9:00 a.m. to 6:00 p.m. Half of the ERV system (1000 m3/h) covered the selected rooms with three supply air diffusers and three return air diffusers. The average 90.3 m3/h from the three supply air diffusers and the average 91.7 m3/h from the three return air diffusers were measured through TAB. A real-time multiple monitoring sensor was installed in the room to monitor particulate matters (PM2.5 (μg/m3) and PM1.0 (μg/m3)), radon (Bq/m3), volatile organic compounds (VOCs, μg/m3), carbon dioxide (CO2, ppm), indoor air temperature (°C), and relative humidity (%) in 10 min intervals. For this study, indoor air temperature and relative humidity, PM10, PM2.5, and CO2 concentration were analyzed to observe the real-time operational characteristics by the ERV system in the selected room. The multiple monitoring sensor used in this study was installed at about 1.6 m above the floor near the room controller for the ERV system since the thermal environment around the sensor position was expected to be approximately stationary when we observed. The accuracy of the multiple monitoring sensor was identified to be compliant with the requirements of ASHRAE 55 and ISO 7726 standards for thermal comfort analysis [19,20], based on the specifications provided by manufacturer as shown in Table 1. In addition, CO2 and PM2.5 measurements were compared to the data measured from accurate reference sensors such as the TESTO 480 (CO2) and the DustTrack II Aerosol Monitor 8532 (PM2.5) prior to the installation of the multiple monitoring sensor. As shown in Figure 3, the CO2 concentration showed a good agreement with the coefficient of determination (R2) of 0.9494. The PM2.5 concentration showed a reasonable agreement with the R2 of 0.5292.
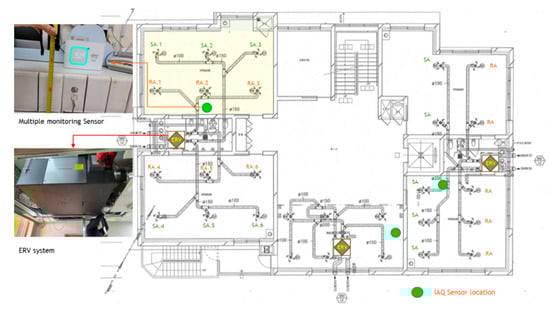
Figure 2.
The 2nd floor plan of the childcare center along with the energy recovery ventilation (ERV) systems and the multiple monitoring sensors (the height of sensors is about 1.36 m above the floor).

Table 1.
Measurement range and accuracy of the multiple monitoring sensor.
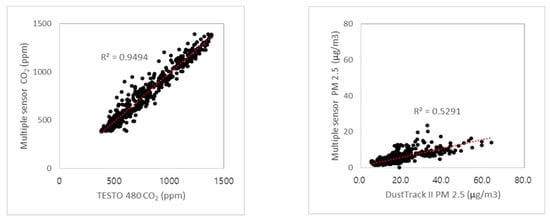
Figure 3.
Measured CO2 and PM2.5 concentrations compared to the data from the TESTO 480 (CO2) and the DustTrack II 8532 (PM2.5) sensors, respectively.
2.2. Data Analysis Procedure
A graphical thermal comfort analysis and time-series analysis were conducted in detail to observe thermal comfort and discomfort frequency, real-time IAQ conditions with and without ERV operation, and energy saving opportunities during the occupied and unoccupied hours of the childcare center.
Figure 4 shows the overall process of this study. First, we collected the hourly data of electricity use (kWh) from the ERV system, 10 min interval data of thermal comfort (i.e., indoor air temperature (°C) and indoor relative humidity (%)), and IAQ (i.e., PM10, PM2.5, and CO2) from the room. All the data were wirelessly collected and stored using the cloud monitoring system we developed. Second, we processed the collected data to find missing data. The time intervals of the collected data were continuously connected even though some data were missing. Thus, a process for identifying missing data was required to obtain accurate time intervals. Third, we arranged the processed thermal comfort, IAQ, and energy use data with the same time intervals. Fourth, the thermal comfort was analyzed using the ASHRAE 55-2017 graphical comfort zone method [19,21]. The graphic comfort zone method is limited to use for occupants’ metabolic rates between 1.0 and 1.3, clothing insulation between 0.5 and 1.0 clo, average air velocity below 0.2 m/s, and humidity ratio below 0.012 kg H2O/kg dry air. We assumed that the thermal environment in the room was within an acceptable range of the ASHRAE requirements based on the children’s activity (e.g., near sedentary), clothing, and the room conditions (e.g., almost stationary) we observed.
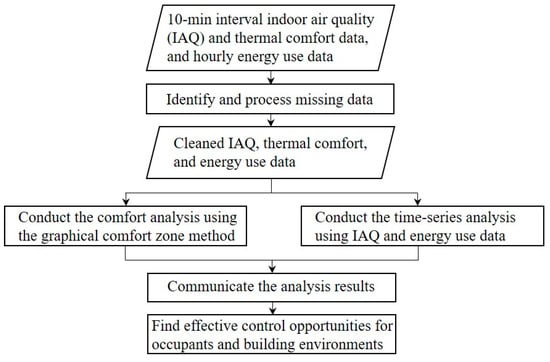
Figure 4.
Overall process to analyze real-time energy use, thermal comfort, and indoor air quality.
For such thermal comfort analysis, it is necessary to directly measure or calculate the operative temperature based on the measured air temperature and mean radiant temperature according to ASHRAE 55-2017 [19] and ISO 7726 Standard [20]. In addition, the measurements should be carried out at 0.1, 0.6, and 1.1 m above the floor for a seated person and 0.1, 1.1, 1.7 m for a standing person when room radiation is heterogeneous [20,22]. However, it was practically difficult to take into account such detailed measurements at different heights, so we installed the multiple monitoring sensor at a representative point (i.e., about 1.6 m above the floor) near the room controller for the ERV system since the thermal environment around the sensor position was expected to be approximately stationary. We also used the dry-bulb temperature measured from the multiple monitoring sensor rather than the operative temperature since the dry-bulb temperature could be used as an alternative to the operative temperature or mean radiant temperature for the typical buildings that use radiant systems [23]. The accuracy of the multiple monitoring sensor was identified to be consistent with ISO 7726 and ASHRAE 55 requirements for thermal comfort analysis, based on the specifications provided by the manufacturer.
Frequency analysis [24] using 10 min intervals was conducted to more accurately observe the real-time thermal comfort conditions and energy savings opportunities during the occupied and unoccupied hours. A time-series analysis was also conducted for hourly intervals of ERV energy use data and 10 min intervals for thermal comfort and IAQ data. For the 10 min interval comparison, we assumed that hourly energy use data was the same during the six 10 min intervals (e.g., 0:10 a.m. to 1:00 a.m.). Next, all the data were displayed in a plot using the 10 min intervals for the day. Two representative days when the ERV system was turned on and off were selected. Using the visual approach, exploratory data analysis was conducted.
Detailed analysis was also conducted considering outside air temperature and outside relative humidity as well as the differences between inside and outside air temperature and inside and outside relative humidity. The outside data obtained from the weather station in Paju, 30.5 km away from the childcare center, were used to check the outside air temperature (°C) and outside relative humidity (%). The weather station in Paju [25] was used rather than the weather station in Seoul because we estimated that the environmental conditions in Paju were more similar to the environmental conditions of the childcare center.
Finally, we found effective ERV control opportunities for occupants and healthy building environments. To identify the control opportunities, we used the real-time data from the two different days when the ERV system was turned on and off to better understand a real-time situation in the childcare center.
3. Results
This section describes the results from the graphical thermal comfort analysis and time-series analysis to observe thermal comfort and discomfort frequency, real-time IAQ conditions with and without ERV operation, and energy saving opportunities during the occupied and unoccupied hours of the childcare center.
3.1. Thermal Comfort Analysis
For this analysis, 10 min interval data of indoor air temperature (°C) and relative humidity (%) during the monitoring period from January to March in 2020 were collected and processed, and the humidity ratio (kg H2O/kg Dry Air) was calculated. Then, the data were displayed on the graphical winter comfort zone of ASHRAE 55-2017. Figure 5 shows the ASHRAE winter comfort zone with the processed data on the weekdays during the heating period (i.e., during the cold and dry climate in South Korea) for the selected room of the childcare center. In Figure 5, the green triangles indicate the comfort data and the blue and orange circles indicate the too cold and too hot discomfort data, respectively.
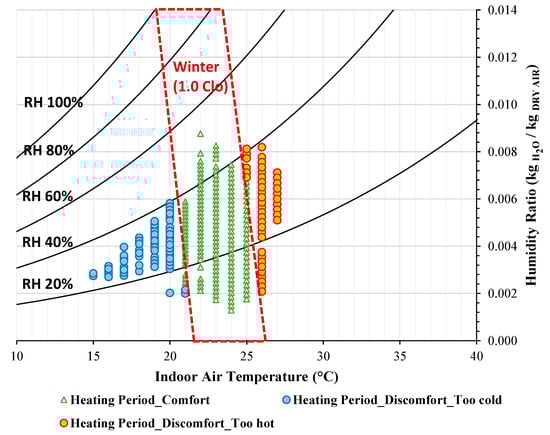
Figure 5.
Graphical comfort zone analysis. RH, relative humidity.
For the childcare center, we found that the indoor air temperature ranged from 15 to 27 °C and the absolute humidity ratio from 0.0013 to 0.0088 kg H2O/kg Dry Air during the heating period, as shown in Figure 5. In addition, we observed that 77.5% and 22.5% of the measured data met and did not meet the winter thermal comfort zone, respectively, during the heating period. Among the 22.5% discomfort data, the too cold data marked by the blue circles accounted for 17.3% and the too hot data marked by the orange circles accounted for 5.2%.
To further observe the comfort conditions during the occupied and unoccupied hours, the 10 min intervals of the day approach was applied using thermal comfort and discomfort frequency analysis. In Figure 6, the thermal comfort and discomfort frequencies are displayed in 10 min intervals for occupied and unoccupied hours on weekdays during the heating period. Again, the average occupancy schedule of the room was from 9:00 a.m. to 6:00 p.m.

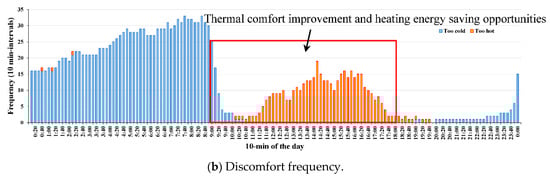
Figure 6.
Frequency analysis during the winter comfort zone (a) and the winter discomfort zone (b).
Figure 6a shows that the comfort frequencies were found during unoccupied hours before 9:00 a.m. and after 6:00 p.m. (i.e., heating energy saving opportunities) as well as during the occupied hours. We observed that the comfort hours were retained long after 6:00 p.m. by the thermal mass effects of the radiant floor heating in the room. The heating system installed in the room was a radiant floor heating system, which is widely installed in South Korea because the systems provide better thermal comfort and energy efficiency using water-based radiant energy [26]. Thus, the radiant floor heating system could be turned off one or two hours earlier than usual, or night setback controls could be considered to save heating energy during unoccupied hours.
Figure 6b also shows that there were opportunities to improve thermal comfort and save floor heating energy use during occupied hours from 9:00 a.m. to 6:00 p.m., as shown in the red box. We observed that the too cold discomfort times in the 10 min intervals were significantly reduced after 9:00 a.m. because the heating system was turned on. However, high discomfort frequencies still occurred until 9:30 am. If the heating system is turned on at 8:30 a.m. or earlier, the comfort level will be enhanced even though more heating energy use is required. We also observed that too hot discomfort frequencies occurred from 11:30 a.m. to 5:30 p.m. Thus, the radiant floor heating system could be turned on one or two hours earlier than usual in the morning and sometimes turned off to prevent overheating and save heating energy use during occupied hours.
3.2. Time-Series Analysis
Based on the graphical thermal comfort zone along with the comfort and discomfort frequency analysis, two days were selected when the ERV system was turned off (Figure 7) and on (Figure 8). The 10 min interval approach was used to analyze the real-time data of ERV energy use, thermal comfort, and IAQ in the selected room of the childcare center. To compare the 10 min intervals, we assumed that hourly energy use data were the same during the six 10 min intervals (e.g., 0:10 to 1:00 a.m.).
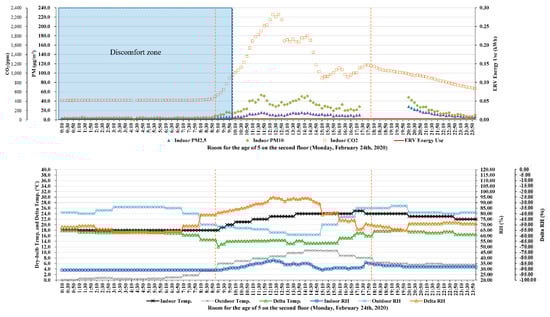
Figure 7.
Time-series analysis on the day when the ERV system was off.
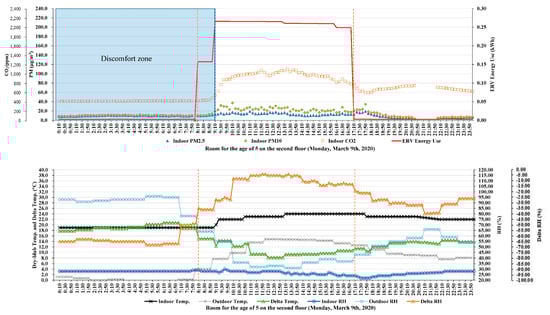
Figure 8.
Time-series analysis on the day when the ERV system was on.
Figure 7 and Figure 8 show the results from the time-series analysis. In the two upper figures of Figure 7 and Figure 8, the blue shaded boxes indicate the discomfort zones calculated from the graphic comfort zone analysis in the previous section. The real-time measured CO2 (ppm), PM10 (μg/m3), and PM2.5 (μg/m3) using the 10 min intervals are indicated by the orange, green, and blue dots, respectively. The real-time measured ERV energy consumption (kWh) is shown as the red line using hourly intervals. In the two lower figures in Figure 5 and Figure 6, the real-time measured indoor air temperature (°C) and indoor relative humidity (%) using the 10 min intervals are shown in the bold black and blue lines, respectively. Hourly outside air temperature (°C) and outside relative humidity (%) measured from the weather station are shown in the dotted grey and light-blue lines, respectively. To observe the effect of the ERV operation and the related weather conditions, the difference between inside and outside air temperatures and between inside and outside relative humidity are displayed in the bold, green, and orange lines, respectively. In addition, the observed occupancy hours are marked using the vertical dotted orange lines.
Figure 7 shows the day when the ERV system was turned off (24 February 2020). Due to the lack of operation hours of the ERV system, the CO2 concentrations were over the 1000 ppm required by the Korean IAQ Control Act for childcare/daycare centers. The highest CO2 concentration was 2257 ppm at 12:20 p.m. The lowest CO2 concentration was 895 ppm at 3:10 p.m. after the peak time during the occupied hours. However, high CO2 levels over 1000 ppm were recorded by 7:50 p.m. On that day, the ERV system should be turned on at least by 6:00 p.m. because the average departure time of all the occupants in the room was 6:00 p.m. In addition, based on the CO2 concentration pattern, we learned that the teacher and/or the children moved to another room for other activities at 1:00 and 2:30 p.m. The highest PM10 and PM2.5 during the occupied hours were 52.8 and 15.2 μg/m3, both at 11:40 a.m., respectively. However, the PM2.5 concentration was stable below 20.0 μg/m3. The coarse and fine particle levels were acceptable because the Korean IAQ Control Act for childcare/daycare centers sets limits of 75.0 and 35.0 μg/m3 for PM 10 and PM2.5, respectively. The discomfort zone time ended at 10:00 a.m. The indoor air temperature smoothly reached 24 °C at 1:40 p.m., and the highest indoor air temperature was 25 °C from 5:00 to 5:30 p.m. The indoor relative humidity continuously changed. During the occupied hours, the highest relative humidity was 38% at 12:20 p.m.
Figure 8 shows the day when the ERV system was turned on (6 March, 2020). The ERV system was turned on at 8:10 a.m. and off at 5:00 p.m. Based on the energy use from the ERV system, the high air volume operation started at 9:10 a.m. when the children regularly arrived at the childcare center (i.e., CO2 concentration started increasing). The highest CO2 concentration was 1096 ppm at 1:20 p.m., which is a 51.4% reduction compared to the day when the ERV system was off. The lowest CO2 concentration was 814 ppm at 4:10 p.m. after the peak time during the occupied hours. Compared to the day when the ERV system was off, high CO2 concentrations were effectively controlled after lunch. However, CO2 concentration should be carefully monitored because the number of occupants in the room could be higher in some cases. Basically, we found that the ERV cannot be turned off for the day because the CO2 concentration was around the maximum IAQ limit. However, the air volume can be controlled to save fan energy early in the morning when CO2 concentration is not high (e.g., from 8:10 to 9:10 a.m.). The ERV operation also controlled the highest PM10 concentration below 40.0 μg/m3 during the occupied hours. The highest PM10 concentration was 37.2 μg/m3 at 10:10 a.m., which is a 29.5% reduction compared to the day when the ERV system was off. The effectiveness of the ERV operation for PM2.5 was not checked because the PM2.5 concentrations were below 20.0 μg/m3 even on the day when the ERV system was off.
Based on the occupancy hours, we found that the floor heating system was also turned on at 8:10 a.m. and off at 5:10 p.m. when the ERV system was turned on and off, respectively. The discomfort zone ended at 9:10 a.m., earlier than on the day when the ERV system was off (the discomfort zone time ended at 10:00 a.m.) because the floor heating system was turned on at 8:10 a.m. compared to the day when the ERV system was turned off (it was turned on at 9:00 a.m.). The highest indoor air temperature smoothly reached 24 °C at 1:10 p.m. The indoor relative humidity was constant compared to the day when the ERV system was off. During the occupied hours, the highest relative humidity was 30% at 9:40 a.m. We estimated that the ERV operation could produce a stable inside relative humidity profile using outside relative humidity. However, during the heating period, the thermal comfort may be worse because the outside relative humidity is typically low in the northern hemisphere during winter. In addition, we estimated that the ERV operation could contribute to a stable inside air temperature profile using the outside air temperature. For example, the indoor air temperatures smoothly changed during the ERV operation hours. We also observed that the outside weather conditions were not favorable to the ERV system because the change in temperature and relative humidity were close to zero during the occupied hours compared to the day when the ERV system was off.
Figure 9 and Figure 10 show an additional graphical comfort zone with time classifications on the ASHRAE psychrometric chart. The 10-min-interval thermal comfort data from the two different days when the ERV system was off and on are visualized using the six-interval classification. When the ERV system was turned on (Figure 10), the parallel variation (i.e., indoor air temperature) on the psychrometric chart and the vertical variation (i.e., humidity ratio), as well as the relative humidity variation, were less than when the ERV system was off (Figure 9). In other words, the clusters of the indoor thermal comfort conditions on the psychrometric chart are more stable. For the time classification from 0:10 to 10:00 am. (i.e., the blue triangles), the indoor thermal comfort condition changes were on a similar relative humidity line between the two different days. After the ERV and heating floor system were turned on at 8:10 a.m., the indoor thermal comfort conditions met the winter comfort zone from 9:10 a.m. For the period from 10:10 a.m. to 01:00 p.m. (i.e., the green dots), the two figures show significantly different indoor thermal comfort conditions. For example, the variation of 0.00186 kg H2O/kg Dry Air between the maximum humidity ratio of 0.00666 kg H2O/kg Dry Air and the minimum humidity ratio of 0.00479 kg H2O/kg Dry Air for the day when the ERV system was off were much larger than the variation of 0.00029 kg H2O/kg Dry Air for the day when the ERV system was on. For the other time periods, the indoor thermal conditions also significantly changed. However, we observed that the changes could be caused by the floor heating system because the indoor air temperature and humidity ratio variations were similar between the two days, even though the locations of the thermal comfort clusters were significantly different.
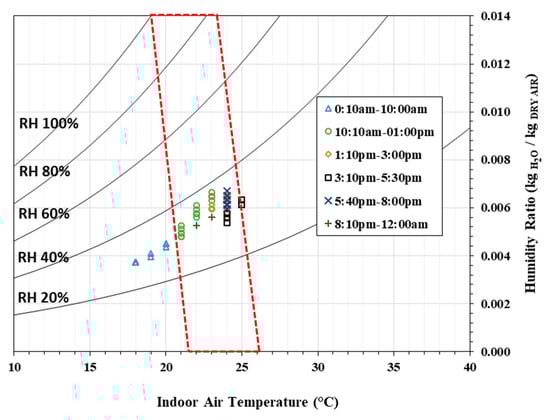
Figure 9.
Psychrometric chart and time analysis on the day when the ERV system was off (24 February 2020).
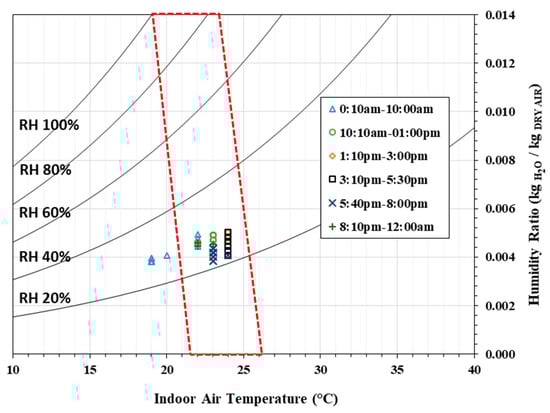
Figure 10.
Psychrometric chart and time analysis on the day when the ERV system was on (9 March 2020).
4. Discussion
We presented the detailed analysis results of ERV energy use, thermal comfort, and IAQ data using hourly and 10-min-interval data, focusing on finding more efficient operational strategies. Three different types of real-time monitoring data collected using the cloud system can provide valuable information to better optimize building environments. In this study, exploratory data analysis was conducted using the visual inspection of the graphical comfort zone along with comfort and discomfort frequency and time-series analyses. From the results of this study, we observed that the comfort frequencies were mostly found during the unoccupied hours (before 9:00 a.m. and after 6:00 p.m., i.e., heating energy saving opportunities) as well as during the occupied hours (i.e., thermal comfort improvement and heating energy saving opportunities). Thus, the radiant floor heating system could be turned off one or two hours earlier before the building is occupied, or night setback controls could be considered to save heating energy use during unoccupied hours. In addition, we observed that too hot discomfort frequencies occurred during the occupied hours. Thus, the radiant floor heating system could be turned on one or two hours earlier than usual in the morning and sometimes turned off to prevent overheating and reduce heating energy use during occupied hours. Finally, we recommend that the ERV system be controlled by considering not only IAQ (e.g., CO2 and PM2.5) but also thermal comfort and energy use to further improve indoor environmental conditions and save energy based on real-time multiple monitoring data.
However, this study has the following limitations. First, for the thermal comfort analysis, dry-bulb temperature was used rather than operative temperature since dry-bulb temperature could be used as an alternative to operative temperature or mean radiant temperature for typical buildings with radiant systems [23]. In addition, the measurements should be carried out at 0.1, 0.6, and 1.1 m for a seated person above the floor and 0.1, 1.1, 1.7 m for a standing person when room radiation is heterogeneous [20,22]. However, it was practically difficult to take into account such detailed measurements at different heights, so that we installed the multiple monitoring sensor at a representative point (i.e., about 1.6 m above the ground floor) near the room controller for the ERV system since the thermal environment around the sensor position was expected to be approximately stationary. Second, a smart meter for measuring the real-time energy use of the floor heating system was not installed; thus, the heating energy use patterns were not directly compared. Third, the multiple monitoring sensor was not calibrated. However, the accuracy of the multiple monitoring sensor was identified to be compliant with the requirements of ASHRAE 55 and ISO 7726 standards for thermal comfort analysis, based on the specifications provided by the manufacturer. Even though this study had these limitations, the methodology of this study provides insight for performance level strategies using real-time energy use, thermal comfort, and IAQ data in a real building. Additional data from other sensors, such as occupancy and window closed/open sensors, would help find more detailed energy saving, thermal comfort, and IAQ improvement opportunities. In addition, optimal strategies using natural (e.g., a bypass mode of the ERV system) and mechanical ventilation schedules [27] can be considered for energy saving, thermal comfort, and IAQ.
5. Conclusions
This paper presented new approaches (i.e., the graphical comfort zone method along with comfort frequency and time-series analysis) and analyzed thermal comfort and IAQ using real-time multiple environmental data collected from a cloud monitoring system for a childcare center. Thermal comfort frequency and time-series analyses were conducted in detail to further observe real-time thermal comfort and IAQ conditions with and without ERV operation, and to identify energy savings opportunities during the occupied and unoccupied hours. The results show that the highest CO2 and PM10 concentrations were reduced by 51.4% and 29.5%, respectively, during the occupied hours when the ERV system was operating. However, it was also identified that comfort frequencies occurred during unoccupied hours, and too hot discomfort frequencies occurred during occupied hours. Consequently, it is recommended that the ERV system be controlled by considering not only IAQ (e.g., CO2 and PM2.5) but also thermal comfort and energy use to further improve indoor environmental conditions and save energy based on real-time multiple monitoring data.
The methodology in this study will be useful for seeking real-time optimal control strategies to improve thermal comfort and IAQ conditions while reducing energy use from heating and cooling, ventilation, and air conditioning systems for the other types of buildings. In addition, it can also be applied to machine learning algorithms, which is our upcoming study. Ultimately, fault detection and diagnostics (FDD) and retro-commissioning processes will be improved based on this study.
Author Contributions
Conceptualization, methodology, and data analysis, S.O.; conceptualization, methodology, and supervision, S.S. All authors have read and agreed to the published version of the manuscript.
Funding
This research was supported by the National Research Council of Science & Technology (NST) funded by the Korean government (MSIP) (No. QLT-CRC-18-02-KICT).
Conflicts of Interest
The authors declare no conflict of interest.
References
- Li, J. Resource optimization scheduling and allocation for hierarchical distributed cloud service system in smart city. Future Gener. Comput. Syst. 2020, 107, 247–256. [Google Scholar] [CrossRef]
- Farahani, B.; Firouzi, F.; Chang, V.; Badaroglu, M. Towards fog-driven IoT eHealth: Promises and challenges of IoT in medicine and healthcare. Future Gener. Comput. Syst. 2018, 78, 659–676. [Google Scholar] [CrossRef]
- Park, J.Y.; Nagy, Z. Comprehensive analysis of the relationship between thermal comfort and building control research—A data-driven literature review. Renew. Sustain. Energy Rev. 2017, 1–16. [Google Scholar] [CrossRef]
- Cetin, K.S.; O’Neill, Z. Smart Meters and Smart Devices in Buildings: A Review of Recent Progress and Influence on Electricity Use and Peak Demand. Curr. Sustain. Energy Rep. 2017, 4, 1–7. [Google Scholar] [CrossRef]
- Hwang, S.H.; Seo, S.C.; Yoo, Y.; Kim, K.Y.; Choung, J.T.; Park, W.M. Indoor air quality of daycare centers in Seoul, Korea. Build. Environ. 2017, 124, 186–193. [Google Scholar] [CrossRef]
- Barbosa, F.C.; de Freitas, V.P.; Almeida, M. School building experimental characterization in Mediterranean climate regarding comfort, indoor air quality and energy consumption. Energy Build. 2020, 212, 109782. [Google Scholar] [CrossRef]
- Che, W.W.; Tso, C.Y.; Sun, L.; Ip, D.Y.K.; Lee, H.; Chao, C.Y.H.; Lau, A.K.H. Energy consumption, indoor thermal comfort and air quality in a commercial office with retrofitted heat, ventilation and air conditioning (HVAC) system. Energy Build. 2019, 201, 202–215. [Google Scholar] [CrossRef]
- Yang, S.; Pernot, J.G.; Jörin, C.H.; Niculita-Hirzel, H.; Perret, V.; Licina, D. Energy, indoor air quality, occupant behavior, self-reported symptoms and satisfaction in energy-efficient dwellings in Switzerland. Build. Environ. 2020, 171. [Google Scholar] [CrossRef]
- Guyot, G.; Sherman, M.H.; Walker, I.S. Smart ventilation energy and indoor air quality performance in residential buildings: A review. Energy Build. 2018, 165, 416–430. [Google Scholar] [CrossRef]
- Pantazaras, A.; Santamouris, M.; Lee, S.E.; Assimakopoulos, M.N. A decision tool to balance indoor air quality and energy consumption: A case study. Energy Build. 2018, 165, 246–258. [Google Scholar] [CrossRef]
- Cheng, Y.; Zhang, S.; Huan, C.; Oladokun, M.O.; Lin, Z. Optimization on fresh outdoor air ratio of air conditioning system with stratum ventilation for both targeted indoor air quality and maximal energy saving. Build. Environ. 2019, 147, 11–22. [Google Scholar] [CrossRef]
- Rasouli, M.; Simonson, C.J.; Besant, R.W. Applicability and optimum control strategy of energy recovery ventilators in different climatic conditions. Energy Build. 2010, 42, 1376–1385. [Google Scholar] [CrossRef]
- Fan, Y.; Kameishi, K.; Onishi, S.; Ito, K. Field-based study on the energy-saving effects of CO2 demand controlled ventilation in an office with application of energy recovery ventilators. Energy Build. 2014, 68, 412–422. [Google Scholar] [CrossRef]
- Guillén-Lambea, S.; Rodríguez-Soria, B.; Marín, J.M. Evaluation of the potential energy recovery for ventilation air in dwellings in the South of Europe. Energy Build. 2016, 128, 384–393. [Google Scholar] [CrossRef]
- Branco, P.T.B.S.; Alvim-Ferraz, M.C.M.; Martins, F.G.; Sousa, S.I.V. Children’s exposure to indoor air in urban nurseries-part I: CO2 and comfort assessment. Environ. Res. 2015, 140, 1–9. [Google Scholar] [CrossRef]
- Branco, P.T.B.S.; Alvim-Ferraz, M.C.M.; Martins, F.G.; Sousa, S.I.V. Indoor air quality in urban nurseries at Porto city: Particulate matter assessment. Atmos. Environ. 2014, 84, 133–143. [Google Scholar] [CrossRef]
- Nam, I.; Yang, J.; Lee, D.; Park, E.; Sohn, J.R. A study on the thermal comfort and clothing insulation characteristics of preschool children in Korea. Build. Environ. 2015, 92, 724–733. [Google Scholar] [CrossRef]
- Ribé, O.; Ruiz, R.; Quera, M.; Cadafalch, J. Analysis of the sensible and total ventilation energy recovery potential in different climate conditions. Application to the Spanish case. Appl. Therm. Eng. 2019, 149, 854–861. [Google Scholar] [CrossRef]
- ASHRAE. ASHRAE Standard 55-2017: Thermal Environmental Conditions for Human Occupancy; ASHRAE: Atlanta, GA, USA, 2017. [Google Scholar]
- ISO. Standard 7726-2001: Ergonomics of the Thermal Environment—Instruments for Measuring Physical Quantities; International Organization for Standardization: Geneva, Switzerland, 2001. [Google Scholar]
- Tartarini, F.; Schiavon, S.; Cheung, T.; Hoyt, T. CBE Thermal Comfort Tool: Online tool for thermal comfort calculations and visualizations. SoftwareX 2020, 12, 100563. [Google Scholar] [CrossRef]
- Alfano, F.R.; Olesen, B.W.; Palella, B.I. Thermal comfort: Design and assessment for energy saving. Energy Build. 2014, 81, 326–336. [Google Scholar] [CrossRef]
- Dawe, M.; Raftery, P.; Woolley, J.; Schiavon, S.; Bauman, F. Comparison of mean radiant and air temperatures in mechanically-conditioned commercial buildings from over 200,000 field and laboratory measurements. Energy Build. 2020, 206. [Google Scholar] [CrossRef]
- Oh, S.; Haberl, J.S.; Baltazar, J.-C. Analysis methods for characterizing energy saving opportunities from home automation devices using smart meter data. Energy Build. 2020, 216, 109955. [Google Scholar] [CrossRef]
- Korean Meteorological Administration Korean meteorological data portal. Available online: https://data.kma.go.kr (accessed on 27 January 2021).
- Ghasemi, M.; Toghraie, D.; Abdollahi, A. An experimental study on airborne particles dispersion in a residential room heated by radiator and floor heating systems. J. Build. Eng. 2020, 32, 101677. [Google Scholar] [CrossRef]
- Kim, C.H.; Kang, W.H.; Park, M.K.; Lee, K.H.; Kim, K.S. Energy saving optimal operation strategy for by-pass control by various types of energy recovery ventilator. Korean J. Air Cond. Refrig. Eng. 2020, 32, 309–322. [Google Scholar]


Publisher’s Note: MDPI stays neutral with regard to jurisdictional claims in published maps and institutional affiliations. |
© 2021 by the authors. Licensee MDPI, Basel, Switzerland. This article is an open access article distributed under the terms and conditions of the Creative Commons Attribution (CC BY) license (http://creativecommons.org/licenses/by/4.0/).